The Evolution of Optimal Foraging Strategies in Populations of Digital Organisms Jacob Charles Walker Michigan State University East Lansing, MI 48824, USA [email protected]ABSTRACT Foraging strategies in uncertain environments is the subject of a great deal of biological investigation, much of which is grounded in mathematical models. One theoretical prediction with wide empirical support is the ideal free distribution (IFD), where agents distribute themselves among patches of resources in proportion to their suitability. However, the IFD assumes that agents have perfect information of the environment. In nature, this assumption is often violated, yet the IFD is still observed. Insights into evolved mechanisms and behaviors that result in the IFD show how such efficient outcomes may emerge from little information. In this study, the artificial life platform Avida is used to observe populations of digital organisms as they evolved to optimize resource intake in an environment with unpredictable resource distributions. It is shown that the ideal free distribution can emerge from simple foraging strategies that require minimal information. It is demonstrated that this distribution is a result of choices made by the organisms, and not simply due to those in a more advantageous setting producing more offspring. Deviations from the IFD appear to be correlated with reduced information or foraging aggregation. Distributions with organisms of differing abilities are also investigated, demonstrating further correspondence with theoretical predictions. Categories and Subject Descriptors H.4 [Information Systems Applications]: Miscellaneous; F.1.1 [Computation by Abstract Devices]: Models of Computation—Self-modifying machines General Terms Experimentation, Theory Keywords Artificial life, digital evolution, ideal free distribution, uncertainty, unequal competitors, interference, aggregation 1. INTRODUCTION One problem that agents face—whether they are buyers in markets or organisms in nature—is decision making under uncertainty. Given options with unclear payoffs, agents must choose the one that is most likely to maximize their fitness or utility. Biologists and economists have used mathematical methods to model such behavior. One such example is Stephen Fretwell’s “Ideal Free Distribution.” Originally developed to explain the foraging behavior of birds, the IFD has been applied in multiple contexts in biology, psychology, and economics [4, 17, 18, 20]. The IFD models the distribution of a group of foragers among patches or habitats of food. Let s n,i be the expected success of the nth agent in patch i. Let N i be the number of agents in patch i. Then the suitability of patch i, S i , is described as follows [4]: = = i N 0 n i n, s 1 i i N S (1) This suitability decreases with the number of agents in the patch. The IFD model states that, in the long run, agents will distribute themselves such that S i is equal for all patches. Thus if patch A contains 80% of the total resources of the environment, and patch B contains 20% of the resources, then foragers will distribute themselves so that 80% of the foragers will be in patch A and 20% of the foragers will be in patch B. The IFD has been extensively explored through biological and psychological experiments. It has been found in the foraging behavior of guppies [1], ducks, [19], and dung beetles [18]. Likewise, this distribution has emerged in foraging experiments with humans [5, 20]. In socio-economic settings, the IFD has been witnessed in many human endeavors, including the study of human island colonization [11]. However, relatively little IFD- related work has been done in the field of artificial life. There have been some experiments [15, 21] that demonstrate Herrnstein's related probability matching rule for individual agents [7]. One other notable case is Griffith and Yaeger's work in the artificial life simulator Polyworld [6]. In this experiment, agents controlled by neural-networks were evolved in a simple, square environment. Food was probabilistically dispersed to two bands at each end of the square. The two bands had different food dispersion probabilities. Over time, the agents' distributions matched these probabilities. This paper explores the IFD behavior of strategies evolved in environments where the spatial resource distribution is variable. For this research, digital organisms in the Avida system were used. Avidian organisms are self-replicating computer programs in a Turing complete language. As such, they are not fundamentally limited in the behavioral algorithms they employ. It is shown that the IFD does emerge when these digital organisms Permission to make digital or hard copies of all or part of this work for personal or classroom use is granted without fee provided that copies are not made or distributed for profit or commercial advantage and that copies bear this notice and the full citation on the first page. To copy otherwise, or republish, to post on servers or to redistribute to lists, requires prior specific permission and/or a fee. GECCO’11, July 12–16, 2011, Dublin, Ireland. Copyright 2011 ACM 978-1-4503-0557-0/11/07...$10.00. 203
Transcript
The Evolution of Optimal Foraging Strategies in Populations of Digital Organisms
Foraging strategies in uncertain environments is the subject of a great deal of biological investigation, much of which is grounded in mathematical models. One theoretical prediction with wide empirical support is the ideal free distribution (IFD), where agents distribute themselves among patches of resources in proportion to their suitability. However, the IFD assumes that agents have
perfect information of the environment. In nature, this assumption is often violated, yet the IFD is still observed. Insights into evolved mechanisms and behaviors that result in the IFD show how such efficient outcomes may emerge from little information. In this study, the artificial life platform Avida is used to observe populations of digital organisms as they evolved to optimize resource intake in an environment with unpredictable resource distributions. It is shown that the ideal free distribution can emerge from simple foraging strategies that require minimal
information. It is demonstrated that this distribution is a result of choices made by the organisms, and not simply due to those in a more advantageous setting producing more offspring. Deviations from the IFD appear to be correlated with reduced information or foraging aggregation. Distributions with organisms of differing abilities are also investigated, demonstrating further correspondence with theoretical predictions.
Categories and Subject Descriptors
H.4 [Information Systems Applications]: Miscellaneous; F.1.1 [Computation by Abstract Devices]: Models of Computation—Self-modifying machines
1. INTRODUCTION One problem that agents face—whether they are buyers in markets or organisms in nature—is decision making under uncertainty. Given options with unclear payoffs, agents must choose the one that is most likely to maximize their fitness or utility. Biologists and economists have used mathematical methods to model such behavior. One such example is Stephen
Fretwell’s “Ideal Free Distribution.” Originally developed to explain the foraging behavior of birds, the IFD has been applied in multiple contexts in biology, psychology, and economics [4, 17, 18, 20]. The IFD models the distribution of a group of foragers among patches or habitats of food. Let sn,i be the expected success of the nth agent in patch i. Let Ni be the number of agents in patch i. Then the suitability of patch i, Si, is described as follows [4]:
=
=iN
0n in, s1
i
i
NS
(1)
This suitability decreases with the number of agents in the patch. The IFD model states that, in the long run, agents will distribute themselves such that Si is equal for all patches. Thus if patch A contains 80% of the total resources of the environment, and patch B contains 20% of the resources, then foragers will distribute themselves so that 80% of the foragers will be in patch A and 20% of the foragers will be in patch B. The IFD has been extensively explored through biological and
psychological experiments. It has been found in the foraging behavior of guppies [1], ducks, [19], and dung beetles [18]. Likewise, this distribution has emerged in foraging experiments with humans [5, 20]. In socio-economic settings, the IFD has been witnessed in many human endeavors, including the study of human island colonization [11]. However, relatively little IFD-related work has been done in the field of artificial life. There have been some experiments [15, 21] that demonstrate
Herrnstein's related probability matching rule for individual agents [7]. One other notable case is Griffith and Yaeger's work in the artificial life simulator Polyworld [6]. In this experiment, agents controlled by neural-networks were evolved in a simple, square environment. Food was probabilistically dispersed to two bands at each end of the square. The two bands had different food dispersion probabilities. Over time, the agents' distributions matched these probabilities.
This paper explores the IFD behavior of strategies evolved in environments where the spatial resource distribution is variable. For this research, digital organisms in the Avida system were used. Avidian organisms are self-replicating computer programs in a Turing complete language. As such, they are not fundamentally limited in the behavioral algorithms they employ. It is shown that the IFD does emerge when these digital organisms
Permission to make digital or hard copies of all or part of this work for personal or classroom use is granted without fee provided that copies are not made or distributed for profit or commercial advantage and that copies bear this notice and the full citation on the first page. To copy otherwise, or republish, to post on servers or to redistribute to lists, requires prior specific permission and/or a fee. GECCO’11, July 12–16, 2011, Dublin, Ireland. Copyright 2011 ACM 978-1-4503-0557-0/11/07...$10.00.
203
evolve in environments that select only on the basis of food intake. Better approximations of the IFD seem to be related to long-range information and superior ability to manage aggregate interference. When agents have unequal competitive abilities, dominant organisms are overrepresented in the better patch, as
Houston and McNamara's extension of the IFD model [8] predicts. Griffith and Yaeger [6] evolved agents in environments where the spatial distribution of food was relatively simple and fixed; this paper shows that the IFD can also arise from general foraging rules evolved in environments where the spatial distribution changes. These rules are quite simple; there is no need for reinforcement learning or for a large amount of information. In the context of the IFD, Avida’s program-based genomes also
confer some advantages over neural-network approaches as they are more conducive to “reverse-engineering” of the computational strategies employed. In addition, Avida allows the precise control of the inflow rates of resources and consumption rates of agents, allowing a quantitative study of the effects of these rates on deviations from the IFD.
2. METHODS Avida [16] is an artificial life platform that has been used extensively to study evolutionary dynamics, including topics such
as the origin of complex traits [13], navigation [2], and communication [12]. In Avida, digital organisms consist of a genome and a virtual processor that executes the genome. The virtual processor consists of a memory space, three registers and two stacks, four heads, and an input-output buffer. The genome is a list of Turing-complete instructions that are loaded into the memory of the virtual processor and executed to create the behavior of the organism. The set of possible instructions include
basic functionality for arithmetic, conditionals, looping, memory manipulation, and biological functions. Instructions for locomotion and sensing local resource concentrations were also included. In most cases, the genome consists of a main loop where the organism copies itself to an offspring, instruction-by-instruction. There is no explicit fitness function in Avida; instead, organisms are rewarded merit based on particular tasks they perform. Organisms with more merit will probabilistically execute more instructions per unit of time. The basic unit of time in Avida
is called an update. Diversity occurs when mutations and errors appear in the reproduction of offspring. Organisms die when they are replaced by another organism replicating over them or after a specified number of instructions have been executed, set here as 20 times the total length of the genome. The environment in this experiment consisted of a bounded, square grid of cells. At most one organism can occupy a cell at a time, and each cell contains a level of resource. This resource increases by some amount each
update, to a maximum, unless an organism lands in that cell and consumes some of the resource. There are eight possible directions for an organism to face or move. The locomotion instructions that were added to the default Avida instruction set included tumble, which turned the organism in a random direction, select-rotate, which allowed the organism to
select either to turn right or left, and move, which moved the organism one cell in the direction it faced. Sense instructions included sense-diff-facing, which sensed the 1000-fold difference between the facing cell and the current cell, sensef,
which sensed the log2 of resource in the faced cell, and sense, which sensed the log2 of resource in the occupied cell. Some long-range sense functions were also added. sense-medium and
sense-large sensed the log2 of a sum of resources. sense-medium summed up to 25 cells in front of the organism, and
sense-large summed all cells in front of the organism to the boundary of the grid. sense-diff-medium and sense-diff-large sensed the difference between the sum of cell resources faced by the organism and directly behind the organism with ranges corresponding to the instruction above.
2.1 The Evolutionary Environment A modified version of Avida 2.11 was used. The seed organism was the default organism of Avida, and, following other experiments [2], there was an organism cap of 200. To promote adaptive evolution of complex behaviors, the evolutionary
environment consisted of two stages. The first, “easy” stage resembled the configuration by Elsberry [2] where organisms evolved to forage with a gradient of resources in a consistent, fixed location. No resource consumption occurred at this stage, leaving resource concentrations static. The grid was of size 150x150. The resource was distributed as a cone of height 100 with a cubic slope, centered at cell 50, 50 as depicted in Figure 1a. The cone's radius was 30 cells. To further encourage adaptive
behavior, all offspring were placed in low resource areas. Organism merit was proportional to 2bonus, where bonus was 5% of the total resource in a cell. The reward depended on no specific task other than simply consuming the resource, but the organism could be rewarded only up to 1000 times. All other parameters were default parameters. Eight runs were conducted for 250,000 updates. The final dominant organism from each run was taken to seed the stage two runs. 30 of each dominant organism from each
run seeded the second stage. The resource distribution in stage two was variable; cones with a cubic slope with varying radius, height, and location were redistributed every 5000 updates. The number of cones within the environment also varied. Cones may overlap, creating varied landscapes. Out of convenience, Morrison and DeJong's [14] DF1 function was used to generate the cones’ location, radius, height, and number. The cones were stationary however. Parameters for the DF1 function included 35 peaks, a
minimum height of 21, a maximum height of 100 and a slope that ranged from 1.5 to 5. Additionally, resources were consumable; organisms consumed 5% of the current cell resource in a single move, making near-total depletion a possibility. The resources flowed in 5% of their maximum cellular limit each update. In order to discourage random behavior, a minimum merit of 10000 was required to reproduce, and the merit was now 2bonus*.5. The population cap was increased to 300. 8 runs were executed for 500,000 updates. All other parameters remained identical to stage
1.
2.2 The Test Environment To test whether organisms were engaging in behaviors that led to the IFD, it was necessary to create an isolated test environment
where certain critical assumptions about the organisms could be enforced. First, all agents must be equally competitive. As such, the same genotype was used for all organisms in the test environment and each organism had identical merit. To ensure that the distribution seen was due to behavioral choices and not to population growth dynamics, no birth or death occurred in the test environment. Although cell resources could still vary, the consumption rate was set to a constant number for all cells and all
organisms. The grid was 100x100, and two cones of cubic slope were placed at the bottom of the grid (Figure 1c). These gradients
204
had default radius 20 and were placed at 20, 80 and 80, 80 on the grid respectively. The sum of the heights of the cones (and thus the input rate) was 100. 200 organisms were initially placed at the top of the grid. All other parameters were taken from the evolution environment.
a.
b.
c.
Figure 1. Example environmental resource distributions for
(a) Stage 1, (b) Stage 2, and (c) Test environments.
3. RESULTS
3.1 Strategies Out of eight runs of the first stage, five yielded final dominant organisms that were able to locate resources in a “hill climber”
fashion. The three others yielded a “cockroach” strategy. These organisms move until they hit the grid boundary, whereupon their facing is randomly redirected. Cockroaches bounce off these boundaries and move in the grid in a manner similar to a ball on a billiards table; by constant motion, these organisms locate and consume resources on average. This strategy did not exhibit the Ideal Free Distribution. The five organisms that exhibited “hill climber” behavior may be subdivided into two main strategies. Strategy A, employed by
four of the organisms, uses only local information in foraging. The main loop of the genome may be described as follows: 1. Sense difference between current cell and facing cell
2. If Negative, Change Direction
3. Move
4. Copy Instructions for Offspring
While similar in structure to strategy A, strategy B (employed by one organism) uses both local and remote information in foraging:
1. Sense difference between current cell and facing cell
2. If Negative, Change Direction
3. Sense difference between all cells in front and all cells behind organism (25 cells after stage 2)
4. If Negative, Change Direction
5. Copy Instructions for Offspring
Interestingly, the single organism using strategy B did not seem to provide an advantage in stage two. In fact, all of the final
dominant organisms in the stage two runs descended from the same, specific strategy A organism from stage one. Upon inspection of this organism, it was determined that it had the most efficient main loop of all strategy A organisms; it also had no extraneous turn instructions; it turned only when the resource difference was negative. Of the eight organisms from stage two, two were random walkers. Distinguished from cockroaches, these organisms both moved and turned indiscriminately. These also
obviously did not distribute themselves ideally. Of the six others, one used strategy A, two used a modified form of strategy B, and three used a new strategy C. Strategy C is identical to strategy A except that strategy C takes into account only medium-range information; no decisions are made based on either long-range or local information:
1. Sense difference between 25 cells in front and behind organism
2. If Negative, Change Direction
3. Move
4. Copy Instructions for Children
No dominant organism after stage two used long-range information at all.
3.2 The Ideal Free Distribution and Tests Representative organisms were chosen employing strategies A, B, and C from stage two for testing. The main execution loops for each of these organisms were roughly equal in size. After adjusting the cell resource consumption rate and the instruction rate in the test environment, each strategy exhibited the ideal free distribution, with strategies B and C showing less variability than strategy A. When cone areas were different but total resource
inflow was still in a 2:8 ratio, some deviation from the IFD occurred. When the larger inflow was in the small cone, some undermatching occurred. Conversely, when the larger inflow was in the larger cone, some overmatching occurred. However, both the level of undermatching and overmatching were only around 5%. One advantage of the experimental configuration is direct control over the cellular resource intake. The cellular intake rate is
205
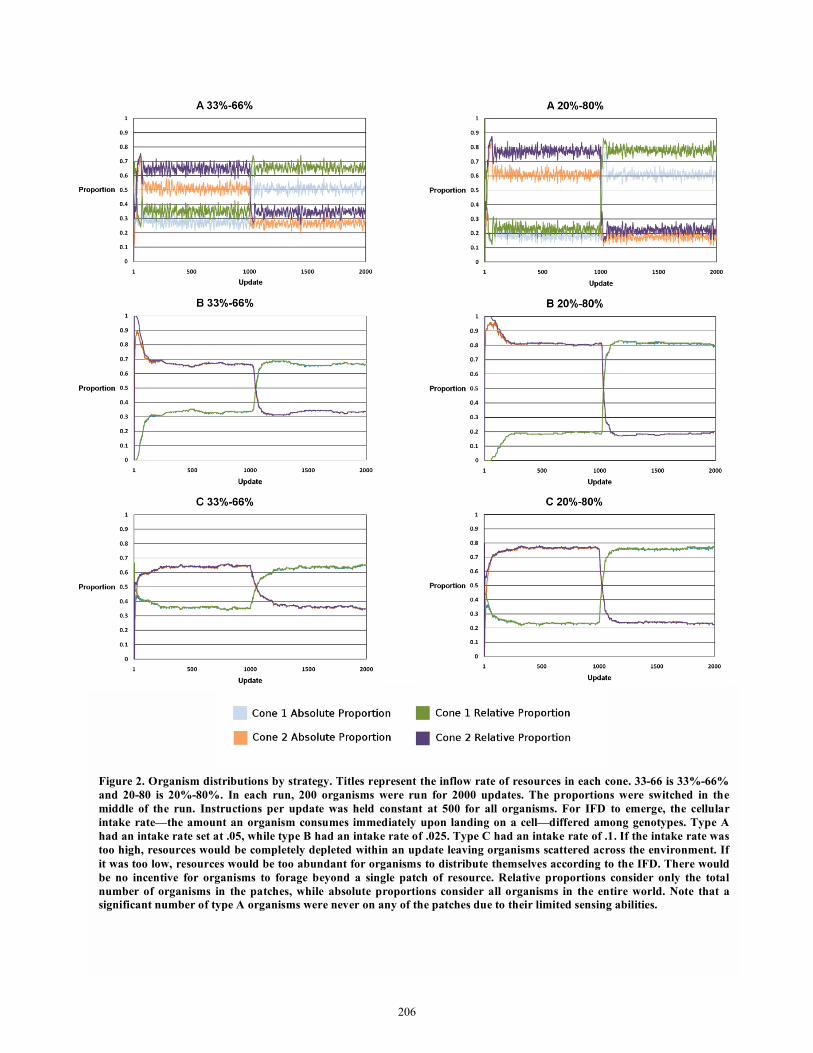
Figure 2. Organism distributions by strategy. Titles represent the inflow rate of resources in each cone. 33-66 is 33%-66%
and 20-80 is 20%-80%. In each run, 200 organisms were run for 2000 updates. The proportions were switched in the
middle of the run. Instructions per update was held constant at 500 for all organisms. For IFD to emerge, the cellular
intake rate—the amount an organism consumes immediately upon landing on a cell—differed among genotypes. Type A
had an intake rate set at .05, while type B had an intake rate of .025. Type C had an intake rate of .1. If the intake rate was
too high, resources would be completely depleted within an update leaving organisms scattered across the environment. If
it was too low, resources would be too abundant for organisms to distribute themselves according to the IFD. There would
be no incentive for organisms to forage beyond a single patch of resource. Relative proportions consider only the total
number of organisms in the patches, while absolute proportions consider all organisms in the entire world. Note that a
significant number of type A organisms were never on any of the patches due to their limited sensing abilities.
206
Figure 3. Organism distributions with a 10%-90% resource
distribution.
simply the amount of resource consumed in a cell when an organism lands on it. The organism can land on multiple cells, possibly the same cells, in a single update. Through adjustment of the cellular resource intake level, the tests in figure 2 were able to approximate a continuous intake situation where there was little to no depletion of resources; thus the continuous model of IFD may hold [23]. Note that the cellular in take rate in Avida is not the
A B C
Figure 4. Sample main loops from an organism of Type A, B,
and C.
same as the intake rate considered in the IFD. Although similar, the intake rate used in the IFD model would be related to the organism's total intake rate in an update. However, by adjusting the cellular intake rate, the probability of total cellular resource depletion in an update can be increased. This would then lead to aggregate interference between foraging organisms, and possible
undermatching. Note that interference in this case is due to a consequence of aggregation and not to direct interactions between agents. Some ecologists may call this “pseudo-interference” [3]. Let Wi, Wj represent patch inflow rates, and let ni and nj be the number of agents in those corresponding patches. The modified IFD model [23] with interference is:
=`
log
log
j
ij
i
n
n
m
W
W
(2)
with m the measure of resource wastefulness, and thus foraging efficiency, from increased interference. By adjusting the cellular intake rate, m, the resource wastefulness may be estimated and thus the search efficiency. The equation reduces to the original IFD model with m = 1. Values of m that deviate from 1 indicate inefficiency. For strategies A, B, and C, a base intake level of I
was chosen where the strategies closely followed the continuous model of IFD. The base parameters were then multiplied by some constant and the distribution was measured in a 33-66, 20-80, and 10-90 cone height environment. The average proportions from each three tests generated three estimates of m for the given level of intake. Table 1 shows the average of those three estimates.
207
Note that m grows quite quickly for strategy A as cellular intake increases. B’s m grows somewhat more slowly, and C’s m grows extremely slowly. It appears that C can best cope with increased cellular depletion of resources.
Table 1. Estimates of m, the resource wastefulness, for each
strategy.
3.3 Unequal Competition The IFD assumes equal competition. All agents are able to forage equally. There have been many models that discuss
situations when these assumptions are violated. One model of particular interest is Houston and McNamara's [8] extension of IFD based on statistical mechanics, which predicts that agents with higher ability will most likely be represented more in the better patch. According to the model, undermatching is also to occur. It is clear that each strategy has disadvantages and advantages. Strategy C neglects local information but pays attention to medium-range information. Strategy A only considers
local information, while strategy B considers both. An experiment was conducted to observe the effects of these differing abilities. 200 organisms, 100 of both types, were placed in a 20%-80% distribution of resource. The cellular intake rate was the same for both organisms; it was carefully chosen in between the two organism’s base rates as to assure both genomes were able to match the IFD in isolation. Runs lasted for 20000 updates, and resources were switched at update 10000. Interestingly, there is
only slight undermatching, but it appears that B is able to “dominate” A, and C “dominates” both B and A. In each test, one species was overrepresented in the superior patch. The inferior organism was crowded out of both patches. This is especially apparent when A was contested with C; half of Type A organisms were not on any of the patches. It appears that medium-range information allows more efficient use of resources compared to local information.
4. DISCUSSION These simple evolved organisms have revealed a great deal of information about foraging, the IFD, and even the early evolution of intelligent behaviors. First it appears that, at least in random foraging environments, information is not useful if it is too global.
The organisms could have evolved to sense information that spanned the entire world. This was not the case in the long run. It did seem that a moderate amount of information was useful, however. More type C organisms were represented at stage 2 compared to stage 1, although more tests are needed to make statistically rigorous conclusions. The experiment included only three fairly vague sources of information about the environment. Future work in this area could include experiments where
organisms have many different ways to sense the environment apart from simple resource levels.
Figure 5. A vs. B. B seems to be only slightly overrepresented
in the better patch. A is lightly crowded out, type A organisms
undermatch, and type B organisms overmatch marginally.
208
Figure 6. A vs. C. C is well overrepresented in the better
patch. About 45% of type A organisms are off both patches
compared to around 25% in equal competition. It appears
that overmatching and undermatching for both organisms is
almost negligible, however.
Figure 7. B vs. C. C is overrepresented in the better patch.
Roughly 30% of type B organisms are crowded out of both
patches. Type C organisms overmatch to the cones, while type
B organisms undermatch.
209
Another interesting find is the simplicity of the foraging behaviors encountered. All three strategies are essentially variations on hill-climbing, yet they are able to closely match the IFD. In violation of the IFD assumptions, available information was far from perfect. The only way to assess patch suitability was
either through the level of two cells or through the sum of fifty cells. Considering the fact that the radius of our resource patches were 20 cells, these organisms had to make a decision in a given instant based on only 4% of the patch cells. These organisms could approximate global information based on local proxies. As Anil Seth [22] notes, intelligence, choice, and behavior can often be simply a product of the interaction between the agent and the environment.
From the limited data, it appears that the foraging efficiency of an organism is related to its ability to handle interference. Among the hill-climbers in stage two, resource wastefulness, and especially the growth of resource wastefulness, seemed to be inversely related to range of information use. Further investigation may be needed, including theoretical, mathematical models to explain this behavior. The results also seemed to at least partially agree with Houston and McNamara's [8] model of unequal
competitors. Better organisms were overrepresented in better patches. However, it is hard to determine if there was significant undermatching as predicted by the model. There is definite room for future work in this area; there are multiple models [8, 9, 10] that attempt to explain the distribution with unequal competitors. The observed undermatching and overmatching in patches with unequal area is similar to the results of Polyworld and EPICURE, although their deviations were much more pronounced.
5. ACKNOWLEDGMENTS The author would like to thank William Punch, Charles Ofria, Robert Pennock, Aaron Wagner, Frank Bartlett, and Fred Dyer for their advice, critiques, and suggestions. Support was provided by
the Michigan State University Department of Zoology and the BEACON Center for the Study of Evolution in Action.
6. REFERENCES [1] MV. Abrahams. Foraging guppies and the ideal free
distribution: the influence of information on patch choice. Ethology, 82(2):116-126, 1989.
[2] W. Elsberry, L. Grabowski , C Ofria, and RT Pennock. Cockroaches, drunkards, and climbers: evolving simple movement strategies using digital organisms. In Proceedings
of the IEEE Symposium on Artificial Life, 2009. [3] CA. Free, JR. Beddington, and JH. Lawton. On the
Inadequacy of Simple Models of Mutual Interference for
Parasitism and Predation. Journal of Animal Ecology, 46(2):543-554, 1977.
[4] SD. Fretwell. Populations in seasonal environments. Princeton University Press, Princeton NJ, 1972.
[5] RL. Goldstone, BC. Ashpole, and ME. Roberts. Knowledge of resources and competitors in human foraging. Psychonomic Bulletin & Review, 12:81-87, 2005.
[6] V. Griffith and LS. Yaeger, Ideal Free Distribution in Agents
with Evolved Neural Architectures. Artificial Life X:
Proceedings of the Tenth International Conference on the
Simulation and Synthesis of Living Systems. 372-378. 2006. [7] RJ. Herrnstein. Relative and absolute strength of responses as
a function of frequency of reinforcement. Journal of the
Experimental Analysis of Behaviour, 4:267-272. 1961.
[8] AI. Houston and JM. McNamara. The ideal free distribution when competitive abilities differ: an approach based on statistical mechanics. Animal Behavior, 36(1):166-174. 1988.
[9] AI. Houston and A Lang. The ideal free distribution with unequal competitors: the effects of modeling methods. Animal Behavior, 56(1):243-251. 1998.
[10] S. Humphries, GD. Ruxtron, and J. Van Der Meer. Unequal
competitor ideal free distributions: predictions for differential effects of interference between habitats. Journal of Animal
Ecology, 70(6):1062-1069. 2001. [11] D. Kennett, and B. Winterhalder, B. Behavioral ecology and
the transition to agriculture. University of California Press. Berkeley, CA, 2006.
[12] DB. Knoester, PK. Mckinley, B. Beckman and C. Ofria. Directed evolution of communication and cooperation in
digital organisms. Proceedings of the 2007 European
Conference on Artificial Life, 4648:384-394. 2007. [13] RE. Lenski, C. Ofria, RT. Pennock, and C. Adami. The
evolutionary origin of complex features. Nature, 423:139-144. 2003.
[14] RW. Morrison and KA. DeJong. A test problem generator for non-stationary environments. Proceedings of the 1999
Congress on Evolutionary Computation 2047-2053. 1999.
[15] Y. Niv, D. Joel, I. Meilijson, and E. Ruppin. Evolution of reinforcement learning in uncertain environments: emergence of risk aversion and probability matching. Advances in Artificial Life - Proceedings of the Sixth
European Conference, 252-261. 2001. [16] C. Ofria and C. O. Wilke. Avida: A software platform
for research in computational evolutionary biology. Journal of Artificial Life, 10:191–229, 2004.
[17] GA. Parker. The reproductive behavior and the nature of
sexual selection in Scatophaga stercoraria L. IX. Spatial distribution of fertilisation rates and evolution of male search strategy within the reproductive area. Evolution, 28(1):93-108. 1974.
[18] GA. Parker. Evolution of competitive mate searching. Annual Review of Entomology, 23:173-196. 1978.
[19] GM. Recer, WU. Blanckenhorn, JA. Newman, EM. Tuttle, ML. Withiam, and T. Caraco. Temporal resource variability
and the habitat-matching rule. Evolutionary Ecology, 1(4):363-378. 1987.
[20] ME. Roberts and RL. Goldstone. EPICURE: Spatial and Knowledge limitations in group foraging. Adaptive Behavior, 14:291-313. 2006.
[21] AK. Seth. Evolving behavioural choice: an exploration of Herrnstein's matching law. Proceedings of the Fifth
European Conference on Artificial Life, 225-236. 1999.
[22] AK. Seth. The ecology of action selection: insights from artificial life. Philosophical Transactions of the Royal
Society, 362(1485):1545-1558. 2007. [23] T. Tregenza. Building on the ideal free distribution.
Advances in Ecological Research, 26:253-302. 1995.