Presenters: QR Code Date: The Evolution of Performance Measurement • Margaret Kelly, State Budget Director, Minnesota Management & Budget • Patrice Impey, General Manager Financial Services, CFO, City of Vancouver • Melinda Munro, Owner and Lead Consultant, Munro Strategic Perspective • Jay Stroebel, Deputy City Coordinator, City of Minneapolis, MN • Harry P. Hatry, Director, Public Management Program, Urban Institute, Washington, DC May 19, 2014
Transcript
Presenters:
QR Code
Date:
The Evolution of Performance Measurement
• Margaret Kelly, State Budget Director, Minnesota Management & Budget• Patrice Impey, General Manager Financial Services, CFO, City of Vancouver• Melinda Munro, Owner and Lead Consultant, Munro Strategic Perspective• Jay Stroebel, Deputy City Coordinator, City of Minneapolis, MN• Harry P. Hatry, Director, Public Management Program, Urban Institute,
Washington, DC
May 19, 2014
Logistics Scan the QR code to download the presentation This session is 1 hour, 40 minutes long. There will be time for Q/A at the end. Please use the microphones for Q/A
This session is worth 2 CPE credit Self‐scan for credits or see a GFOA staff person
Please complete the session evaluation
Our Speakerso Patrice Impey
• General Manager Financial Services, CFO, City of Vancouver
o Melinda Munro• Owner and Lead Consultant, Munro Strategic Perspective and formerly with the City of Vancouver
o Jay Stroebel• Deputy City Coordinator, City of Minneapolis, MN
o Harry P. Hatry• Director, Public Management Program, Urban Institute, Washington, DC
Session Roadmapo Patrice Impey and Melinda Munro
• Creating a performance measurement framework from scratch – Vancouver’s experience in getting started while learning from best practices
o Jay Stroebel• Evolution towards more intensive use of data for decision‐making.
o Harry Hatry• Recommendations for strengthening performance measurement and performance management
THE EVOLUTION OF PERFORMANCE MEASUREMENTTHE STORY OF VANCOUVER
Patrice Impey, City of VancouverMelinda Munro, Munro Strategic Perspectives
Creating a Performance Measurement Framework (from scratch!) – the Vancouver Experience
Shift the CultureShift the Culture
Become a leading public sector finance departmentBring performance measurement discipline to the City of Vancouver
Build the FrameworkBuild the Framework
Maturity level, current and future desiredCreate tools for data managementEmbed into ongoing management and planning processes
Engineering Water QuantityWater Consumed Per Capita (litres) ‐ Total
583 535 508 486 491 476 471 453 391 Down Medium Medium Quarterly
Engineering Water Quantity# of Water Connections
ReplacedNDA 1912 1930 1673 1350 1,558 1400 Neutral High High Monthly
Engineering Water Quantity Km of Water Pipe Replaced NDA 17.3 12.45 5.3 8.1 8.867 11 Up High High Yearly
2006 2008 2009 2010 2011 2012 2013F 2013
1224.2 1025.8 1090.6 1207 1068.5 1211.3 N/A 943.5
Annual Precipitation (Vancouver.weatherstats.ca)
Timeline
20122012•Developed metrics for major public facing services•Included Service Plans and metrics for public facing services in 2013 Budget Report•Built basic framework for ongoing data collection
20132013•Started annual service reviews as input to 2014 budget development•Established 1 year and 3 year outlooks for service metrics•Included Service Plans and metrics in 2014 Budget Report for all services (internal and public)
20142014•First year end variance review on service metrics with Corporate Management Team•Review potential for Business Intelligence tools to manage and improve framework
FutureFuture•Consider options for benchmarking specific services•Add Business Intelligence and analytics capability
Take Home Messageso What to do
• Focus on the outcomes – performance measurement is most valuable when it improves outcomes
• Build the framework to be robust and reliable• Embed it in regular planning, review and budget processes• Use the data to tell the story
• Put it in context• Connect it to public policy
o What not to do• Don’t ignore the impact on operational staff time and effort – it can be substantial
• Don’t forget that it is a significant change effort
EVOLUTION OF PERFORMANCE MEASUREMENTMINNEAPOLIS’S EXPERIENCEJay StroebelCity of Minneapolis
“Above all… measurement is meant to enable us to take purposeful action based on knowledge
rather than opinion or guesswork.”
-Peter F. Drucker in the Practice of Management
What do people want from data?
‐Progress on organizational priorities‐Accountability of organiz. leadership‐Informed policy and budget decisions‐Sound bites
‐Progress on departmental priorities‐Accountability of dept. leadership‐Informed strategy and resource decisions
‐Progress on community priorities‐Accountability of elected officials‐Value for tax dollar
‐Progress on work unit priorities‐Accountability of staff‐Informed strategy and resource decisions
Our approach – results management
Turn data into knowledge and knowledge into action Discuss the data Aligned direction Coordinated management systems Continuous improvement Results driven
Purpose
Audience
Accountability –Monitor progress onstrategic & business
plans
Electeds, residents
Resource allocation
($ and people)
Dept. leaders, electeds, staff
Community transparency
Residents
Strategy & policy development
Dept. leaders, electeds, staff
Tool Community
indicators X (residents) X
Businessplanning
X X
Results Minneapolis X (electeds) X X X
Budget process X (annual,long‐term) X
IntelligentOperations Platform (IOP)
X (daily) X
What tools can help us out?
Tools to highlight Results Minneapolis Progress conferences Results management in action Value of drilling in
Budget process Intelligent Operations Platform (IOP)
Results Minneapolis progress conferences
Regular (weekly) discussions on data with departments and multi‐department topics, not to punish, but to monitor and make informed decisions
Informs and engages Mayor, City Council, department heads & other key leaders
Juveniles Involved in Violent Crime (arrestees and suspects)
Arrestee Suspect*
*Information from Computer Assisted Police Reporting System (CAPRS) queries where the beginning Suspect Age is listed between 1 and 17. (Example: The victim identified the suspect as being 16‐25 years of age, CAPRS shows the event age as 16, and this would be counted as a juvenile suspect.) Source: Minneapolis Police Department
6.8
7.9
7.1 6.8
5.9
2005‐2007 2006‐2008 2007‐2009 2008‐2010 2009‐2011
Minneapolis Infant Mortality Rates (Number of Infant Deaths per 1,000 Live Births)
Value of drilling in…
6.8
7.9
3.9
11.1
4.3 5.
3
7.9
9.1
3.0
13.3
6.4
5.3
7.1 8.
0
2.3
12.9
5.6
4.5
6.8 7.1
2.3
10.9
8.5
3.6
5.9
1.9
1.5
10.1
7.1
3.5
0
2
4
6
8
10
12
14
Minneapolis American Indian Asian/Pacific Islander Black Hispanic White
Infant Mortality Rates by Race/Ethnicity(Number of Infant Deaths per 1,000 Live Births)
Infant Mortality Rates by Mother's Race/Ethnicity and Country of Birth (Number of Infant Deaths per 1,000 Live Births)
2002‐2004 2005‐2007 2008‐2010
Source: Minnesota Department of Health
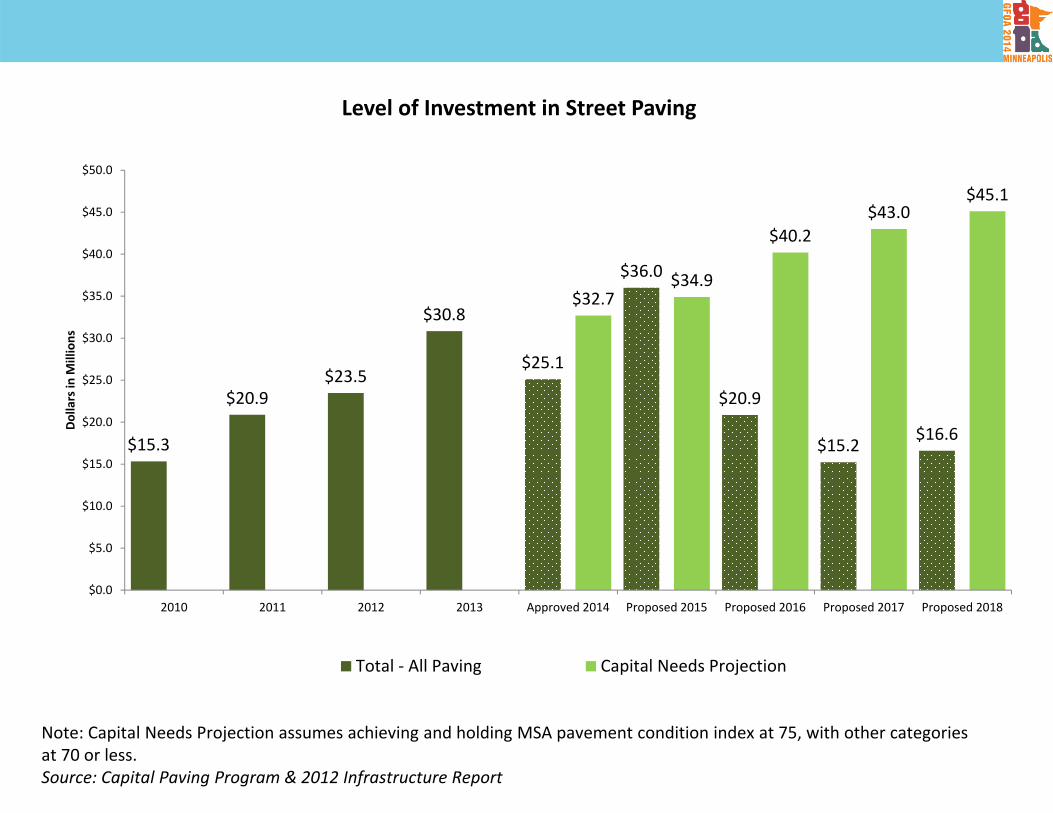
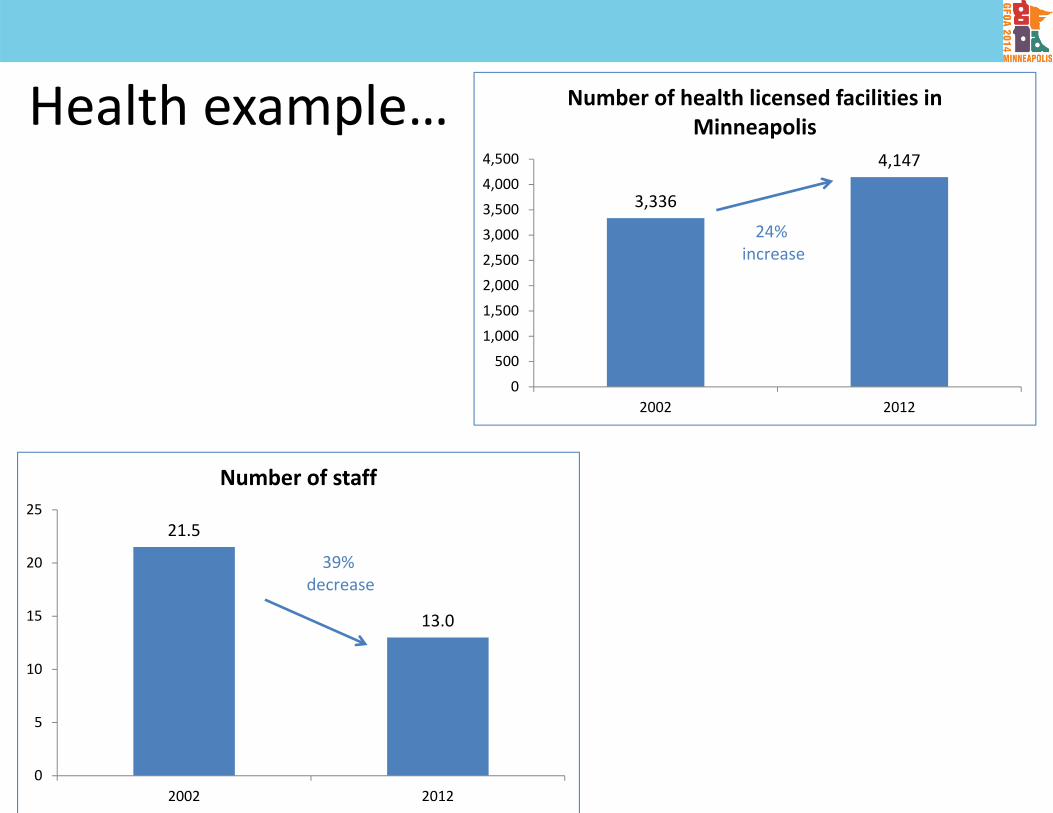
Tools to highlight Results Minneapolis Budget process Core elements Pavement Condition Index (PCI) example Health example Domestic assault conviction rate example
Intelligent Operations Platform (IOP)
Minneapolis budget process Program based budgeting Align planning, resources and measurement Three stages
Key elements serve as the basis for conversation Program description Measures used to justify existing or make argument for more resources Impact on city value and goals
Note: Capital Needs Projection assumes achieving and holding MSA pavement condition index at 75, with other categories at 70 or less.Source: Capital Paving Program & 2012 Infrastructure Report
21.5
13.0
0
5
10
15
20
25
2002 2012
Number of staff
39% decrease
3,336
4,147
0
500
1,000
1,500
2,000
2,500
3,000
3,500
4,000
4,500
2002 2012
Number of health licensed facilities in Minneapolis
24% increase
Health example…
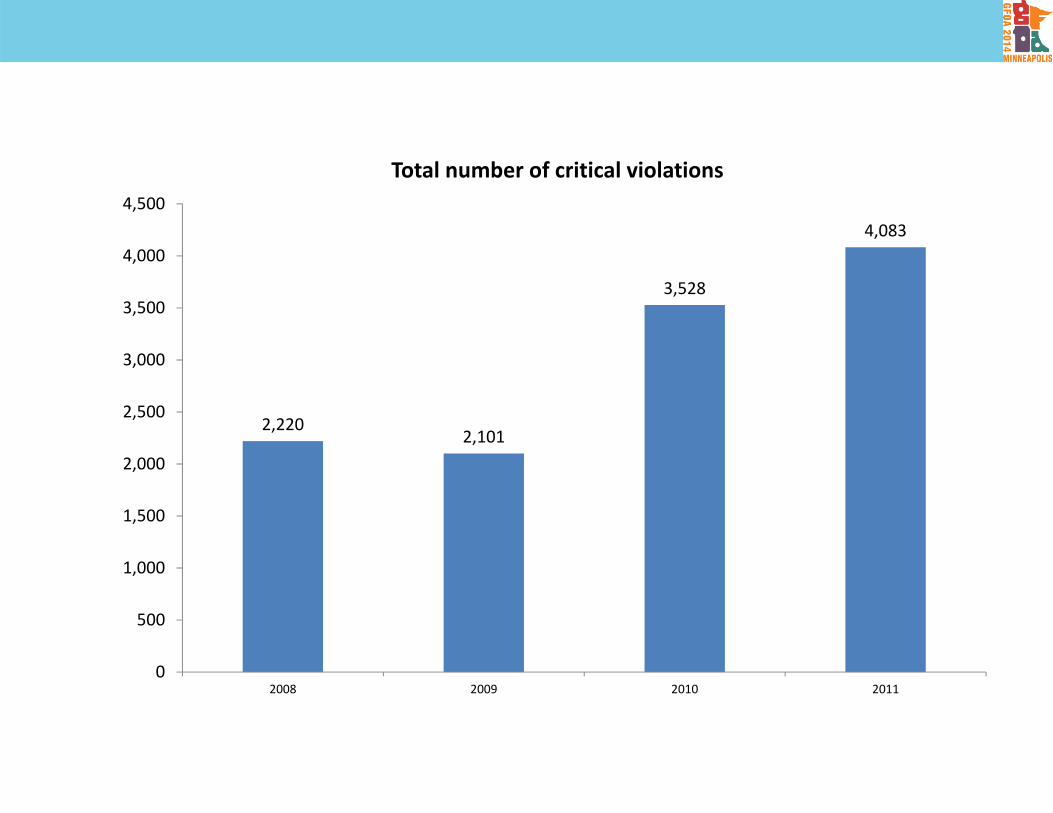
2,2202,101
3,528
4,083
0
500
1,000
1,500
2,000
2,500
3,000
3,500
4,000
4,500
2008 2009 2010 2011
Total number of critical violations
133147
220229
276
294
377
0
50
100
150
200
250
300
350
400
Toledo, OH Bloomington, MN Hennepin Cty Kansas City, MO Portland, OR St. Paul, MN Minneapolis
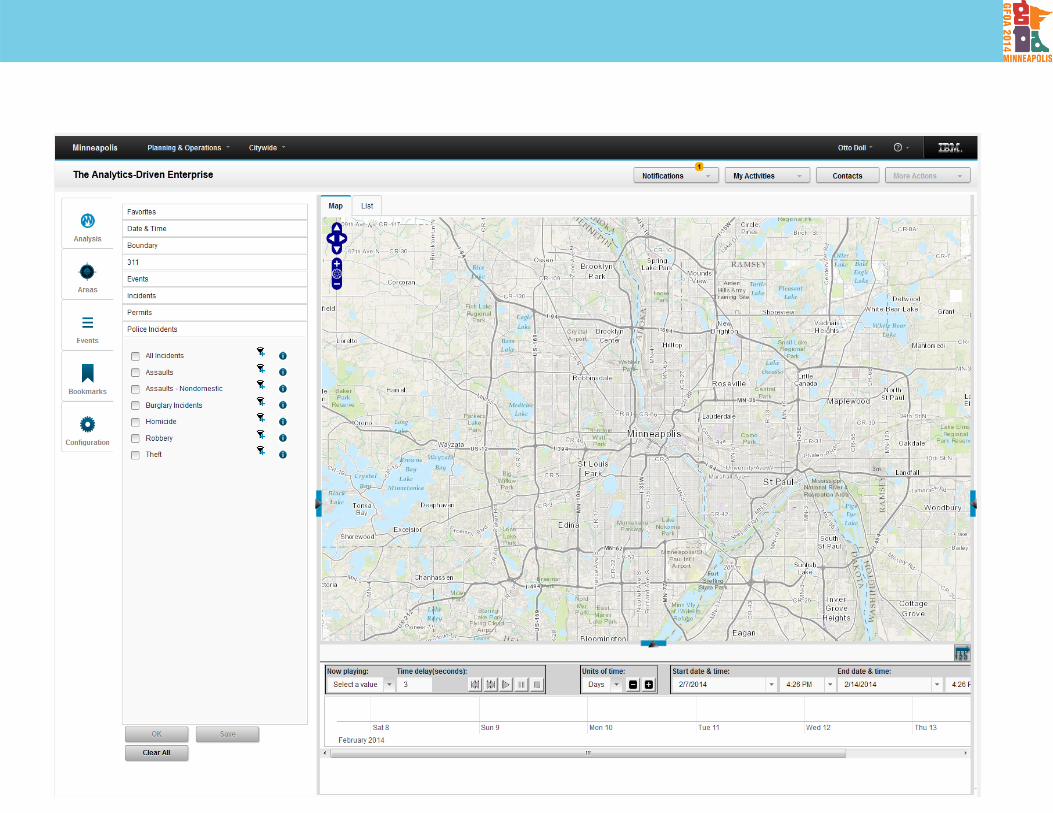
Tools to highlight Results Minneapolis Budget process Intelligent Operations Platform (IOP) Data model Analytics continuum
Next big step for Minneapolis
• Current tools, largely focused on• Rear‐view• Macro‐geography with some exceptions• One dimensional (based on data from one department)
• Intelligent Operations Platform (IOP)• Multi‐dimensional (pulling data from multiple sources)• Observe data on map, timeline and charts• Allows deeper drill down on specific areas• Use the analytical power of the tool
Themeo Considerable progress was made in the 20thCentury and first decade of 21st in getting results‐oriented performance measurement widely accepted.
o The level of most performance measurement systems at all three layers of government has been SHALLOW.
53
New Enabling Developments
o Technology advances o Lower cost of hardware and softwareo Widespread growth in acceptance of performance measurement/management
o Widespread growth in wanting decent evidence (“Evidence‐Based Practice”)
o Familiarity of many young (and old?) professionals with the technology
54
RecommendationsFor Strengthening PM Systems
o Determining what information will be useful and how to obtain it
o Analyzing that information
o Using the information
55
What Information and How to Obtain It—Part 1
1. Add more outcome indicators. These may require use of non‐traditional data collection procedures—such as outcome indicators that measure after‐service outcomes.
2. Include: outputs, intermediate outcomes, end outcomes, unit‐cost (preferably cost‐per‐unit of outcome). Distinguish which is which.
3. Disaggregate outcomes by customer and service characteristics.
56
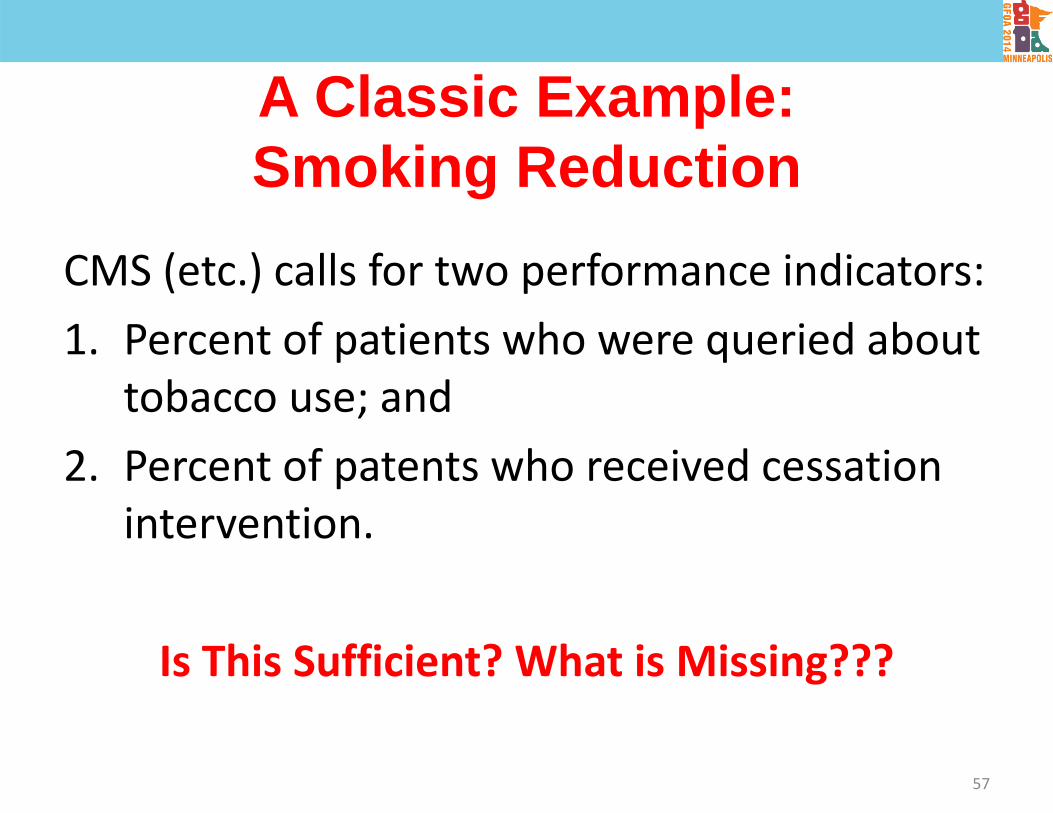
A Classic Example:Smoking Reduction
CMS (etc.) calls for two performance indicators:1. Percent of patients who were queried about
tobacco use; and2. Percent of patents who received cessation
intervention.
Is This Sufficient? What is Missing???
57
A Classic Example:Smoking Reduction
CMS calls for two performance indicators:1. Percent of patients who were queried about
tobacco use; and2. Percent of patents who received cessation
intervention.3. Percent of patients who report having
stopped smoking at a specific time after receiving the intervention
58
A Tool for Identifying Indicators
59
Examples of DisaggregationsCustomer characteristics: o Age, gender, and race/ethnicityo Location of residenceo Individuals or businesseso Difficulty/risk levelService characteristics:o Individual providers, such as districts, facilities, offices, contractors, teams, caseworkers
o Mode of service delivery, such as group vs. individual counseling
o Amount of service, e.g., number of sessions attended 60
61
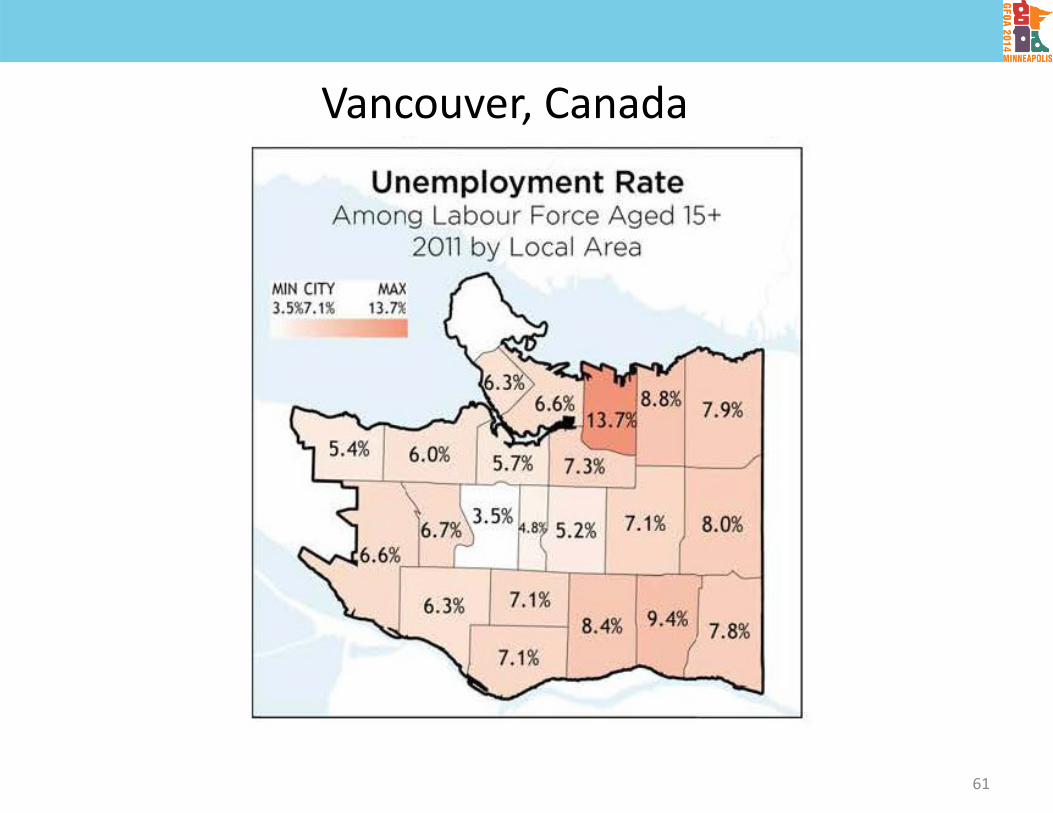
Vancouver, Canada
62
Sample Comparison of All Breakout CharacteristicsClients That Reported Improved Functioning after Completing Group Therapy
CaseworkerTherapist ATherapist BTherapist CTherapist D
19181819
2611642
26391742
42335611
517225
All Clients 74 22 31 35 12
55 16
54 23
56 22
These figures were produced from a survey of many pipe installation/replacement businesses. It also asked respondents to identify the most common failure mode by selecting from one of the following: corrosion, circumferential crack, longitudinal crack, leakage at joints, fatigue or other.
63
What Information and How to Obtain It—Part 2
4. Require explanations for unexpected outcomes (as compared to targets, previous years, etc.) .
5. Identify opportunities to obtain outcome data from other agencies.
6. Avoid excessive precision and rigor.
64
It is better to be roughly right than precisely ignorant.
Sources of Explanationso Internal staffo A special working groupso Customer focus groupso Responses to “Why did you provide a poor rating” to a question in customer surveys
o Examination of disaggregated data, such as increased proportion of difficult‐to help incoming workload.
o In‐depth evaluations or other studies
65
Analyzing the Information 7. Assign someone to analyze, summarize, and
highlight the performance information for the manager.
8. Compare outcomes against: Targets Previous time periods (e.g., for time trends and seasonal effects) Customer characteristics/difficulty levels Service characteristics Outcomes of other comparable organizations
66
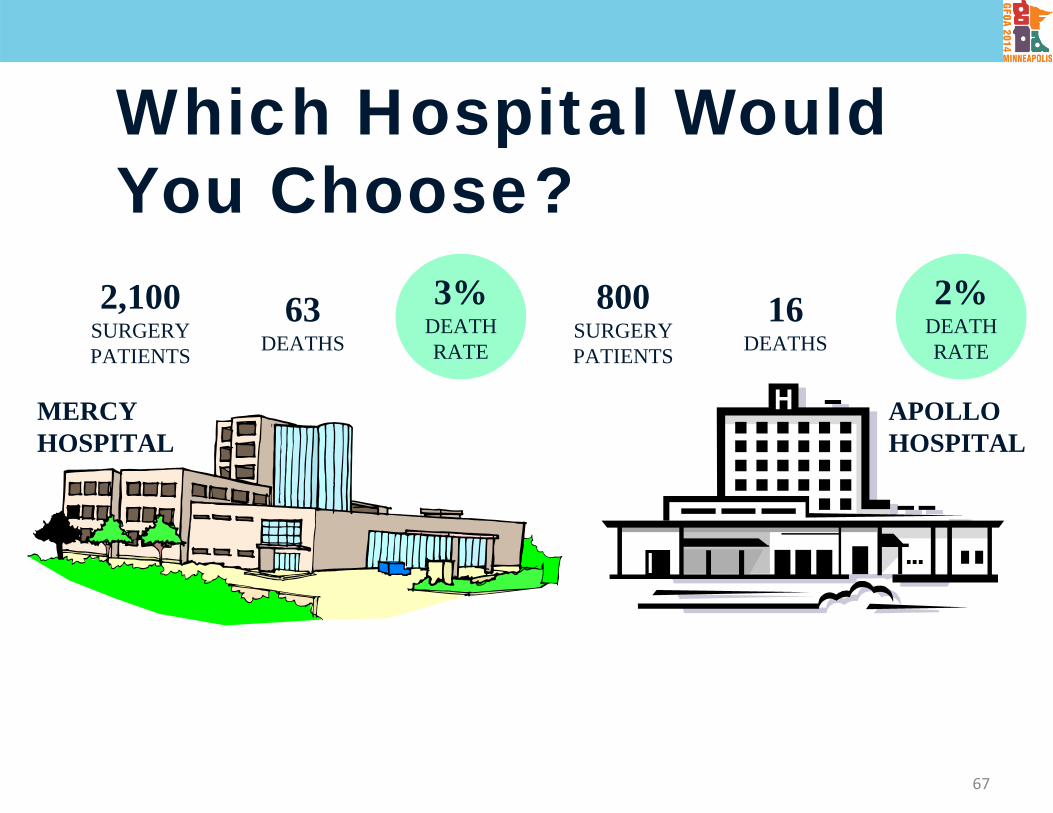
Which Hospital Would You Choose?
MERCY HOSPITAL
APOLLO HOSPITAL
2,100SURGERYPATIENTS
63DEATHS
3%DEATHRATE
800SURGERYPATIENTS
16DEATHS
2%DEATHRATE
67
68
Analyzing the Information(Continued)
9. Examine explanations for poor performance. 10.Provide software and training to managers
and professional staffs to enable them to “drill down.”
11.Consider using “mini” randomized controlled trials to test alternative service procedures.
69
70
Exhibit 4Sample Two‐characteristic BreakoutPercent of Clients Employed Three Months after Completing Service
Education Level at Entry N Short Program Long Program
Total
Completed high school 100 62% employed(of 55 clients)
64% employed
(of 45 clients)
63%(of 100 clients)
Did not complete high school
180 26% employed(of 95 clients)
73% employed
(of 85 clients)
48%(of 180 clients)
Total 280 39%(of 150 clients)
70%(of 130 clients)
54%(of 280 clients)
Is action needed? Encourage clients who had not—rather than had—completed high school to attend the long program. Use these figures to help convince clients of the longer program’s success with helping clients secure employment.
71
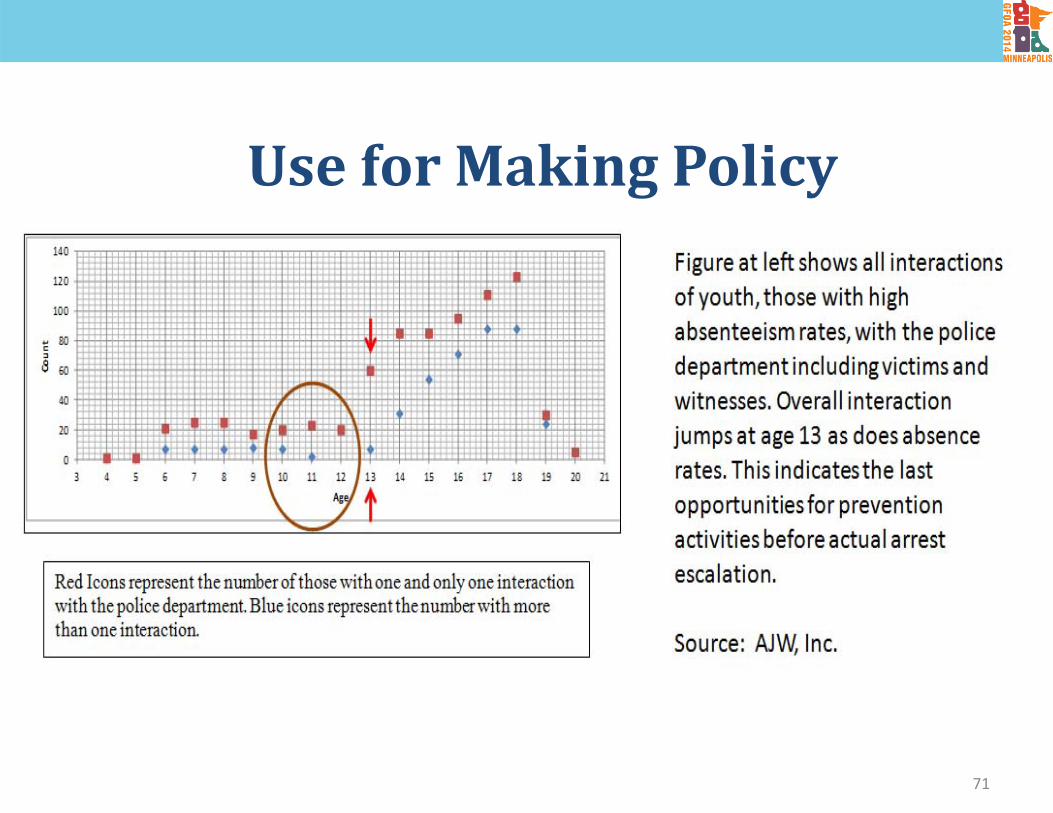
UseforMakingPolicy
Using Performance Information
12.Hold regular data‐driven performance reviewsand both high and at low management levels.
13.Enable managers to access performance data at any time.
14.Provide current performance data vs. targets to first line staff.
72
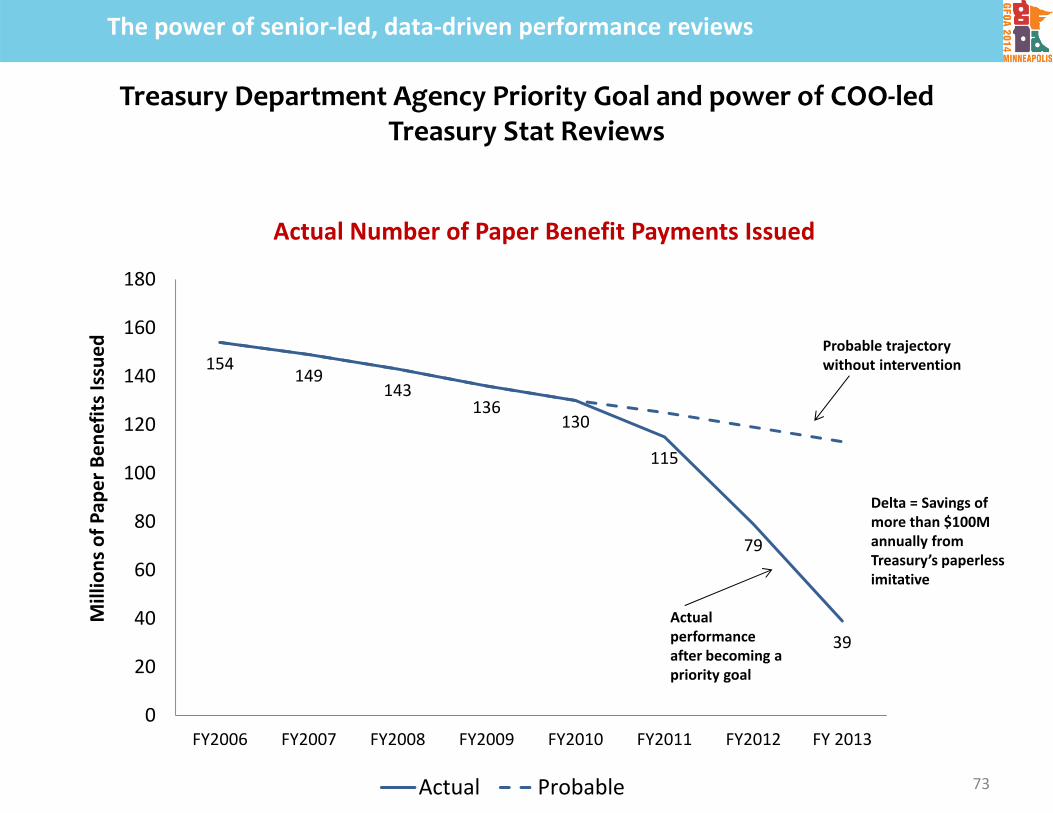
The power of senior‐led, data‐driven performance reviews
Treasury Department Agency Priority Goal and power of COO‐led Treasury Stat Reviews
Millions of P
aper Ben
efits
Issued
Actual Number of Paper Benefit Payments Issued
Delta = Savings of more than $100M annually from Treasury’s paperless imitative
Probable trajectory without intervention
Actual performance after becoming a priority goal
73
Implementation issueso Availability of user‐friendly softwareo Perceived cost of data collection from other than agency records, such as surveys of former customers
o Need for training for managers and staffs in: how to use the software; how to use the information from the software; & need for data accuracy
o Lack of interest by some officials and staffs74
For Further Information
Full report (Free) expected on Urban Institute website in about six weeks