26
THE EVOLUTION OF RESPONSIBLE INVESTMENT AN ANALYSIS OF ADVANCED SIGNATORY PRACTICES An investor initiative in partnership with UNEP Finance Initiative and UN Global Compact
THE EVOLUTION OF RESPONSIBLE INVESTMENTAN ANALYSIS OF ADVANCED SIGNATORY PRACTICES
An investor initiative in partnership with UNEP Finance Initiative and UN Global Compact

2
PREAMBLE TO THE PRINCIPLESAs institutional investors, we have a duty to act in the best long-term interests of our beneficiaries. In this fiduciary role, we believe that environmental, social, and governance (ESG) issues can affect the performance of investment portfolios (to varying degrees across companies, sectors, regions, asset classes and through time). We also recognise that applying these Principles may better align investors with broader objectives of society. Therefore, where consistent with our fiduciary responsibilities, we commit to the following:
THE SIX PRINCIPLES
We will incorporate ESG issues into investment analysis and decision-making processes.1We will be active owners and incorporate ESG issues into our ownership policies and practices.2We will seek appropriate disclosure on ESG issues by the entities in which we invest.3We will promote acceptance and implementation of the Principles within the investment industry.4We will work together to enhance our effectiveness in implementing the Principles.5We will each report on our activities and progress towards implementing the Principles.6
PRI's MISSIONWe believe that an economically efficient, sustainable global financial system is a necessity for long-term value creation. Such a system will reward long-term, responsible investment and benefit the environment and society as a whole.
The PRI will work to achieve this sustainable global financial system by encouraging adoption of the Principles and collaboration on their implementation; by fostering good governance, integrity and accountability; and by addressing obstacles to a sustainable financial system that lie within market practices, structures and regulation.
The information contained in this report is meant for the purposes of information only and is not intended to be investment, legal, tax or other advice, nor is it intended to be relied upon in making an investment or other decision. This report is provided with the understanding that the authors and publishers are not providing advice on legal, economic, investment or other professional issues and services. PRI Association is not responsible for the content of websites and information resources that may be referenced in the report. The access provided to these sites or the provision of such information resources does not constitute an endorsement by PRI Association of the information contained therein. Except where expressly stated otherwise, the opinions, recommendations, findings, interpretations and conclusions expressed in this report are those of PRI Association, and do not necessarily represent the views of the contributors to the report or any signatories to the Principles for Responsible Investment (individually or as a whole). It should not be inferred that any other organisation referenced on the front cover of, or within, the report, endorses or agrees with the conclusions set out in the report. The inclusion of company examples, or case studies written by external contributors (including PRI signatories), does not in any way constitute an endorsement of these organisations by PRI Association or the signatories to the Principles for Responsible Investment. The accuracy of any content provided by an external contributor remains the responsibility of such external contributor. While we have endeavoured to ensure that the information contained in this report has been obtained from reliable and up-to-date sources, the changing nature of statistics, laws, rules and regulations may result in delays, omissions or inaccuracies in information contained in this report. PRI Association is not responsible for any errors or omissions, for any decision made or action taken based on information contained in this report or for any loss or damage arising from or caused by such decision or action. All information in this report is provided “as-is” with no guarantee of completeness, accuracy or timeliness, or of the results obtained from the use of this information, and without warranty of any kind, expressed or implied.
PRI DISCLAIMER

THE EVOLUTION OF RESPONSIBLE INVESTMENT | 2021
3
EXECUTIVE SUMMARY
ABOUT THIS REPORT
HOW HAS RESPONSIBLE INVESTMENT PRACTICE EVOLVED?
STRATEGY AND GOVERNANCE
FIXED INCOME
LISTED EQUITY
EXTERNAL MANAGER SELECTION, APPOINTMENT AND MONITORING
THEMATIC INVESTMENTS AND SUSTAINABILITY OUTCOMES
STEPPING UP PRACTICES THROUGH THE NEW REPORTING FRAMEWORK
APPENDIX
CONTENTS
4
5
6
6
9
12
13
19
21
22

4
For the past six years, PRI signatories have reported annually on how they implement responsible investment practices. Upon doing so, investment managers and asset owners alike receive an assessment report that reflects their level of advancement.
Over this period, the proportion of signatories receiving high scores has increased across modules, prompting the PRI to look at how to ensure the Reporting Framework remains relevant to evolving practices and continues to drive change within the investment industry.
As the PRI launches its new Reporting Framework and assessment methodology, this report takes stock of the improvements in practices achieved by a fixed set of signatories between 2016 and 2020, as measured by the assessment scores they received.
This analysis delves specifically into which practices, previously deemed advanced, have shifted to become the norm, and which ones remain advanced, suggesting that they are more challenging to implement.
KEY FINDINGSThe uptake of advanced responsible investment practices has been steadily increasing across the 39 indicators analysed. Among the modules assessing directly and indirectly managed fixed income and listed equity assets and firm-wide governance, the practices that had the lowest uptake in 2016 have generally seen the largest improvements1:
■ The use of fixed income-specific engagement policies has tripled: 43% of signatories had a specific fixed income engagement policy in 2020 compared to 14% in 2016.
■ The number of bondholders measuring ESG performance has more than doubled: 53% and 43% of signatories investing in sovereign, supranational and agency (SSA) and corporate bonds measured the ESG performance of their portfolios in 2020, compared to 21% and 19% respectively in 2016.
■ Less than a quarter of chief-level staff have responsible investment-linked remuneration: While the proportion increased by 80%, only 23% of signatories linked executive bonuses to responsible investment performance in 2020, compared to 13% in 2016.
■ The external audit of fund criteria is a last resort: The use of external auditors to verify listed equity screening criteria rose from 12% in 2018 to 25% in 2020.
■ The vast majority of asset owners review their managers’ stewardship practices: 80% reviewed their managers’ engagement policies in 2020, compared to 59% in 2018, while 70% review their managers’ voting policies.
■ The majority of asset owners seek managers whose engagement outputs feed into their investment decision making: 60% of asset owners reviewed their managers’ ability to feed back results from their engagements into investment analysis, compared to 43% in 2018. A smaller increase was seen for voting results and investment decisions, which went up from 31% to 39% over the same period.
■ The uptake in environmentally themed investments remains low: Just 47% of signatories in 2020 reported doing so, up from 34% in 2016.
STEPPING UP PRACTICES THROUGH THE NEW REPORTING FRAMEWORKThe uptake of advanced practices among signatories over the course of a few years is evidence of how quickly the investment industry can change.
As demonstrated from the usage of the data portal, asset owners frequently request the assessment reports of their current and potential investment managers and use them as part of their selection and monitoring processes.
In addition, the Reporting Framework helps investment managers – through their assessment reports – to engage with senior management, demonstrating that previously implemented changes are reflected in their scores and to identify where further improvements need to be made.
Going forward, signatories are expected to provide more detail on the processes they use across a range of responsible investment practices, and to start assessing their outcomes in the real world, when they report on their investment activities.
Ultimately, the Reporting Framework aims to continue driving positive change in the investment industry, contributing to more sustainable markets and a more prosperous world for all.
EXECUTIVE SUMMARY
1 Percentages are quoted on a like-for-like basis.

THE EVOLUTION OF RESPONSIBLE INVESTMENT | 2021
5
For the past six years, PRI signatories have reported annually on how they implement responsible investment practices. Upon doing so, investment managers and asset owners alike receive an assessment report that reflects their level of advancement.
This report analyses how investors’ responsible investment practices have changed between 2016 (or in some cases 2018) and 2020, based on their PRI reporting responses in that period. It compares practices reported on in 2020 to those reported on in 2016 and 2018, depending on when they were added to the Reporting Framework.
While the report focuses on firm-wide and asset class-specific practices, it should be noted that a trend analysis of ESG incorporation in listed equity investments is limited, due to changes made to the relevant incorporation and active ownership modules in 2018 and 2019, which mean that a meaningful comparison of those responses cannot be made for the four-year period. For the latest state of the market in listed equity, readers should refer to the Listed equity snapshot report, which covers practices reported in 2020.
HOW ARE SIGNATORIES ASSESSED IN THE REPORTING FRAMEWORK?Each module of the Reporting Framework contains core and additional indicators that are assessed. Core assessed indicators are mandatory to complete. Additional assessed indicators are predominantly voluntary to complete, and allow signatories to demonstrate more advanced responsible investment practices. The PRI scores signatories’ responses for each indicator as either zero (where no reponse was provided) or one, two or three stars.
REPORT METHODOLOGYThis report looks at 39 additionally assessed2 indicators that were substantially unaltered, in content and assessment methodology, and where signatories had the highest change in score, between 2016 and 2020. For the firm-level indicators, which are applicable to all signatories, the analysis is based on 903 signatories that reported consistently during the period analysed (2016, 2018, 2020) and represented US$80.8 trillion3 as of 2020. For indicators introduced in 2018, the analysis is based on 1336 signatories that represented US$97 trillion as of 2020. Signatories that held an asset class and reported to the corresponding module throughout the analysed period feature in the sample size for the relevant assessed indicators.
Signatories’ indicator scores have only been included where they were received for each year assessed, so that the progress made by a fixed group of signatories could be monitored. The report highlights the mean score for each indicator over the three years, followed by the uptake of the underlying practices. The percentage change4 in the scores and the underlying practices for indicators with a 2016 baseline compares progress made between 2016 and 2020, while data from 2018 is used to highlight whether the change occurred predominantly in the first two years, the last two years or if it happened gradually.
ABOUT THIS REPORT
2 The analysis also includes three advanced practices that are either core, not assessed or are based on qualitative analysis.3 Includes double counting, calculated as 12.4% among 2099 reporters for 2020.4 The change in scores is calculated as the change in the mean score between two periods divided by the mean score of the baseline year. Similarly, the change in the underlying practices
refers to the change in the percentage of signatories doing a particular practice.
REPORTING AND ASSESSMENT REVIEWAs part of our 10-year Blueprint for responsible investment – looking at how to take responsible investment forward – we committed to undertaking an extensive review of our reporting and assessment process between 2018 and 2021. As a result, we have now launched a new Reporting Framework, which extends the learning curve for signatories and reflects current best practices. It requires signatories to provide further detail on some aspects of responsible investment, including climate change risk management, and cover new ones, such as sustainability outcomes seen in the real world. To ensure most responsible investment practices are adopted throughout an organisation, signatories are also systematically assessed on how much of their AUM they apply them to. Throughout the report, we highlight the aspects of reporting that have changed in the 2021 Reporting Framework.

6
STRATEGY AND GOVERNANCEThe PRI asks all signatories to report on their firm-level responsible investment strategy and governance before reporting their asset-class specific practices.
Between 2016 and 2020, signatories’ average scores (see Figure 1) improved the most for the following practices:
INCENTIVES FOR RESPONSIBLE INVESTMENT PERFORMANCEThe PRI recommends that signatories implement an appropriate system of KPIs, objectives, and incentives to ensure employee interests are aligned with an organisation’s responsible investment objectives. Signatories are asked if different roles within their organisation (ranging from senior management to portfolio managers and analysts) have responsible investment-related KPIs, appraisals or bonuses.
The proportion of signatories that link their senior management bonuses to responsible investment performance has increased, from 13% in 2016 to 23% in 2020 (see Figure 2). The majority of that 10 percentage point increase occurred between 2018 and 2020, indicating that it is a practice that a minority of signatories have only recently started considering. Investment managers are twice as likely to reward C-level executives for responsible investment performance than asset owners, with 27% doing so in 2020 compared to 14% of asset owners.
Figure 1: Advanced strategy and governance practices with largest score increase
HOW HAS RESPONSIBLE INVESTMENT PRACTICE EVOLVED?
1.73
1.211.32
2.10
2.30
1.66
2.372.19
2.01
0.00
0.50
1.00
1.50
2.00
2.50
3.00
2016 2018 2020
Responsible investment objectives, KPIs and
bonuses
Responsible investment in training
Public policy engagement
■ Setting responsible investment objectives, key performance indicators (KPIs) and bonuses for staff (37% increase)
■ Providing responsible investment training (81% increase)
■ Engaging with policy makers (53% increase)
While variable pay associated with responsible investment remains rare, and is less prevalent among C-level staff compared to most other roles, C-level staff are as likely to have responsible investment-specific KPIs (53%) as portfolio managers and analysts (55%).
Over the four-year period, the use of KPIs for portfolio managers and analysts increased more on an absolute and relative basis than the use of responsible investment-linked remuneration, indicating that the latter remains a difficult (and therefore advanced) practice which is contingent on the use of responsible investment KPIs and objectives.
RAISING THE BARAs of 2021, all signatories have to report on whether they offer variable compensation and to which resposible investment objectives these apply to. This is to reflect that ESG performance is the result of other objectives, such as ESG incorporation, developing an ESG investment approach and contributing to stewardship activities.
Note: RI objectives, KPIs and bonuses (SG 08.1a), RI in training (SG 08.1b), Public policy engagement (SG 11), N =903.

THE EVOLUTION OF RESPONSIBLE INVESTMENT | 2021
7
RESPONSIBLE INVESTMENT CAREER DEVELOPMENTThe PRI considers it good practice for signatories to conduct regular training to ensure staff have the necessary skills to adhere to responsible investment policies, meet objectives and keep up with developments in this rapidly changing industry. Between 2016 and 2020, there was a major shift among the 903 investors in the cohort (see Figure 3). The number of signatories that provided responsible investment-related career development for their board members almost doubled, from 22% to 41%, while those training their C-level executives grew from 28% to 60%, with majority of that change occuring between 2018 and 2020.
Figure 2: Bonuses for responsible investment performance by role
Figure 3: Inclusion of responsible investment in personal development plans by role
RAISING THE BARAs of 2021, all signatories must report on how frequently they review the responsible investment capabilities of their investment professionals. They can explain how they assess the performance of their professionals in relation to responsible investment objectives.
2016 2018 2020
13%19% 18% 18%15%
21% 19% 21%23%
30% 28% 27%
0%
10%
20%
30%
40%
50%
C-level Other executive Portfolio managers Analysts
Note: RI objectives, KPIs and bonuses (SG 08.1a). While the number of signatories included in this analysis was the same between the years, the number of reporters with a given role varied due to organisational changes. In 2020, the sample sizes were C-level executives (840), other executive (510), portfolio managers (726), analysts (634). C-level executives, portfolio managers and analysts had less than 3% change.
Note: RI in training (SG 08.1b), N=903 (varies by role – see explanation in previous chart).
Board C-level Other executive
Portfoliomanagers
Analysts Responsibleinvestmentspecialists
Investorrelations
% o
f sig
nato
ries
2016 2018 2020
22%28%
38% 38% 42%
65%
26%32%
38%
48% 51%55%
73%
40%41%
60%
71% 71% 73%
87%
58%
0%10%20%30%40%50%60%70%80%90%
100%

8
ENGAGEMENT WITH PUBLIC POLICY MAKERS Public policy is critical in enabling institutional investors to generate sustainable returns and create value. It also affects the sustainability and stability of financial markets and social, environmental and economic systems. The PRI encourages signatories to engage with public policy makers in order to foster a regulatory environment that is conducive to maximising long-term gains. It is thus positive that in 2020, three-quarters of asset owners reported engaging with policy makers on responsible investment, up from 54% in 2016. Moreover, the rise in investment managers doing so – from 40% to 63% – suggests that ESG issues are becoming more central to their overall investment strategies.
DISCLOSURE TO CLIENTS AND BENEFICIARIESThe PRI considers disclosure a key component of investor accountability. Signatories are scored, per relevant asset class, on how they disclose their responsible investment practices to clients and the public. The scores are based on the frequency and extent of the information disclosed for each category5. Between 2016 and 2020, signatories significantly increased their disclosures levels, particularly relating to their fixed income assets, although overall they still tend to provide more to clients and beneficiaries than to the public (see Figure 4). While in 2016, client disclosures on SSA bonds scored highest among fixed income assets, signatories scored better on corporate non-financial bond client disclosures in 2020, with the latter also enjoying the largest score increase overall in the four-year period.RAISING THE BAR
As of 2021, questions on engagement with policy makers are mandatory for all signatories, who have to disclose:
■ the nature of engagement; ■ processes in place to align policy activities with their
position on sustainable finance; ■ how they make their policy activities public; and ■ how they manage potential conflicts of interest
resulting from activities that yield political influence.
RAISING THE BARAs of 2021, signatories must report on:
■ what aspects of their ESG approach they communicate to clients and beneficiaries;
■ to what extent they communicate changes in ESG benchmark selection and construction for passive assets; and
■ what ESG information they include in client reporting.
Figure 4: Average scores on the quality of ESG disclosure by asset class and audience
Public
Listed equity -screening
Listed equity -integration
Fixed income -SSA
Fixed income -corporate non-�nancial
Clients Public Clients Public Clients Public Clients
1.68
2.18
1.59
2.17
0.93
1.46
1.061.16
1.98
1.35
2.06
1.361.62
1.21
1.85
1.13
1.95
2.47
1.98
2.51
1.70
2.17
1.84
2.38
0.0
0.5
1.0
1.5
2.0
2.5
3.0
2016 2018 2020
Assessed module path
Note: ESG disclosure to public (SG 19a), ESG disclosure to clients (SG 19b). Scored as part of corresponding asset class module.
5 Signatories get one star if they disclose their broad approach to responsible investment less frequently than annually, two stars if they disclose their broad approach to responsible investment annually or more frequently, or if they provide detailed disclosure less frequently than annually, and three stars if they disclose a detailed explanation of ESG incorporation at least annually. Signatories can earn three stars for each (public and clients), however any disclosure made to the public must also be made to clients and beneficiaries.

THE EVOLUTION OF RESPONSIBLE INVESTMENT | 2021
9
FIXED INCOMEAmong the eight indicators analysed for corporate non-financial bonds, the following two had the lowest mean scores in 2016 and saw the largest increase in scoring by 2020 (see Figure 5):
PRI resources:
Figure 5: Corporate non-financial fixed income practices with largest score increase
Note: AUM coverage of engagement: corporate bonds (FI 14), Separate engagement policy for fixed income (FI 16), N=212.
■ Proportion of assets engaged on with issuers (118% increase)
■ Having a fixed income-specific engagement policy, distinct from listed equity (214% increase)
ESG engagement for fixed income investors: managing risks, enhancing returns
ESG engagement for sovereign debt investors
Fixed income snapshot report 2019
2016 2018 2020
0.74
1.09
1.60
0.41
0.79
1.29
0.761.23
1.49
AUM coverageof engagement
Separateengagement policy
ESGperformance
0.0
0.5
1.0
1.5
2.0

10
COVERAGE OF FIXED INCOME ENGAGEMENTPrinciple 2 of the six Principles encourages investors to be active stewards of their investments and incorporate ESG factors into their ownership policies and practices across different asset classes, including fixed income.
Fixed income investors should engage with issuers to identify and manage ESG-related risks, gain better issuer disclosure relating to ESG factors; influence how issuers address specific ESG risks or value-creation opportunities; and maximise the positive ESG outcomes from their investments.
Fixed income engagement was at a very early stage in 2016, with just 19% of 212 signatories engaging on more than a quarter of their corporate bond portfolios (see Figure 6). This subsequently improved to 30% in 2018 and 51% in 2020.
RAISING THE BAREngagement allows investors to move from merely observing an issuer’s ESG performance and historical trajectory to encouraging an improvement in transparency and tangible actions in relevant areas. This enables issuers and investors to address ESG factors that might be material to the pricing and performance of their securities. To reflect that engagement is applicable to any asset class, signatories have to report on their stewardship practices across their entire portfolio as of 2021.
As investors continue to build their expertise in assessing ESG risks and are clearer about their ESG disclosure demands and portfolio goals, we expect that bondholder engagement, like shareholder engagement, will become more effective at driving real-world outcomes.
Figure 6: Breakdown of corporate non-financial bondholder engagement by AUM coverage
35%
15%6%
24%
26%
16%
21%
29%
28%
6%
10%
19%
13%20%
32%
0%
20%
40%
60%
80%
100%
2016 2018 2020
Did not engage 1%-5% of assets 5%-25% of assets 26%-50% of assets >50% of assets
Note: AUM coverage of engagement: corporate bonds (FI 14), N=212.

THE EVOLUTION OF RESPONSIBLE INVESTMENT | 2021
11
HAVING A DEDICATED FIXED INCOME ENGAGEMENT POLICY As bondholders don’t have company ownership rights, their engagement practices differ from those in listed equity, and should therefore be covered in a dedicated policy. Of all the indicators analysed in this report, signatories scored the lowest on having a publicly available and dedicated engagement policy for fixed income assets in 2016 (0.41 out of 3, on average) – with only 14% of 212 signatories doing so. This rose to 26% by 2018 and jumped to 43% in 2020. The continuous improvement over four years demonstrates the shift from advanced to mainstream that some practices – including this one – have undergone and indicates that while some signatories need more time than others to adopt them, they are not only reserved for leaders.
MEASURING THE EFFECT OF ESG INCORPORATION ON PERFORMANCEMeasuring ESG performance is a prerequisite for more advanced aspects of responsible investment. For instance, signatories must measure a portfolio’s weighted average carbon intensity in order to disclose Scope 1, 2, and, if appropriate, Scope 3 greenhouse gas (GHG) emissions, and the related risks, as recommended by the Task Force for Climate-related Financial Disclosures (TCFD). The proportion of signatories measuring the ESG performance of their SSA bond portfolios increased from 21% in 2016 to 36% in 2018 and to 53% in 2020, while those doing so for their corporate bonds grew from 19% to 29% to 43% over the same period (see Figure 7).
Figure 7: Measurement of ESG incorporation impact on performance
Note: Performance measurement: corporate bonds (FI 17.1), N = 213; Performance measurement: SSA bonds (FI 17.1), N = 159.
2016 2018 2020
21% 19%
36% 29%
53%43%
0%
20%
40%
60%
80%
100%
SSA bonds Corporate non-�nancial bonds

12
LISTED EQUITYESG incorporation in listed equity investments is more established than in fixed income and advanced practices continue to evolve in this area. The analysis is focused on a limited number of ESG incorporation practices, as changes made to the listed equity incorporation and active ownership modules in 2018 and 2019 mean that a meaningful comparison of those indicators cannot be made for a four-year period.
ENSURING COMPLIANCE WITH SCREENING CRITERIAScreening is a popular method of ESG incorporation that signatories applied to 47%, or nearly US$10 trillion, of actively managed listed equity AUM in 2020. The PRI asks signatories how they ensure that their screening criteria are not breached. While in 2018 it was common practice for signatories to systematically check their holdings and enforce criteria through automated IT systems, conducting internal audits was less common, and undertaking external audits was extremely rare (see Figure 8). Even though the latter is not required to achieve the maximum score for this indicator, it is encouraging that the proportion of signatories that audited their screening practices using a third-party organisation doubled to 25% in 2020. Indeed, external audits are typically used in addition to other practices – those signatories that conducted external audits implemented more than three practices on average.
PRI resources:
Listed Equity snapshot report
Figure 8: Methods used to ensure fund criteria are not breached
Automated IT sysems enforce criteria
% o
f sig
nato
ries
Mea
n ot
her p
ract
ices
impl
emen
ted
for a
giv
en p
ract
ice
Holdingssystematically checked
12%
41%
63%71%
80%
25%
53%
88%
0
0.5
1
1.5
2
2.5
3
3.5
4
0%
10%
20%
30%
40%
50%
60%
70%
80%
90%
100%
External audit Internal audit
2018 2020 Number of practices (2020)
3.463.13
2.84
2.61
Note: Listed equity screening practices (LEI 06.1), N=447.
SPOTTING ADVANCED PRACTICESThe orange value above or within each set of columns represents the average number of practices implemented by the signatories that also implement the specific practice highlighted.
When this value is higher for one practice than for others, it often correlates with a lower uptake of the practice, which is likely to be advanced.
THE EVOLUTION OF RESPONSIBLE INVESTMENT | 2021
13
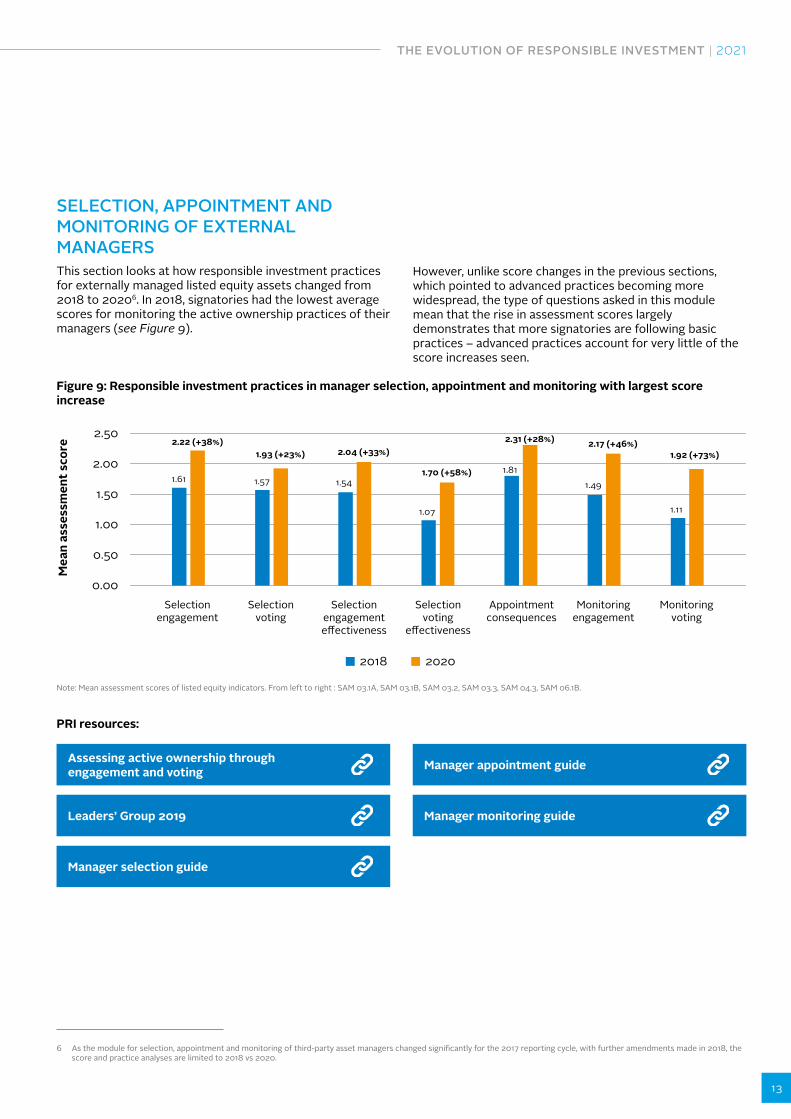
SELECTION, APPOINTMENT AND MONITORING OF EXTERNAL MANAGERSThis section looks at how responsible investment practices for externally managed listed equity assets changed from 2018 to 20206. In 2018, signatories had the lowest average scores for monitoring the active ownership practices of their managers (see Figure 9).
Figure 9: Responsible investment practices in manager selection, appointment and monitoring with largest score increase
Note: Mean assessment scores of listed equity indicators. From left to right : SAM 03.1A, SAM 03.1B, SAM 03.2, SAM 03.3, SAM 04.3, SAM 06.1B.
However, unlike score changes in the previous sections, which pointed to advanced practices becoming more widespread, the type of questions asked in this module mean that the rise in assessment scores largely demonstrates that more signatories are following basic practices – advanced practices account for very little of the score increases seen.
Selectionengagement
Selectionvoting
Selectionengagemente�ectiveness
Selectionvoting
e�ectiveness
Appointmentconsequences
Monitoringengagement
Monitoringvoting
Mea
n as
sess
men
t sco
re
2018 2020
1.61 1.57 1.54
1.07
1.81
1.49
1.11
2.22 (+38%)1.93 (+23%) 2.04 (+33%)
1.70 (+58%)
2.31 (+28%) 2.17 (+46%)1.92 (+73%)
0.00
0.50
1.00
1.50
2.00
2.50
PRI resources:
Assessing active ownership through engagement and voting
Leaders’ Group 2019
Manager selection guide
Manager appointment guide
Manager monitoring guide
6 As the module for selection, appointment and monitoring of third-party asset managers changed significantly for the 2017 reporting cycle, with further amendments made in 2018, the score and practice analyses are limited to 2018 vs 2020.

14
ACTIVE OWNERSHIP IN MANAGER SELECTIONSignatories are asked how they evaluate a manager’s active ownership practices during the selection process.
For engagement, the mean score of 228 signatories increased by 38%, from 1.61 in 2018 to 2.22 in 2020, meaning that, on average, signatories reviewed their managers’ engagement practices by checking two or more elements by 2020 (see Figure 10).
While all practices showed the same rate of improvement, reviewing the engagement policy remains the most popular practice at 80%. In contrast, the most advanced practice involves checking whether a manager’s investment analysis reflects the results of their engagements.
For voting, the mean score of 216 signatories increased by 23%, from 1.57 to 1.93 in 2018 and 2020 respectively. Practices such as reviewing the number of votes and the rationale for casting them improved the most, with a 43% uptake among signatories (see Figure 11). In 2020, more signatories also reviewed if their managers incorporated voting results into their investment analysis, albeit at a lower level.
As observed with the scores, signatories are monitoring their managers’ engagement approaches in more depth than their voting approaches. For example, 80% of signatories reviewed their managers’ engagement policy in 2020, compared to 70% reviewing their voting policies.
RAISING THE BARAs of 2021, signatories are being asked if they assess the role of the investment managers in stewardship activities, how managers deploy escalation strategies and the resources they allocate to stewardship, among other aspects.
RAISING THE BARAs of 2021, signatories have to report on whether they monitor how a manager’s lending policy influences voting and whether they review if a manager’s voting record demonstrates that they prioritise making progress on systemic issues.
Figure 10: Methods used to evaluate manager engagement processes
Note: Manager selection: engagement (SAM 03.1A LE), N=228.
% o
f sig
nato
ries
Mea
n ot
her p
ract
ices
impl
emen
ted
for a
giv
en p
ract
ice
Review engagementpolicy
Review engagementprocess (with examples
and outcomes)
Engagement resultsfed back into investment
analysis
59%
80%
57%
77%
43%
60%
1
1.5
2
2.5
3
0%
10%
20%
30%
40%
50%
60%
70%
80%
90%
100%
2018 2020 Number of practices (2020)
2.65
2.72
2.97
Signatories that reported doing so typically also reviewed their managers’ engagement policies and processes.

THE EVOLUTION OF RESPONSIBLE INVESTMENT | 2021
15
MEASURING THE SUCCESS OF MANAGERS’ ENGAGEMENT APPROACHESThe Reporting Framework asks signatories how they determine if a manager’s engagement approach is successful. The mean score of 228 signatories increased by 33% from 1.54 to 2.04 over the two years (see Figure 12).
Figure 11: Methods used to evaluate manager voting processes
Figure 12: How signatories measure the success of manager engagement processes
Note: Manager selection: voting (SAM 03.1B LE), N=216.
Note: Manager selection: engagement effectiveness (SAM 03.2 LE), N=228.
% o
f sig
nato
ries
Mea
n ot
her p
ract
ices
impl
emen
ted
for a
giv
en p
ract
ice
Reviewvoting policy
Review abilityto align with
client voting policy
Review processfor informing client
about votes
Voting resultsfed back into
investment analysis
Review numberof votes castand rationale
58%
36% 40%
31% 30%
70%
44%
51%
39% 43%
2
2.5
3
3.5
4
4.5
0%
10%
20%
30%
40%
50%
60%
70%
80%
2018 2020 Number of practices (2020)
3.47
4.09 4.06
4.37 4.33
Examining a manager’s track record on improving the ESG profile of companies and/or portfolios and evaluating evidence of driving changes in corporate practice had the highest increase in uptake.
% o
f sig
nato
ries
Mea
n ot
her p
ract
ices
impl
emen
ted
for a
giv
en p
ract
ice
Impact oninvestment decisions
Financial impact ESG impact Evidence of changesin corporate practice
58%
26%36%
47%
69%
32%
50%
66%
1
1.5
2
2.5
3
3.5
4
0%
10%
20%
30%
40%
50%
60%
70%
80%
90%
100%
2018 2020 Number of practices (2020)
2.92
3.55
3.24
2.95

16
MEASURING THE SUCCESS OF MANAGER VOTING APPROACHESThe mean score in 2016 for how signatories assess if a manager’s voting approach is successful (1.07 out of 3) suggests that this was one of the most challenging practices to implement in the SAM module. By 2020, it increased to 1.70, with improvement reflected across all the underlying practices (see Figure 13). Over half of signatories reported reviewing how managers’ voting practices impacted their investment decisions and looking for evidence of change in corporate practice, up from 39% and 35% respectively in 2018.
The previously highlighted disparity between engagement and voting scores is also reflected in these underlying practices, with 66% of signatories determining engagement success by looking at changes in corporate practices compared to 55% for the equivalent voting figure.
ACTIONS TAKEN WHEN MANAGERS UNDERPERFORMOnce a manager has been selected and appointed, thorough and consistent monitoring is critical to ensure they meet the terms and conditions on which they were appointed. This includes signatories considering what actions they will take if a manager fails to meet any of their ESG-related obligations.
The mean score from 324 signatories increased by 28%, from 1.81 in 2018 to 2.317 in 2020. Scores for all underlying practices rose (see Figure 14). Terminating a contract saw the biggest increase, with over half of signatories reporting doing so in 2020.
Figure 13: Methods used to determine the success of manager voting
% o
f sig
nato
ries
Mea
n ot
her p
ract
ices
impl
emen
ted
for a
giv
en p
ract
ice
Impact onESG pro�le
Impact oninvestment decisions
Evidence of changesin corporate practice
1.5
2.539%
25%
35%
55%
41%
55%
1
2
3
0%
10%
20%
30%
40%
50%
60%
2018 2020 Number of practices (2020)
3.39
2.71
2.41
Note: Manager selection: voting effectiveness (SAM 03.3 LE), N=216.
RAISING THE BARAs of 2021, signatories have to report whether their escalation strategy includes engagement with managers’ investment committees or boards and reducing exposure until the non-conformity is rectified, as well as communicating to managers that they have been added to a watchlist.
7 This question did not differentiate between asset classes.

THE EVOLUTION OF RESPONSIBLE INVESTMENT | 2021
17
MONITORING MANAGERS’ STEWARDSHIP PRACTICESAs with manager selection, the lowest mean score in manager monitoring related to stewardship practices rather than ESG incorporation practices; specifically, what information signatories use to monitor a manager’s engagement and voting practices.
Figure 14: Actions taken when managers underperform
Figure 15: Methods used to monitor manager engagement practices
Note: Manager appointment: consequences for ESG underperformance (SAM 04.3 LE), N=324. The calculation of the average number of actions used by signatories if they have selected a given action (represented by the orange marker) includes two other action options not displayed in this chart.
Note: Manager monitoring: engagement (SAM 06.1A LE), N=216.
% o
f sig
nato
ries
Mea
n ot
her p
ract
ices
impl
emen
ted
for a
giv
en p
ract
ice
Project planfor remediation
Watch list Investigate reasonfor non-compliance
Termination
64%
40%
54%
41%
78%
56% 57%
1
1.5
2
2.5
3
3.5
4
0%
10%
20%
30%
40%
50%
60%
70%
80%
90%73%
2018 2020 Number of practices (2020)
3.41
3.87
3.54
3.84
The mean score for 228 signatories increased from 1.49 to 2.17 for engagement. The practice with the highest relative increase (70%) was monitoring the escalation strategies used by managers with investee companies when an engagement was unsuccessful (see Figure 15).
% o
f sig
nato
ries
Mea
n ot
her p
ract
ices
impl
emen
ted
for a
giv
en p
ract
ice
Summary ofsustainability outcomes
Summary ofactivities and results
Impact oninvestment decisions
Escalations
54%
43%
27%
38%
71%
64%
46%
57%
2
2.5
3
3.5
4
4.5
5
0%
10%
20%
30%
40%
50%
60%
70%
80%
2018 2020 Number of practices (2020)
3.39
3.66
4.09
3.84
18
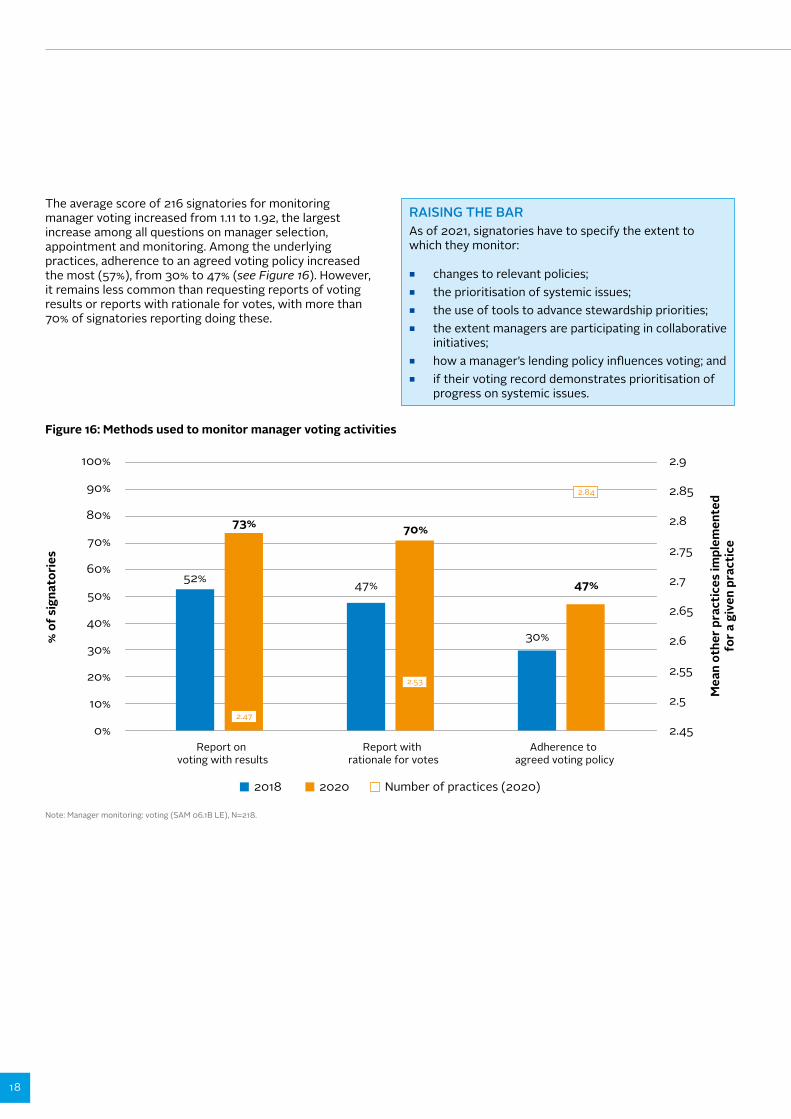
The average score of 216 signatories for monitoring manager voting increased from 1.11 to 1.92, the largest increase among all questions on manager selection, appointment and monitoring. Among the underlying practices, adherence to an agreed voting policy increased the most (57%), from 30% to 47% (see Figure 16). However, it remains less common than requesting reports of voting results or reports with rationale for votes, with more than 70% of signatories reporting doing these.
RAISING THE BARAs of 2021, signatories have to specify the extent to which they monitor:
■ changes to relevant policies; ■ the prioritisation of systemic issues; ■ the use of tools to advance stewardship priorities; ■ the extent managers are participating in collaborative
initiatives; ■ how a manager’s lending policy influences voting; and ■ if their voting record demonstrates prioritisation of
progress on systemic issues.
Figure 16: Methods used to monitor manager voting activities
% o
f sig
nato
ries
Mea
n ot
her p
ract
ices
impl
emen
ted
for a
giv
en p
ract
ice
Report with rationale for votes
Report on voting with results
Adherence to agreed voting policy
52% 47%
30%
70%
47%
2.45
2.5
2.55
2.6
2.65
2.7
2.75
2.8
2.85
2.9
0%
10%
20%
30%
40%
50%
60%
70%
80%
90%
100%
73%
2018 2020 Number of practices (2020)
2.47
2.53
2.84
Note: Manager monitoring: voting (SAM 06.1B LE), N=218.

THE EVOLUTION OF RESPONSIBLE INVESTMENT | 2021
19
THEMATIC INVESTMENTS AND SUSTAINABILITY OUTCOMESThe PRI asks signatories whether they make thematic (environmental or social) investments. Between 2016 and 2020, the proportion of signatories responding positively to this question grew from 36% to 47%, although there is a considerable difference between asset owners and investment managers (see Figure 17).
Separately, over 80% of signatories reported in 2020 that they consider climate risk in their investments, suggesting that taking climate action is now predominantly part of mainstream ESG incorporation practices. For climate action to be successful, investors also need to consider how their investments contribute to sustainability outcomes, as outlined in the PRI’s paper, Investing with SDG outcomes – a five part framework.
RAISING THE BARAs of 2021, signatories are expected to provide details of their ESG products/funds, such as the frameworks or tools used, the objectives or benchmarks used, the criteria applied, thresholds for universe construction and the AUM coverage. In addition, the focus has shifted from environmentally and socially themed investments to sustainability outcomes, thus asking signatories to move from making ad-hoc environmental or social investments to adopting a wider investment approach that consistently considers the sustainability outcomes of all their investments.
Figure 17: Investment in environmentally themed areas
Note: Strategy and Governance (SG 15.3), N=890 (242 asset owners, 648 investment managers).
PRI resources:
Investing with SDG outcomes – a five part framework
Bridging the gap: how infrastructure investors can contribute to SDG outcomes
36%
47%
31%
47%
61%
42%
0%
10%
20%
30%
40%
50%
60%
70%
Total Asset owners Investment managers
% o
f sig
nato
ries
2016 2020

20
IMPACT INVESTMENTSOne proxy for the uptake of impact investment is the number of signatories that mention the Sustainability Development Goals (SDGs) in their responses to various non-assessed, mostly optional, free-text questions in the Reporting Framework. In 2020, the fixed income module saw the largest proportion of signatories refering to the SDGs (33%), as certified green, sustainable, or other labelled bonds provide the opportunity and confidence to invest in and demonstrate SDG-aligned impact (see Figure 18). This was followed by the strategy and governance (21.6%) and infrastructure (15.3%) modules. The consideration of the SDGs in listed equity integration, engagement and voting (a very advanced practice for many non-governance issues) is nascent, with 9.6%, 4.6% and 1.0% of signatories respectively reporting doing so. Overall, the SDGs have moved from being on the radar of only 17 (1.6%) investors in 2016 to 650 by 2020 (31%).
RAISING THE BARAs of 2021, signatories have to report on whether they have identified sustainability outcomes from their activities, what tools they used to identify them, at what level this was done (e.g. country/ sector /asset) and how those were prioritised. Signatories can choose to provide details on their sustainability outcomes targets.
Figure 18: Percentage of signatories mentioning the SDGs by module in 2020
PRI r
epor
ting
fram
ewor
k m
odul
e
1.0%
4.6%
4.7%
7.1%
9.1%
9.6%
15.3%
21.6%
33.0%
0% 10% 20% 30% 40% 50%
Listed equity voting
Listed equity engagement
Property
Externally managed assets
Private equity
Listed equity incorporation
Infrastructure
Strategy and governance
Fixed income
Note: Percentage calculated based on signatories that reported on given module, ranging from 2099 (Strategy and Governance) to 170 (Property).

THE EVOLUTION OF RESPONSIBLE INVESTMENT | 2021
21
The uptake of advanced practices among signatories over the course of a few years is evidence of how quickly the investment industry can change.
As demonstrated from the usage of the data portal, asset owners frequently request the assessment reports of their current and potential investment managers and use them as part of their selection and monitoring processes.
In addition, the Reporting Framework helps investment managers – through their assessment reports – to engage with senior management, demonstrating that previously implemented changes are reflected in their scores and to identify where further improvements need to be made.
Going forward, signatories are expected to provide more detail on the processes they use across a range of responsible investment practices, and to start assessing their outcomes, when they report on their investment activities.
STEPPING UP PRACTICES THROUGH THE NEW REPORTING FRAMEWORK
By asking signatories to specify the coverage of AUM for which their practices apply to, the new Reporting Framework will provide better information on their responsible investment activities to investors, clients and beneficiaries.
Where the uptake of advanced practices remains low, the PRI has refined or changed the questions it asks signatories to better capture the different approaches they could take to achieve them, the preliminary steps required for those approaches and how they fit with the wider strategy of the reporting organisations.
Ultimately, the Reporting Framework aims to continue driving positive change in the investment industry, contributing to more sustainable markets and a more prosperous world for all.

22
APPENDIX
This report is based on analysis of scores from 2016, 2018 and 2020 across the following indicators. Only those which had the lowest initial score and the demonstrated the highest change were covered in more detail:
INDICATOR DESCRIPTION NUMBER OF RESPONDENTS
2016 MEAN
2018 MEAN
2020 MEAN
% (2016-2020)
FI 02.1 CNF ESG data sources (corporate bonds)
248 2.43 2.71 2.90 19%
FI 02.1 SSA ESG data sources (SSA bonds) 256 1.63 1.98 2.41 48%
FI 02.2 CNF ESG data sources (corporate bonds)
248 2.12 2.56 2.85 34%
FI 02.2 SSA ESG data sources (SSA bonds) 256 1.73 2.08 2.55 50%
FI 05 CNF Screening: examples (corporate bonds)
164 1.07 1.82 1.93 80%
FI 05 SSA Screening: examples (SSA bonds)
117 0.85 1.56 1.56 84%
FI 09 CNF Thematic bonds: ESG performance measurement (corporate)
34 1.38 2.00 2.41 74%
FI 09 SSA Thematic bonds: ESG performance measurement (SSA)
23 1.52 2.09 2.52 66%
FI 12 CNF ESG in research (corporate bonds)
155 2.74 2.83 2.95 8%
FI 12 SSA ESG in research (SSA bonds) 115 2.57 2.64 2.82 10%
FI 14 CNF AUM coverage of engagement: corporate bonds
212 0.74 1.09 1.60 118%
FI 16 CNF Separate engagement policy for fixed income
212 0.41 0.79 1.29 214%
FI 17 CNF Performance measurement: corporate bonds
213 0.76 1.23 1.49 96%
FI 17 SSA Performance measurement: SSA bonds
159 0.70 1.21 1.42 104%
LEI INT 02 Listed equity: data sources 316 2.56 2.78 2.91 14%
LEI INT 03 Listed equity: use of engagement/voting data in investment analysis
316 2.37 2.64 2.82 19%
LEI SCR 02 Listed equity: data sources 287 2.49 2.71 2.89 16%
LEI SCR 03 Listed equity: use of engagement/voting data in investment analysis
287 2.16 2.42 2.67 24%
SG 03 Conflicts of interest 903 2.72 2.86 2.92 8%
SG 05 Organisation-wide RI objectives 903 2.80 2.88 2.93 5%
SG 08a RI in objectives, appraisal and/or reward
903 1.73 2.10 2.37 19%
SG 08b RI in personal development and/or training plan
903 1.21 2.30 2.19 24%

THE EVOLUTION OF RESPONSIBLE INVESTMENT | 2021
23
INDICATOR DESCRIPTION NUMBER OF RESPONDENTS
2016 MEAN
2018 MEAN
2020 MEAN
% (2016-2020)
SG 11 Engagement with public policy makers
903 1.32 1.66 2.01 16%
SG 15.3 Investment in environmentally and socially themed areas
890 N/A N/A N/A N/A
SG 19a ESG disclosure to public – listed equity screening
287 1.68 1.98 1.95 16%
SG 19b ESG disclosure to client – listed equity screening
287 2.18 1.35 2.47 13%
SG 19a ESG disclosure to public – listed equity integration
316 1.59 2.06 1.98 24%
SG 19b ESG disclosure to client – listed equity integration
316 2.17 1.36 2.51 16%
SG 19a ESG disclosure to public – fixed income SSA
256 0.93 1.62 1.70 83%
SG 19b ESG disclosure to client – fixed income SSA
256 1.46 1.21 2.17 49%
SG 19a ESG disclosure to public – fixed income corporate
248 1.06 1.85 1.84 74%
SG 19b ESG disclosure to client - fixed income corporate
248 1.16 1.13 2.38 105%

24
It also analysed the scores from 2018 and 2020 across the following additionally assessed indicators:
INDICATOR DESCRIPTION NUMBER OF RESPONDENTS 2018 MEAN 2020 MEAN % (2018
-2020)
LEI SCR 06 Listed equity screening: confidence building
447 2.05 2.41 18%
SAM 02.1 LE Manager selection: overarching approach
342 2.29 2.61 14%
SAM 02.2A LE Manager selection: strategy 342 2.40 2.79 16%
SAM 02.2B LE Manager selection: people and capabilities
342 2.19 2.61 19%
SAM 02.2C LE Manager selection: investment processes
342 1.96 2.43 24%
SAM 02.3 Manager selection: documents considered
342 2.64 2.82 7%
SAM 02.4 LE Manager selection: targets 342 2.04 2.49 22%
SAM 03.1A LE Manager selection: engagement 228 1.61 2.22 38%
SAM 03.1B LE Manager selection: voting 216 1.57 1.93 23%
SAM 03.2 LE Manager selection: engagement effectiveness
228 1.54 2.04 33%
SAM 03.3 LE Manager selection: voting effectiveness
216 1.07 1.70 58%
SAM 04.3 LE Manager appointment: consequences for ESG underperformance
324 1.81 2.31 28%
SAM 06.1A LE Manager monitoring: engagement 228 1.49 2.17 46%
SAM 06.1B LE Manager monitoring: voting 216 1.11 1.92 73%
SAM 07 Manager monitoring: votes cast 216 0.88 1.45 66%
SAM 09.1 LE Manager selection/ appointment/ monitoring: Examples of ESG factors addressed
342 2.10 2.29 9%

THE EVOLUTION OF RESPONSIBLE INVESTMENT | 2021
25
CREDITSAUTHORS: Stephen Andrews, PRIThalia Vounaki, PRI
EDITOR:Jasmin Leitner, PRI
DESIGN: Will Stewart, PRI

The PRI is an investor initiative in partnership withUNEP Finance Initiative and the UN Global Compact.
United Nations Global Compact
The United Nations Global Compact is a call to companies everywhere to align their operations and strategies with ten universally accepted principles in the areas of hu-man rights, labour, environment and anti-corruption, and to take action in support of UN goals and issues embodied in the Sustainable Development Goals. The UN Global Compact is a leadership platform for the development, implementation and disclosure of responsible corporate practices. Launched in 2000, it is the largest cor-porate sustainability initiative in the world, with more than 8,800 companies and 4,000 non-business signatories based in over 160 countries, and more than 80 Local Networks.
More information: www.unglobalcompact.org
United Nations Environment Programme Finance Initiative (UNEP FI)
UNEP FI is a unique partnership between the United Nations Environment Programme (UNEP) and the global financial sector. UNEP FI works closely with over 200 financial institutions that are signatories to the UNEP FI Statement on Sustainable Development, and a range of partner organisations, to develop and promote linkages between sustainability and financial performance. Through peer-to-peer networks, research and training, UNEP FI carries out its mission to identify, promote, and realise the adoption of best environmental and sustainability practice at all levels of financial institution operations.
More information: www.unepfi.org
The Principles for Responsible Investment (PRI)
The PRI works with its international network of signatories to put the six Principles for Responsible Investment into practice. Its goals are to understand the investment implications of environmental, social and governance (ESG) issues and to support signatories in integrating these issues into investment and ownership decisions. The PRI acts in the long-term interests of its signatories, of the financial markets and economies in which they operate and ultimately of the environment and society as a whole.
The six Principles for Responsible Investment are a voluntary and aspirational set of investment principles that offer a menu of possible actions for incorporating ESG is-sues into investment practice. The Principles were developed by investors, for inves-tors. In implementing them, signatories contribute to developing a more sustainable global financial system.
More information: www.unpri.org


