Page 1
University of South CarolinaScholar Commons
Senior Theses Honors College
Spring 2019
The Evolution of State Higher Education PublicFunding PolicyAngela RogersUniversity of South Carolina, [email protected]
Follow this and additional works at: https://scholarcommons.sc.edu/senior_theses
Part of the Finance Commons, Political Economy Commons, and the Public EconomicsCommons
This Thesis is brought to you by the Honors College at Scholar Commons. It has been accepted for inclusion in Senior Theses by an authorizedadministrator of Scholar Commons. For more information, please contact [email protected] .
Recommended CitationRogers, Angela, "The Evolution of State Higher Education Public Funding Policy" (2019). Senior Theses. 266.https://scholarcommons.sc.edu/senior_theses/266
Page 2
1
THE EVOLUTION OF STATE HIGHER EDUCATION PUBLIC FUNDING POLICY
By
Angela M. Rogers
Submitted in Partial Fulfillment of the Requirements for
Graduation with Honors from the South Carolina Honors College
May 2019
Approved:
Dr. Susan Miller Director of Thesis
Ms. Endra Curry Second Reader
Steve Lynn, Dean
For South Carolina Honors College
Page 3
2
Abstract
In the past several decades, public colleges and universities have increasingly struggled
to fund all of the programs demanded of them as states slowly drain funding from their coffers.
This discussion will examine different policies and frameworks that have been used by states to
determine funding for their public institutions. Different factors that will be considered include
political relationships, governance structures, and accountability models. The political trend of
“free college” will also be considered. Then, the discussion will narrow to South Carolina
funding policy, how it has changed over the years, and what the current challenges are. A policy
proposal for South Carolina will conclude the argument.
Page 4
3
Table of Contents
Introduction………………………………………………………………………………….Page 4
Part 1: A Historical View of Higher Education Funding……………………………………Page 5
Part 2: Approaches and Models of Higher Education Funding……………………………..Page 8
Section A: The Tandberg Fiscal Policy Framework……………………………..….Page 8
Section B: Political Relationships………………………………………………….Page 11
Section C: Governance Structure…………………………………………………..Page 12
Section D: Accountability Models…………………………………………………Page 12
Part 3: “Free College”……………………………………………………………………...Page 14
Part 4: South Carolina, A Case Study……………………………………………...………Page 17
Part 5: Running the University of South Carolina’s Budget……………………………….Page 24
Part 6: Proposed Solutions for SC……………………………….…………………………Page 29
References………………………………………………….………………………………Page 33
Page 5
4
The Evolution of State Higher Education Public Funding Policy
In roughly the past fifty years, higher education has gone from being an optional luxury
to a mandatory stepping stone. Supply and demand for higher education institutions has
exploded. The number of students enrolled in a college or university increased by roughly 240%
between 1965 and 2016 (Statista, 2018). The rate of increase is still significant. Just between
2000 and 2016, enrollment increased by 28% (National Center for Education Statistics (NCES),
2018). Funding colleges and universities went from a B-list policy issue to one of massive
importance. However, despite the rapidly growing demand, investment in higher education has
gone down consistently since 1980 (Mortenson, 2012). State funding has decreased on average
by 40.2% between 1980 and 2011. While two states (Wyoming and North Dakota) have
increased or maintained their portion of funding, the remaining forty-eight states have cut their
funding by 14.8 to 69.4%. South Carolina specifically has decreased its investment by 66.8%
during that time period. If we project a continuation of this trend, higher education nationwide
will be privatized (i.e. have no public funding) by 2059. South Carolina will hit zero public
funding in 2031 (Mortenson, 2012).
As a college degree becomes more and more expected for young professionals, demand
has become more inelastic. Students (and their families) are more willing to pay whatever it
takes to get a college education. The combination of increased inelastic demand, evaporating
state support, and demand for more services, among other factors, has led schools to increase
tuition. Since 1980, tuition has increased by 247% at flagship universities, 230% at state
universities, and 164% at community colleges (Moretenson, 2012). Private schools too have
seen a stark increase. Since 1988, tuition has increased 129% at the average private nonprofit
institution (Martin, 2017).
Page 6
5
Additionally, schools have an incentive to enroll fewer low-income students and focus
their efforts on recruiting students who can afford higher tuition. State schools desire non-
resident students because out-of-state tuition is usually two to three times more than what state
residents pay (Mortenson, 2012). The cost burden has effectively been transferred from the state
to the individual. In 1975, local and state funding covered 60.3% of all the money spent on
higher education. By 2010, that proportion decreased to 34.1%. The leftover portions have to be
covered by students in the form of tuition and the federal government in the form of grants
(Mortenson, 2012).
In the past several political cycles, divergent policy positions have been thrown around.
Should all public institutions be free or heavily subsidized? Should states offer scholarships to
students or give money directly to universities? Should the current funding trend continue until
all schools are privatized? The arguments in response to these questions change dramatically
depending on party, state, and structure.
This discussion will provide an understanding of where higher education funding policy
has been, where it is now, and where it may be going. It will examine different funding models
and types of state appropriations. It will begin with a broader focus of the nation and then
narrow down to look specifically at South Carolina. The discussion will conclude with a policy
proposal for South Carolina and suggestions of how the state can sustainably continue to provide
public higher education in an affordable, equitable way.
Part 1: A Historical View of Higher Education Funding
As discussed, the cost of higher education has increased exponentially. In fact, the
expense of higher education has consistently grown faster than both income levels and the
national cost of living. From 1875 to 1930, the cost increase was because of investment; as
higher education became more accessible to the masses, supply had to grow to keep up. New
Page 7
6
schools were founded, and existing schools expanded to try to meet the demand (Kimball &
Luke, 2018). However, after 1930 the cost continued to grow even though demand had started to
level out. There are two predominant theories for why this was.
The first model is the Revenue Theory of Cost. Basically, this argument is that operation
costs were set by how much money the school was able to raise rather than by actual need. This
begins a vicious cycle. Costs increase because more money can be feasibly raised, but in the
future more money must be raised because costs have increased. Once this cycle begins it’s
almost impossible to reverse (Kimball & Luke, 2018).
The second model is the Cost Disease Theory. In the past 200 years, the goods-
producing industries have seen massive increases in productivity. The introduction of new
technologies and manufacturing practices have meant that more goods can be produced with
fewer man hours, thus decreasing production costs. Personal services like education, however,
have not seen the same productivity increase. For the most part, teaching an introductory math
class requires the same number of teacher hours now as it did a century ago. While technology
is just starting to change the education landscape, the industry just has not seen the same
efficiency improvements that goods producing industries did. However, even with productivity
stagnant, compensation still has to stay on pace across industries, so production cost in personal
industries continues to increase (Kimball & Luke, 2018).
So now we have some idea of why costs may have increased so rapidly, but what made
states divest during that time? In the past several decades we have seen the most aggressive
changes in how states fund higher education. The average funding per student has dropped more
than 30% in the past 30 years. This decrease must be made up for in increases in tuition and
decreases in spending. Research says that the pass-through rate is roughly 25.7%. This means
that for every $1,000 reduction in appropriations, the average student will pay $257 more per
Page 8
7
year. The rate has fluctuated between 18.3 to 26.6% but has increased over time (Webber,
2017). Tuition increases have barely offset the long-run decline in appropriations per full time
equivalent student (FTE). State funding per FTE peaked in fiscal year (FY) 1987 at $7,993 but
has fallen to an average of $6,454 in 2010. The sum of net tuition revenue and appropriations
per FTE was roughly the same in that same time period, meaning tuition went up the same
amount as appropriations went down (Ehrenberg, 2012). Of course, this increase in tuition
means that many students will require more aid. In 2010, states spent $242.50 per resident for
higher education operating expenses, $29.60 per resident for grants, and $28.10 per resident for
need-based aid (Lowry, 2016).
Unsurprisingly, state funding took the biggest hit during the 2008 recession. As states
needed to spend more on safety net programs, education budgets took a hit (Tandberg, 2010).
However, states did not fully reinvest in higher education once the economy rebalanced. Public
divestment led to massing increases in tuition and cuts in services (Webber, 2017). State dollars
per FTE fell 23% between 2007-2012 and net tuition increased 19% around the same time
(Kimball, 2014). The cost burden once again shifted more from the state to the student.
In fact, higher education is often the first state budget to be slashed during economic
hardships or periods of shifting priorities because institutions are usually able to make up the
difference with tuition increases, endowment, more out-of-state students, and deferred
maintenance (Tandberg, 2010; Kimball, 2014). Indeed, higher education can serve to balance
the state budget in times of need. According to the National Association of State Budget
Officers, “…in fiscal 1995, higher education comprised 12.9 percent of general fund spending,
while in fiscal 2018, higher education made up an estimated 9.7 percent of general fund
expenditures. Over that same period, Medicaid went from representing 14.4 percent of general
fund spending to 20.2 percent,” (NASBO, 2018). The state can pump more money into
Page 9
8
education during economic upswings (and enjoy the political benefit) and make deep cuts when
the money is required elsewhere. In fact, economic conditions are the best predictor of budget
cuts regardless of other factors like political environment and governance structure (Kimball,
2014).
(Figure 1. Graph depicting the decrease in higher education funding as a share of total
state spending. Adapted from “Politics, Interest Groups and State Funding of Public
Higher Education” by D.A. Tandberg, 2010, Research in Higher Education, 51(5), p.
416. Copyright 2010 by Springer Science + Business Media, LLC.)
Part 2: Approaches and Models of Higher Education Funding
Section A: The Tandberg Fiscal Policy Framework
In this section, we will examine a variety of different models that have been researched
and tried in different contexts. The first is the Tandberg Fiscal Policy Framework. This model
argues that political actors are motivated by self-interest but impacted by their environment.
Attributes that affect the environment include interest groups, political factors, government
Page 10
9
institutions, state higher education priorities, economic demographics, political culture, and
budgetary demands (Tandberg, 2010). Let us examine several of these individual factors.
(Figure 2. Tandburg’s Fiscal Policy Framework. Adapted from “Politics, Interest Groups
and State Funding of Public Higher Education” by D.A. Tandberg, 2010, Research in
Higher Education, 51(5), p. 416. Copyright 2009 by SAGE Publications.)
Interest groups can have a very powerful impact on state policy outcomes and spending
priorities. These groups are most successful when there are only a handful in the area but are
concentrated around a particular policy area and have significant economic power. It’s important
to note that higher education institutions themselves act as interest groups. Most (if not all) have
teams that engage in lobbying to compete for limited dollars (Tandberg, 2010).
Page 11
10
Economic and demographic makeup are also big motivating factors. States with younger
populations tend to fund higher education more fully. Additionally, Democrats tend to look
much more favorably upon higher education than Republicans—56% of liberals are confident in
U.S. colleges while only 33% of Republicans are (Pew Research Center, 2017). Also, when a
large portion of the population is below the Pell grant level of income, states fund higher
education less because it doesn’t have the tax base to support it and education largely goes to
benefit the rich anyway (Tandberg, 2010) . As expected (and demonstrated in the Great
Recession), support is also decreased in times of economic stress and higher unemployment
(Tandberg, 2010).
(Figure 3. Fiscal policy framework variables. Adapted from “Politics, Interest Groups
and State Funding of Public Higher Education” by D.A. Tandberg, 2010, Research in
Higher Education, 51(5), p. 416. Copyright 2009 by SAGE Publications.)
Page 12
11
Interestingly, the makeup of the legislature (beyond political party) also plays a part.
Legislative professionalism (i.e. to what extent the state legislature is like Congress in terms of
staffing, compensation, time in session, etc.) is correlated with policy innovation and greater
general spending. Unsurprisingly, when legislatures are campaigning in more competitive races,
they tend to support positions that will help the widest range of constituents, which is in line with
the Median Voter Theorem (Toutkoushian & Hollis, 2006). Also, districts that have a greater
voter turnout elect more responsive representatives and they tend to support higher education
funding (Tandberg, 2010).
Section B: Political Relationships
The focus of other funding models is how political relationships drive spending
outcomes. The relationship between the State Higher Education Executive Officer (SHEEO) and
the governor directly influences the amount of state support to the higher education system in
general. (For SC, the SHEEO is currently Michael LeFever, the interim President and Executive
Director of the Commission for Higher Education.) In most states, the SHEEO plays the role of
policy advisor. He or she recommends resource allocation, oversees regulations, awards grants,
and is accountable for the performance of public institutions. In comparison, the governor has
tremendous influence regarding the budget (Tandberg, Fowles & McLendon, 2017). The
SHEEO (along with every other department head, institution, and person impacted by the
budget) attempts to influence the governor to look upon his or her agency generously. The
notable issue, however, is that the SHEEO (and many other important executives) is appointed
by the governor and is subject to termination by the governor as well. This incentivizes the
SHEEO to find personal favor with the governor to protect his or her job and policy
concentrations. This leaves room for conflicts of interest and other relationship concerns that
Page 13
12
likely will not lead to the most equitable or accountable distribution of funds (Tandberg, Fowles
& McLendon, 2017).
Section C: Governance Structure
Another theory says the type of education governance structure can make a big difference
in the way states manage their public institutions. Each state has some sort of higher education
board involved in organizing public institutions and setting policy within those schools. Board
members can be appointed, elected, or some mix of both. South Carolina board members are
appointed by the legislature (Mann, 2017). Typically, there are three different structures that can
yield different results (Knott & Payne, 2003). The first is a centralized board that usually favors
strong regulation, low tuition, and broad access. In 2003, 75% of students enrolled in public
education were a part of a multi-campus or consolidated governance system under a single
board. Governors tend to favor this structure because it makes it easier to coordinate across
functions to satisfy a broad constituency. In contrast, legislators tend to prefer a decentralized
board with individual university managers focused on research, publication, and external grants.
This fragmented management structure separates control so that legislators can try to cater to
narrower constituencies and special interest groups. Experts and education professionals tend to
prefer decentralization as well, as it gives them the most control. Additionally, there tend to be
more resources and a higher level of productivity associated with this type of system. The final
structure is a hybrid of the two. This allows more focus on low tuition and larger undergraduate
population than decentralized systems and more emphasis on research and grants than
centralized structures (Knott & Payne, 2003).
Section D: Accountability Models
By far the most prevalent funding model used by states is the accountability or
performance funding model. Driven by wasteful spending and corruption, current politics
Page 14
13
demand that politicians and agencies be accountable for every dollar of taxpayer money that they
spend. Additionally, performance-based funding makes it much easier for political leaders and
the public to evaluate agencies. In theory, this makes budgeting less political and more merit
based (Kimball, 2014). However, decisions are not made in political vacuums and performance
metrics are rarely used in a neutral way. Agencies are able to manipulate their data in the short
term to protect their interests. There is incentive to game the system. Even if metrics were
completely reliable, it’s unclear if poor performance should lead to more or less funding
(Kimball, 2014).
There are three main types of accountability policies. The first is performance reporting;
the government will collect data, but they will not be used to influence the budget. Performance
budgeting takes it a step further. Data are considered when developing the budget, but there is
no formal benchmark or requirement. Finally, performance funding is the most extreme. In this
case, some percentage of funding is linked directly to performance (Kimball, 2014).
There are several issues associated with performance funding. The first is the most
crucial: it’s not effective. Different states use different metrics—graduation rate, retention rate,
degree production, undergraduate population, student diversity—but research has shown that
none of those metrics improve when you base the budget on them. Furthermore, legislators still
privilege institutions to which they have close personal ties, so the idea that performance funding
removes political bias is debunked. Overall, institutions become more concerned with
overcoming political bias than improving their metrics (Kimball, 2014).
One major unintended consequence of performance funding models is equity for minority
serving institutions (MSIs). MSIs enroll about 25% of all college students but about 75% of
minority students and students who attend are generally less affluent. They produce similar
results to non-MSIs in terms of degree completion. Between 2005 and 2015, twenty-one states
Page 15
14
adopted or redesigned some version of performance-based funding. They rewarded the number
of degrees awarded, the number of transfer students, retention rates, course completion, job
placement, and research funding. In other words, they paid for outputs rather than inputs. These
requirements were standardized across institution types but MSIs were disproportionately
affected. The average MSI lost $750 per FTE when compared to other schools. They responded
by decreasing student to faculty ratios and other support and raising tuition (Hillman & Corral,
2017). While these outcomes were certainly not intended, they give just one example of how
biased and ineffective these models can be.
Looking across all kinds of schools in all states, however, the overall differences in
spending based on funding are smaller because the majority of states have divested in higher
education and schools have had to rely more on private funding (Kimball, 2014). Indeed, there
has been a major trend towards privatization or diversification of funding. If nationwide trends
seen since 1980 continue, higher education will be completely privatized by 2059 (Mortenson,
2012). This trend has been seen in two ways: through a direct increase in private funds and a
decreased reliance on public revenue and appropriations. Some schools have tried to decrease
reliance on public funds because of the amount of regulation and hoop jumping that comes with
the money (Kwiek, 2017). Some schools have supplemented their income with the pursuit of
economic activity in the form of contract research and more additional fees for activities
(Stachowiak-Kudla & Kudla, 2017). Regardless of how they do it, without education funding
reform, universities will be forced to find other ways to fund themselves in the very near future.
Part 3: “Free College”
A recent buzzword in education politics is “free college”. While this idea was relevant in
some states prior to 2016, a potential Democratic presidential nominee, Bernie Sanders, made
free college one of his major policy points during his campaign. Most politicians have
Page 16
15
disregarded the idea as too expensive and unobtainable, but some states have tried out programs
to assist students with the cost of higher education.
States have three ways they can attempt to make college education more attainable: they
can find ways to make school more affordable; they can make it possible to transition across
institutions without loss of credits; or they can make higher-quality education available for more
residents (Perna, Leigh & Carroll, 2017). Indeed, over a dozen states now offer grants to pay for
all or some of college in some way (Turner, 2018). Legislators have to choose between boosting
appropriations, grants, or financial aid. More professional legislatures have more grants and
financial aid. The number of grants offered decreases as the number of governing boards
increases (as discussed in the previous model) but financial aid does not (Lowry, 2016). Overall,
most assistance comes in the form of grants. In FY 2014-15, 20% of all higher education
funding was in the form of direct grants to students on the basis or merit, need, or both (Perna,
Leigh & Carroll, 2017). To see what different states have tried, let’s take a look at some of the
different programs that have been implemented.
The first is the Tennessee Promise. This program covers tuition and fees for community
or technical colleges for Tennessee residents who graduated from in-state high schools. In
general, Tennessee is notably favorable towards state sponsored aid programs and they have
sixteen other scholarships, grants, and aid options (Perna, Leigh & Carroll, 2017.).
A similar option is the Oregon Promise, which offers tuition for up to ninety credits
(about three years full time) of community college for Oregon high school graduates. A prior
version of the program had a higher level of emphasis on need-based aid (Perna, Leigh &
Carroll, 2017). However, in the first year of the new program, less than half of the participants
were needy enough to qualify for a Pell Grant (Turner, 2018).
Page 17
16
One of the handful of programs that includes four-year schools is the New York
Excelsior Scholarship. Recipients are eligible for up to $5,500 per year for full time tuition at
two- or four-year public colleges or universities. While it is not purely need-based, that factor is
taken into consideration. New York, like Tennessee, is very generous with its aid programs and
it has twenty other programs, most of them need-based (Perna, Leigh & Carroll, 2017).
The oldest program by far is the 21st Century Scholars Program in Indiana, which is
nearly thirty years old. The program covers tuition for a two- or four-year degree at a public or
private school. Students may be eligible for additional funding to cover cost of living. Middle
school students who qualify for free or reduced lunch can apply for this program as early as
seventh grade. If they meet a series of requirements over the course of high school, including
keeping a B grade average, then they will qualify for the program when they graduate (Turner,
2018).
As expected, it is impossible to fund these programs indefinitely (Perna, Leigh & Carroll,
2017). In fact, Indiana’s 21st Century Scholars Program costs a remarkable $160 million per
year (Turner, 2018). Less generous programs obviously cost less, but it is challenging for
legislators to justify extremely expensive projects that won’t impact broad swaths of their
constituency and won’t see results for several years.
The Education Trust recently reviewed fifteen statewide programs to determine if they
met certain criteria focused on increasing educational equity. The criteria are whether the
program funds four years of tuition for a bachelor’s degree; assistance in cost of living; inclusion
of adult, non-traditional, and part-time students; no GPA requirement above a 2.0; and that funds
do not convert to a loan if criteria are not met. This study on “free college” programs found “that
states vary wildly in how they define both ‘free’ and ‘college’,” and none met all of the criteria
they were seeking (Turner, 2018).
Page 18
17
(Figure 4. The Education Trust’s variables and evaluation of various college assistance
programs. Adapted from “If ‘Free College’ Sounds Too Good To Be True, That’s
Because It Often Is” in National Public Radio, by C. Turner, 2018, Retrieved November
12, 2018 from https://www.npr.org/sections/ed/2018/09/12/643673271/if-free-college-
sounds-too-good-to-be-true-that-s-because-it-often-
is?utm_source=npr_newsletter&utm_medium=email&utm_content=20180916&utm_ca
mpaign=ed&utm_term=nprnews. Copyright 2018 by National Public Radio.)
Part 4: South Carolina, A Case Study
Page 19
18
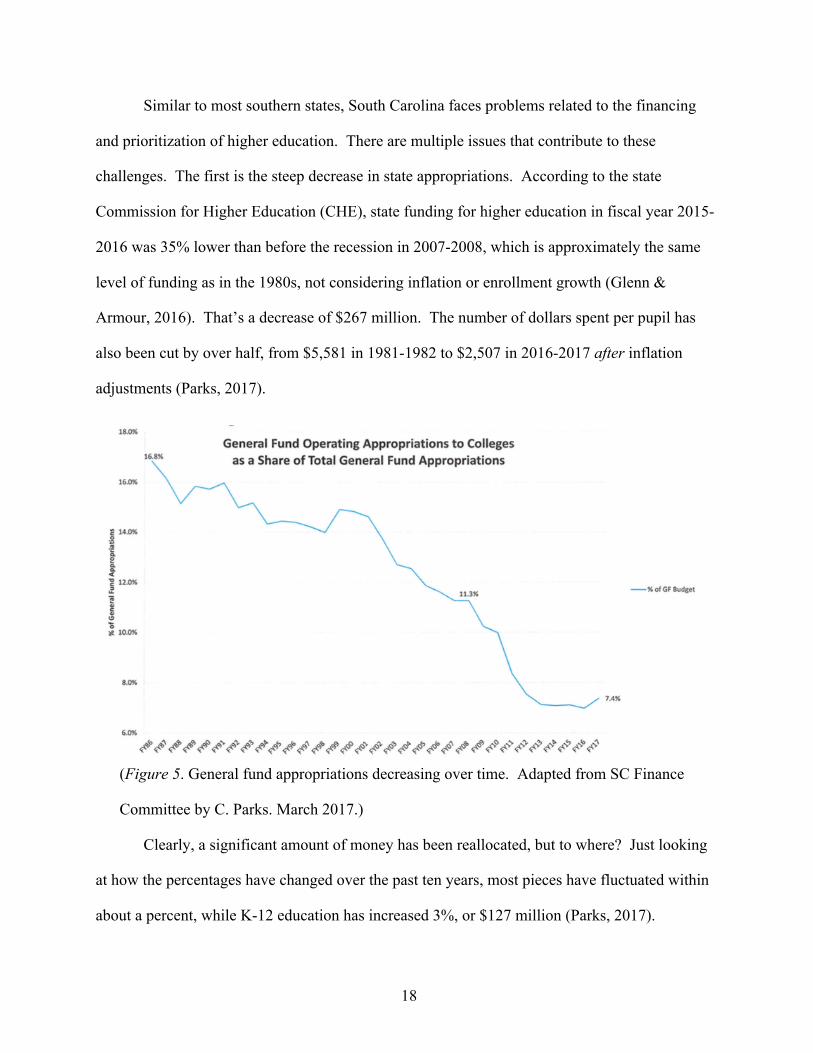
Similar to most southern states, South Carolina faces problems related to the financing
and prioritization of higher education. There are multiple issues that contribute to these
challenges. The first is the steep decrease in state appropriations. According to the state
Commission for Higher Education (CHE), state funding for higher education in fiscal year 2015-
2016 was 35% lower than before the recession in 2007-2008, which is approximately the same
level of funding as in the 1980s, not considering inflation or enrollment growth (Glenn &
Armour, 2016). That’s a decrease of $267 million. The number of dollars spent per pupil has
also been cut by over half, from $5,581 in 1981-1982 to $2,507 in 2016-2017 after inflation
adjustments (Parks, 2017).
(Figure 5. General fund appropriations decreasing over time. Adapted from SC Finance
Committee by C. Parks. March 2017.)
Clearly, a significant amount of money has been reallocated, but to where? Just looking
at how the percentages have changed over the past ten years, most pieces have fluctuated within
about a percent, while K-12 education has increased 3%, or $127 million (Parks, 2017).
Page 20
19
(Figure 6. General fund appropriations sector breakdown. Adapted from SC Finance
Committee by C. Parks. March 2017.)
A couple years ago, I interviewed Craig Parks, formerly a Senior Research Analyst for
the Senate Finance Committee specializing in higher education funding and currently the
Director of Governmental Affairs for the University of South Carolina. When asked why more
money was being allocated to K-12 funding, he said, “It’s largely because of tax policy. South
Carolina prides itself in being a low tax state, and we won’t raise taxes just to help a small
segment of the population trying to go to college. The way some see it, higher education is a
privilege, while K-12 education is seen as a constitutional right. Scarce dollars need to go
towards constitutional rights first,” (Parks, 2017).
Page 21
20
What does this decrease in funding do to tuition rates? While tuition has been rising for
decades, state tuitions rates have increased particularly sharply in the past ten years. In-state and
out-of-state tuition for four-year South Carolina universities has gone up roughly 50% since
2007-2008, from $7,887 to $11,525 and from $16,957 to $25,425 respectively (Glenn &
Armour, 2016). Comparing South Carolina to the rest of the nation is equally disheartening.
While the average tuition for in-state universities in 2013-2014 was $7,500 for the nation, South
Carolina’s average was almost at the very top of the list at $10,100, a remarkable 35% more
(Park, 2017). Future projections of average nationwide college-costs are even more
disheartening. Kal Chany, the author of How to Pay for College Without Going Broke, did some
calculations based on the current national trends and inflation rates, and he found that the
average cost of an in-state education would likely cost over $40,000 per year in 2030
(Landsman, 2012).
(Figure 7. Projected tuition increases for different institution types. Adapted from
CNBC, by S. Landsman. Retrieved 19 November, 2018 from
https://www.cnbc.com/id/47565202. Copyright 2018 by CNBC LLC.)
It doesn’t make sense that at 35% decrease in state allocations should lead to a 50%
increase in tuition. So where did the extra dollars go? The disparity comes from a change in
how the state dollars are being spent. In the past thirty years, the funding trend has moved away
Page 22
21
from direct support of institutions towards scholarship funding. Whereas the state used to give
each school a certain amount of money to fund operations, maintenance, salaries, scholarships
and more, South Carolina now puts more dollars into funding merit scholarships, like the
Palmetto Fellows, LIFE, and HOPE scholarships. Mr. Parks describes this as the free market
approach. Students earn scholarships based on their GPA and standardized test scores and they
can take that money to whichever school they choose, public or private. However, this means
that state schools get fewer dollars than they were getting before (since some of those
scholarship winners are going to private schools), and thus must raise tuition to be able to pay
their professors and maintain their buildings (Parks, 2017).
From FY 2000 to 2016, there was a more than 23% drop in funding for operational costs
and a 453% increase in scholarship and grant funding, about three quarters of which went
towards Palmetto Fellows, LIFE, and HOPE (Parks, 2017). Since 2000, funding for merit awards
has increased 12% a year, while need-based funding has increased only 4% per year (Parks,
2017). Additionally, the average merit award covers a bit over a third of in-state tuition while
need-based awards cover just over a tenth (Parks, 2017). Finally, the three merit awards benefit
majority white students; anywhere from 51% to 85% of recipients are white as of 2015 (Parks,
2017). The need-based funding is closer to 50% white, 50% non-white students (“Summary
Report”, 2006). The figure below clearly shows the increase in scholarship funding
disproportionately supports high-achieving students in a proportion much higher than the rest of
the state and nation (Parks, 2017).
Page 23
22
(Figure 8. Need and merit based aid in SC compared to US. Adapted from SC Finance
Committee by C. Parks. March 2017.)
In order to try to benefit more students, the Department of Education changed the K-12
grading scale from a seven-point scale to a ten-point scale for all public schools so that more
students would qualify for the state merit scholarships. Roughly 12,000 more students, out of
160,000 in the state, became eligible, costing about $88 million over four years. While it is
positive that more students are getting aid to go to school, it is questionable whether that $88
million dollars should go to benefit only 7.5% of the student population (Parks, 2017).
Additionally, this is only a patch solution. Grade schools cannot keep changing the grading scale
to benefit more students financially; ultimately, there will always be a majority who are
disadvantaged by this shift in the system.
Since scholarship money is scarce, and tuition rates have increased, and students are
forced to take out more debt in order to get an education. This is a particularly pertinent problem
in South Carolina. As higher education has become more of a necessity in the working world, an
increasing number of students who perhaps would not normally have gone to a four-year
Page 24
23
institution feel obligated to get a bachelor’s degree. These students are the ones most impacted
by the debt brought on by high tuition rates, as many of them do not qualify for merit funding.
Even for the students who do qualify for merit aid, the HOPE scholarship has a value of $2800
total, the LIFE is $5,000 per year, and the Palmetto Fellowship is $6,700-7,500 per year. Need-
based aid is maxed out at $2,500 per year. These funds are helpful but cover a third to a half (at
most) of in-state tuition, which means that students still need to take out debt (Glenn & Armour,
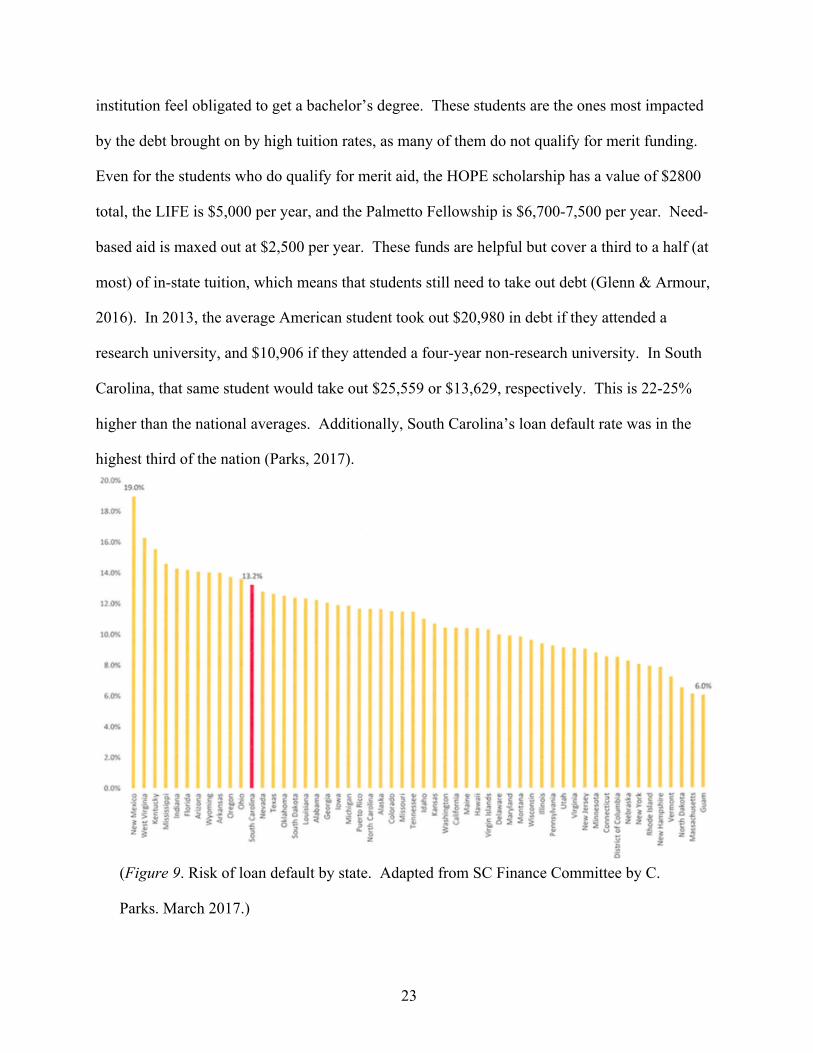
2016). In 2013, the average American student took out $20,980 in debt if they attended a
research university, and $10,906 if they attended a four-year non-research university. In South
Carolina, that same student would take out $25,559 or $13,629, respectively. This is 22-25%
higher than the national averages. Additionally, South Carolina’s loan default rate was in the
highest third of the nation (Parks, 2017).
(Figure 9. Risk of loan default by state. Adapted from SC Finance Committee by C.
Parks. March 2017.)
Page 25
24
This leaves countless students paying for their degree for decades to come, which was not a
common problem only a generation ago.
When the education lottery was started in 2002, it was designed to be a supplement to
funding already in place supporting K-12 and higher education. There was a specific promise
made that money generated by the lottery would not replace current funding. This means that
lawmakers would not reallocate current education funding with the expectation that the lottery
would just fill the gap. However, the Legislative Audit Counsel recently released a report
showing that over the course of the lottery’s lifetime, $2.1 billion has been replaced (Daprile,
2018). According to Wes Hickman, South Carolina spokesman, “The only way to help us freeze
tuition or slow tuition growth is through increased funding to the higher institutions that pay for
operational expenditures. In fact, the [audit] makes that exact point. The authorizing legislation
for the lottery says that funds must supplement, not supplant, the funding levels for higher
education that existed at the time. However, as we’ve been saying for years and the [audit]
concludes, that’s exactly what has happened” (Daprile, 2018).
The Attorney General says that the legislature is allowed to contradict a state statute
when allocating taxpayer money, however. The money that has been marked for education must
be spent on education, but what exactly is included in that is flexible. Lottery money has thus
been divided between funding merit-based scholarships like the LIFE, HOPE, and Palmetto
awards and basic needs like technology and textbooks that are supposed to be paid for through
appropriations (Daprile, 2018).
Part 5: Running the University of South Carolina’s Budget: Interviews with
Administrators
On September 18, 2018, Leslie Brunelli, USC’s Vice President for Finance and Chief
Financial Officer, and aforementioned Craig Parks, formerly a SC Senate Senior Budget Analyst
Page 26
25
and current Director of Government Relations for USC, sat down with me to discuss the practical
challenges that they face in running the university on a daily basis. We discussed how funding
policy has changed over their careers, the current attitudes towards higher education, and how
they see the future being funded.
The University of South Carolina was never really a completely public university. At the
recent height of state funding, the government provided 35-40% of the annual operating budget,
whereas now that number is closer to 10-20% (10% of the total budget, 20% of the operating
budget). The biggest hit, unsurprisingly, came from the recession, but the funding was never
quite replaced.
(Figure 10. USC System Total Budget Breakdown. Adapted from USC Columbia
Finance & Facilities Overview, September 2018.)
Actually, the total number of dollars being spent on higher education hasn’t changed so
dramatically, but they have shifted away from funding operations to funding scholarships.
Brunelli thinks that scholarships are positive; they encourage faster graduation, they incite hard
work, and they make education more attainable. The problem is that students can (and do) lose
Page 27
26
scholarships. There is only a 72% retention rate for LIFE Scholarships from freshman to
sophomore year. Scholarship retention requires a high GPA and other challenging requirements,
and students can have a challenging time meeting those expectations, particularly in their first
year out of high school. This means that students face stress regarding if they will be able to
make their necessary tuition payments.
The previously outlined state funded scholarships (need and merit based) are available to
students who go to private colleges as well. In fact, $58 million goes to private institutions every
year in the form of state funded scholarships. The fact of the matter is that private schools are
expensive, and students qualify for much more need-based funding if they attend a private school
even if their overall costs would be lower if they attended a public school.
According to Parks, the attitudes surrounding higher education in South Carolina (and the
South in general) are unique. Higher education is seen as a transactional good (benefiting the
individual), not a public good (benefiting the public at large). Thus, some think it should be paid
for by the individual and not the state.
Furthermore, technical colleges are viewed more favorably because ideally graduates can
go straight into a job ready and able to work. The problem with this idea, however, is that these
graduates need to be retrained over time. Brunelli challenges the idea that four-year college
graduates are not ready for the work force. She advocates for the idea that higher education
teaches students how to learn, and they can then keep up with a changing job market that
requires diverse skill sets.
Having a well-trained, well-educated work force is a benefit for the whole community,
not just the individual, but that’s not the common perception of legislators. While the state is
committed to maintain funding, it currently has no intentions to expand any programs and money
Page 28
27
has actually been leaking from programs over time (see the discussion on the education lottery
above).
Brunelli and her finance team struggle to do a lot with a little. Most programs are not
deeply funded, and long-term issues are falling through the cracks. Some classes are large,
professors are teaching more classes, there are fewer administrative staff, and buildings may not
be properly maintained. South Carolina has not had a capital bond bill since the 1999-2000
fiscal year. Bond bills are loans that the state takes out on behalf of state or private entities. For
example, South Carolina sometimes takes out bond bills to encourage large corporations like
Boeing and BMW to build plants. These bills are relatively common for higher education
nationwide, but not in South Carolina. In the past 50 years, South Carolina has taken out $2.5
billion in bond bills over all sectors. North Carolina took out $3 billion in one year for higher
education alone.
Even though there is limited financial support for capital projects, there are still major
rules and regulations the university must meet. This combination makes capital projects a major
challenge. Any building project that costs more than $1 million takes eighteen to twenty-four
months to be approved by the state after it has already gone through USC’s rigorous approval
process. According to Brunelli, discussions surrounding the new law school started in 1999 and
its doors just opened in 2017. Smaller projects, like the renovation of the old law school, are in
the works four to five years before they open. This might be understandable if the state were
undertaking the full cost, but the state is only contributing $10 million of the project’s $80
million price tag. This means that the university must take on its own debt to fund projects. The
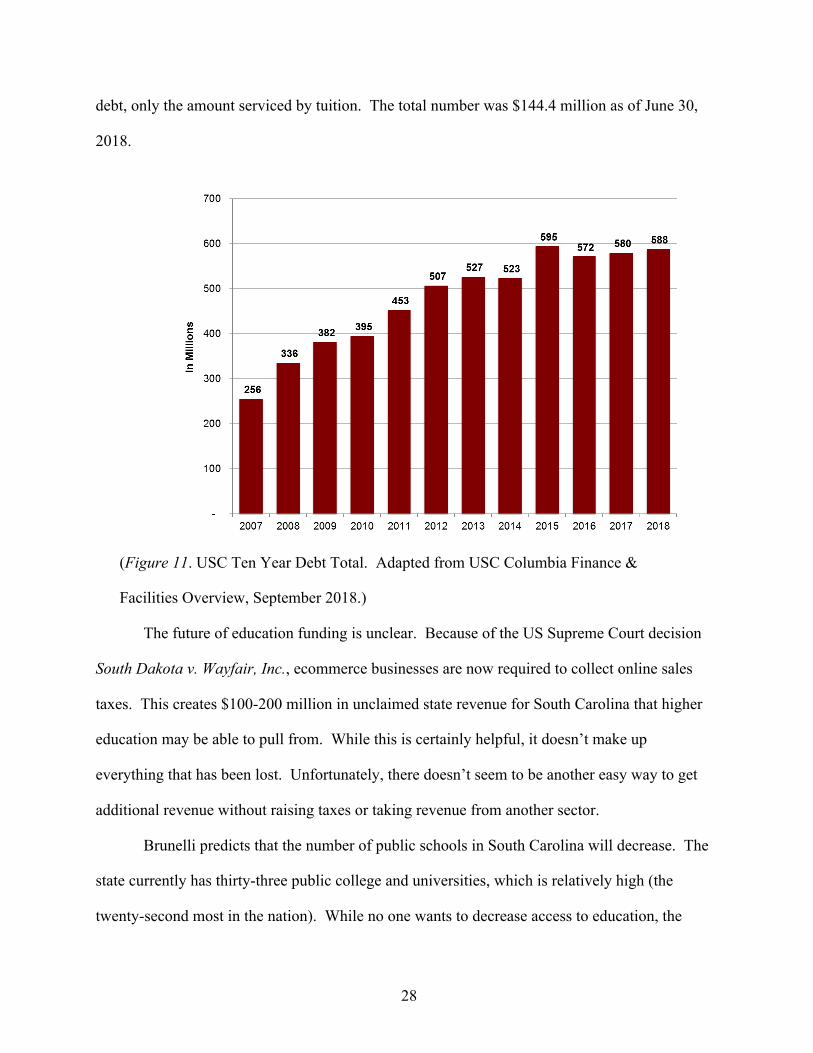
total outstanding debt as of June 30, 2018 was $587,695,000. A portion of this cost is directly
reflected in tuition. Each resident student pays $319 per year and each non-resident student pays
$815 per year to pay for this debt. This is not even the total amount of state institution bond
Page 29
28
debt, only the amount serviced by tuition. The total number was $144.4 million as of June 30,
2018.
(Figure 11. USC Ten Year Debt Total. Adapted from USC Columbia Finance &
Facilities Overview, September 2018.)
The future of education funding is unclear. Because of the US Supreme Court decision
South Dakota v. Wayfair, Inc., ecommerce businesses are now required to collect online sales
taxes. This creates $100-200 million in unclaimed state revenue for South Carolina that higher
education may be able to pull from. While this is certainly helpful, it doesn’t make up
everything that has been lost. Unfortunately, there doesn’t seem to be another easy way to get
additional revenue without raising taxes or taking revenue from another sector.
Brunelli predicts that the number of public schools in South Carolina will decrease. The
state currently has thirty-three public college and universities, which is relatively high (the
twenty-second most in the nation). While no one wants to decrease access to education, the
Page 30
29
growing popularity of online education may help maintain access while condensing the density
of schools in the state.
Part 6: Proposed Solutions for South Carolina
Now that the problem has been fully articulated, what can be done? CHE estimates that
spending must increase by over 30% in order to make up the difference between what colleges
and universities need and what they are being offered currently (Glenn & Armour, 2016). Of the
$600 million extra that the General Assembly got to spend on the budget in FY 2017-2018, not a
penny went towards higher education. In FY 2018-19, South Carolina decreased its funding by
3.7%, the most in the nation (Toppo, 2019). Therefore, it is unlikely to expect that significant
and consistent increase in appropriations that is needed. What other options are there? There are
four main routes that have been discussed.
The first solution that has been proposed creates a new bond bill. A bond bill allows the
state to borrow money in order to pay for necessary maintenance for universities. This highly
benefits the colleges, because they are not responsible for taking on that debt, but they still get
the benefit of new or repaired buildings. Lawmakers like them because it still gives the state
some control over how the money is used. These types of bills are common in most higher
education systems, though, as previously discussed, South Carolina has not used them often.
Nevertheless, there has been some discussion among lawmakers to create a new bond bill. This
new bill would borrow $1 billion dollars to pay back over fifteen years. This bond bill would
likely slow the increase in tuition costs, since schools would have help in funding the cost of
repairs. This solution would assist a great portion of students, but it is unviable in this form. It
would force the state to take on a significant amount of debt, and once the money runs out,
schools would be stuck in the same situation as before.
Page 31
30
The second possibility is that the General Assembly could allocate nearly all of the
current higher education budget towards making two-year technical schools free for those who
qualify. Totally funding the existing twenty two-year technical schools in South Carolina would
likely be cheaper in the short run than partially funding all thirty-three public universities as the
state does currently (Glenn & Armour, 2016). However, as the program continued, it would
undoubtedly grow exponentially. More students would opt for two-year degrees than the current
campuses could support, and then the state would eventually end up in a situation similar to what
is has now. While this would tremendously help a handful of students in the short run, students
still seeking a four-year degree would be immensely disadvantaged, as tuition rates for
universities would skyrocket even further to make up for the evaporation of state funding. In the
end, the state would end up in a similar mess to what it faces now.
The third option is to do some major cost cutting. Some schools, such as the University
of Wisconsin at Stevens Point, have chosen to remove some major programs and fire tenured
professors to save money (Smith, 2019). The University of South Carolina could choose to do
something similar or start to close smaller satellite campuses in an effort to centralize and focus
on the most profitable degree programs. Unsurprisingly, this decision was wildly unpopular to
University of Wisconsin students, and likely would be equally unpopular in South Carolina. One
of the biggest risks would be that prospective out-of-state students would be driven away to
universities with more major options and lower student to faculty ratios, which would hurt the
bottom line even more.
The fourth and final solution is almost definite to occur at some point, particularly if no
other significant action is taken immediately. In the long term, higher education will most likely
become privatized. If current trends continue, South Carolina will offer no state funds to higher
education by 2031, and schools will be forced to come up with 100% of their own costs
Page 32
31
(Mortenson, 2012). Tuition will increase to private college levels or higher, and some
combination of the following three things will have to happen: each student will have to take out
a significant amount of debt; only the very wealthy will qualify for education; or universities will
be forced to come up with tremendous cost-cutting measures. Many institutions will be unable
to come up with enough students and donors to cover costs, and smaller schools will be forced to
close. It is nearly impossible to know how the higher education system would function if it were
privatized, but there is no doubt that it would look and operate very differently than it does now,
and likely not for the better.
In my opinion, there is, however, a compromise that can help manage the problems that
higher education is facing. My solution has two parts which work in tandem. The first part is in
the form of a bond bill every three years. These bond bills would be in smaller amounts than the
one currently suggested, but it would occur more frequently. The benefit of this would be to
keep maintenance regular so that buildings would stay in good shape and require fewer big fixes.
Making these bills a regular occurrence would also give universities confidence that they will
have money to maintain their campuses, and thus can devote money to other programs that will
benefit students or reign in the increases in tuition. Politically, it would be easier to pass bond
bills for smaller amounts, and it would not necessarily be seen as a funding increase to higher
education.
The second part would include a gradual shift back from scholarship funding to direct
university support. State schools will get more direct allocations, which was the norm thirty
years ago, which they can use for whatever programs they choose. Overall scholarship funding
is unlikely to decrease, as some universities may choose to spend some of that extra money on
merit and need-based scholarships. Schools and the state as a whole still have an incentive to
recruit the most talented students, and so there will always be a place for scholarships and grants
Page 33
32
based on merit. One potential political problem with this aspect is that universities may choose
to award more scholarships to out-of-state students than to in-state, which would be unpopular to
lawmakers and to the public. However, many out-of-state students are recruited partially
because of the tuition money they bring with them. That factor may no longer play into
scholarship decisions if universities have a more reliable funding source through direct
appropriations. Even if the ratio of in-state to out-of-state students does become skewed, it is not
unreasonable for the General Assembly to require a certain percentage of scholarship recipients
be from South Carolina.
This two-pronged plan will increase the total higher education budget very minimally, if
at all, so K-12 schools and the rest of the state programs will still be fully funded. Private
schools will receive little to none of the benefits that they were previously getting from students
bringing in HOPE/LIFE/Palmetto Fellows scholarships, and so they may be negatively impacted,
but state schools will be getting their funding directly from the state once again and the middle
man of the “free market” will be cut out. Tuition increases will slow, and all universities and
colleges and students will benefit.
This funding problem was not developed overnight, and it will not be fixed overnight
either. However, by leveling how and how many dollars are distributed to schools, all students
will see a positive improvement, and each school will be able to better support itself. With
consistent commitment to this new plan, higher education in South Carolina could possibly
become a model for states nationwide to follow.
Page 34
33
References
Brunelli, L. (2018). USC Columbia Finance & Facilities Overview September 2018. USC
Finance.
Daprile, L. (2018, June 18). While tuition rises, lawmakers stiffed schools $2.1 billion, audit
says. The State. Retrieved from https://www.thestate.com/news/politics-
government/politics-columns-blogs/the-
buzz/article213096729.html?utm_source=dlvr.it&utm_medium=twitter.
Ehrenberg, R.G. (2012). American Higher Education in Transition. Journal of Economic
Perspectives, 26(1), 193-216. Retrieved from
https://pubs.aeaweb.org/doi/pdfplus/10.1257/jep.26.1.193
Glenn, G. & Armour, M. (2016). South Carolina Higher Education Statistical Abstract 2016.
Commission for Higher Education. Retrieved from
http://www.che.sc.gov/CHE_Docs/finance/abstract/Abstract-2016-web.pdf
Hillman, N. & Carral, D. (2017). The Equity Implications of Paying for Performance in Higher
Education. American Behavioral Scientists, 61(14), 1757-1772.
doi:10.1177/0002764217744834.
Kimball, B.A. (2014). The First Campaign and the Paradoxical Transformation of Fundraising
in American Higher Education, 1915-1925. Teachers College Record, 116(7), 1-44.
Retrieved from
http://eds.a.ebscohost.com.pallas2.tcl.sc.edu/ehost/detail/detail?vid=0&sid=db281308-
0469-42ca-8778-
bc0e38ac3392%40sessionmgr4009&bdata=JnNpdGU9ZWhvc3QtbGl2ZQ%3d%3d#AN
=97323445&db=a9h
Kimball, B.A. & Luke, J. B. (2018). Historical Dimensions of the “Cost Disease” in US Higher
Page 35
34
Education, 1870s-2010s. Social Science History, 42(1), 29-55. doi: 10.1017/ssh.2017.38
Knott, J.H., & Payne, A.A. (2003). The impact of state governance structures on management
and performance of public organizations: A study of higher education institutions.
Journal of Policy Analysis and Management, 23(1), 13-30. doi:10.1002/pam.10176.
Kwiek, M. (2017). De-privatization in higher education: a conceptual approach. Higher
Education, 74(2), 259-28`. doi:10.1007/s10734-016-0047-3.
Landsman, S. (2012, May 25). “What College Tuition Will Look Like in 18 Years.” CNBC.
Retrieved from https://www.cnbc.com/id/47565202
Lowry, R.C. (2016). Subsidizing Institutions vs. Outputs vs. Individuals: States’ Choices for
Financing Public Postsecondary Education. Journal of Public Administration Research
and Theory, 26(2), 197-210. doi:10.1093/jopart/muv024.
Mann, S. (2017, April 15). Response to information request. Education Commission of the
States. Retrieved from http://www.ecs.org/wp-content/uploads/State-Information-
Request_State-Education-Governance-Structures.pdf
Martin, E. (2017, November 29). Here’s how much more expensive it is for you to go to college
than it was for your parents. CNBC. Retrieved from
https://www.cnbc.com/2017/11/29/how-much-college-tuition-has-increased-from-1988-
to-2018.html
Mortenson, T.G. (2012). State Funding: A Race to the Bottom. American Council on Education.
Retrieved from https://www.acenet.edu/the-presidency/columns-and-features/Pages/state-
funding-a-race-to-the-bottom.aspx.
National Association of State Budget Officers (2018). 2018 State Expenditure Report: Fiscal
Page 36
35
Years 2016-2018. Retrieved from
https://higherlogicdownload.s3.amazonaws.com/NASBO/9d2d2db1-c943-4f1b-b750-
0fca152d64c2/UploadedImages/SER%20Archive/2018_State_Expenditure_Report_S.pdf
Pew Research Center for U.S. Politics and Policy (2017, July 10). Sharp Partisan Division in
Views of National Institutions: Republicans increasingly say colleges have negative
impact on U.S. Retrieved from http://www.people-press.org/2017/07/10/sharp-partisan-
divisions-in-views-of-national-institutions/
The Condition of Education (2018). Undergraduate Enrollment. National Center for Education
Statistics. Retrieved from https://nces.ed.gov/programs/coe/indicator_cha.asp.
Parks, Craig. Senate Finance Education Funding PowerPoint [PDF document].
Perna, L. W., Leigh, E. W., & Carroll, S. (2017). “Free College:” A New and Improved State
Approach to Increasing Educational Attainment? American Behavioral Scientist, 61(14),
1740-1756. doi:10.1177/0002764217744821.
Smith, M. (2019, January 12). Students in Rural America Ask, ‘What Is a University Without a
History Major?’. The New York Times. Retrieved from
https://www.nytimes.com/2019/01/12/us/rural-colleges-money-students-leaving.html
“South Carolina Commission for Higher Education Mission”. Commission for Higher
Education. Retrieved from
http://www.che.sc.gov/CHE_Docs/ExecutiveDirector/SCHigherEdSummary.pdf
Stachowiak-Kudla, M., & Kudla, J. (2017). Financial regulations and the diversification of
funding sources in higher education institutions: selected European experiences. Studies
in Higher Education, 42(9), 1718-1735. doi:10.1080/03075079.2015.1119109.
Statista (2018). U.S. college enrollment statistics for public and private colleges from 1965 to
2016 and projections up to 2027 (in millions). Retrieved from
Page 37
36
https://www.statista.com/statistics/183995/us-college-enrollment-and-projections-in-
public-and-private-institutions/.
“Summary Report on South Carolina Scholarships and Grants, 1988-2005”. Commission for
Higher Education. Retrieved from
http://www.che.sc.gov/CHE_Docs/Commission%20Calendar&Materials/Nov2006MtgM
aterials/Rpt_SC_Scholar_Grants_19882005.pdf
Tandberg, D.A. (2010). Politics, Interest Groups, and State Funding of Public Higher Education.
Research in Higher Education, 51(5), 416-450. https://doi.org/10.1007/s11162-010-
9164-5.
Tandberg, D.A., Fowles, J.T., & McLendon, M.K. (2017). The Governor and the State Higher
Education Executive Officer: How the Relationship Shapes State Financial Support for
Higher Education. Journal of Higher Education, 88(1), 110-134.
doi:10.1080/00221546.2016.1243945
Toppo, G. (2019, January 21). ‘A Marginally Better Year’ for State Funding. Inside Higher Ed.
Retrieved from http://www.insidehighered.com/news/2019/01/21/state-support-higher-
ed-rises-37-percent-improves-over-2017
Toutkoushian, R. K., & Hollis, P. (2006). Using Panel Data to Examine Legislative Demand for
Higher Education. Education Economics, 2, 141-157. doi:
10.1080/09645299800000012.
Turner, C. (2018). If ‘Free College’ Sounds Too Good To Be True, That’s Because It Often Is.
National Public Radio. Retrieved on 12 November 2018 from
https://www.npr.org/sections/ed/2018/09/12/643673271/if-free-college-sounds-too-good-
to-be-true-that-s-because-it-often-
Page 38
37
is?utm_source=npr_newsletter&utm_medium=email&utm_content=20180916&utm_ca
mpaign=ed&utm_term=nprnews.
Webber, D.A. (2017). State divestment and tuition at public institutions. Economics of
Education Review, 60, 1-4. doi: 10.1016/j.econedurev.2017.07.007