A Master’s Thesis submitted for the degree of “Master of Science” supervised by Ass. Prof. Dl Dr. Johann Fellner The evolution of waste management in countries of transition Yves Jean-Paul Reynaud 0948625 Vienna, October 2013 MSc Program Environmental Technology & International Affairs
Transcript
A Master’s Thesis submitted for the degree of
“Master of Science”
supervised by
Ass. Prof. Dl Dr. Johann Fellner
The evolution of waste management in countries of transition
Yves Jean-Paul Reynaud
0948625
Vienna, October 2013
MSc Program Environmental Technology & International Affairs
Affidavit
I, Yves Jean-Paul Reynaud, hereby declare
1. that I am the sole author of the present Master’s Thesis, “THE EVOLUTION OF WASTE MANAGEMENT IN COUNTRIES OF TRANSITION”, 79 pages, bound, and that I have not used any source or tool other than those references or any other illicit aid or tool, and
2. that I have no prior to this date submitted this Master’s Thesis as an examination paper in any form in Austria or abroad.
Vienna, 18.10.2013
Signature
Abstract
Urban migration is a worldwide phenomenon, driven by economic prospects not
possible in rural areas. The resulting population growth requires governments and
urban planners to foresee and adapt the city infrastructure to cope with increasing
demands. With restricted budgets, developing countries have to prioritize, often
leaving waste management at the end. As protection of public health is one of the
top priorities on low-income countries, a case can be made that sewage systems
deserve more attention as part of a comprehensive waste management strategy. By
describing the socioeconomic, technical and political factors of Vienna, Mexico City
and São Paulo, this comparative investigation aims to highlight the evolution of
sewage systems and solid waste management practices, demonstrating the stark
differences in history that shaped their development. The subsequent literature
review examines the potential health issues associated with multiple exposure
pathways in the case of insufficient wastewater treatment and inadequate solid
waste management. The quantitative analysis compares the potential emissions of
nitrogen and total organic content via leachate migration from landfills and
reemission of untreated wastewater into groundwater respectively. The literature
review indicates that landfilling deserves special attention if groundwater quality is to
be maintained. However, in light of the research, sewage collection and wastewater
treatment are more important with respect to public health. Finally, the paper
presents its conclusions and its implications for infrastructure planning in developing
countries.
Acknowledgements
I would like to express my deep gratitude to Prof. Johann Fellner, my research
supervisor, for his patient guidance, and invaluable critiques of this paper. I would
also like to thank my family for proofreading the early stages of work and assisting in
the research of Mexico City. My grateful thanks are also extended to Ms. Maria
Aledo, Ms. Raquel Aledo as well as Ms. Maíra Andrade for their help in translation,
research and overall contributions to the sections on São Paulo.
Table of Contents
List of Abbreviations/Acronyms ............................................................................... vii
ABES - Brazilian Association of Sanitary Engineering and Environment 35
BOD - Biological Oxygen Demand 46
CESB - State Water and Sanitation Companies 19
COD - Chemical Oxygen Demand 46
COMAPA - Metropolitan Commission for the Preservation and Control of
Environmental Pollution 32
CONAPO - National Population Council 29
CTL - Waste Treatment Center East 49
CTVA - Landfill Caieiras 49
DOS - Department of Sanitary Works 17
EbS - Simmering disposal plants 25
FESB - State Fund for Sanitation 18
HCl - Hydrochloric acid 41
HF- Hydrogen fluoride 41
IBGE - Brazilian Institute of Geography and Statistics 22
INE - National Institute of Ecology 33
INEGI - National Institute of Statistics and Geography 30
LGEEPA - General Law of the Ecological Equilibrium and the Protection of the
Environment 31
LGPIR - General Law for the Prevention and Integrated Management of Wastes 33
MA48 - Municipal department 48 23
NAFTA - North American Free Trade Agreement 33
NOM - Official Mexican Standards 31
PE - Population equivalent 46
PGIRS - Program for Integrated Solid Waste Management 33
PLANASA - National Sanitation Plan 18
PMDI - Metropolitan Plan for Integrated Development 18
PMRS - Solid Waste Master Plan 31
PROFEPA - Office for the Attorney General for Environmental Protection 33
RAE - Division of the City's Water and Sewer 17
SABESP - Company for Basic Sanitation of the State of São Paulo 19
SACMEX - Water System of Mexico City 14
SANEBASE - Sanitation and Construction Company 19
SANEGRAN - Sewage Treatment Program for Greater São Paulo 19
SEDEMA - Ministry of Environment 13
SEMARNAT - Secretariat of Environment and Natural Resources 33
SEPURB - Department of Urban Policy 20
SFS - Financial System for Sanitation 18
SMA - Ministry of Environment 33
TOC - Total Organic Carbon 40
WHO - World Health Organization 39
ZMCM - Metropolitan Zone of Mexico City 29
1
1. Introduction
History has developed very differently in different parts of the world. Even though
these historical inequalities constitute the most basic fact of world history, the
requirements for societies to develop remain the same, regardless of location. The
link between water and humans is as old as the origin of civilization itself. Any urban
center needs to find ways to regulate water usage for its society to thrive. The
creation of artificial canals is what allowed early cultures to move from the river to
more arid areas and turn them into fertile valleys. With a larger agricultural capacity,
primitive cultures started to grow in size. As more food and materials where being
used in the urban centers, increasingly more solid waste was generated. While
history was unfolding at different rates in many parts of the world, similarities in part
due to modern trade and globalization began to shrink more and more, leaving
behind a stark contrast of development. This paper will emphasize the differences of
waste management systems, comparing the development of sewage systems and
solid waste management in Vienna, Mexico City and São Paulo. As previously
mentioned, the need for water and public health is universal. Yet how some cities
were able to meet their needs, while others are still struggling, requires an
understanding of how socioeconomic, technical, and political phenomena affected
them and their current situation. Most studies in the area of waste management
focus on the time of their publication. Material covering urban development of
individual cities and techno-centric research on waste management is abundant. Yet
academic literature seems remarkably void of comparative studies in the history of
waste management. In order to improve waste management in developing countries
and their living conditions, it is indispensable to understand their unique context. To
unravel the differences in the evolution of waste management is not only interesting,
but of significant importance today, as we seek to grasp our past’s lessons for a
future where climate remains uncertain.
2
1.1. Problem
For well over a century, developed countries have been exposed to industrial and
urban activities, becoming aware over time of the challenges that urbanization
brings along. Environmental awareness has yet to manifest itself, as many parts of
the world have yet to achieve adequate standards of living. The safe disposal and
subsequent management of municipal solid waste alongside sanitation represents
two of the most essential urban environmental services. Other vital infrastructures
and utilities such as energy, water supply and housing receive more attention and
more budget. Nevertheless, the inability to manage properly the ‘back end’ of the
materials cycle has a strong impact on health, longevity, and the environment (Un-
Habitat, 2010). It logically follows that if developing countries are mainly concerned
with the protection of human health then waste management ought to have
importance. The question to ask then is: What area of waste management is more
important for the protection of human health, sewage systems (including wastewater
treatment) or solid waste management?
1.2. Hypothesis
Based on the priority of protecting human health, developing countries
implement wastewater treatment first and only subsequently manage municipal
solid waste.
3
2. Materials and Methods
If public health is the main priority of waste treatment, then population density is a
key variable to be taken into consideration. For this study, preference is given to
urban centers from developing countries since they offer insight into areas where
water is a scarce resource.
With the development status, population density and use of untreated water for
irrigation as selection criteria in mind, three cities have been chosen. Taking into
account its highly developed sewage system and solid waste management, Vienna
will be used as a reference. Identified as one of the most densely populated cities in
the world and covered in numerous studies as an urban center suffering from water
scarcity, Mexico City will be included in this paper (Romero Lankao, 2010). In
contrast, São Paulo is one of the freshwater abundant cities in South America and
possesses an extensive drainage system, yet water scarcity is prevalent in many
municipalities. In 2008, the urban population in Brazil made up 80% of all 190 million
inhabitants, yet less than 75% of the sewage created in the cities was collected and
treated (Observatório Cidadão, 2013). São Paulo is cited to emphasize the
differences of waste management systems and compare the development of
sewage systems and solid waste.
First, a historical analysis will highlight the socioeconomic and political factors have
led to the development of current waste management practices, for both sewage
systems and solid waste management. The historical analysis of wastewater
treatment and municipal solid waste practices will be followed by the second part,
consisting of a qualitative analysis of health hazards, both occupational and
residential related to sewage and improper waste management. Special attention
will be given to the use of untreated wastewater for agricultural irrigation, as it
constitutes a main pathway for pathogenic organisms into the human population via
direct or indirect consumption. Additionally health impact resulting from the lack of
adequate sewage systems will be highlighted. A description of the different disease
vectors will be presented and their impact on human health and exposure pathways
will be evaluated.
Finally, the third part will cover a quantitative analysis estimating the emission load
of contaminants that leaked from the leachate of improper solid waste management
and emissions from untreated sewage. The results will be used to show the impact
4
of improper municipal solid waste on water quality. This multifold approach may
support a possible recommendation on the priorities of waste management
strategies in developing countries, to best allocate what is their largest budgetary
item and to achieve their priority of protecting public health.
5
3. Historical review of sewage systems
In ancient as well as in modern times many of the challenges faced by the local
population to achieve development depended on the territory. The following
passage will give insight into the different historical developments of the cities under
review to underpin the underlying factors of the evolution of their respective waste
management systems over time.
3.1. Vienna
The history of Vienna’s sewer system is over 2,000 years old and dates back to the
Roman era around 100 AD. During that time Vindobona, as it was called by Romans,
was a military camp and exhibited already an impressive sewer system by modern
standards. The bottom of the sewers was composed of tiles while the covers were
made of stone slabs and smaller canals even had hardened clay pipes. Towards the
end of the Roman era, the high standard of Vienna’s sewer system started to vanish.
Despite these technological advances, Vindobona suffered from the same hygienic
conditions as any other European cities; garbage was disposed in the streets and
sewage flew into different streams of the Danube. It was not long before these
environmental conditions set the stage for a wave of epidemics.
Near the end of the fifteenth century, several canals existed in Vienna’s city center,
the first district. The yearly floods following heavy rainfalls, combined with the piled
up and rotten waste (including dead animals) led to major health problems.
Research in the field of sewage systems (Gantner, 2005), indicates that the pest
epidemics in the years 1679 and 1713 had their origin in these unhygienic
conditions. The sluggish construction of sewer systems experienced a strong lift
following the second Turkish siege in 1683. The progress attained in 1739, made
Vienna the first fully channeled city in Europe. Nonetheless, inhabitants in the
suburbs led their waste and sewage into the Wienerwald streams, which were not
only used for washing but also water wells. The consequence was the pollution of
the groundwater for several days (Gantner, 2005).
In the 1800s the Wien River had the raw sewage of 4,000 tenement blocks along its
banks. The complexity of the undertaking the city government was facing, became
apparent in the beginning of the nineteenth century, when large parts of the
6
technical infrastructure were ready built. Sanitation in the City of Vienna only started
in 1829 with the impetus for reform in this period, not coming from the natural
sciences as assumed, but caused by the tremendous pollution of the cities at that
time. In the course of the first three decades of the nineteenth century, public and
private canals were systematically built, whereby the private "household waste
canals" only moved the feces from the toilets to the home-owned cesspools or if
present, fed directly into a road sewer. Finally, the building code of 18291 demanded
the erection of walls around canals and the prohibition of new cesspool
constructions, to help control the situation (Csendes and Opll, 2006).
This ambitious new construction laws but were not executed until a real disaster hit
the Vienna’s population. In 1830, a combination of high waters and ice dammed up
tributaries of the Danube caused a flooding and widespread contamination of
ground water leading to a cholera epidemic killing over 2,000 people. Following this
tragic event, the City of Vienna started one of the largest construction projects in the
city’s history, which would last 70 years. Open streams in the city were covered and
two additional collection channels2 were quickly integrated into a storm and sanitary
sewers system in parallel to the Wien River, resulting in the building of the first large
sewers leading to the Danube (Gantner, 2005).
In the 1840s, the concept of clean drinking water started to gain importance among
the population. The actual development of waste management infrastructure started
to take off in 1848, most likely for political reasons, in particular under the influence
of the great cholera epidemic and the first scientific epidemiological studies, which
demonstrated the emergence of cholera caused by germs and bacteria. In addition,
following the expansion of new water lines, more people in Vienna were able to
receive fresh water. As a result, Vienna effectively exterminated many negative
factors involved in the 40 year period in which cholera reigned over the city. From
1850 on, the sewer system was extended to the point that associated risks of
diseases were finally banned.
In particular, the supply of fresh, clean water helped to disprove the miasma theory3,
and was seen as the most effective measure against diseases and epidemics. The
1 The Bauordnung von 1892 defined several building requirements for the City of Vienna,
including the connection of communal canal. 2 These channels were referred to as Cholerakanäle in German.
3 The miasma theory was popular until the 1730s and stated that cholera and other disease
were caused by miasma, a form of bad air emanating from rotten organic matter.
7
construction of canals and the disposal of garbage resulted only in improvements,
but were not the driving force in the fight against the plagues and epidemics. It was
rather, the breakthroughs in various fields of research that made it possible to
gradually understand the relationships between the living conditions and health
status. Nonetheless, deaths attributed to contaminated water were still frequent, not
least because heavy rainfalls in the canals led to overflows in the Wien River.
As the medical discoveries of the time started to influence the technical
development, which was controlled by political powers. the conceptual work started
to become more prevalent, as the city government tried to preconceive situations
instead of fixing problem by problem. To achieve this goal, a plan for the
maintenance and cleaning of the streets and public places, as well as the clearing of
human excreta and sewers was developed. Under this new model, all sewers were
to be cleared on a monthly basis. Two main collectors were built along the
Donaukanal, to combat the resulting odors from the feed-in of the sewers. Contacts
with the major European cities4 were established to exchange experiences and
expertise but most importantly avoid committing the same mistakes. It was
becoming apparent that the efforts required to clear and transport the cesspool
contents were just too big. Using other European cities as a reference, it became
evident that for hygienic reasons, cesspools provided only a temporary fix and not a
solution to the sanitation problem (Ossberger, 1997). The municipal authorities set
the ambitious goal to solve the question of sanitation on all fronts. Especially
Hamburg, Berlin and Graz would turn out to have a distinct influence on the
subsequent development of waste management in general in Vienna. What
remained unclear was whether to remove the human waste through a water carriage
system or to keep clearing it from the sewers. The lessons learned from Berlin
seemed to indicate that the introduction of a sewer system would benefit street
sanitation. With the exponential growth in urban population, Vienna’s wastewater
volume also grew requiring further upgrades, in particular the building of sanitary
sewers on both side of the Danube Canal and the extension of the central sewer
system to outer districts. In particular, since 1873 after the city had a comprehensive
water supply system in place, the population grew and the rate at which Viennese
households were attached to drinking water and sewage system grew quickly. This
also meant that in addition to increasing hygiene challenges, odor control soon
4 Municipal authorities were exchanged information Paris, London, Munich, Hamburg and
Berlin.
8
became a main requirement in the city and the spread of cholera was under control
(Ossberger, 1997).
During this period, various entrepreneurs and scientists started to look for new ways
to recycle the cesspool contents5. Even though more than ten different bids from all
around the world were made to solve Vienna’s human waste problem, the condition
persisted beyond 1874. The technical innovations had not resulted in the intended
improvements for the sewer system. Despite regular channel clearances, it was
inevitable to dispose of waste. Sewer and cesspool contents, which were not used
for wastewater irrigation, ultimately ended up being disposed of in pits near the
banks of the Donaukanal until 1879. Once the molesting odors created by the built
up fecal matter could not be ignored, the waste was shipped onto the Danube in
1880. Following the foundation of new nation-states and the Constitution of Austrian
in 1920, much of the former empire’s important economic regions disappeared. The
uncertain economic conditions and political turmoil between left and right wing
paramilitary forces that followed in Vienna between 1920 and 1930 slowed down the
improvements of the sewer system.
The city’s sewer system continued to improving until its severe damage by the
bombings of World War II. During the war, the Viennese sewer system received
1,800 hits from bombings. It was not until 1950 that the city was able to repair the
damages from the war (Gartner, 2004; Brunner and Schneider, 2005). While the
issue of hygiene in the city seemed resolved, the untreated wastewater reached
Vienna’s river network. Thus, the city of Vienna began with the construction of two
wastewater treatment plants. The first wastewater treatment facility in Vienna was
built in the 23rd district and was operational from 1950 to 1970 processing clearing
the sewage of a catchment area6. In 1970, the treatment facility “Blumental” also
located in the 23rd district started to treat wastewater coming in from two collection
channels through the stream Liesing, using an organic cleaning process. Next, the
clean water was conducted back to the stream Liesing (City of Vienna, MA 53). Ten
years later, in 1980, the construction of main wastewater treatment facility 7 of
Vienna. Because it is the lowest geographical point in Vienna, the 11th district was
5 Among them was the attempt to collect all human waste and process it subsequently into
fertilizer. Yet another solution foresaw the conversion of fecal matter into compost. 6 Gelbe Haide catchment area in Wien Inzersdorf.
7 Hauptkläranlage Wien in German
9
chosen as location to build the treatment plant. This natural incline facilitated the
flow of wastewater via the 2,400 km long sewage network of Vienna into the
treatment plant. The opening of the main wastewater treatment facility represented a
new milestone in the environmental history of the city of Vienna. As time went on,
the streams coming into the wastewater treatment facility “Blumental” were having a
strong impact on the stream Liesing. Thus, the wastewater treatment was stopped in
2005. Since then, wastewaters are conducted via the newly constructed Liesingtal
canal into the main wastewater treatment facility. In the years between 2000 and
2005, the facility was upgraded and expanded through the introduction of a second
organic cleaning (nitrogen reducing) process to further improve the treatment
8process and the resulting water quality of Vienna (Lukschanderl and Klager, 2005).
Sources: Statistik Austria and Worldbank
$-
$10 000
$20 000
$30 000
$40 000
$50 000
$60 000
-
500
1 000
1 500
2 000
2 500
10
0A
D
17
39
18
37
18
69
18
80
19
00
19
30
19
47
19
51
19
64
19
68
19
72
19
76
19
80
19
84
19
88
19
92
19
96
20
00
20
04
20
08
20
12
Nat
ion
al G
DP
per
cap
ita
(cu
rren
t U
S $
)
Po
pu
lati
on
(th
ou
san
ds)
Population
National GDP per capita (current US$)
16
83
: En
d o
f 2
nd
Tu
rkis
h
18
30
: ch
ole
ra e
pid
emic
18
48
: 3rd
ch
ole
ra e
pid
emic
19
30
: Wo
rld
War
I
19
45
: Wo
rld
War
II
19
55
: Au
stri
an In
dep
end
ence
I
19
99
: Ad
op
tio
n o
f Eu
ro
19
56
: Fir
st C
om
po
stin
g p
lan
t
19
85
: Sta
rt o
f Eb
S W
WT
pla
nt
19
51
: Fir
st W
WT
pla
nt
bu
ilt
18
37
: Co
llect
ion
ch
ann
els
bu
ilt
18
81
: Sew
er n
etw
ork
exp
and
ed
20
05
: Exp
ansi
on
of
EbS
pla
nt
19
73
:1st
wat
er p
rote
ctio
n la
w
Development of sewage system in Vienna
Figure 1 Development of sewage system in Vienna
10
3.2. Mexico City
The capital of Mexico is situated in the lower part of the Mexico Valley Basin,
approximately 2,200 meters above sea level, surrounded by mountains reaching
above 5,000 meters in altitude. Because of its location, Mexico City had to confront
for several centuries, the problem of flooding. The Aztecs first arrived during the
thirteenth century in the Valley of Mexico and settled on the island of Tenochtitlán in
the Lake Texcoco, one of the five lakes9 that formed the lake area nowadays known
as now the Valley. The closed basin fed on the rains, mountain rivers and small
springs. Its location and characteristics caused constant floods during periods of
continuous rainfall (Herzog, 2001). During the pre-Hispanic period, the Aztec state
employed different methods to take advantage of water. To control the water, an
impressive hydraulic system, composed of roads, dikes, locks and aqueducts was
built as recorded by Spanish chroniclers, who were surprised by the systems used.
The sophistication of such a system was likely closely related to the population of
Tenochtitlan10, which at its peak in the late fifteenth century was estimated at half a
million, making it one the world’s largest cities of its time (Romero Lankao, 2010). In
1521, Tenochtitlán fell to the Spanish and the hydraulic system was destroyed,
initiating a new colonial era, which lasted until 1821.
During the colonial era, a project to rebuild the pre-Hispanic hydraulic system on
behalf of vice-regal authorities was underway. While one of the original ideas of
Hernán Cortés11 was to find a new seat to fund the capital of New Spain, he
eventually decided to reconstruct the pre-Hispanic hydraulic system, despite the
constant danger of floods, because all currents were heading to the valley. In 1555,
came the first great flood of colonial Mexico, and the builders, made up of
indigenous and Spaniards, saw the need to find solutions, among other measures,
following indigenous techniques, a pre-Hispanic dam made of stones12 was rebuilt,
which provided some support but not enough to completely solve the problem
(Rojas et al., 1974).
9 The five lakes composing the Valley of Mexico are: Zumpango, Xaltocan, Texcoco,
Xochimilco, Chalco 10
The capital city of the Aztec empire 11
Hernán Cortés led the expedition of Spanish Conquistadores during the early 16th century bringing large parts of Mexico under Spanish rule eventually causing the fall of the Aztec Empire. 12
Albarradón in Spanish
11
During that time, another plan appeared, consisting of building an artificial drain.
Each time the great floods came, the capital resorted to that solution. Finally, the
decision was made in 1607 to build the Nochistingo canal in order to drain the Lake
Zumpango and the Cuautitlán River. The capital depended on a series of filtration
tanks and pipes to transport sewage and household wastewater through the city
from west to east and finally towards a large dike13 northeast of the city. Because
the citizens would use it to dispose of their waste and trash, it would inevitably end
up clogged, turning it eventually into a source for cholera, typhus and other diseases,
which would repeatedly afflict the population. Since these were open systems, their
contamination contributed significantly towards a further deterioration of water
quality via the connecting aqueducts public supply sources (Romero Lankao, 2010).
Unfortunately, the capacity the Nochistingo canal was insufficient and did not
decrease the volume of water required. During all those years, the criticisms were
harsh, other specialists were consulted, and authorities ordered to suspend the work.
The most serious problem arose in 1629, when there was a disastrous flood.
Following heavy rainfalls and fearing that the incoming water may prove too much
for his newly constructed drain to resist and may be destroyed, Enrico Martínez14
decided to block the drain channel input. His decision turned out to be catastrophic,
as the river extended to Mexico City, reaching a considerable height. The losses
were tremendous: death, emigration, property destroyed and economic paralysis.
Records of that period describe how even after ten years, the damage was
noticeable, the city itself being under water for five years (Caistor, 2000).
After 11 years of armed struggle, on September 27, 1821, Mexico awoke as an
independent nation, but among the main problems inherited from the colonial past
was the drain of the capital city. While the need for a technical and administrative
body responsible for the supervision of the works was apparent, the lack of money
in the treasury and the constant political conflicts prevented a long time its creation,
limiting the efforts to maintenance works and minor repairs. At first advances came
fast during the excavation of the pit and the tunnel, but as they reached deeper,
costs and barriers increased. There were constant leaks and risks of floods and
landslides. The ports that were built were protected by masonry or wood, so each
time progress was slower. During the fall of the Juarez government, works were
13 The San Lázaro
14 Enrico Martínez was cosmographer to the King of Spain, interpreter for the Spanish
Inquisition, publisher, and hydraulic engineer leading the construction of the drain channel.
12
once again paralyzed. The capital was flooded in the rainy season, which, in
addition to the civil unrest, and chaos caused a spreading of diseases. The area
surrounding Mexico City was abundant in water sources during the colonial era.
However, its uneven distribution created problems of scarcity. While some places
had natural springs and public wells, others had none; a condition that has lasted
into the present.
Seizing the power from Emperor Maximilian in a coup in 1876, Porfirio Díaz and his
allies ruled the country until 1911, a period commonly referred to in Mexico as the
Porfiriato. It was not until the year 1884, when President Porfirio Díaz began his first
re-election that works on the drain-in tunnel resumed. The progress was slow, as it
was a complex task, especially the channel tunnel, because while the pit was almost
completed, the chosen machinery turned out to be not suitable for the task. For
these reasons, Porfirio Díaz considered that such work should be in the hands of
foreign technicians. In 1889, several British and American companies, among
others were hired. Finally, after many changes and mistakes by the foreign
contractors, the tunnel of 10,021 meters was officially completed in December 1894
and officially inaugurated by President Diaz in 1900. While a lot of resources and
efforts were spent, it was clear that it would not be the ultimate solution to the
problem, as the flooding was not over and the population of Mexico City had grown
at a breakneck pace. The regimes which originated from the 1910 Mexican
Revolution were able to consolidate the system manage and supply water created
during the dictatorship of Porfirio Díaz. Nevertheless, the Porfiriato regime was able
to improve the quality of fresh water thanks to the introduction of a closed
distribution system in the water supply. The completion of the project to drain the
basin of Mexico City, which had been contemplated since the seventeenth century,
represented a milestone in the urban history of the country. For its time, the Gran
Canal15 grouped with a closed network of combined secondary and tertiary drainage,
resulted in a system able to cope with floods. Thus, this state-of-the-art system
vastly improved the sanitary conditions of Mexico City (Romero Lankao, 2010). In
fact, much of the Porfiriato era hydraulic system remains operational today. Yet
because the system had artificially unified those basin spaces through the provision
and removal of water through supply, sanitation and drainage infrastructures, the
basin’s hydrological cycle was completely modified to the point where rainwater
15 The Gran Canal was for the most part an open main drainage channel transporting
sewage.
13
would no longer follow its path of infiltration, changing the proportions of storage in
aquifers and evaporation in lakes (Romero Lankao, 1999). Consequently, a
significant portion of water would be captured and removed from the basin and all
the residual water left in it, through a system of pipes before it could even reach the
lakes and aquifers. The additional groundwater extraction, which started towards the
end of the nineteenth century, resulted in the collapse of the Gran Canal. This
created an absurd situation in which storm and wastewater was and still is being
pumped out of the basin, while more than a third of total drinking water is brought
from increasing distances, further increasing the energy and money needed to be
pumped into the basin (Tortajada, 2006). During that period, a large share of the
canals in Mexico City was contaminated with wastewater. In response, the so-called
Viaducto canal was constructed in 1940 as means to transport the sewage. An
increase in immigration resulting from the introduction of national policies to attract
investment reinforced the large-scale growth of Mexico City’s urban industries and
the lack of economic prospects in the rural areas, represented new challenges both
to those who ruled the capital and those dedicated to its construction. The
population continued to suffer from floods, particularly during 1950 and 1951.
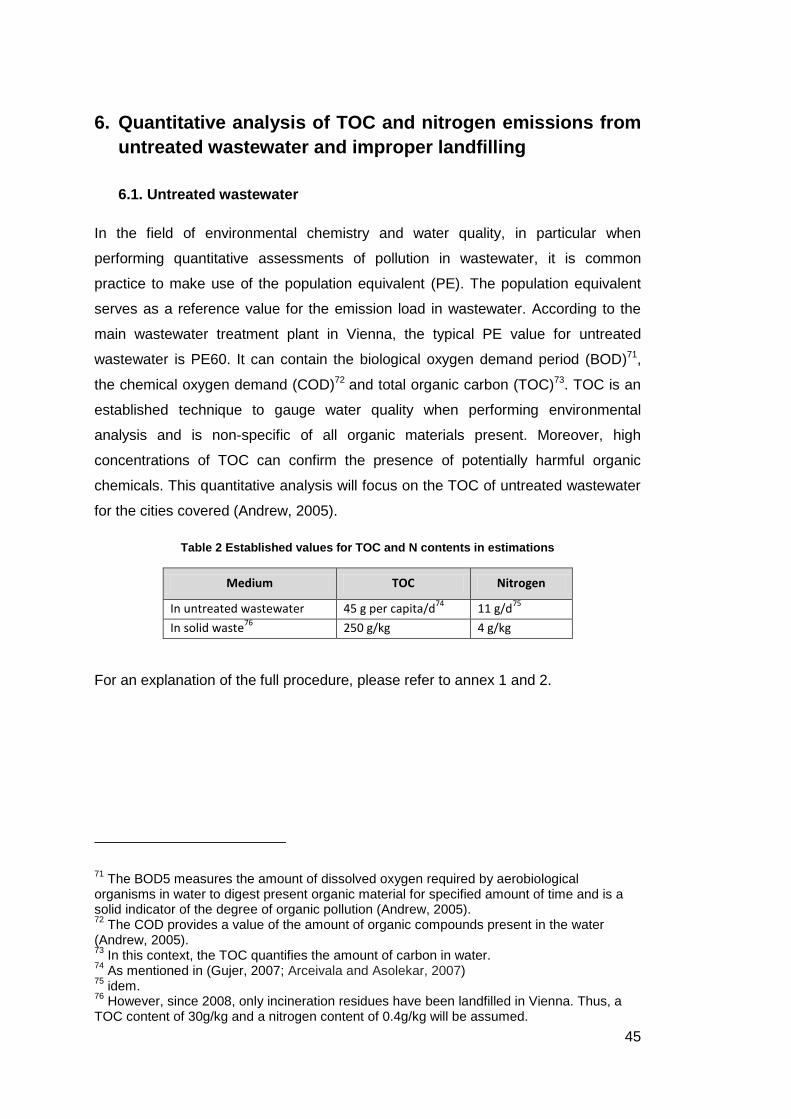
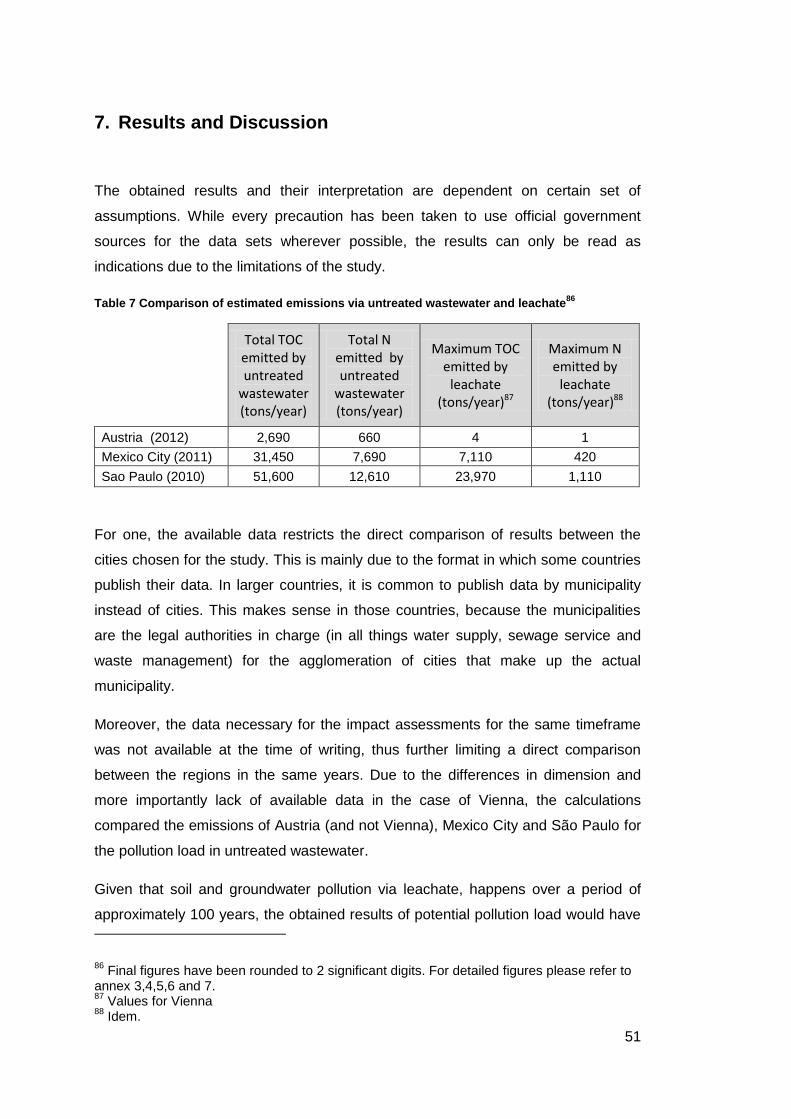
Table 1 Construction of wastewater treatment plants in Mexico City16
Sources: Secretaría del Medio Ambiente del D.F. (SEDEMA)
Year of construction Wastewater treatment plants
1956 Chapultepec
1958 Coyocan; Ciudad Deportiva
1959 San Juan de Aragon
1965 Tlatelolco
1971 Iztacalco; Cerro de la Estrella
1973 Bosques de las Lomas
1975 Acueducto de Guadalupe
1981 El Rosario; Reclusorio Sur
1989 San Luis Tlaxialtemalco
1993 San Nicolas Tetelco; Abasolo
1994 Santa Fe; La Lupita; Parres; San Miguel Xicalco
1997 San Pedro Atocpan; San Andres Mixquic
1998 San Lorenzo
2000 El Llano
2005 Sta. Martha Acatitla
14
At that time many areas of Mexico City were affected by the level reached by the
water, sometimes reaching up to seven meters as recorded in local newspapers
photographs. In order to address this problem, the Commission of Hydrology for the
Valley of Mexico was created. In 1958, the wastewater treatment plant “Coyoacan”
began its operation.
A comprehensive plan was drawn to deal with subsidence, floods and water supply.
The proposed solution to the problem would be the realization of a deep drainage
system that would allow keeping the sewer service and leveraging wastewater for
irrigation and industrial uses. Finally, in 1967 began this important work of twentieth
century Mexican engineering (Cohen, 1999). In 1971, the wastewater treatment
plant17 started its operation processing most of the water for re-use as water for
irrigation in agriculture. Later commercial and industrial sectors would follow and use
the treated wastewater.
At the beginning of the twenty-first century, the capital of Mexico faced the challenge
to supply its inhabitants with enough water. This was mainly due to two trends; an
increase in population and the overexploitation of the aquifer. Its geographic location,
also contributed to water related problems such as floods and shortages of drinking
water.
Figure 2 Coverage of sewage in Mexico City18
In 2006, the nearest source of water was already being tapped, but meeting future
needs was uncertain. As the aquifer systems located below the City provide nearly
17 Cerro de la Estrella
18 Sources: Sistema de Aguas de la Ciudad de México (SACMEX)
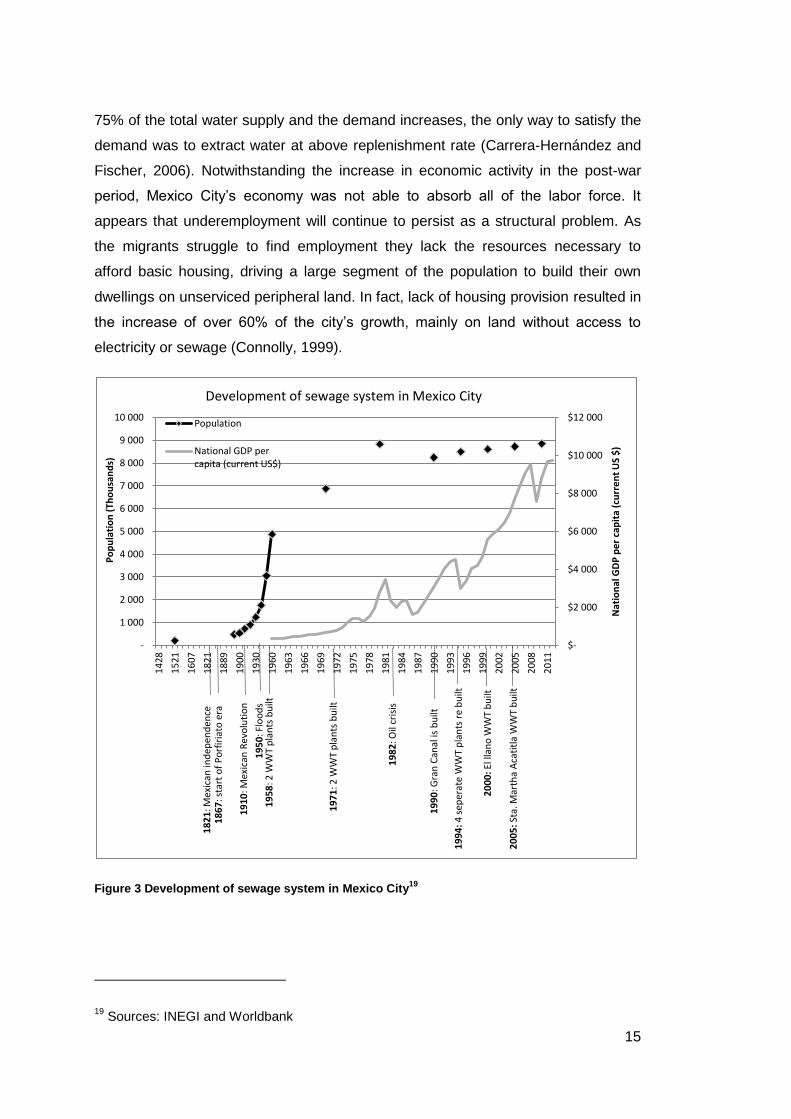
75% of the total water supply and the demand increases, the only way to satisfy the
demand was to extract water at above replenishment rate (Carrera-Hernández and
Fischer, 2006). Notwithstanding the increase in economic activity in the post-war
period, Mexico City’s economy was not able to absorb all of the labor force. It
appears that underemployment will continue to persist as a structural problem. As
the migrants struggle to find employment they lack the resources necessary to
afford basic housing, driving a large segment of the population to build their own
dwellings on unserviced peripheral land. In fact, lack of housing provision resulted in
the increase of over 60% of the city’s growth, mainly on land without access to
electricity or sewage (Connolly, 1999).
Figure 3 Development of sewage system in Mexico City19
19 Sources: INEGI and Worldbank
$-
$2 000
$4 000
$6 000
$8 000
$10 000
$12 000
-
1 000
2 000
3 000
4 000
5 000
6 000
7 000
8 000
9 000
10 000
14
28
15
21
16
07
18
21
18
89
19
00
19
30
19
60
19
63
19
66
19
69
19
72
19
75
19
78
19
81
19
84
19
87
19
90
19
93
19
96
19
99
20
02
20
05
20
08
20
11
Nat
ion
al G
DP
pe
r ca
pit
a (c
urr
en
t U
S $
)
Po
pu
lati
on
(Th
ou
san
ds)
Population
National GDP percapita (current US$)
18
21
: Mex
ican
ind
epen
den
ce
18
67
: sta
rt o
f P
orf
iria
to e
ra
19
10
: Mex
ican
Rev
olu
tio
n
19
50
: Flo
od
s
19
82
: Oil
cris
is
20
05
: Sta
. Mar
tha
Aca
titl
a W
WT
bu
ilt
20
00
: El l
lan
o W
WT
bu
ilt
19
94
: 4 s
eper
ate
WW
T p
lan
ts r
e b
uilt
19
58
: 2 W
WT
pla
nts
bu
ilt
19
90
: Gra
n C
anal
is b
uilt
19
71
: 2 W
WT
pla
nts
bu
ilt
Development of sewage system in Mexico City
16
3.3. São Paulo
In pre-colonial times, indigenous communities in Brazil already worried about
sanitation. Water would be stored in clay jars or stone buckets for later consumption.
Delimited areas were reserved for the disposal of human waste. During the early
1800s, Rio the urban center of the country at that time nearly doubled its population
in less than two decades, reaching 100,000 inhabitants by 1822. This dramatic
change in population made households in the area, to have sanitary installations
that allowed for the collection of human waste in special barrels. When these barrels
were filled after several days of use, slaves dubbed “de tigres” carried and dumped
the resulting load of infected waste on the public square of the sea, where the
containers were washed for reuse. Access to drinking water in a home was a
privilege in the imperial era, since no water supply infrastructure existed back then,
and relied heavily almost exclusively on slaves to transport the water from public
wells to the residences (Buff, 2009).
Between 1830 and 1851, there were no less than twenty-three lethal epidemics in
the major cities, in particular of yellow fever. At the end of the nineteenth century
and early twentieth century, Brazil was known abroad for being a place where
epidemics of yellow fever, smallpox and bubonic plague proliferated. São Paulo and
other cities constituted nurseries for rats, mosquitoes and other disease vectors.
Due to the gravity of the situation at that time, an aggressive campaign to combat
the outbreak of yellow fever in São Paulo was initiated, attacking the breeding
grounds for mosquitoes that transmit the disease. From 1836 to 1874, the urban
population experienced an above average increase growing from 9,391 to 19,347
inhabitants. São Paulo’s water supply network and sewer system was introduced
only after 1876 as part of an official project launched by the local government in
1842. (Kahlouni, 2004).
During the post-colonial Empire of Pedro II in 1877, water privatization started to
take off as private entrepreneurs created the Cantareira Company for Water and
Sewage20, which entered into a partnership, forming a mixed company with the state
government the following year. In 1878, Emperor Pedro II inaugurated the new
water supply of the city and in 1883 the first district sewers of São Paulo. Due to the
Cantareira Company’s unsatisfactory services, the state government did not renew
its concession contract. In response, the state government created the Division of
20 Campanhia Cantareira in Portuguese
17
Water and Sewer of the Capital21, subject to the Secretary of Agriculture, Commerce
and Public Works. During that period, there were two water supply sources in the
city of São Paulo; the Ipiranga, which captured the waters of the stream of the same
name, and the Cantareira, which captured the springs located in the hills.
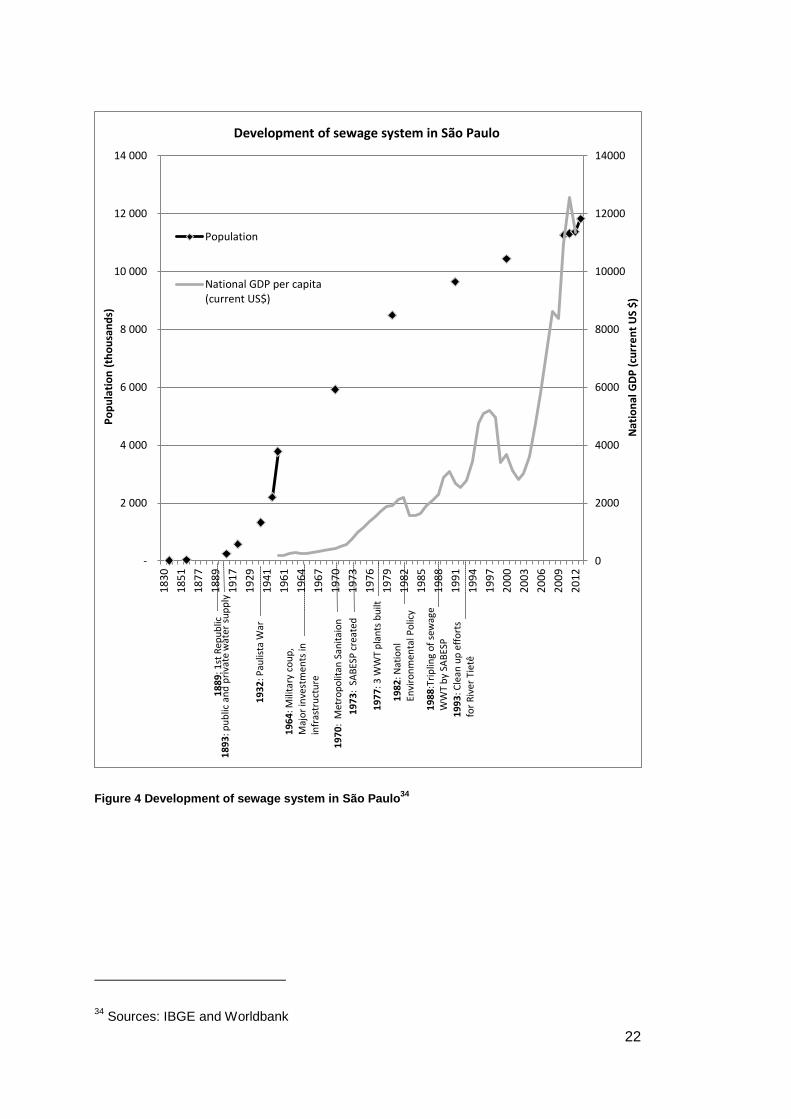
With the end of the reign and the beginning of the first republic22 in 1889, the city of
São Paulo, as well as the state of São Paulo, experienced great economic and
population growth, aided by major European and Asian immigration to São Paulo.
Industrialization and enrichment in São Paulo increased substantially due to profits
from coffee farming in this era. Major changes were occurring in the city between
1899 and 1919. During this very important period, São Paulo saw yet another
increase in urban population growth. Between 1890 and 1900, the city of São Paulo
went from 64,934 to 239,820 inhabitants, nearly quadrupling its population. This
tremendous increase required the building of large avenues, the rectification of the
River Tietê as well as significant extensions of the water and sewage systems,
leading to the emergence of the first services provided directly by the public sector.
Starting 1917, the capacity of water supply was expanded through the water
collection in the Rio Cotia and in 1925, the Division of Water and Sewer of the
Capital was fetching water in the Rio Claro, in the Serra do Mar23. In 1929, the first
agreement was signed between the State Government and the Light & Power
Company to regulate the water supply of the city of São Paulo and necessary works
were carried out to ensure the increase of water supply to the population.
In the period of Constitutionalist Revolution of 1932 also known as the Paulista War,
the population of the state of São Paulo revolted against the 1930 coup d'état
whereby Getúlio Vargas assumed the nation's Presidency. During World War I, the
city grew tremendously because of restrictions in international trade. This forced
São Paulo to start developing its own industry. As of 1941, the city of São Paulo had
a population of 1.3 million people and received water from the Cantareira Cabuçu
Cotia, Santo Amaro and Rio Claro, for a total of nearly 470 million liters per day. In
1950, the Department of Sanitary Works24 was created to operate the water and
sewerage services in the counties of the state.
21 Repartição de Águas e Esgotos da Capital (RAE) in Portuguese
22 República Velha in Portuguese
23 A 1,500 km large mountain range and forest next to the Atlantic Ocean supplying water
24 Departamento de Obras Sanitárias (DOS) in Portuguese
18
The growth in urban population in São Paulo really started in the 1960s and brought
along with it an acceleration of the metropolization process, where the state has
always had a leading role in the implementation and management of water and
sewage services. With the accelerated growth of the urban center, the need to
deploy infrastructure sanitation emerged as a major concern of the public
administration from the mid-nineteenth century on. Since then, the sanitation
systems have evolved closely linked to the process of economic development and
urbanization. In addition to the fast economic growth in the region, the area has
recently become one of the largest urban spaces worldwide. This explains why in
spite of its proximity to the headwaters, a relative scarcity of water resources
prevailed and required water management as well significant financial resources.
In 1964, following yet another military coup, major investments in energy and
transportation infrastructure were made. The economic project deployed in the
country after 1964 supported the centralization of decision-making, and created
nationwide bodies responsible for the formulation and management of urban policies,
including sanitation.
The metropolitan water company of São Paulo was launched in 1968, to capture,
treat and sell wholesale drinking water to 37 municipalities in the greater area of São
Paulo, as well as the state fund for basic sanitation25. Until then, the responsibility
for São Paulo’s water supply and sanitation services were municipal, as laid out by
the Federal Constitution of 1967 (Seroa da Motta and Moreira, 2006). During this
period, coverage rates remained low, lacking the necessary institutional structure to
improve the situation. Conceived in 1970, the metropolitan water company of São
Paulo was responsible for the catching, treating, treating and processing and the
final disposal of sewage. Over the 1970s, the population in the metropolitan region
of São Paulo went from 8 to 12 million inhabitants, amassing around 50% of the
population in the state. This increase in urban growth demanded once more the
expansion of the existing infrastructure. Thus, in 1970 the first Metropolitan Plan for
Integrated Development26 (PMDI) for the region was drafted. Following the creation
of the Financial System of Sanitation 27 and the National Sanitation Plan
25 Fundo Estadual de Saneamento Básico (FESB) in Portuguese
26 1er Plano Metropolitano de Desenvolvimento Integrado (PMDI) in Portuguese
27 Sistema Financeiro de Saneamento (SFS) in Portuguese; linked to the National Housing
Bank
19
(PLANASA)28, guidelines for the sanitation sector were implemented. Launched in
1971, PLANASA mobilized national29 and external30 sources with the goal of offering
a water supply and sanitation service of, 80% and 50 %, respectively, to the urban
population of the country until 1980. Based on the philosophy of viable water and
sewage services through economies of scale, the plan relied heavily on
concentrating sanitation services in the hands of state companies, to the detriment
of municipal management. This gave rise to the creation of the 27 existing State
sanitation companies in Brazil. Likewise, the national policy resulted in the creation
of several companies and state organizations, which centralized regionally the
sanitation services in São Paulo. Thus in 1971, various (State Water and Sanitation
Companies (CESBs) started to spring up in every single state in Brazil.
The process of centralization of sanitation services finally reached its end when in
1973 the basic sanitation company of the state of São Paulo 31 was created..
Currently the SABESP is responsible for water and sewage services of 365
municipalities, and distributes treated water to about 22 million people. Like most
other state companies in the sector, SABESP is a public-private entity owned by the
government of São Paulo. In the state, as indeed throughout the country, the
centralized model, on one hand, enabled significant growth to cover the necessary
water supply and sewage collection; however, it also hindered the development of
autonomous municipal sanitation systems. To cope with this situation, the state
government of São Paulo created the SANEBASE program, aimed at financing
projects and services for water and wastewater systems in municipalities that had
not joined the PLANASA. In 1974, the main provider for water supply in the
metropolitan region of São Paulo, the Cantareira system starts its operation,
supplying 60% of the population in north of the city. The sewage treatment program
for Greater São Paulo (SANEGRAN) was approved in 1977 for the consolidation of
sewer systems. The SANEGRAN program undertook the deployment of three
sewage treatment stations, which reached the so-called secondary level, the
equivalent of a 90% reduction of total pollution load in wastewater.
28 Plano Nacional de Saneamento (PLANASA) in Portuguese
29 Fundo de Garantia por Tempo de Serviço in Portuguese
30 International Bank for Reconstruction and Development and Inter-American Development
Bank 31
Companhia de Saneamento Básico do Estado de São Paulo (SABESP) in Portuguese
20
During the second half of the 1980s the sanitation management at the federal level
underwent a chaotic process of transfers between different ministries. On the other
hand environmental issues began more and more to be a topic in the public sphere
and it was not long until it become an issue in the field of public policy. Thus, the
National Environmental Policy32 and the National Council for the Environment33 were
created in 1981. Two years later, the state council on the environment was
conceived in São Paulo interconnected to the Governor's office. The positive
performance of Brazil’s economy supported the expansion of the water supply and
sanitation network because vital funding was made available. In the years from 1970
to 1990, PLANASA was able to expand sanitation services from 24% to 42% amid
the urban population (McNallen, 2005). Nonetheless, expansion in sanitations
services occurred unequally among regions. This was mainly due to the economic
incentives of the expansion taking place. Because water charges provided rapid
return on investment, priority was given to the wealthier regions of Brazil.
Subsequently most of the investments were focused in particular in the wealthier
districts of Brazil’s larger cities like São Paulo.
With the adoption of the Constitution in 1988, the trend was to politically and
administratively decentralize the country. In fact, the constitution devotes an entire
chapter (Chapter IV) to the environment, resources, water and sanitation, beginning
a new phase of discussion and formulation of policies, both at federal and state
levels, to incorporate issues related to sustainable development. Established in the
1990s, the Department of Urban Policy (SEPURB) was responsible to ensure
improved quality and higher efficiency via policies in the areas of housing, sanitation
and urban development. Other aspects that became increasingly important was the
adoption of an integrated view of the sanitation process, in particular the
participation of civil society in the planning and control of services and sanitation
works. In the specific case of the State of São Paulo, discussed below, recognizes
clearly these aspects. During this period, the water supply networks served all of the
urban population. However, the challenge was to maintain this level of service,
quality and regularity, as well as the provision to other sanitation services.
The population of São Paulo was estimated at 11,253,503 inhabitants in 2010 with
94% living in urban areas of 645 municipalities. Approximately 63.5% of this
32 Política Nacional de Meio Ambiente (PNMA) in Portuguese
33 Conselho Nacional do Meio Ambiente (CONAMA) in Portuguese
21
population is concentrated in only 9.2% of the total area of the state and
overcrowded cities with large numbers of people occupy watershed areas,
riverbanks and steep slopes. This situation represents a challenge to the
implementation of effective sanitation and demand a great effort at all government
levels to find solutions. In the end, the evolution of the sanitation and sewage
systems in major urban centers in Brazil such as São Paulo was led by the
population growth but more importantly, it was promoted by the growth in labor
supply and the subsequent increase in economic activity. As has been shown, it was
the prevailing economic vision of the government that dictated the process of
developing isolated aspects of the urban area. The result of this approach was that
the local government implemented public works in an isolated fashion. The
specialization of management systems of the city’s infrastructure resulted in a
fragmented water resource management (Kahlouni, 2004).
22
Figure 4 Development of sewage system in São Paulo34
34 Sources: IBGE and Worldbank
0
2000
4000
6000
8000
10000
12000
14000
-
2 000
4 000
6 000
8 000
10 000
12 000
14 0001
83
0
18
51
18
77
18
89
19
17
19
29
19
41
19
61
19
64
19
67
19
70
19
73
19
76
19
79
19
82
19
85
19
88
19
91
19
94
19
97
20
00
20
03
20
06
20
09
20
12
Nat
ion
al G
DP
(cu
rre
nt
US
$)
Po
pu
lati
on
(th
ou
san
ds)
Development of sewage system in São Paulo
Population
National GDP per capita(current US$)
18
89
: 1st
Rep
ub
lic
19
32
: Pau
lista
War
19
64
: Mili
tary
co
up
, M
ajo
r in
vest
men
ts in
in
fras
tru
ctu
re
18
93
: pu
blic
an
d p
riva
te w
ater
su
pp
ly
19
70
: M
etro
po
litan
San
itai
on
19
73
: SA
BES
P c
reat
ed
19
82
: Nat
ion
l En
viro
nm
enta
l Po
licy
19
93
: Cle
an u
p e
ffo
rts
fo
r R
iver
Tie
tê
19
88
:Tri
plin
g o
f se
wag
e
WW
T b
y SA
BES
P
19
77
: 3 W
WT
pla
nts
bu
ilt
23
4. Historical review of waste management
Considered usually an urban issue, municipal solid waste is less prevalent in rural
areas as its population has a reduced economic capability to purchase items
resulting in more waste (Hoornweg and Bhada-Tata, 2012). As current urbanization
is to increase in the future, the adequate management of municipal solid waste will
continue to be a challenge.
4.1. Vienna
While hygienic conditions in the second half of the eighteenth century improved, it
was not for the purpose of disease control in itself, but initially only served to
improve the health of the soldiers and officers. Albeit too late, Maria Theresa
realized that a major reason for the devastating defeat in the war over Silesia, layed
in the poor general state of her army (education and health). Therefore, the
promotion of hygiene and medicine were considered crucial prerequisites to sanitize
the city. Joseph II recognized that public health was reflected in the economic
development and as such put great emphasis on general medical care. Advances in
science and knowledge about the origin of epidemics, provided an additional
impetus to clear districts of waste and debris and laid the foundation for the
technical discipline known today as waste management.
Since its early beginnings, street cleaning and waste collection was a simple
process. As stated by official decree, household waste was to be moved outside the
city. The lack of enthusiasm by the population at large however ensured that most of
the trash stayed within city confines. As a result, the city government started to offer
inhabitants the possibility to let garbage fleet collect their household waste (MA48,
2013a). Waste management in the 1800s was a first measure to keep the city clean
and hygienic to ensure the public health and therefore the economy (Ossberger,
1997). Only in 1839 was the first garbage collection system established and made
compulsory. Back then, the so-called “Mistbauer”, in essence people that collected
the garbage from the Vienna’s inhabitants in their own homes, ensured the transport
and further disposal with their vehicles. It is interesting to point out that the city
government had no legal responsibility to provide garbage collection to its citizens
even though the provided service remained free of charge until 1934.
24
As of 1880, the solid waste collected by the “Mistbauern” was deposited in the
landfill site “Bruckhaufen” in Vienna. Around 1895, this landfill led to the sprawl of
illegal settlings in its surroundings creating what was referred to as the slums of the
district (Licka and Krippner, 2011). In the year 1904, Vienna was already operating a
fleet 104 horse powered collection chariots. Within the city center’s first district,
garbage was collected on a daily basis, or at least once to twice a week. The
collection was advertised by bell sounds, upon which households prepared and
moved their trash outside their homes for collection.
Towards the end of the nineteenth century, the city’s sanitation requirements had
increased. Thus, the lack of effectiveness of the uncovered and street polluting
chariots became apparent to the public. Consequently, household waste was placed
into standardized containers or bags prior to collection. During several years, the
city experimented with different attempts to improve solid waste management, such
as the introduction of waste container switching system35 consisting of switching full
containers against empty ones. After many trials and errors, Vienna decided in 1913
to settle for the “container-emptying solution”. With the start of World War I, waste
management became a low priority.
In the years up to 1918, significant changes took place in the areas of sewage and
solid waste disposal that lasted up until today. Some of these new constructions
included the re-organization of pre-existing garbage collection services, and the
definition of future requirements for the garbage truck fleet infrastructure. It was only
in 1918 that certain districts in Vienna tried implement the “Colonia” system36, which
consisted of placing tight-sealing garbage containers in buildings throughout the city
to be collected later at regular intervals by the fleet. The collection was almost free
from dust emissions and the handling of the containers was simple. From 1923 to
1928, the transition to the “Colonia” system was fully completed in all of Vienna and
the horse-powered chariots were phased out. In 1928, the City of Vienna had
already 901 of these containers.
Waste management in the years until 1938 was primarily influenced by the attempt
of improving the logistics by the introduction of the new collection system. Technical
innovations in recycling and disposal did not occur; the potential progress in the
installation of waste incineration failed due to lack of money, as well as the invasion
35 Wechselkastensystem in German
36 Named aptly after the city in which it was invented, Cologne.
25
of the German army. Despite the strict government guidelines and ambitious goals
of the Nazi regime, the success was limited because the responsibility to manage
waste was divided and delegated to various communities, multiple parties and
private enterprises, which was coherent with the typical Nazi polycracy. Vienna’s
population peak of 2 million inhabitants as well as the prognosis of 3 million people
by the year 1950 resulted in oversized garbage disposal facilities, which nowadays
still allow the city of Vienna to make necessary adjustments in these areas. After
1945, Austria was able to regain its political self-determination, and establish
relations with the wealthiest countries in the world in the subsequent years of
economic growth resulting in additional exchange of goods crossing the borders.
Vienna possessed relatively early, since the year 1956 various waste treatment
plants37 most of which were still in use until the 1980s (Ossberger, 1997).
In the years 1956 and 1963, the construction of the first composting plant for organic
municipal solid waste and the waste incinerator in Flötzerstieg was finished. The
growth of the Austrian economy in the postwar years until 1970, and thus the rise in
the standard of living of the population was clearly coupled to an increase in energy
and resource consumption. Greater than ever before, the amount of material
resources consumed and produced had a major impact on waste management up
until the 1990s. Due to the lack of regulations and laws, the disposal of waste went
up in the 1970s caused mainly by the unorganized dumping of that time. Because of
the illegal nature of this waste dumping activity, available data on waste quantities
and types of recovery is poor at best. Following the impact of the report of the Club
of Rome, "Limits to Growth38" and various environmental disasters in the 1970s,
people began to pay increasingly more attention to environmental concerns. In the
1970s a separate Ministry of Environment was established closely followed by
federal legislation on waste management (Ossberger, 1997).
In 1981, the incinerator for toxic waste at the waste disposal plant in Simmering
(EbS)39 plant was built. The beginning of the 1980s was marked by a critical view of
the management of solid waste in Vienna, specifically the increased use of waste
incinerators at the expense of reduced recycled materials. In response to these
37 With the exception of organic matter (Biomüll in German)
38 The Limits to Growth is a 1972 book commissioned by the Club of Rome in which a
computer model simulated potential scenarios and consequences of the interaction between the Earth’s and human systems. 39
Entsorgungsbetriebe Simmering in German
26
criticisms the Department of waste management and street cleaning (MA48, 2013a),
developed a municipal solid waste management plan for Vienna in 1985. This plan
was presented to the city council of Vienna containing objectives such as, the
prevention or where not possible the reduction of volume of waste resulting from the
production processes of services and goods with respect to quantity and quality of
the waste produced. Additionally, waste separation was to be implemented, to
facilitate the re-use and further treatment in recycling plants (e.g. production of
secondary raw materials and direct use of energy present in solid waste). The waste
that could not be re-used was to be disposed of in such a way as to cause the
smallest possible impact on the environment. To achieve these objectives several
activities were considered; among them was the collection of toxic domestic waste,
an increase in the collection of recyclable materials, the rebuilding and
modernization of the Rautenweg landfill, the upgrading of Vienna’s waste
incinerators with state-of-the-art air pollution control systems as well as the
modernization of toxic waste incinerator in EbS Simmering
As population and waste were growing in Vienna and it became increasingly difficult
to find new spaces to create new landfills, it became necessary to reduce the waste
generated. A proposal put forward the collection of organic waste such as food
waste and plants for composting as part of political efforts to reduce waste and re-
use materials. Due to the social and political conditions at the time, the debate and
the resistance to create additional landfills and waste incinerators materialized into a
ban prohibiting the construction of new units indefinitely. The plan was to use the
only landfill in Vienna; only possible with a reduction of municipal solid waste. Based
on this diagnosis, goals were defined in the new environmental policy objectives in
1985. Vienna’s solid waste management established the reduction of the volume of
waste produced, the recovery and treatment of waste (secondary raw materials,
organic materials and energy present in waste) and the treatment and final disposal
of waste as its main priorities. These priorities reflected the main objectives of solid
waste policy in the 1990s in Europe, represented by guidelines published by the
European Community. The waste management law of 1990 40 was essentially
composed of guidelines in part from the Swiss waste management practices and
pieces of legislation, which originated in different Austrian states. Since then, the
40 Abfallwirtschaftgesetz 1990 in German also referred to as AWG 90.
27
perception of waste management has shifted from a technical to an environmental
issue to protect the life and natural resources (Ossberger, 1997).
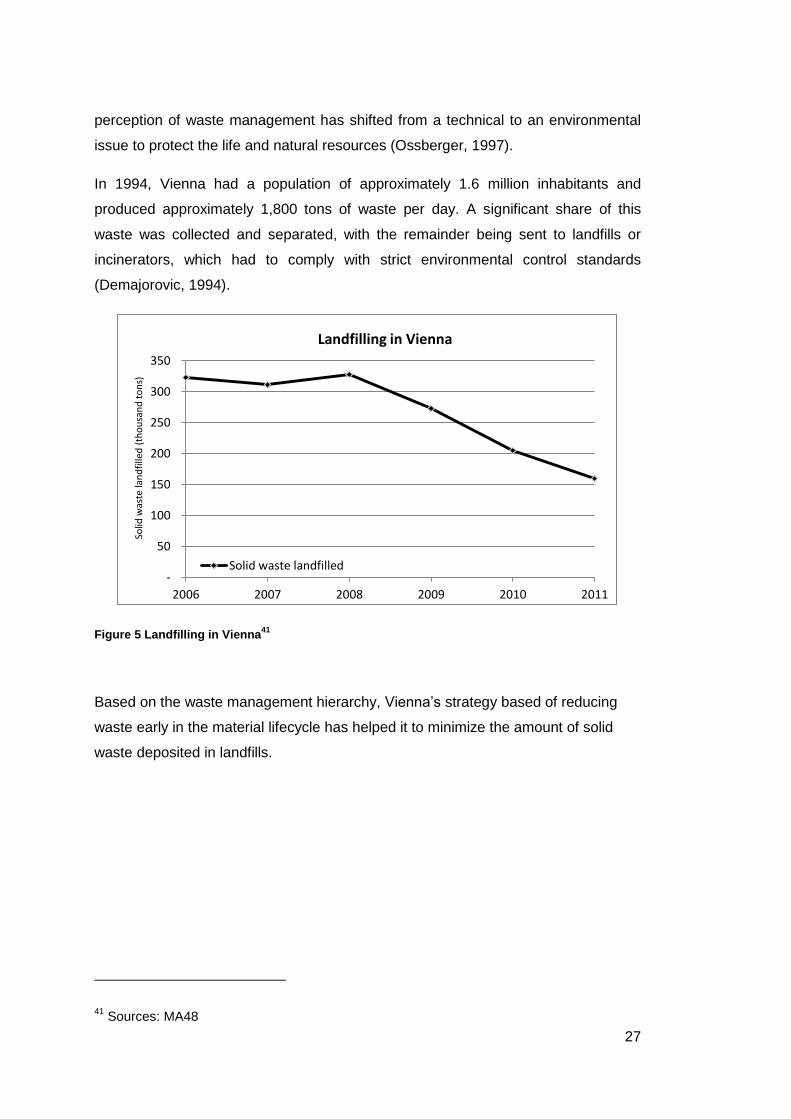
In 1994, Vienna had a population of approximately 1.6 million inhabitants and
produced approximately 1,800 tons of waste per day. A significant share of this
waste was collected and separated, with the remainder being sent to landfills or
incinerators, which had to comply with strict environmental control standards
(Demajorovic, 1994).
Figure 5 Landfilling in Vienna41
Based on the waste management hierarchy, Vienna’s strategy based of reducing
waste early in the material lifecycle has helped it to minimize the amount of solid
waste deposited in landfills.
41 Sources: MA48
-
50
100
150
200
250
300
350
2006 2007 2008 2009 2010 2011
Solid
was
te la
nd
fille
d (
tho
usa
nd
to
ns)
Landfilling in Vienna
Solid waste landfilled
28
4.2. Mexico City
During pre-Hispanic times, the problem of garbage in Tenochtitlán 42 was the
responsibility of noble men and monarchs who decided to forbid the sale and
purchase outside market areas. Therefore, trash was rarely found on streets outside
markets. The cleaning system under the Aztecs was attended by over a thousand
men, which carried out their work with pride and satisfaction of having a clean city.
Later in colonial times, the viceroy Revillagigedo established the first group of horse-
drawn carts that collected garbage and deposited it in landfills.
In the early beginnings of independent Mexico, a sanitation system was established
in the Federal District with carts drawn by horse power, which in the morning and at
night passed through the streets ringing a bell for people to come and deposit their
trash. Failure to comply resulted in penalties in the form of fines imposed on those
who threw garbage in the street43.
At the end of the nineteenth century, garbage collection was carried out by a fleet of
about 80 carts. Councils in villages designated people to act as “salubrity police”44
and were in charge of cleaning the streets, markets, public squares, hospitals,
prisons, and remove everything that could alter public health (Reyes, 2004). In 1981,
the health council created Mexico’s first sanitary code (Ortega Gonzales, et al.,
2010).
In year 1936, the garbage collection and cleaning employed around 2,500 people,
while the vehicle fleet already included dump trucks handling the larger loads within
the city and delegating the mule carts to service the outer areas of the city. From
1940 on, two approaches were proposed to handle waste. The first was to recycle
the waste since it was one of the primary causes for contaminating the soil, air and
water. The second approach was to keep waste dumping sites as far away as
possible from the city. It was only a year later that both approaches were adopted
and Mexico City saw the construction of two of its first landfill sites45. Because of the
development model in force, which gave priority to the industrial sector over
42 Tenochtitlán was the Aztec city-state that became the capital of the expanding Mexican
Empire of the 15th century, and following its capture by the Spanish in 1521, was eventually renamed to "Mexico". 43
These fines supposedly increased with the number of offences, with 2 pesos for the first time; 4 pesos the second and third 6 pesos. 44
Salubrity refers to the promotion of good health. Policia de salubridad in Spanish 45
The landfills Santa Cruz Meyehualco and Santa Fe.
29
agriculture, Mexico's urban development in the last century was characterized by a
marked trend towards concentrating the population in a few cities. Between 1940
and 1960, Mexico City, being the most important economic center, was the first
destination to migrate to for a large number of people further increasing its
population from 1.7 to 4.8 million people between 1940 and 1960, looking for
employment and alternatives to rural life.
In the early 1960s the Urban Services Department was established and with it the
office of Solid Waste Collection, which up until now is responsible for the collection,
transportation, treatment and disposal of solid waste in the city of Mexico. In the
mid-seventies, the capital found itself with an exceedingly large concentration of
people and thus began to emerge as an expulsion zone, since it began to reduce
the number of its residents in midst its districts, a situation that persisted until the
late nineties (Castillo, 2005). During the urban sprawl spread to the neighboring
municipalities of the Federal District46, there was a significant shift from the center to
the periphery, constituting what is nowadays known as the metropolitan area of
Mexico City47 (ZMCM), which saw its population grow from 5,4 to 13 million between
the years 1960 and 1980 respectively (CONAPO, 1995). Thus, Mexico City’s
problem with solid waste in a broad sense cannot be reduced to the scale of the
Federal District, since its development implies growth and geographic expansion of
its metropolitan zone, and from an environmental point of view the whole basin of
the Valley of Mexico. Like elsewhere during the 1970s, Mexico experienced public
interest on environmental issues leading to the formation of the Environment
Improvement Undersecretary in 1972, which launched a countrywide program to
manage municipal solid waste. The program resulted in the establishment of
technical regulations for municipal solid waste (Ortega Gonzales, et al., 2010).
Faced with a high scale of urbanization from 1950 to 1970, the demand for public
services increased drastically, eventually leading to a crisis in 1980. At this stage,
traditional waste management was not able to meet public demand resulting from
the impact of modernization in the Federal District. In 1980, a series of conditions
became apparent. For one, open dumping was common practice in the city; there
46 Throughout this paper Mexico City may be referred to its coterminous Federal District
(stemming from its name in Spanish México, D. F.) 47
Zona Metropolitana de la Cuidad de México in Spanish
30
were nine open dumps48, which accumulated all of the waste arriving from Federal
District and parts of neighboring municipalities. The garbage truck fleet was in a
deplorable condition with outdated models that were not in service due to lack of
maintenance. Only 60% of the vehicle fleet was used at a time. Mexico City had
permanently many illegal dumping sites in vacant lots, alleys, canyons, etc. There
was and still remains a strong presence of groups of scavengers, represented by
leaders who exploit their labor in waste separation. These scavenger groups are
part of an informal economy with all the implications of such working conditions.
Similarly, while official garbage collection and cleaning workers are in the payroll of
the city government and receive a salary, they constitute an organization that works
in a private manner based on parallel profits to their salary in the form of "tips" paid
by the public.
After a period of solid economic growth, falling oil prices coupled with increasing
world interest rates and increasing inflation caused Mexico to experience a severe
economic crisis in 1982 leading to high levels of unemployment and further
stimulating migration to the capital. Between the years of 1983 and 1988, President
Miguel de la Madrid launched the National Plan of Development 49 , effectively
integrating environmental issues into the political agenda for the first time
(Valenzuela, 2005). As of 1983, a reform of the Mexican constitution specified in its
115th Article that municipalities would be in charge of street cleaning, waste
collection, transportation, treatment and final disposition of solid wastes.
Moreover, the year 1983 saw to closure and rehabilitation of Meyehualco Santa
Cruz landfill, which consisted of covering solid waste with clay composites and
drilling holes to vent the biogas generated by the anaerobic degradation. The
closure of this landfill stimulated the development of others50. This exacerbated the
problem for garbage disposal in the Mexico City. One topic of interest was the
spread of ecological deterioration in neighboring municipalities of the Federal District
caused by the inadequate management of solid waste, which had reached
worrisome proportions, since no control mechanisms were in place and in many
cases solid waste had exceeded the administrative capacity and management of
state and local governments. Between 1950 and 1993, Mexico City had almost
48 The nine open dumps were Santa Catarina, San Lorenzo Tezonco, Tlalpan, Cuautepec,
Milpa Alta, Santa Fe, Tláhuac, Venustiano Carranza and Gustavo A. Madero 49
Plan Global de Desarrollo in Spanish 50
Santa Catarina, San Lorenzo Tezonco, Tláhuac, Milpa Alta, Tlalpan and Bordo Xochiaca
31
tripled the amount of solid waste produced by its inhabitants, while simultaneously
changing the composition of the waste from close to 5%, to 40% of non-organic
waste (INEGI, 1994).
In 1984, the city government decided to reverse this situation, implementing the first
solid waste strategy (PMRS)51, created by the Urban Services Department. The
main goals of the strategy were to close down, clean up and rehabilitate the ten
biggest dumps in Mexico City. Moreover, the strategy included the renewal of the
garbage vehicle fleet and the expansion of the areas covered. A major infrastructure
was created to allow the efficient transfer of waste solids from large trucks and
guarantee the eventual arrival to its final disposal site. Programs for the removal of
illegal dumping sites were introduced throughout the city. Additional landfills were
built to control the disposal of municipal solid waste. One of the world’s largest
landfills, the “Bordo Poniente” was opened in 1985 including high-density
polyethylene barriers to protect leaking of leachate. The strategy also foresaw the
planning and formal management of solid waste, taking into account various studies
and data to identify the type of waste and its generation. These goals were
accomplished in large part to try to maintain the control and solid waste
management in the Federal District. Yet these changes led to strong clashes with
groups of workers of the Department of the Federal District and scavengers groups,
who saw the prospect of seeing their economic and political power vanish, and did
not allow modifying the processes necessary for real change in the city’s solid waste
management. The misalignment of political interest explains best why waste
management in Mexico City has suffered from “up and downs” up until its present
state.
In 1988, a new law known as the General Law of the Ecological Equilibrium and the
Protection of the Environment (LGEEPA) 52 was created to establish the
responsibilities and environmental duties of the Mexican government (Valenzuela,
2005). This enactment of this law resulted in the creation of the Official Mexican
Standards (NOM)53, in charge of the location, design, building and operation of the
different landfills used for MSW final disposition.
51 Plan Maestro de Residuos Sólidos (PMRS) in Spanish
52 Ley General del Equilibrio Ecológico y la Protección al Ambiente in Spanish
53 Normas Oficiales Mexicanas in Spanish
32
The creation of the Metropolitan Commission for the Preservation and Control of
Environmental Pollution (COMAPA)54 in 1990 was the first attempt to take action
against solid waste. The Federal District established an organizational structure that
allowed it to manage the problem. Nonetheless, in neighboring municipalities the
situation became worse. A clear inequality in waste management existed between
Mexico City and its neighboring municipalities, making it necessary to create a
regional authority with the concrete responsibility to develop and operate a
comprehensive strategy to manage solid waste in the whole area.
By 1990 the metropolitan zone of Mexico City had become the most densely
populated area in the country with around 17 million people, corresponding to
around 20% of the total population in Mexico, a number that has more or less held
steady over the last decades. Eventually the city started to show symptoms of
overpopulation, with its public service infrastructure not being able to meet the
demand, the irregular use of land, settlings on inadequate areas, and an
accumulated deficit in the provision of urban facilities in general. All this contributed
to create social pressures and different levels of social marginalization and policies
for its inhabitants. Given this situation and the need to solve these problems, the first
agreements had already emerged in 1988 between the Department of the Federal
District55 and the State of Mexico to coordinate actions and provide comprehensive
solutions to the metropolitan area (Castillo et al., 1995).
As of 1991, the waste generated in Mexico City ended up in three giant landfills56 to
replace six other sites that were closed 57 . In that same year, the gas from
uncontrolled waste caused thirteen fires and resulted in the death of numerous
victims, including children who lived in the surrounding area of the landfill. This
event led to the creation of the Programme of Metropolitan Solid Waste
Management in the year 1992 (Reyes, 2004). In the same year signed the
convention on sustainable development and biodiversity in Rio de Janeiro, laying
the path for new reforms at the national level and the creation environmental
organizations. In the same year, the National Ecology Institute (INE) was created.
54 Comisión Metropolitana para la Preservación y Control de la Contaminación Ambiental (COMAPA) in Spanish 55
The now dissolved Departamento del Distrito Federal used to be the public organ in charge of the government of Mexico City. 56
Bordo Poniente, Mountain Meadows and Santa Catarina 57
Milpa Alta, Tlalpan, Tláhuac, Tezonco San Lorenzo, Santa Fe and Meyehualco Santa Cruz
33
The Office for the Attorney General for Environmental Protection (PROFEPA) was
established to monitor and survey the implementation of new environmental laws.
With the opening of its markets and its entrance in the NAFTA agreement of 1994,
Mexico had to comply with a series of environmental regulations, in particular the
regulation of waste management leading to new reforms of the LGEEPA in 1996
(Valenzuela, 2005). In 1994, the prior fishing agency was expanded to give it new
environmental functions resulting in the creation of the Secretariat of Environment
and Natural Resources (SEMARNAT)58.
The General Law for the Prevention and Integrated Management of Wastes
(LGPIR) 59 was enacted in 2003, improving the lack of MSW management
regulations. With this law waste was considered, as a potential contaminant that had
to be avoided and where possible reduced to allow for its environmentally adequate
management. More importantly, waste was redefine as material with value because
of its potential reuse, recycling and the energy contained within (Cortines de Nava,
2001).
In 2004, the Program for Integrated Solid Waste Management 60 (PGIRS) was
launched with the goal of improving the coverage and effectiveness of public
cleaning and minimizing the generation and disposal of waste. For the first time,
education and communication strategies were considered essential for the
implementation of the remaining PGIRS strategies and currently pursued in search
for a cleaner city (SMA, 2010). In the same year, the NOM included updated
technical specifications for the design and construction of landfills in Mexico. This
new norms, defined separate leachate treatment, as well as biogas collection from
solid waste degradation as new standards.
Nowadays the various districts in Mexico City are themselves responsible for
collecting their solid waste and its subsequent transport to transfer stations. One
aspect that still has to be considered is the collection efficiency, which is largely
influenced by the type and model of the collection vehicle. The most efficient results
are obtained when using rear loading vehicles, because more waste can be
58 From 1982-1994 Secretaría de Pesca, from 1994-2000 Secretaría de Medio Ambiente,
Recursos Naturales y Pesca (SEMARP), from 2000 until present Secretaría de Medio Ambiente y Recursos Naturales (SEMARNAT). 59
Ley General para la Prevention y Manejo Integral de Residuos (LGPIR) in Spanish 60
Programa de Gestión Integral de Residuos Sólidos in Spanish
34
compacted and thus the loading height can be maintained, in turn resulting in less
trips to transfer stations and lowering fuel consumption.
35
4.3. São Paulo
In São Paulo until the year 1869, there was no regular garbage collection and
residents of São Paulo had to bury the trash in the backyard or use it to fertilize their
gardens since there was no garbage collection in the city. First attempts to manage
waste in the city of São Paulo dates from the nineteenth century. At that time,
certain areas far away from city center were designated for garbage disposal. The
responsibility of transport was up to the interested citizen. In 1869, the City Council
hired for the first time, a private company to perform home collection. In 1892, the
Office of Public Hygiene was established, and in 1893, a contract was signed with a
cleaning company, that included street and sewer cleaning, waste incineration and
cleaning markets.
In the twentieth century, solid waste management in Brazil was determined by
population growth and migration to the cities via changes in the consumption
patterns (Lopes, 2006). In the early twentieth century, the population of the city of
São Paulo had 240,000 and produced an average of approximately 10 tons per day
of waste, which were disposed of in uncontrolled open dumps (ABES, 2006). In
1913, the city began to tackle municipal solid waste, building a waste incinerator in
the city district of Araça with a capacity of 40 tons per day and introducing animal
driven carts to collect household waste. Before that, garbage was in large part
composed of organic matter and reused by residents for multiple purposes such as
building homes, as fertilizer or simply burning fuel. Garbage was also distributed to
carters, who fed it to animals. In 1914, the mayor of the city determined that the
cleaning services ought to be operated directly by the Municipality. As of 1925, it
started using a fermentation process stations, which can be considered as
precursors to composting systems. In 1940, São Paulo already had around 1,500
horse-powered vehicles at its disposal to keep the city clean.
The population reached 2 million people in 1950, and was generating about 1,000
tons of solid waste per day. At that time, thanks to its prior inauguration in 1949, the
Pinheiros incinerator based on American technology, was already operational.
Another incinerator, the Ponte Pequena, with a capacity of 150 tons per day, was
installed within 1959, and later on, in 1968 two additional incinerators in the
neighborhoods of Vergueiro and Ipiranga were built, with a capacity of 150 tons per
day. Yet the option of incineration as a way of disposing solid waste did not really
offer a significant change to the way waste was managed in the city of São Paulo,
36
because it represented only a small portion of the total waste generated in the city.
In 1970, the population of São Paulo reached 6 million inhabitants. Meanwhile, the
same time, the capacity of the three incinerators totaled 500 tons per day. With the
addition of composting plants 61 an additional 600 tons per day or organic waste
could be disposed of. Still until the early 1970s, open waste dumping was common,
particularly in the outer regions of São Paulo and along major rivers. In 1971, plastic
bags made out of polyethylene started to make their way into the solid waste stream
and the city was generating close to 12,000 tons of solid waste per day.
A Master Plan for Solid Waste Disposal62 in São Paulo, was drawn-up in 1977
representing a major shift in the policy for management of waste, in so far that
landfills were identified as the most suitable and cost effective method to dispose of
solid waste. On this basis, it was proposed to build 16 landfills in a timeframe of 15
years. By the year 1979, four new landfills63 were built and private companies were
hired to operate and maintain the waste disposal services. However, the remainder
of the plan could not be carried out due to evaluation errors made during the study.
Many of the foreseen areas for the construction of landfills were not immediately
expropriated because many were occupied by people who had newly migrated to
São Paulo, or because they were in watershed areas which are now protected by
law. Another factor was the growing awareness of the population in the suburbs,
which also started to mobilize against the construction of landfills in fear of reduced
living conditions and swindling property prices. In 1979, “Energetic Landfills”64 were
proposed for the first time to combine the objectives of an environmental alternative
and economic rentability. In the end, the projects were limited to traditional
constructions excluding the investments of the proposed new generation landfills.
From 1979 until 1994, few changes were made to São Paulo’s waste management
model. During the government of Janio Quadros65, bids were made to build two new
incinerators and composting plants respectively. These bids were eventually denied
due to the lack of convincing environmental impact studies and lack of definition of
the areas where the facilities were supposed to be built. In the end, the required
impact studies were carried out, but the projects were never resumed. During the
61 São Mateus and Vila Leopoldina
62 Plano Diretor para Disposição Final de Resíduos Sólidos in Portuguese 63
Lauzane Paulista, Banderiantes-Perus, Sapopemba and Sao Mateus. 64 “Aterros Sanitários Energéticos” in Portuguese refer to waste incineration power plants 65
Jânio da Silva Quadros served as mayor of São Paulo from 1986 to 1989.
37
Luiza Erundina administration from 1989 to 1992, the São João landfill was built to
dispose of household waste, while the Itatinga landfill was destined for inorganic
waste. Even though this administration started a program of waste separation and
collection, building a separation plant for the recycling of plastic, aluminum, glass
and paper, efforts proved too small since the actual quantity separated represented
around 1% of total household waste collected (Demajorovic, 1994).
As of 1994, São Paulo used a mix of landfills, waste incineration power plants and
composting plants to manage the city’s waste. The waste separation program was
disabled. Landfills in the São Paulo area suffered under the absence of a system
suitable to collect the leachate produced and the lack of control mechanisms to track
efficiency and accurately define the degree of environmental degradation. With a
population of approximately 11.5 million, the city of São Paulo was generating
approximately 13,500 tons of waste per day (Demajorovic, 1994). The city’s waste
was deposited in landfills, composting plants, incinerators and transfer stations.
However, none of these units had been constructed to avoid environmental damage
and is nowadays obsolescent. The operation of the current system of solid waste
management reflects two striking features valid for most municipalities; the neglect
of damage on the inhabitants of urban centers especially those living in remote
areas and the impact on the environment. The majority of waste treatment plants
are installed in neighborhoods far from the city center, saving the residents of the
central districts the inconvenience caused by unsuitable units and transferring these
problems to the residents of more distant neighborhoods. In 2006, three landfills
were in operation66 receiving around 90% of the waste produced in São Paulo. At
that time, São Paulo had only two composting plants67. Hospital waste was disposed
of in two incinerators68. The Pinheiros center sorted and recycled materials. Two
transfer stations exist to reduce transportation costs. In addition, the city plans on
building two incinerators within the city to extend the life of existing landfills.
Currently, the technical, economic and institutional situation in Brazil presents many
challenges to adequately manage solid waste in São Paulo. One often-ignored
aspect is the financial sustainability of the waste management services. In Brazil,
more than 50% of municipalities do not charge for the public services of urban
sanitation, and, when collected, these values are insufficient to cover the costs of
66 Bandeirantes, São João and Santo Amaro
67 Vila Leopoldina and São Matheus
68 Ponte Pequena and Vergueiro
38
providing the services. Moreover, it is commonly accepted, that especially in
Brazilian cities, that any type of transition towards a more efficient and sustainable
solid waste management without ensuring equal coverage for all levels of society
with adequate services for water, sewage and energy is not feasible (Jacobi and
Besen, 2011).
Likewise, it is becoming increasingly apparent that the fee structure has to be
flexible, in order to increase efficiency in waste management. In other words, the
applicable rate has to be proportional to the waste quantity generated to make this
public service sustainable and more importantly raise awareness and educate
citizens to encourage them to reduce the quantities of waste produced. Currently the
federal government is investing in the construction of landfills and energy recovery,
central sorting stations, composting centers and training for informal waste workers
(scavengers). However, the Brazilian reality requires the commitment of municipal
leaders to choose appropriate solutions with reduced costs and technologies
compatible within the local context, as well as a fair remuneration for the service
rendered by waste pickers. Strategies to promote waste reduction of the generating
sources through a combination of environmental education and permanent waste
separation services that include informal waste workers to reduce waste disposal on
the ground have yet to emerge. The lack of land for waste disposal is a global
problem, and São Paulo is no exception. Even though an increase in public
awareness has been observed, São Paulo’s residents have little information on what
happens to their trash and thus have little say to decide on how best to manage it. In
addition, there are institutional spaces for dialogue with the city universities and
nongovernmental organizations that work with solid waste management for the
construction of a model of management for the city.
Of course, barriers associated with the private economic interests do exist and are
part of a vicious cycle which is incentivized by contracts that focus on the collection,
transfer and landfilling. At present, the challenge is to reverse the prevailing logic
and invest more in the reduction of overproduction and waste, as well as separate
collection and composting, and less on the final destination. In São Paulo, there is
already a large contingent of collectors arranged. The expansion of waste sorting is
urgent and strategic. If well conducted in the future, it may represent an opportunity
to reduce the costs of the city, as these services will generate thousands of jobs and
promote a greater sense of co-responsibility among citizens in regards to urban
sustainability (Jacobi and Besen, 2011).
39
5. Qualitative analysis of disease vectors for untreated
wastewater versus inadequate landfilling
The risk for disease transmission from contaminated solid waste through the
handling and disposal of contaminated food, waste from pets and baby napkins may
be the same as through the collection and disposal of excreta and sewage (WHO,
1991). This insight demands that solid waste and related health risks be assessed to
establish clear guidelines on the priorities of waste management implementation
5.1. Health issues of untreated wastewater
The potential for pathogenic proliferation in water is great because inadequately
treated wastewater effluents can cause eutrophication in receiving water bodies and
thus lead to the creation of environmental conditions that favor the proliferation of
waterborne pathogens of toxin-producing cyanobacteria. Despite the beneficial role
that various microorganisms play in wastewater systems, a great number are
thought to contribute to various waterborne outbreaks. Additionally, analyses of
wastewater effluents have revealed a range of anthropogenic compounds, many of
which have endocrine-disrupting characteristics (Akpor and Muchie, 2011).
Transmission of diseases encompasses humans and animals, increased levels of
nutrients may cause eutrophication of water bodies leading to other unwanted side
effects for aquatic organisms and subsequently for the rest of the food chain.
Around 90% of wastewater produced globally causes water pollution because it
remains largely untreated in developing countries.
As water is ever more becoming a precious and rare resource in some parts of the
world, the use of untreated wastewater is affecting agriculture (Scheierling et al.,
2010). The link between agriculture and wastewater is amplified in the case of
developing countries where the majority of the livelihoods depend on the resulting
agricultural output. Due to the relentless increase in urban population worldwide,
local farmers have to compete with municipalities for water to irrigate their crops. As
agriculture is competing with expanding industry and municipal use of water,
wastewater irrigation becomes a welcome solution. The concept of using agricultural
lands to dispose of wastewater and simultaneously enrich soils is not a new one by
any means, but the disadvantage of this solution is that it effectively provides a
40
closed-loop system for pathogenic microorganisms to propagate, manifesting itself
in the spread of diseases (Loehr, 1977). The implication of these conditions
becomes clear; with a lack of wastewater treatment and limited access to clean
water, in developing countries whose economies rest on agricultural output and
have to use untreated wastewater for irrigation even if it represents a health risk to
their population. Despite the long tradition of wastewater irrigation, efforts to quantify
the location and amounts of re-used wastewater are confronted with methodological
problems (Khouri et al., 1994).
Because wastewater carries pathogenic organisms, it can have serious
consequences, particularly if the produce is consumed raw. While no complete
inventory on global wastewater irrigation exists, global figures usually cite around 10%
of irrigated land. Used for irrigation, wastewater can be raw (untreated) or reclaimed
(treated) and can be applied directly to crops or indirectly through dilution in rivers
and reservoirs after discharge. While reuse can be an intentional part of a project, in
developing countries, it just happens. The use of wastewater depends on the region
and the wastewater treatment in that region. Nonetheless, because the costs of
improving sanitation are considerable compared to other more immediate needs, it
seems that for the foreseeable future raw wastewater will continue to find its way on
to agricultural lands (Jimenez, 2006). Despite the inconclusive literature regarding
the impact of wastewater irrigation on public health, studies in Mexico City using
non-specific parameters, such as TOC69 (Mazari-Hiriart et al., 2008) confirm that its
addition as a fertilizer supplies a considerable nitrogen load to the aquatic system,
offering a suitable conditions for the propagation of microorganisms.
5.2. Health issues of inadequate solid waste management
Since landfills represent the most cost-effective waste management solution they
tend to be prevalent in particular in developing countries, including the cities within
scope of this study. Thus, the question remains; is it the most effective method to
achieve the long-term goal of protecting human health? Another major health hazard
is the incineration of solid waste without the appropriate emission controls. The
resulting gas of burning the waste may contain high amounts of toxic and hazardous
materials, such as HCl, HF, Furans and Dioxins. Residential areas in close proximity
69 Total Organic Carbon
41
to these incineration processes may be at risk. While deserving of a more in-depth
review in itself, incineration is not considered in this paper, since it does not
represent a common waste management strategy in the cities chosen.
Solid waste management has historically represented a risk factor for the health of
human beings particularly in urban areas. Yet its risks are not exclusive to those
directly involved in the handling of the waste but also nearby residents. Depending
on the actual exposure time of workers, the occupational health risk may be less
than the environmental health risks of residents whose exposure times are often
longer than those of the workers (Cointreau and Mundial, 2006). Causal links
between landfill sites and adverse effects on health in neighboring residential areas
is a topic of continuous concern. However establishing whether such as link actually
materializes is a complex process, crossing many areas of expertise. Most studies
to-date have been epidemiological in nature and thus cannot confirm an isolated
causal link (Hester and Harrison, 2002). The available epidemiological literature
tends to focus on hazardous waste sites and their effects on human health. The
landfill sites reviewed in these studies tend to be large, old, and subject to limited
environmental controls while receiving liquid chemical and/or hazardous wastes
(Fielder et al., 2000; Roberts et al., 2000). As rigorous epidemiological studies are
extremely difficult to achieve and by their very nature cannot demonstrate causality.
Health issues arising from inadequate solid waste management practices are
multifold. Fecal matter often found in municipal solid waste can leak into the
groundwater via leachate of landfills. The attracted insects and rodents from the
waste can lead to the spreading of diseases such as cholera and dengue fever.
More critically the irrigation of crops, bathing and drinking of untreated water leads
to the consumption of pathogenic organisms and other contaminants (Hoornweg,
2000). In fact, improper solid waste management has been linked to 22 diseases by
the U.S. Public Health Service (Hanks, 1967).
The principal infective agents in solid waste have their origin in the contamination
through fecal matter. Therefore, solid waste contaminated with fecal matter may
contain four groups of pathogens: viruses, bacteria, protozoa, and helminthes
(Feachem et al., 1983).
Potential risks to human health in solid waste require the presence of a particular
pathogen as a pre-condition. Moreover, a complex system involving multiple
interrelated factors influences the resulting impact in measurable terms of human
42
disease or infection. A potential health risk for humans from exposure to solid waste
is only possible if an infective dose of virulent pathogens is present. The probability
that the threshold dose for a specific pathogen and for a route is reached, is highly
dependent on several characteristics of the pathogen itself. These properties include
the concentration of pathogenic organisms, the time it takes between the first
pathogenic release to the environment and infectivity (latency), the actual survival
rate of the pathogens in the environment (persistence) and the ability of the
pathogen to multiply in that environment. While many of these properties vary
depending on the pathogen and the environmental conditions, the evidence seems
to support that many pathogens can survive for extended periods of time on water,
ranging from days to several months (WHO, 1991).
While the possibility that pathogens in solid waste may be aerolized or inhaled by
the public or, in this case more likely solid waste workers does exist, it is considered
a very unlikely transmission pathway and thus a low-risk exposure mechanism.
Transmission through direct contact, such as cuts or abrasions embodies a real risk,
yet is mostly limited to the direct handling of waste typically performed by solid
waste workers, scavengers, and children.
Alternative routes of disease transmission are through passive vectors, such as
insects. The two relevant main groups of insects are the two-winged fly (Diptera)
and cockroaches (Dictyopera). While not many insect species have the ability to use
waste storage and disposal as breeding sites, those that do can result in very large
numbers. As a result, they may reach numbers high enough to endanger public
health. Apart from mosquitoes, the families of the housefly (Muscidae) and the
blowfly (Calliphoridae) are the most common ones linked to waste since they breed
in fecal matter and come into contact with humans when feeding on his diet as
adults. Cockroaches on the other hand are drawn to the moisture of waste systems
and are potential carriers of fecal pathogens. The significance to human health of
the pathogenic carriage by these insects is dependent on their behavior and other
transmission modes of these pathogens. Poor or inadequate solid waste practices
particularly in landfills, may also attract rodents.
Infection through ingestion caused by inefficient composting treatment processes
offer another ingestion route. Helminthes have been shown to have high persistence
levels (survival rates) in the environment and the final compost product, especially if
the composting system itself does not achieve 100% kill of these organisms.
43
Subsequently this fertilizing agent is applied to land, where its potential for health
issues is even greater, as it eventually finds its way into the human body by
consumption of crops. In cases of raw or uncooked, and thus unsterile consumption
such as salads, the risks of contamination are even greater.
Solid waste practices are also associated with other health risks, such as poorly
controlled landfills or abandoned landfill sites, as these cost-effective waste
management practices can cause the pollution of groundwater via leachate.
However, the groundwater pollution is unlikely to be pathogenic in its form, since the
soil acts as an efficient filtering device for the leachate. Nevertheless, if connected to
the water supply without adequate treatment, leachate will affect groundwater
quality and consequently human health as it contains many toxic materials (WHO,
1991). Regarding the viable pathogenic presence in leachate reaching the soil, few
of the reports in the technical literature indicate any scientific investigation.
Numerous studies cover the persistence of non-pathogens (bacteriophages) in
water and soil, others were performed under laboratory conditions. Thus, any
conclusions on the health hazards that exposure to pathogenic organisms via waste
disposal on soils might represent is limited. Moreover, a multitude of existing
information regarding the survival of organisms is largely controlled by a great
number of variables that make the results even harder to reproduce (Loehr, 1976).
The inconclusive findings from literature, while deserving of a separate in-depth
review, remain outside the realm of this paper. In summary, the potential of disease-
transmitting agents to survive in soils receiving waste is regulated by a great deal of
variables. Longevity and pathogenicity depend on many factors; pathogenic
persistence drops when placing these microorganisms placed into the chemically
hostile environment that is soil. Organisms adapted to certain temperatures and the
nutrition of host cells, are particularly vulnerable to the biologically competitive
conditions of soil. The presence of dangerous bacteria, protozea and other
infectious agents in receiving soils ought not be ignored, but the scientific
observations of close to 100 years have identified hardly any instance, where
appropriately treated human or animal waste caused disease when applied to
agricultural land in a careful manner. However, the limitations of the previous
statement regarding the safety of applying waste to soil must be emphasized; If food
crops are consumed too soon after application of pathogen-containing waste, if
leachate was to reach ground water, then direct or indirect waste application to soil
can be considered a dangerous health risk. When compared to several available
44
alternatives to utilize or destroy the vast quantities of anthropogenous biological
waste, the choice of soil disposal seems to be the lesser of two evils (Loehr, 1976).
Rainwater percolating through solid waste also carries a large amount of pollutants
to the groundwater in the form of leachate, particularly if the underlying strata tends
to be pervious or fissured (Bhide and Sundaresan, 1983). While legislation and high
standards of practice in developed countries avoid leachate contamination of
groundwater by using impermeable barriers in the landfills, these precautions are
rarely implemented in developing countries.
While the literature on global soil properties is expanding at a rapid rate, the
selection of landfill locations particularly in countries like Mexico seem random, not
taking into consideration any previous analysis of environmental impact. The
disperse population distribution in these areas seems to be a crucial factor in the
uncontrolled dumping of solid wastes, turning these regions into sources of
groundwater contamination (Reyes-López et al., 2008).
Landfill gas emissions: Landfill gas consists mainly of methane (CH4) and carbon
dioxide (CO2) but contains also a range of organic gases in trace amounts. Rather
than the bulk gases it is the trace gases (e.g. H2S) that are of concern in public
health assessments (Hester and Harrison, 2002). The exposure to landfill gas
depends on the atmospheric dispersion of the emissions between the source and
the receptor location. As the gaseous emissions disperse in the atmosphere, the
trace constituents a diluted. Moreover, the level of dilution depends on many factors,
such as distance and orientation between source and exposure point, as well as
climatic conditions70. Whilst in theory the existing epidemiological data on landfill
studies indicates that a source-receptor pathway may potentially result in exposure
by inhalation to gaseous contaminants from landfill sites, the ambient air
concentrations of trace gases are not sufficiently high to represent a theoretical
basis for adverse health effects. Ultimately, additional studies examining real-world
measurements of pollutant concentrations in landfill neighboring communities are
needed to confirm or refute this conclusion (Hessner and Harrison, 2002).
70 Wind speed, direction and atmospheric stability
45
6. Quantitative analysis of TOC and nitrogen emissions from
untreated wastewater and improper landfilling
6.1. Untreated wastewater
In the field of environmental chemistry and water quality, in particular when
performing quantitative assessments of pollution in wastewater, it is common
practice to make use of the population equivalent (PE). The population equivalent
serves as a reference value for the emission load in wastewater. According to the
main wastewater treatment plant in Vienna, the typical PE value for untreated
wastewater is PE60. It can contain the biological oxygen demand period (BOD)71,
the chemical oxygen demand (COD)72 and total organic carbon (TOC)73. TOC is an
established technique to gauge water quality when performing environmental
analysis and is non-specific of all organic materials present. Moreover, high
concentrations of TOC can confirm the presence of potentially harmful organic
chemicals. This quantitative analysis will focus on the TOC of untreated wastewater
for the cities covered (Andrew, 2005).
Table 2 Established values for TOC and N contents in estimations
Medium TOC Nitrogen
In untreated wastewater 45 g per capita/d74
11 g/d75
In solid waste76
250 g/kg 4 g/kg
For an explanation of the full procedure, please refer to annex 1 and 2.
71 The BOD5 measures the amount of dissolved oxygen required by aerobiological
organisms in water to digest present organic material for specified amount of time and is a solid indicator of the degree of organic pollution (Andrew, 2005). 72
The COD provides a value of the amount of organic compounds present in the water (Andrew, 2005). 73
In this context, the TOC quantifies the amount of carbon in water. 74
As mentioned in (Gujer, 2007; Arceivala and Asolekar, 2007) 75
idem. 76
However, since 2008, only incineration residues have been landfilled in Vienna. Thus, a TOC content of 30g/kg and a nitrogen content of 0.4g/kg will be assumed.
46
Table 3 Estimated TOC and N in untreated wastewater77
Austria (2012)
78
Mexico City (2011)
São Paulo (2010)
Population 8,219,743 8,851,080 11,253,503
Households with sewage system (%) 99% 99.20% 96.11%
Wastewater treated (%) 99% 79% 75%
Untreated wastewater 1.99% 21.63% 27.92%
TOC in untreated wastewater (tons/year)
135,009 145,379 184,839
N in untreated wastewater (tons/year) 33,002 35,537 45,183
Total TOC emitted (tons/year)79
2,690 31,450 51,600
Total N emitted (tons/year) 660 7,690 12,610
77 Final values have been rounded to 2 significant digits. For detailed figures please refer to
annex 1 and 2. 78
Due to the lack of available data in the case of Vienna, estimations for the emissions in Austria were performed
47
6.2. Improper landfilling
To estimate the amount of TOC and nitrogen in leachate, it is necessary to establish
how much solid waste goes into landfill sites. The estimations distinguish between
different landfills depending on the technical specifications of the leachate treatment
in place. Where this is not possible due to lack of data, established values in the
literature indicating solid waste generated per capita are used.
The assumption is that landfills fall into three main categories. Generally defined the
3 classes of landfills are:
Sanitary landfills with state of the art leachate treatment
Landfills with poor leachate treatment
Open dumping
6.2.1. Vienna
The sanitary landfill site also known as “Deponie Rautenweg” in Vienna is the only
landfill currently operating in the city and as such is responsible for the disposal of
all residual waste. As of 2012, 125,758 tons of solid waste found their way into this
landfill (MA48, 2013b). On its boundaries the surroundings of the landfill site
Rautenweg are protected by two leak-proof walls separated 8 meters from each
other. In addition, both walls go deep enough into the aquiclude80 to separate the
groundwater under the landfill from the surrounding groundwater. Moreover, the
space between the two leak-proof walls has been sub-divided into 49 leak-proof
chambers. Water from the landfill is pumped out and channeled into the sewage
plant in Simmering for further treatment (MA48, 2013c). As a result of such high
safety standards, the “Deponie Rautenweg” can safely be considered a class 1
landfill. Vienna deposits 125,758 tons of solid waste per year on the landfill site
Rautenweg. Because the rest of the waste is accounted for and processed in
different waste treatment plants, it is assumed that open dumping is non-existent in
Vienna (MA48, 2012).
80 The aquiclude or aquifuge is a geological formation that absorbs and holds water but does
not transmit it
48
6.2.2. Mexico City
Due to the overwhelming number of landfills in Mexico City, finding accurate data on
amount of solid waste deposited remains a challenge. Fortunately, established
values for the average per capita waste generation in Mexico do exist and will be
used to perform the approximations. Yet the numbers published depend upon
multiple factors such as size of city and economic development. Studies in the field
suggest 1.13 kg per day (Valenzuela, 2005) and yet others such as the secretary of
social development go as low as 0.870 kg per day, while INEGI suggest values
between 0.068 kg to 1.33 kg per day (de Vega, et al., 2006). For the purpose of
simplicity, the calculations will use a value of 1 kg per capita per day of solid waste
generation.
6.2.3. São Paulo
The city of São Paulo generates daily a total of 18,000 tons of solid waste. Of this
amount 10,000 tons come from households (Prefeitura São Paulo, 2012a). As of
2013, two landfills are in operation serving São Paulo. One is the “Central de
Tratamento de Residuos Leste” (CTL), the other is the “Aterro Caieiras” (CTVA).
Other landfills such as the Aterro São Joao and Aterro Bandeirantes have been
closed down in 2009 and 2007 respectively (Prefeitura São Paulo, 2012b). The CTL
landfill has a leachate treatment station, where the fluid is collected and delivered for
further treatment. The landfill also captures gas and transforms waste into energy
through pipelines transporting the methane and burning it. Thus, the technical
description classifies the CTL as a class 1 sanitary landfill.
The CTVA landfill is the largest central treatment and recovery plant in Latin
America with an area of 3.5 million m². The landfill has a base sealing system
consisting of a 2-meter thick ground layer as well as a synthetic geo-composite
barrier and high-density polyethylene geo-membrane. The leachate generated
during the decomposition of organic matter in municipal solid waste and rainwater is
collected thorough a drainage system and then transported to storage tanks for
subsequent appropriate treatment at the Brazilian waste management company
49
SABESP81. The biogas82 generated in the landfill is pumped through drains and
transported to the burners for combustion (Caieras, 2013; Candiani and Silva 2011).
As a result the CTVA can also be considered a class 1 landfill.
Table 4 Classification of landfill sites
Classification Description TOC and N content in
leachate post-treatment
Class 1 Sanitary landfills with state of
the art leachate treatment 0- 10%
Class 2 Landfills with poor leachate
treatment 10-50%
Class 3 Open dumping 50-100%
Since their inception, both landfills have been operating at full capacity. The CTL
receives on average 1.74 million tons of household waste a year (6,000 tons per
day). The CTVA receives 7,000 tons of solid waste a day (Silva et al., 2013).
81 SABESP is owned by the state of São Paulo and is the world’s largest waste management
company by market capitalization.
82 Primarily consisting of methane, carbon dioxide, oxygen and other trace gases.
50
6.2.4. Estimating TOC and nitrogen content for unaccounted solid
waste in Mexico City and São Paulo
Based on the comprehensive study of the Brazilian Institute of Geography and
Statistics the shares of unaccounted solid waste (not being disposed in class 1
sanitary landfills) has been estimated in order to calculate their emission load.
Inferred from the study, the following percentages for cities with more than 1 million
inhabitants have been calculated and are subsequently used as a basis to estimate
solid waste shares in class 2 and class 3 landfills (IBGE, 2008)
Table 5 Estimated shares of solid waste between different landfill classes8384
Total solid
waste
(tons/year)
Solid waste deposited
in class 1 (tons/year)
Solid waste deposited
in class 2 (tons/year)
Solid waste
deposited in class
3 (tons/year)
Shares (%) 100% 81.89% 15.97% 0.02%
Mexico City 3,162,470 2,645,730 515,960 780
São Paulo 6,570,000 4,745,000 1,822,230 2,770
The following table presents the total amounts of TOC and N contained in all solid
waste deposited across all landfills. Minimum and maximum values of the different
ranges were defined as part of the landfill classification.
Table 6 Estimations of TOC and N emitted by landfilling85
Minimum TOTAL of TOC
emitted (tons/year)
Maximum TOTAL of TOC emitted
(tons/year)
Minimum TOTAL of N emitted (tons/year)
Maximum TOTAL of N
emitted (tons/year)
Vienna - 4 - 1
Mexico City 1,290 7,110 50 420
São Paulo 4,560 23,970 150 1,110
83 Adapted from IBGE. For full a explanation please refer to annex 4, 5, 6 and 7.
84 Final figures have been rounded to 2 significant digits. For detailed figures please refer to
annex 3,4,5,6 and 7. 85
Idem.
51
7. Results and Discussion
The obtained results and their interpretation are dependent on certain set of
assumptions. While every precaution has been taken to use official government
sources for the data sets wherever possible, the results can only be read as
indications due to the limitations of the study.
Table 7 Comparison of estimated emissions via untreated wastewater and leachate86
Total TOC emitted by untreated
wastewater (tons/year)
Total N emitted by untreated
wastewater (tons/year)
Maximum TOC emitted by
leachate (tons/year)87
Maximum N emitted by
leachate (tons/year)88
Austria (2012) 2,690 660 4 1
Mexico City (2011) 31,450 7,690 7,110 420
Sao Paulo (2010) 51,600 12,610 23,970 1,110
For one, the available data restricts the direct comparison of results between the
cities chosen for the study. This is mainly due to the format in which some countries
publish their data. In larger countries, it is common to publish data by municipality
instead of cities. This makes sense in those countries, because the municipalities
are the legal authorities in charge (in all things water supply, sewage service and
waste management) for the agglomeration of cities that make up the actual
municipality.
Moreover, the data necessary for the impact assessments for the same timeframe
was not available at the time of writing, thus further limiting a direct comparison
between the regions in the same years. Due to the differences in dimension and
more importantly lack of available data in the case of Vienna, the calculations
compared the emissions of Austria (and not Vienna), Mexico City and São Paulo for
the pollution load in untreated wastewater.
Given that soil and groundwater pollution via leachate, happens over a period of
approximately 100 years, the obtained results of potential pollution load would have
86 Final figures have been rounded to 2 significant digits. For detailed figures please refer to
annex 3,4,5,6 and 7. 87
Values for Vienna 88
Idem.
52
to be sustained for the same period of time in order for the full contamination to take
effect on its environment. Nonetheless, assuming that current practices in
wastewater treatment and landfilling prevail for the next 100 years, the values
proposed in this study do give an estimate of potential emissions.
The results from the previous estimations demonstrate in numeric terms that in the
case of Austria, Mexico City and São Paulo untreated wastewater contains a larger
amount of TOC and nitrogen. Nevertheless its implications remain clear; the
untreated wastewater in all three cases contains a higher contaminant load and thus
represents a higher impact on both public health and the environment.
However, the investigation does not cover the final disposal of leachate and thus a
definite conclusion on its impact in all three cases remains elusive. Notwithstanding
its limitations the calculations are an indication of potential environmental pollution
and its negative effects on public health.
53
8. Summary and Conclusions
The historic reviews of Vienna, Mexico City and São Paulo presented changes in
the handling of sewage and waste management as a product of political, economic
and social factors. The gradual evolution of sewage, water treatment and waste
management was the result of constant and continuous improvements supported by
environmental and public health legislations as well as institutional and legislative
infrastructure. All cities have at some stage in their history experienced disease
epidemics as direct consequence of inadequate sewerage and treatment of
wastewater.
The resulting losses in human life have so far proven to be the main catalyst for
rapid improvements in sewage and later wastewater treatment by their respective
governments to remedy the situation. Environmental protection remains a low
political priority in many developing countries that must focus on economic growth.
Consequently open or uncontrolled dumping, as practiced in industrialized nations
up until the 1960s is still common practice in developing countries. Only upon tragic
events, such as major landslips89, immersing whole communities in waste, do local
governments react or intervene to improve the situation. A clear progression in
urban infrastructure from water supply network, to sewage service and eventual
wastewater treatment has also been observed in all three cities. Albeit sluggish,
trends over the last decade for sewage coverage of households and wastewater
treatment in Mexico City and São Paulo represent improvements in infrastructure
and living standards. It remains to be seen if governments will be able to maintain
the rate of improvement in face of a growing urban migration, which will undoubtedly
create more demand on these services. While water privatization has been touted
as a possible way to accelerate increase water and sanitation access in to the poor
areas in Brazil, studies remain inconclusive and at times even suggest that private
incentives result in reduced coverage of such areas (McNallen, 2005; Olivier, 2006).
89 On the 21
st of February 2005, the landslide disaster at the Leuwigajah disposal site in
Bandung, Indonesia following rain fall ended up costing 140 lives, bringing the issue of municipal solid waste management into the political debate and, can be considered a turning point in which public awareness was heightened in regards to waste management (Chaerul et al., 2007); On the 10
th of July 2000 after ten days of heavy rain fall a landslide was
triggered at the Payatas Landfill in Quezon City, Philippines burying over 300 people in the process (Merry et al., 2005).
54
The contrast between Vienna and cities in developing countries is decreasing,
however the key priority for cities worldwide still remains the same as in Europe and
North American up to the 1960s, in other words ‘getting the waste out from the foot’.
Due to the tropical climate of many emerging countries and the resulting increase in
waste degradation, the need for daily collection is much greater and not surprisingly
often costs 10 to 20% of a city’s budget (Wilson, 2007). Waste has a considerable
value particularly in the informal sector, as it represents a key driver to collect,
separate and resell recovered materials to make a living in many parts of the world
(Wilson et al., 2006). While this paper did not adequately cover the economic
importance of landfills for the informal economy in Mexico City and São Paulo, its
role as a deterrent for the reduction of solid waste deposited in landfills, must be
acknowledged.
The literature on possible health risks via different exposure pathways has shown
the risks associated with both, untreated wastewater and inadequate landfilling
practices prevalent in developing countries. The property of water to not only offer a
breeding ground for pathogenic organisms but also to toxic substances and
transport disease vectors in space, suggests that developing countries should focus
their efforts on suitable water management to transport and treat raw sewage in
order to protect human health.
The results of the quantitative analysis performed estimated the potential emission
loads for TOC and nitrogen in untreated wastewater and leachate in landfills as way
to compare their impact on the environment. Due to the constraints of this
methodology used in this investigation, such timeframe and location. As previously
mentioned, it would take around 100 years for leachate to fully contaminate its
surroundings. Moreover, it is assumed that unaccounted solid waste (i.e. that is not
landfilled) is deposited in open landfills. Therefore, the geographic location of such
dumping sites plays a critical role in determining its effects on the degree of pollution,
since a higher distribution of such sites over a larger area would result in a lower
contamination of the location. Geological variables such as the depth of
groundwater and composition of the soil in the location of landfill sites have not been
included in the study. Yet their importance in terms of filtering toxic substances and
disease vectors cannot be neglected. Due to these limitations, the results offered
cannot provide any clear evidence. Nonetheless, the estimative values obtained do
indicate the relative importance of treating wastewater to minimize environmental
damage and public health risks.
55
Bibliography
Andrew, D. (Ed.). (2005). Standard methods for the examination of water and
wastewater.
Akpor, B., & Muchie, M. (2011). Environmental and public health implications of
wastewater quality. African Journal of Biotechnology, 10(13)
Arceivala, S. J., & Asolekar, S. R. (2007). Wastewater treatment for pollution control
and reuse. Tata McGraw-Hill Education.
Associação Brasileira de Engenharia Sanitaria e Ambiental (ABES), (2006),
Resíduos Sólidos Urbanos: Coleta e Destino Final [Urban Solid Waste: Collection
and Final Destination].
Beschorner, S. (1996). Die Entsorgung im Spiegel der Versorgung [The disposal in
the mirror of supply]. Dissertation, TU Wien.
Bhide, A. D., & Sundaresan, B. B. (1983). Solid waste management in developing
countries. New Dehli.
Brunner, K., & Schneider, P. (Eds.). (2005). Umwelt Stadt: Geschichte des Natur-
und Lebensraumes Wien [Environment City: The History of Nature and habitat
Vienna]. (Vol. 1). Böhlau Verlag Wien.
Buff, S.R. (2009), Saneamento basico: Como tudo começou... [Sanitation: How it all
began ...]. Elo Ambiental
Caistor, N. (2000). Mexico City: a cultural and literary companion (Vol. 3). Signal
Books, Oxford.
Candiani, G., & Silva, M. D. M. (2011). Análise do biogás no aterro sanitário
Caieiras [Analysis of biogas in Sanitary Landfill Caieiras]. Semina: Ciências Exatas
e Tecnológicas (Londrina), 32(1), 69-77.
Carrera-Hernández, J. J., & Fischer, G. (2006). Mexico City’s Water Management:
In search of sustainability (p. 18). Interim Report IR-06-022. International Institute for
Applied Systems Analysis, Laxenburg, Austria.
Castillo Berthier, H., (2005). Basura: un problema metropolitano. [Garbage: a
problem metropolitan]. Revista Veredas,10 Primer Semestre, 156-171.
56
Castillo, H., Ziccardi, A., & Navarro, B. (1995). Ciudad de México: retos y
propuestas para la coordinación metropolitana [Mexico City: Challenges and
proposals for the Metropolitan Coordination], Universidad Autónoma Metropolitana,
México.
Chaerul, M., Tanaka, M., & Shekdar, A. V. (2007). Municipal solid waste
management in Indonesia: Status and the strategic actions. Journal of the faculty of
environmental science and technology, Okayama University, 12(1), 41-49.
Observatório Cidadão (2013) Município de São Paulo. Tratamento de esgoto. [São
Paulo. Sewage treatment]. Retrieved on October 8, 2013, from
Diario Sao Paulo retrieved from: http://diariosp.com.br/noticia/detalhe/21558/Cidade+absorve+apenas+a+metade+do+seu+lixo 100
Assumed value 101
Idem.
67
Annex 4. Daily amount of solid waste deposited by final destination for cities
with more than 1,000,000 inhabitants (adapted from IBGE, 2008)
Total
Solid waste deposited in class 1 landfill
(tons/year)
Solid waste deposited in class 2 landfill
(tons/year)
Solid waste deposited in class 2 landfill
(tons/year)
Original data for São Paulo (2008)102
49,472 40,515 7,901 12
Inferred proportions (%)103
100% 81.89% 15.97% 0.02%
São Paulo (2012) 6,570,000 4,745,000104
1,822,232 2,768
Mexico City (2012) 3,162,469 2,645,730 515,955 784
102 IBGE. (2008). Pesquisa Nacional de Saneamento Basico 2008 [National Research on Basic Sanitation 2008], Tabela 93. p 163. Retrieved from: http://www.ibge.gov.br/home/estatistica/populacao/condicaodevida/pnsb2008/PNSB_2008.pdf
103 Proportions of solid waste in deposited in class 2 and class 3 landfills were obtained via
the following calculations: Solid waste deposited in class 1 landfill/ Total solid waste x 100 = Inferred proportion for class 1 landfill. 104
Daily values for both CTL and CTVA landfills have been scaled up to a year and added up: CTL landfill receives 6,000 tons daily --> 6,000 x 365 =2,190,000 tons/year retrieved from: http://diariosp.com.br/noticia/detalhe/21558/Cidade+absorve+apenas+a+metade+do+seu+lixo And Aterro Caieiras landfill receives 7,000 tons daily -->7,000 x 365 =2,555,000 tons/year (http://www.scielo.br/pdf/esa/v18n2/a01v18n2.pdf) p96 2,190,000 tons/year + 2,555,000 tons/year =4,745,000 tons/year in class 1 landfill
68
Annex .5 Calculations for TOC and nitrogen contents in leachate post
treatment in Class 1 landfills
Landfill class 1 Vienna (2012)
Mexico City (2012)
São Paulo (2012)
Solid waste deposited in class 1 landfills (tons/year) 125,758 2,645,730 4,745,000
Amount TOC in leachate 1% 1% 1%
Amount of N in leachate 20% 20% 20%
Remaining TOC in treated leachate (min) 0% 0% 0%
Remaining TOC in treated leachate (max) 10% 10% 10%
Remaining N in treated leachate (min) 0% 0% 0%
Remaining N in treated leachate (max) 10% 10% 10%
TOC in landfill waste (tons/year) 31,440 661,432 1,186,250
N in landfill waste (tons/year) 503 10,583 18,980
TOC in leachate emissions (tons/year) 314 6,614 11,863
N in leachate emissions (tons/year) 101 2,117 3,796
Remaining minimum of TOC in leachate post treatment (tons/year)
- - -
Remaining maximum of TOC in leachate post treatment (tons/year)
4 661 1,186
Remaining minimum of N in leachate post treatment (tons/year)
- - -
Remaining maximum of N in leachate post treatment (tons/year)
1 212 380
69
Annex 6. Calculations for TOC and nitrogen contents in leachate post
treatment in Class 2 landfills
Landfill class 2 Mexico City
(2012) São Paulo
(2012)
Solid waste deposited in class 2 landfills (tons/year) 515,955 1,822,232
Amount TOC in leachate 1% 1%
Amount of N in leachate 20% 20%
Remaining TOC in treated leachate (min) 10% 10%
Remaining TOC in treated leachate (max) 50% 50%
Remaining N in treated leachate (min) 10% 10%
Remaining N in treated leachate (max) 50% 50%
TOC in landfill waste (tons/year) 128,989 455,558
N in landfill waste (tons/year) 2,064 7,289
TOC in leachate emissions (tons/year) 12,899 45,556
N in leachate emissions (tons/year) 413 1,458
Remaining minimum of TOC in leachate post treatment (tons/year) 1,290 4,556
Remaining maximum of TOC in leachate post treatment (tons/year) 6,449 22,778
Remaining minimum of N in leachate post treatment (tons/year) 41 146
Remaining maximum of N in leachate post treatment (tons/year) 206 729
70
Annex 7. Calculations for TOC and nitrogen contents in leachate post
treatment in Class 2 landfills
Landfill class 3 Mexico City
(2012) São Paulo
(2012)
Solid waste deposited in class 3 landfills (tons/year) 784 2,768
Amount TOC in leachate 1% 1%
Amount of N in leachate 20% 20%
Remaining TOC in treated leachate (min) 50% 50%
Remaining TOC in treated leachate (max) 100% 100%
Remaining N in treated leachate (min) 50% 50%
Remaining N in treated leachate (max) 100% 100%
TOC in landfill waste (tons/year) 196 692
N in landfill waste (tons/year) 3 11
TOC in leachate emissions (tons/year) 2 7
N in leachate emissions (tons/year) 1 2
Remaining minimum of TOC in leachate post treatment (tons/year) 0.98 3.46
Remaining maximum of TOC in leachate post treatment (tons/year) 1.96 6.92
Remaining minimum of N in leachate post treatment (tons/year) 0.31 1.11
Remaining maximum of N in leachate post treatment (tons/year) 0.63 2.21