45
The exposome and exposomics in inhalation toxicology Gary W. Miller, Ph.D. Department of Environmental Health Rollins School of Public Health Emory University Atlanta, GA

The exposome and exposomics in inhalation toxicology
Gary W. Miller, Ph.D.
Department of Environmental Health
Rollins School of Public Health
Emory University
Atlanta, GA
Outline
• The exposome concept
• Current approaches
• Applications to inhalation toxicology

G x E = P
• Genes x environment = phenotype
• John Locke’s (1690) view that we are born
tabula rasa- a blank slate
• Without input from our environment we are
feeble. Humanity requires the environment.

1966
Lunar
Landing
86
HGP
completed GWM
founded
2016 2066 96 76 26 06 36 46 56
H. Influ
genome
sequenced
10,000
human
genomes
sequenced
HGP
started EPA
founded
> 1 million

Nature vs. Nurture
• Truly a false dichotomy (see “Nature vs. Nurture: Death of a Dogma” in Neuron, 2010 by Traynor and Singleton)
• Whether you call it nature vs. nurture or genes vs. environment, life occurs at the interface.
• For the sake of human health, we need a richer understanding of nurture
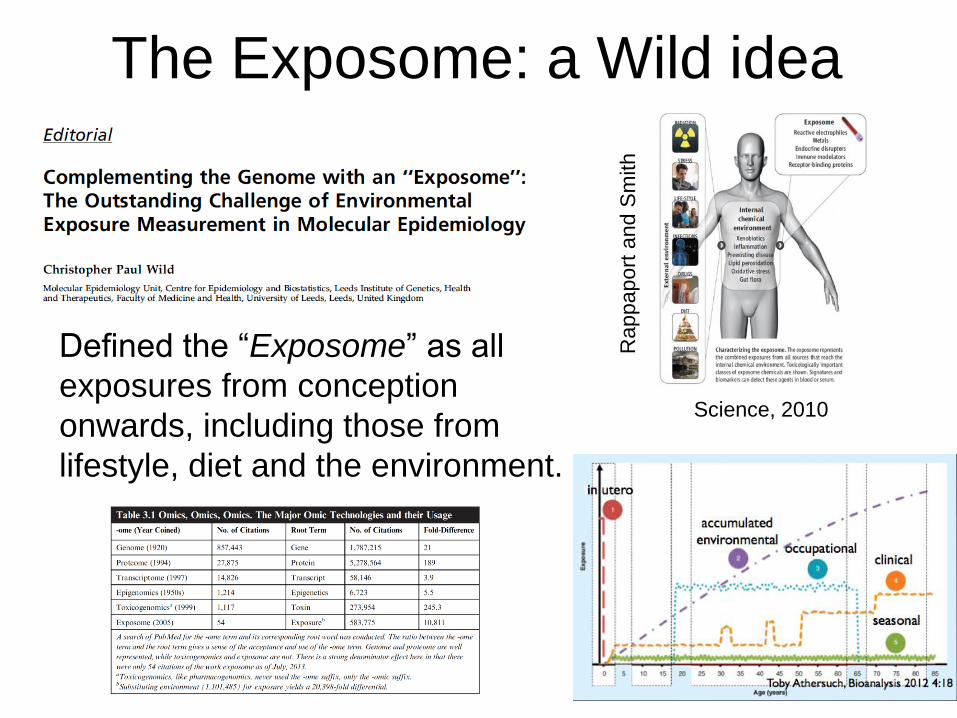
The Exposome: a Wild idea
Defined the “Exposome” as all
exposures from conception
onwards, including those from
lifestyle, diet and the environment.
Ra
pp
ap
ort
an
d S
mith
Science, 2010
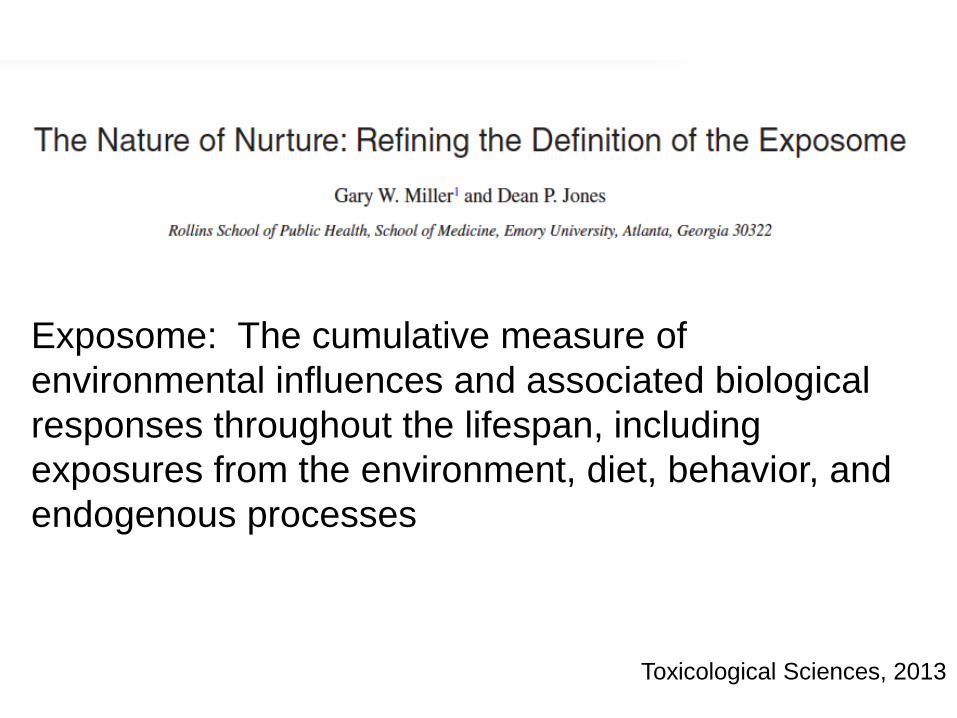
Exposome: The cumulative measure of
environmental influences and associated biological
responses throughout the lifespan, including
exposures from the environment, diet, behavior, and
endogenous processes
Toxicological Sciences, 2014 Toxicological Sciences, 2013

The exposome as a foil to the genome
Oxford English Dictionary: Foil (noun):
A person or thing that contrasts with
and so emphasizes and enhances the
qualities of another.
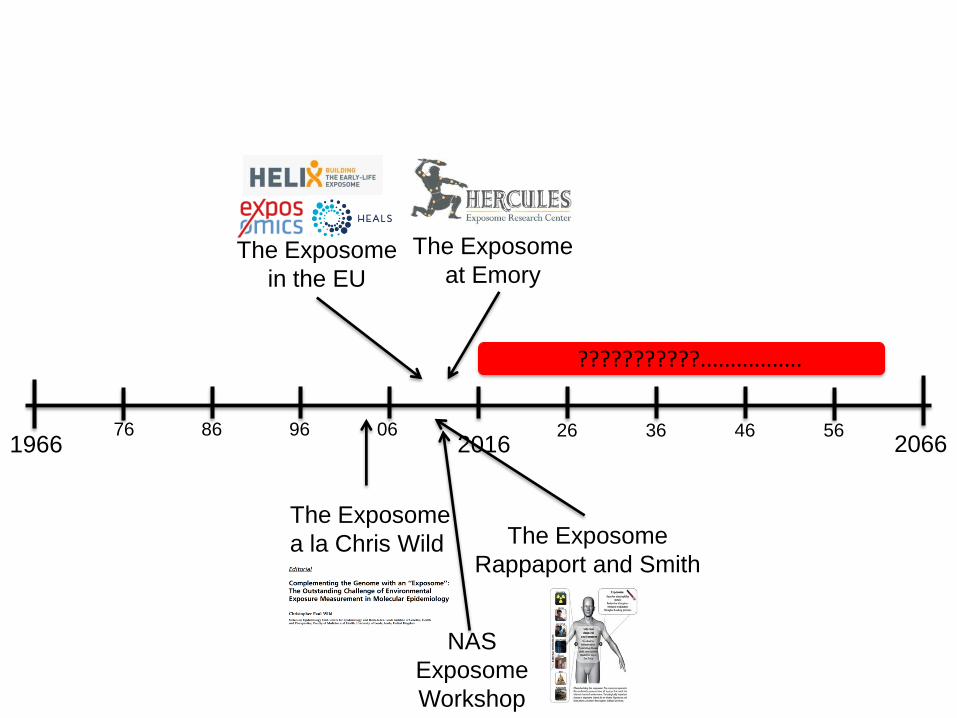
1966 2016 2066 26 36 46 56
The Exposome
a la Chris Wild
The Exposome
in the EU
The Exposome
at Emory
The Exposome
Rappaport and Smith
???????????.................
86 96 76 06
NAS
Exposome
Workshop
1966 2016 2066
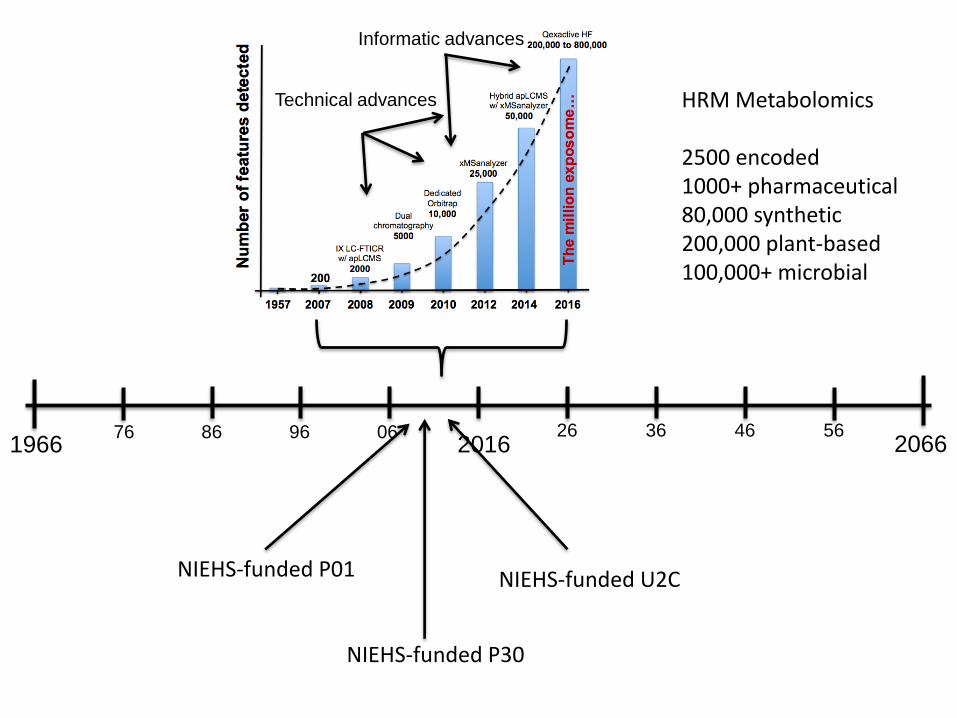
NIEHS-funded P01
NIEHS-funded P30
NIEHS-funded U2C
HRM Metabolomics 2500 encoded 1000+ pharmaceutical 80,000 synthetic 200,000 plant-based 100,000+ microbial
Technical advances
Informatic advances
86 96 76 06 26 36 46 56
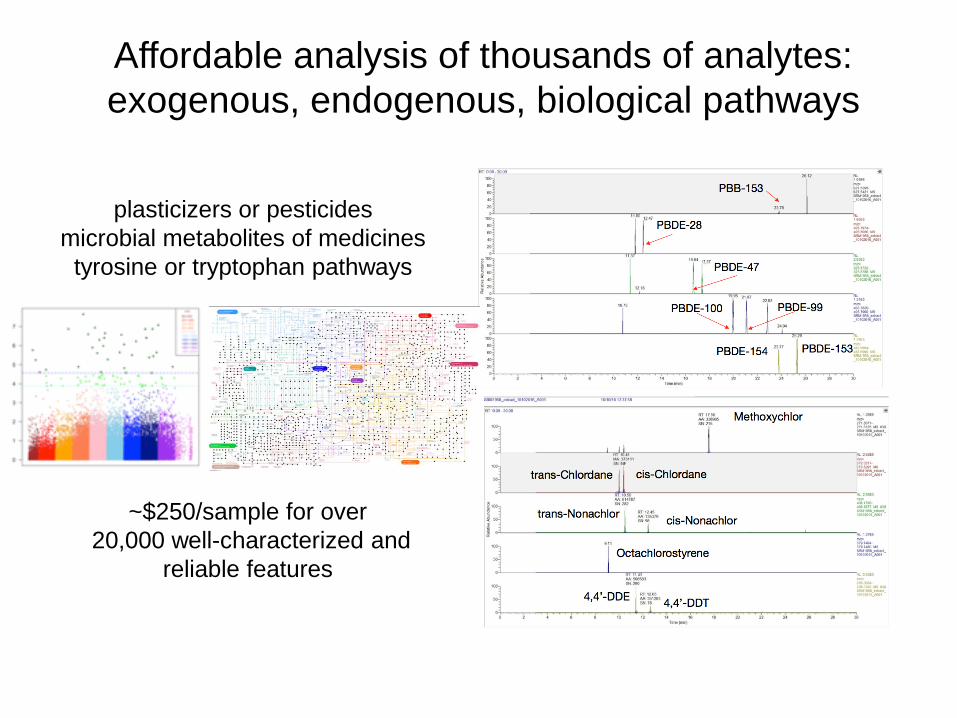
Affordable analysis of thousands of analytes:
exogenous, endogenous, biological pathways
~$250/sample for over
20,000 well-characterized and
reliable features
plasticizers or pesticides
microbial metabolites of medicines
tyrosine or tryptophan pathways

1966 2016 2066
Japan, other U.S. and
European institutions
Big data
bioinformatics
86 96 76 06 26 36 46 56
The Exposome
a la Chris Wild
The Exposome
in the EU
The Exposome
at Emory
The Exposome
Rappaport and Smith
NAS
Exposome
Workshop

1966 2016 2066
TS Kuhn’s
Structure
published
Are we entering the early phase of a paradigm shift?
26 36 46 56 86 96 76 06
Japan, other U.S. and
European institutions
Big data
bioinformatics
The Exposome
a la Chris Wild
The Exposome
in the EU
The Exposome
at Emory
The Exposome
Rappaport and Smith
NAS
Exposome
Workshop

Postscript to 2nd edition-1969
Kuhn on the term “paradigm”
“…it stands for the entire constellation of beliefs,
values, techniques, and so on shared by the
members of a community.”
“…it denotes one sort of element in that
constellation, the concrete puzzle-solutions
which, employed as models or examples, can
replace explicit rules as a basis for the solution
of the remaining puzzles in normal science.”
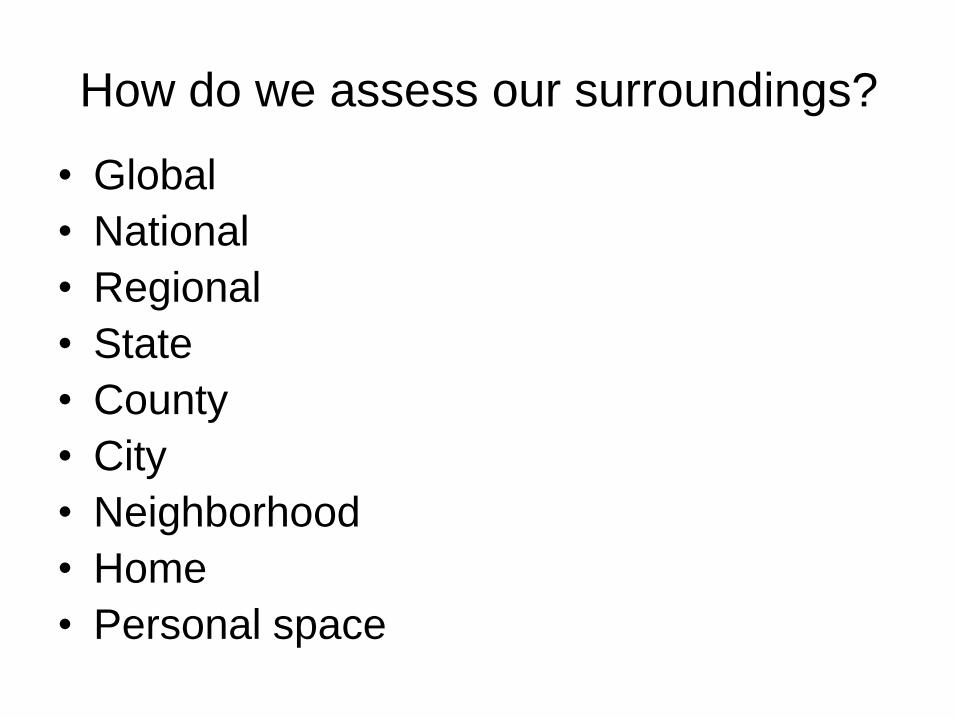
How do we assess our surroundings?
• Global
• National
• Regional
• State
• County
• City
• Neighborhood
• Home
• Personal space
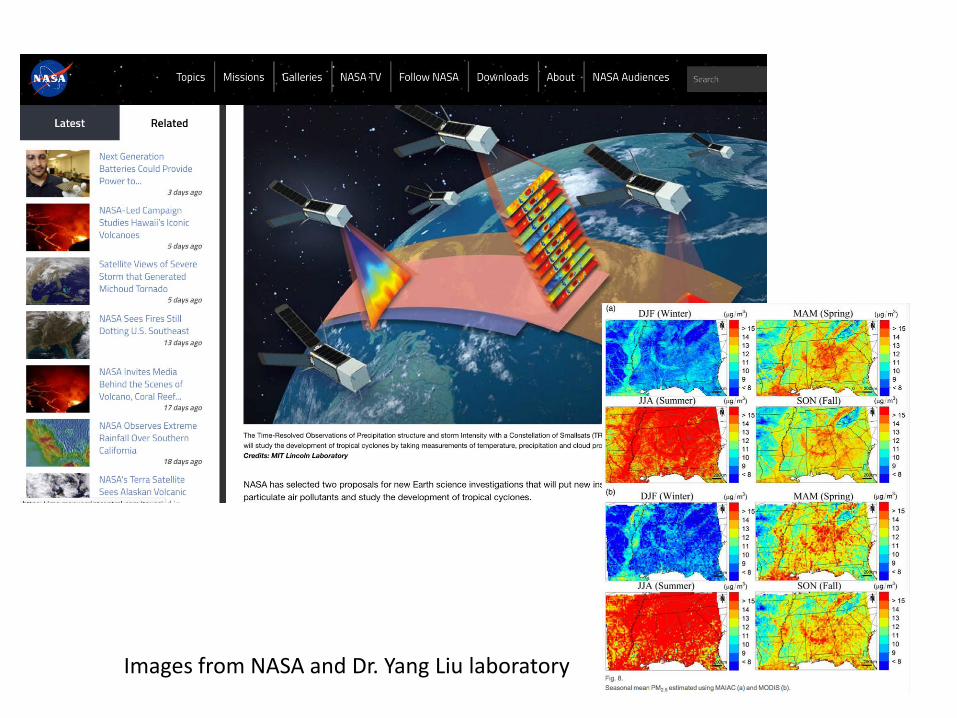
Images from NASA and Dr. Yang Liu laboratory

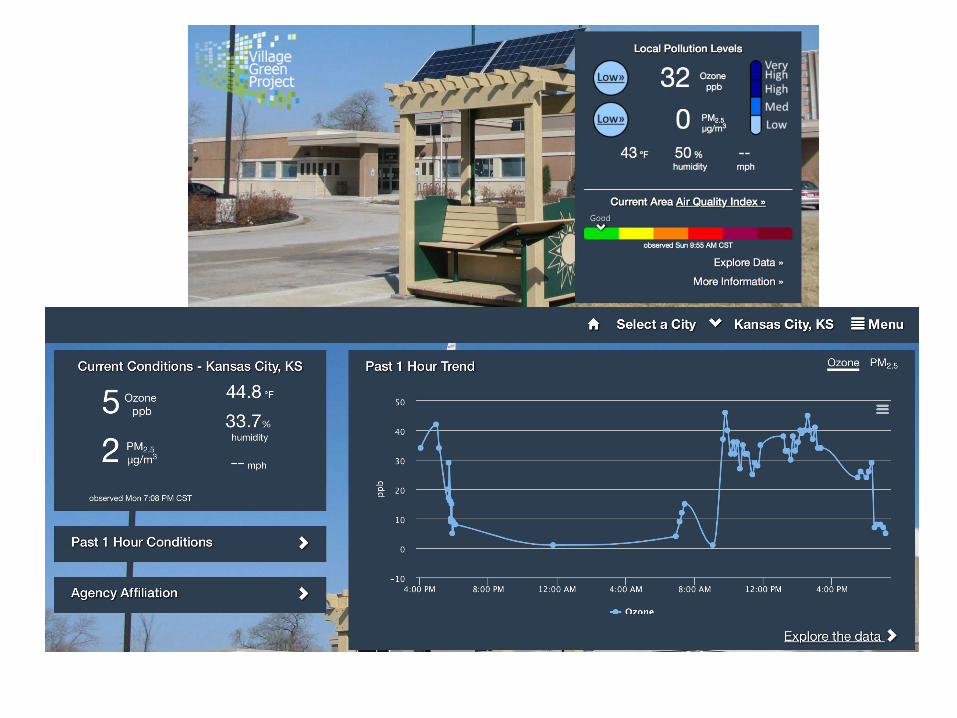

Similar transformative technologies, such as remote
sensing and wearables, are expanding our definition of
exposure science.
http://nas-sites.org/emergingscience/meetings/personal-exposure-measurement/workshop-agenda/

There is intense competition for data scientists.
Toxicology/Environmental Health must invest in
data science infrastructure and aggressively
recruit, train, and retain those individuals who will
be solving our problems in the next 50 years.
Exposome-outside in
• The exposome includes our complex surroundings. The source, timing, duration, and physiochemical properties of these exposures are critical.
• At Emory, we have been focusing most of our efforts on the components of the exposome that can be measured inside the body.
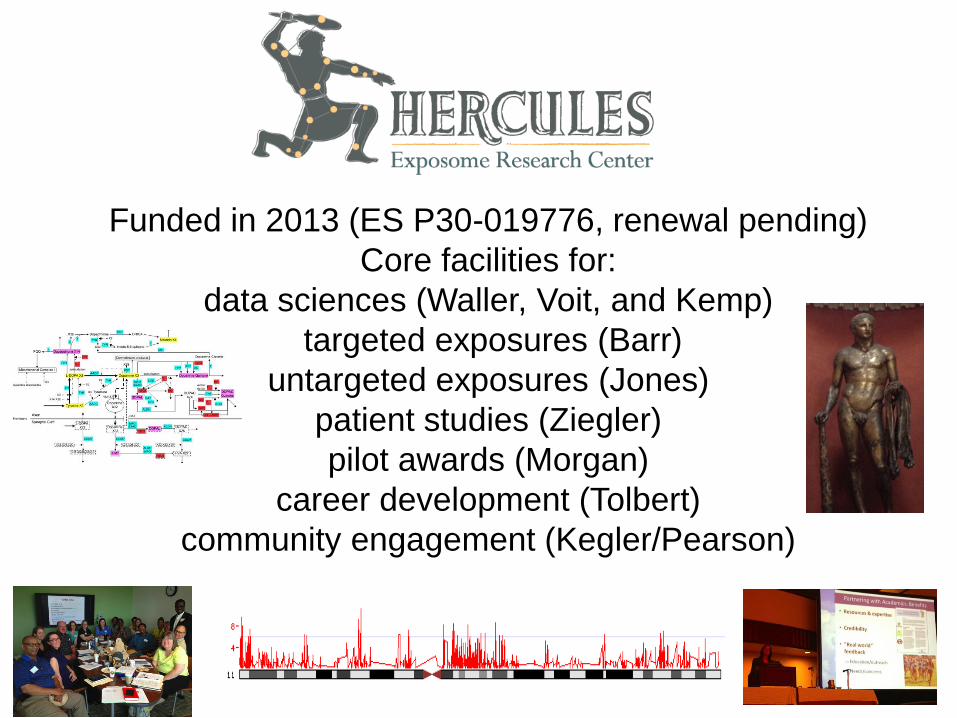
Funded in 2013 (ES P30-019776, renewal pending)
Core facilities for:
data sciences (Waller, Voit, and Kemp)
targeted exposures (Barr)
untargeted exposures (Jones)
patient studies (Ziegler)
pilot awards (Morgan)
career development (Tolbert)
community engagement (Kegler/Pearson)

Data Table
m/z, RT, Intensity
Quality metrics
Biostatistics Bioinformatics
Metabolites of interest
Confirmation of identity
Pathway and network analysis: Mummichog,
MetabNet, others
Targeted MS/MS
LTQ-Velos Orbitrap HF Q-Exactive
Thermo Fusion
MWAS
PLS-DA
Data extraction
ESI LC-MS
High-resolution
metabolomics workflow
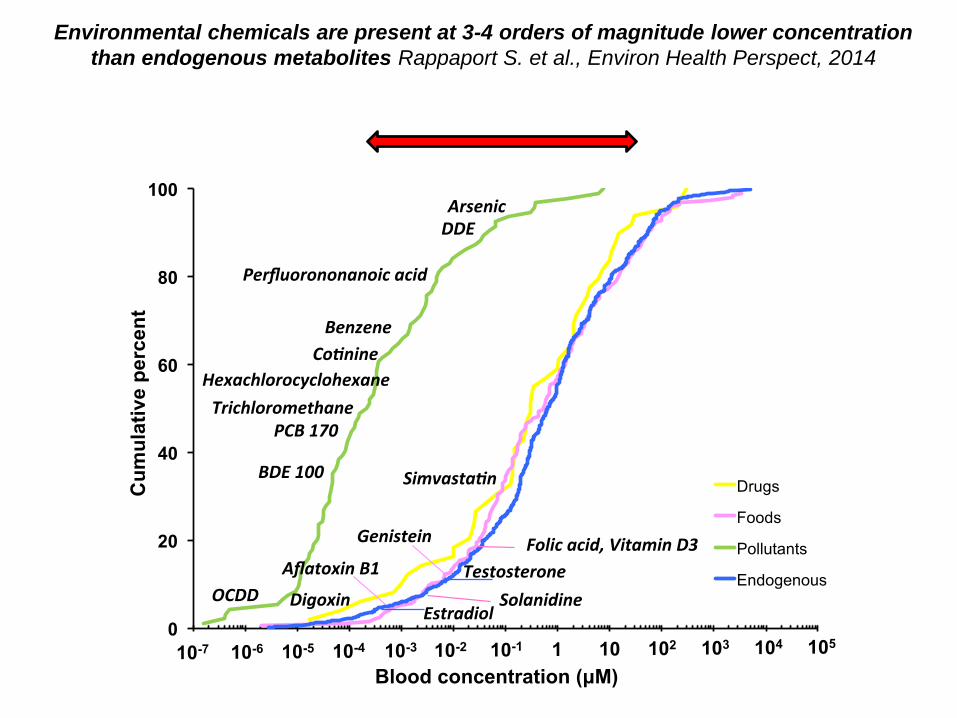
Environmental chemicals are present at 3-4 orders of magnitude lower concentration
than endogenous metabolites Rappaport S. et al., Environ Health Perspect, 2014
0
20
40
60
<2 4-
6
8-10
12-1
4
16-1
8
>28
0
20
40
60
80
<2
2-4
4-6
6-8
8-10
10-1
2
12-1
4
0
20
40
60
<0.05
0.1-
0.15
0.2-
0.25
0.3-
0.35
>0.4
0
20
40
60
<1 2-
3 4-
5 6-
7 8-
9 0
10
20
30
40
50
60
<1.5
3-4.
5
6-7.
5
9-11
.5
13-1
4.5
>16
0
20
40
60
80
<5
10-1
5
20-2
5
30-3
5
40-4
5
0
20
40
60
80
100
<2
2-4
4-6
6-8
8-10
10-1
2
12-1
4
14-1
6
0
20
40
60
<0.5
0.5-
1
1.0-
1.5
1.5-
2
2-2.
5
2.5-
3
3-3.
5
3.5-
4 0
20
40
60
80
<0.05
0.05
-0.1
0.1-
0.15
0.15
-0.2
0.2-
0.25
0.25
-0.3
0.3-
0.35
0.35
-0.4
>0.4
0
20
40
60
<25
25-5
0
50-7
5
75-1
00
100-
125
125-
150
150-
175
175-
200
0
10
20
30
40
50
<50
100-
150
200-
250
300-
350
400-
450
0
20
40
60
<10
10-2
0
20-3
0
30-4
0
40-5
0
50-6
0
60-7
0
70-8
0
Betaine (µM)
0
20
40
60
<5
5-10
10-1
5
15-2
0
20-2
5
25-3
0
Carnitine (µM) Choline (µM) Glucose (mM)
N8-Acetylspermidine (nM) Oxoproline (µM)
Urate (µM)
1-Methylhistidine (µM)
Bilirubin (µM) Hypoxanthine (µM) Uridine (µM)
Cortisol (nM) Creatinine (µM) 3-Indolepropionate (µM) Kynurenine (µM)
0
20
40
<20
25-3
0
35-4
0
45-5
0
55-6
0
Oleic acid (µM)
0
20
40
<8
10-1
1
12-1
3
14-1
5
16-1
7
>18
No
of sub
jects
No
of
su
bje
cts
No
of
sub
jects
No
of
su
bje
cts
No
of
su
bje
cts
No
of
su
bje
cts
No
of
su
bje
cts
No o
f su
bje
cts
N
o o
f su
bje
cts
N
o o
f sub
jects
No
of
su
bje
cts
N
o o
f su
bje
cts
No o
f su
bje
cts
N
o o
f subje
cts
No
of
su
bje
cts
N
o o
f subje
cts
0
20
40
<0.6
6-12
18-2
4
30-3
6
42-4
8
>80
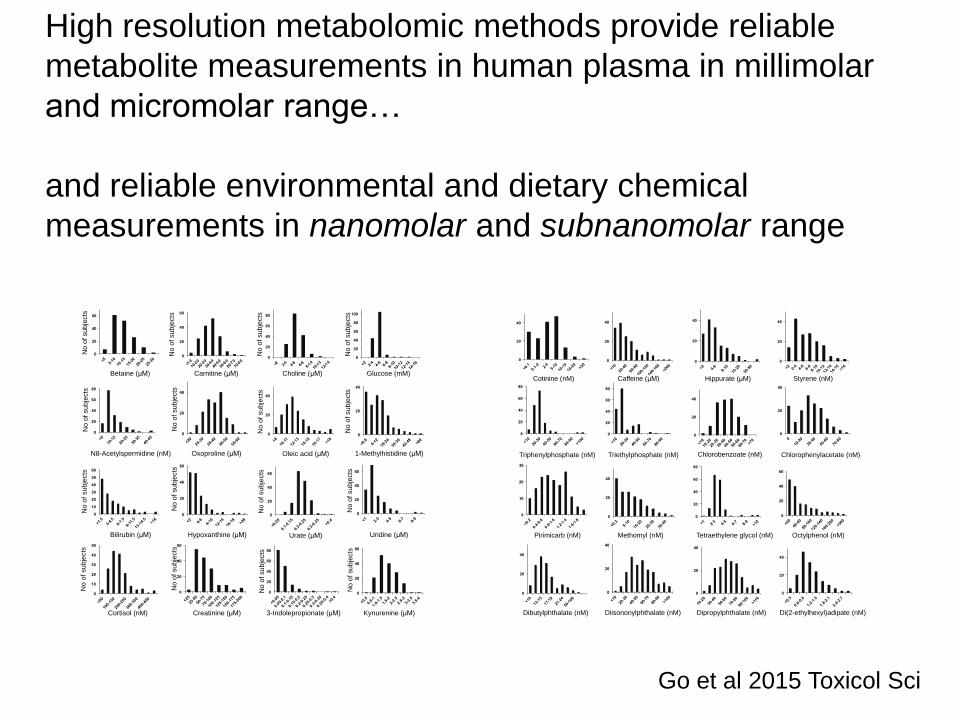
High resolution metabolomic methods provide reliable
metabolite measurements in human plasma in millimolar
and micromolar range…
and reliable environmental and dietary chemical
measurements in nanomolar and subnanomolar range
Go et al 2015 Toxicol Sci
Hippurate (µM)
0
20
40
<2
4-6
8-10
15-2
0
30-5
0
0
20
40
0
10-2
0
30-4
0
50-6
0
70-8
0
0
20
40
<2 2-
4 4-
6 6-
8
8-10
10-1
2
12-1
4
14-1
6
>16
0
20
40
60
80
<10
20-3
0
40-5
0
60-7
0
80-9
0
>100
0
20
40
<0.3
0.6-
0.9
1.2-
1.5
1.8-
2.1
2.4-
2.7
0
10
20
30
<0.2
0.4-
0.6
0.8-
1.0
1.2-
1.4
1.6-
1.8
0
20
40
<10
20-3
0
40-5
0
60-7
0
80-9
0
>100
0
20
40
<0.1
0.1-
2 2-
5
5-10
10-1
5
15-2
0
>20
Styrene (nM)
Triphenylphosphate (nM)
Cotinine (nM)
Triethylphosphate (nM) Chlorophenylacetate (nM)
Pirimicarb (nM)
Diisononylphthalate (nM) Dipropylphthalate (nM) Di(2-ethylhexyl)adipate (nM)
0
20
40
60
80
<10
20-3
0
40-5
0
60-7
0
80-9
0
0
20
40
<10
20-4
0
60-8
0
100-
120
140-
160
>200
Caffeine (µM)
0
20
40
<0.2
5-10
15-2
0
25-3
0
35-4
0
Methomyl (nM)
Dibutylphthalate (nM)
0
20
40
10-2
0
30-4
0
50-6
0
70-8
0
90-1
00
>110
0
20
40
60
<20
40-6
0
80-1
00
120-
140
160-
200
>300
Octylphenol (nM)
0
20
40
<10
10-2
0
20-3
0
30-4
0
40-5
0
50-6
0
60-7
0
>70
Chlorobenzoate (nM)
Tetraethylene glycol (nM)
0
20
40
60
80
<1
2-3
4-5
6-7
8-9
>10
0
20
40
<10
13-1
5
17-1
9
21-2
4
50-1
00
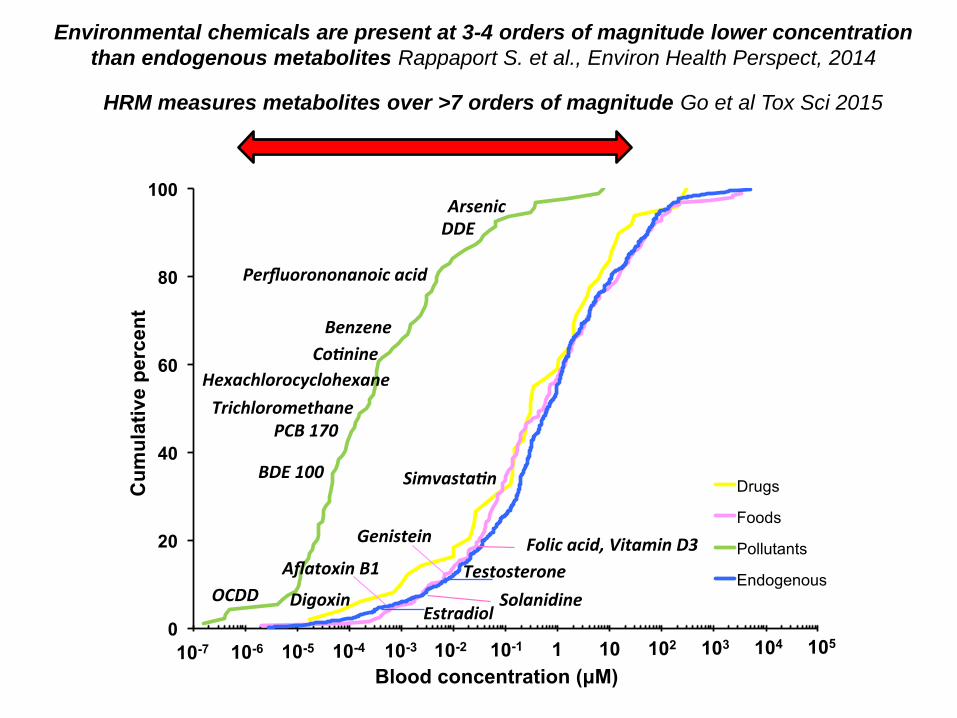
Environmental chemicals are present at 3-4 orders of magnitude lower concentration
than endogenous metabolites Rappaport S. et al., Environ Health Perspect, 2014
HRM measures metabolites over >7 orders of magnitude Go et al Tox Sci 2015

Analyte collection using
microneedle patch
?
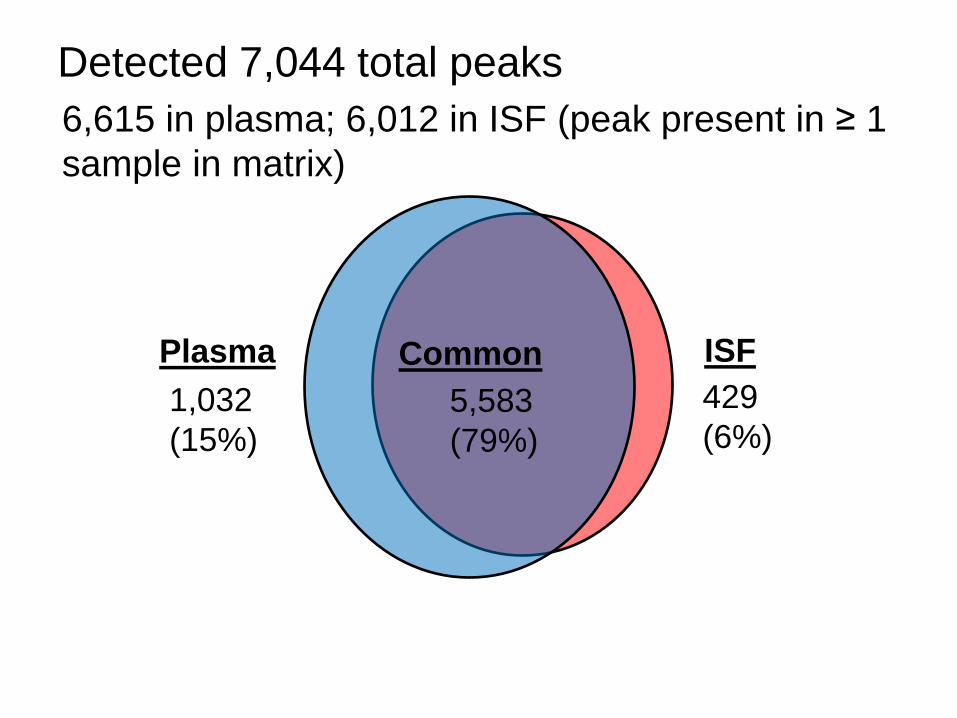
Detected 7,044 total peaks
6,615 in plasma; 6,012 in ISF (peak present in ≥ 1
sample in matrix)
Plasma
5,583
(79%)
ISF
429
(6%) 1,032
(15%)
Common
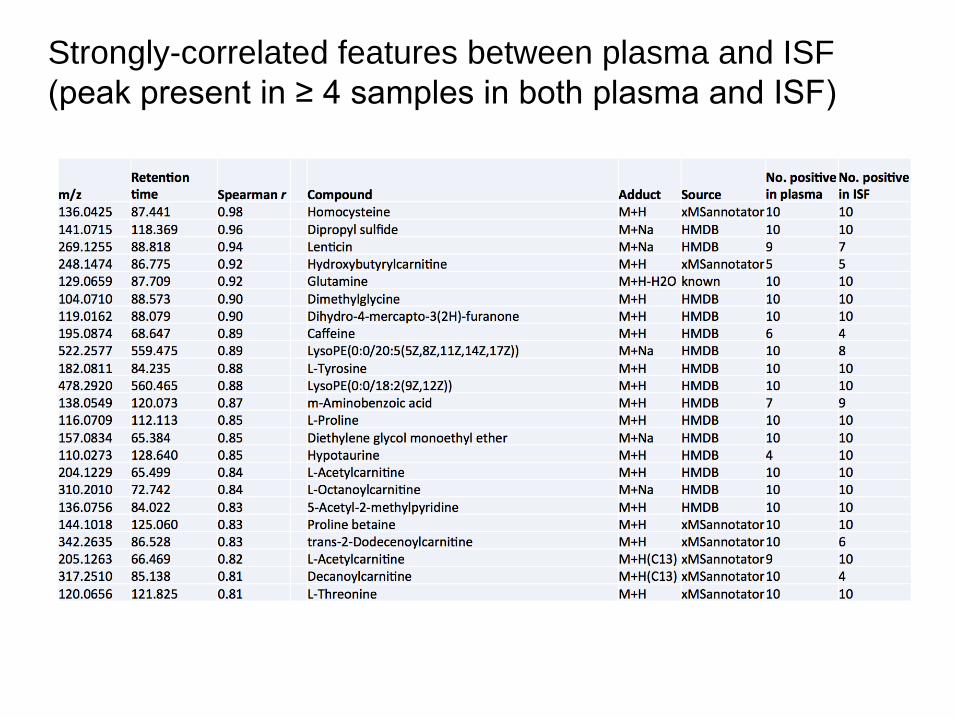
Strongly-correlated features between plasma and ISF
(peak present in ≥ 4 samples in both plasma and ISF)

Environmental Chemicals
Core Biological Metabolome
Non-nutritive Chemicals in Diet
Microbiome-related Chemicals
Supplements and Pharmaceuticals
Commercial Products
Environmental
metabolome
Endogenous
metabolome
Exposure assessment Metabolomics Molecular response
High resolution metabolomics provides a central reference platform to link
exposure data, internal burden and biological response to exposure
Courtesy of Dean Jones

SV2C Genotype Frequency Relative PD risk
in smokers
Homozygous, major
alleles 23% (0.4)
Heterozygous 75% (.8-1.9) or
Homozygous, minor
alleles 2% (3.3)
GWAS for protective effect
of nicotine in human PD and
fly PD model both identified
SV2C/ortholog
Stout et al., ACS Chem Neuro 2016
When it comes to the exposome we do not need to
measure everything. We need to provide a valid set of
parameters for “E” that can be used in conjunction
with existing studies that employ genomics,
epigenomics, proteomics, etc. to study diseases and
health outcomes.
A new avenue of research because a single
geneticist decided to include a couple of
“environmental” factors into the analysis
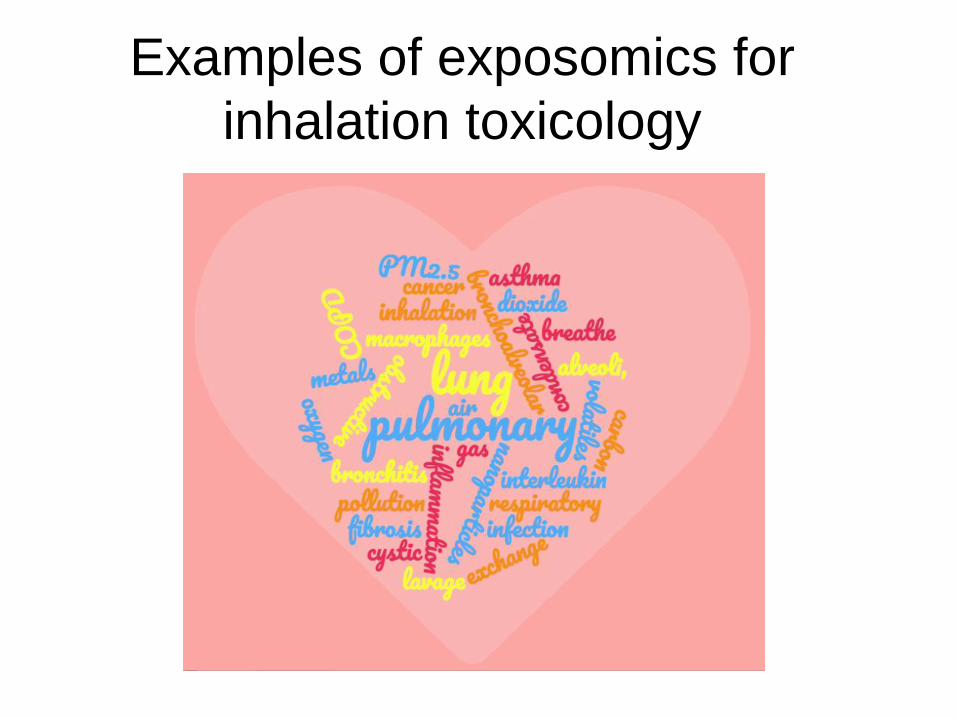
Examples of exposomics for
inhalation toxicology

Lung inflammation after H1NI infection
Chandler et al. AJPRICP, 2016

Go and Jones, 2016
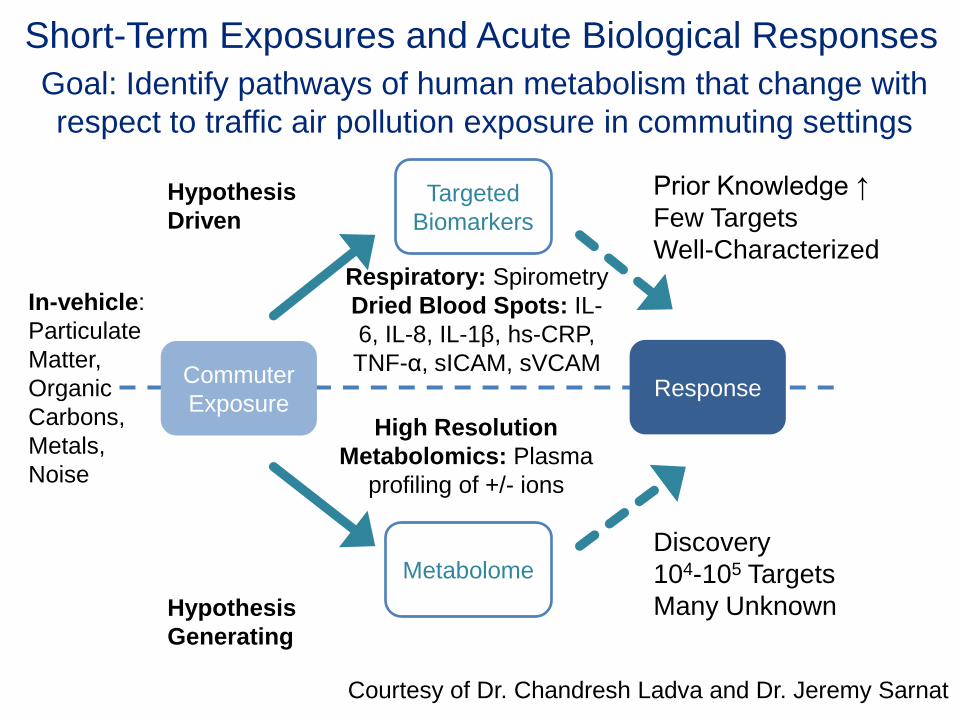
Commuter
Exposure Response
Targeted
Biomarkers
Metabolome
Hypothesis
Driven
Hypothesis
Generating
Prior Knowledge ↑
Few Targets
Well-Characterized
Discovery
104-105 Targets
Many Unknown
Short-Term Exposures and Acute Biological Responses
Goal: Identify pathways of human metabolism that change with
respect to traffic air pollution exposure in commuting settings
In-vehicle:
Particulate
Matter,
Organic
Carbons,
Metals,
Noise
Respiratory: Spirometry
Dried Blood Spots: IL-
6, IL-8, IL-1β, hs-CRP,
TNF-α, sICAM, sVCAM
High Resolution
Metabolomics: Plasma
profiling of +/- ions
Courtesy of Dr. Chandresh Ladva and Dr. Jeremy Sarnat

Commuter Exposure
Response
Targeted Biomarkers
Metabolome
1
2
Short-Term Exposures and Acute Biological Responses
In-vehicle: Particulate Matter, Organic Carbons, Metals, Noise
Respiratory: Spirometry Dried Blood Spots: IL-6,
IL-8, IL-1β, hs-CRP, TNF-α, sICAM, sVCAM
High Resolution Metabolomics: Plasma
profiling of +/- ions
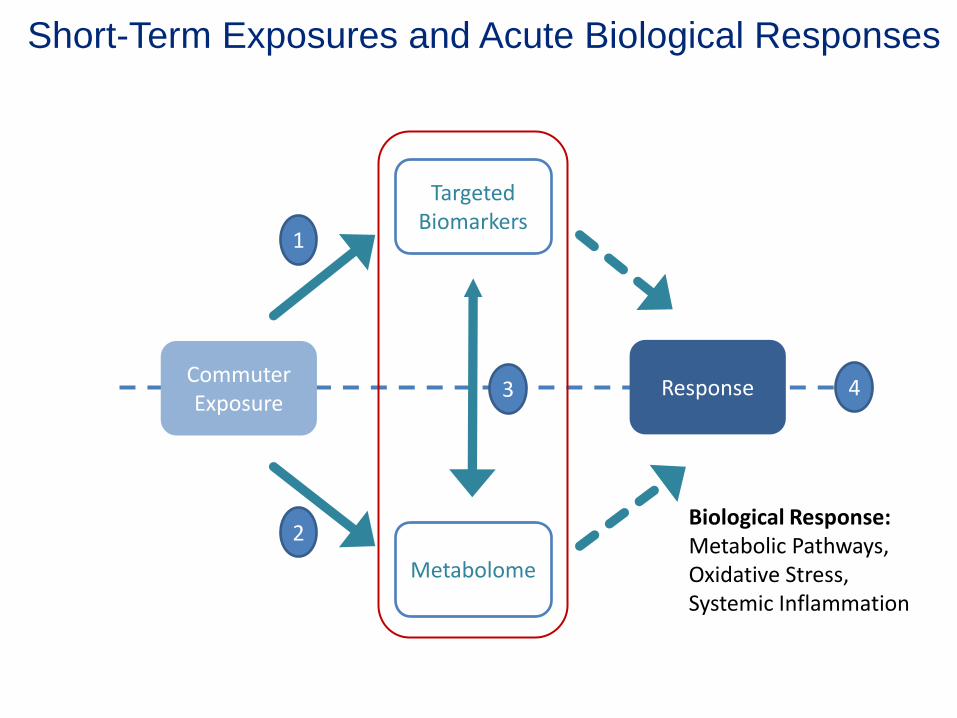
Commuter Exposure
Response
Targeted Biomarkers
Metabolome
1
2
3 4
Short-Term Exposures and Acute Biological Responses
Biological Response: Metabolic Pathways, Oxidative Stress, Systemic Inflammation

Particulate Metals Perturb
Metabolome • Null associations for many pollutant
models
• Particulate Pb, Al, Fe associated with metabolic changes
• Pb: 150 features differed • Components indicative of road dust
• First evidence of pollutant-mediated metabolic response in ACE panel
• Y-axis: Significance of pre-post metabolite intensities • (-log10(p))
• X-axis: Retention time of individual ions (N = 14,000)
• Thick Dashed line: Bonferroni (α < 0.05) • Colored Points: FDR < 0.05
• Direction of average pre-post changes in metabolite intensities indicated by red (decrease) and blue (increase)
-lo
g10
p
Aluminum (Al)
-lo
g10
p
Lead (Pb)
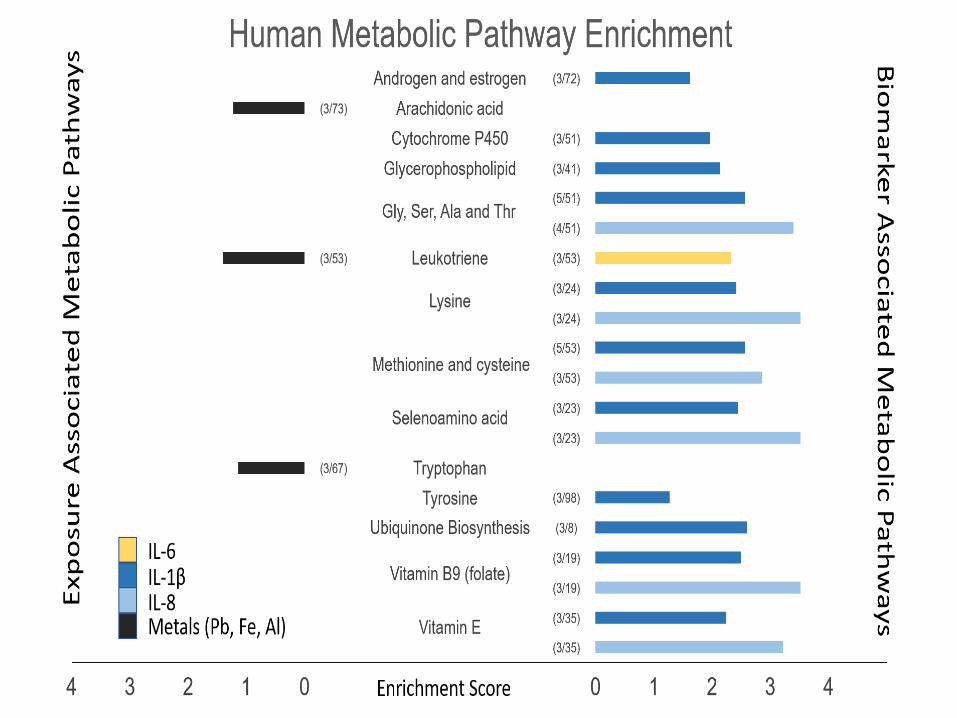

Go and Jones, 2016

1966 2016 2066
Are we entering the early phase of a paradigm shift? YES
exponential expansion of data
26 36 46 56 86 96 76 06
TS Kuhn’s
Structure
published
Japan, other U.S. and
European institutions
Big data
bioinformatics
The Exposome
a la Chris Wild
The Exposome
in the EU
The Exposome
at Emory
The Exposome
Rappaport and Smith
NAS
Exposome
Workshop
Submit your best inhalation toxicology to ToxSci!


