The Extent of Hatchery-Origin Fish Among Fall Chinook Salmon (Oncorhynchus tshawytscha) Observed in South Puget Sound Tributary Streams by Kevin M. Kennedy A Thesis Submitted in partial fulfillment of the requirements for the degree Master of Environmental Study The Evergreen State College June 2008
Transcript
The Extent of Hatchery-Origin Fish Among Fall Chinook Salmon
(Oncorhynchus tshawytscha) Observed in South
Puget Sound Tributary Streams
by
Kevin M. Kennedy
A Thesis Submitted in partial fulfillment
of the requirements for the degree Master of Environmental Study
This Thesis for the Master of Environmental Study Degree
by
Kevin M. Kennedy
has been approved for
The Evergreen State College
by
__________________________________________
Amy Cook, Ph.D. Member of the Faculty
__________________________________________
Paul Butler, Ph.D. Member of the Faculty
__________________________________________
Scott Steltzner, M.S. Salmon Biologist
Squaxin Island Indian Tribe
___________________________________________
Date
ABSTRACT
The Extent of Hatchery-Origin Fish Among Fall Chinook Salmon
(Oncorhynchus tshawytscha) Observed in South Puget Sound Tributary Streams
Kevin M. Kennedy
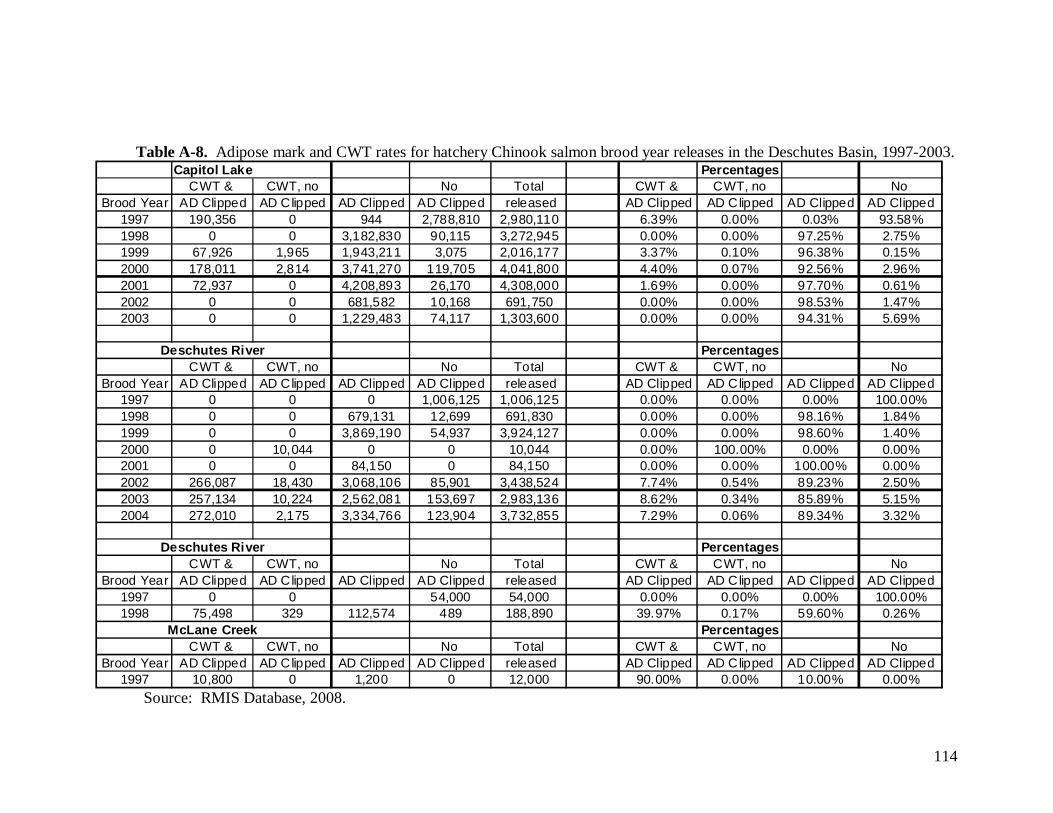
Chinook salmon (Oncorhynchus tshawytscha) have been observed in small numbers, for over 50 years, in many of the small tributary streams that feed into Puget Sound south of the Tacoma Narrows Bridge. Observations do not predate the release of hatchery-reared Chinook salmon throughout the region, so the origin of the Chinook salmon presently observed in these streams, as well as any potential role they could serve in recovery efforts of the Puget Sound Chinook salmon evolutionary significant unit (ESU), remain unknown. The extent of hatchery-origin fish among the Chinook salmon observed in South Puget Sound tributary streams was assessed using existing hatchery release and spawning ground survey records. Hatchery mark rates from the Regional Mark Information System (RMIS) Database were compared with mark recovery rates from the Washington Department of Fish and Wildlife Spawning Ground Survey Database to see if similar mark rates existed between the two groups. Although the hatchery mark rates exceeded mark recovery rates of fish observed during spawning ground surveys in most instances, mark recovery data revealed that the majority of carcasses observed, at three of the four streams with adequate sample sizes, had clipped adipose fins or coded wire tags, suggesting an extensive presence of hatchery-origin fish among the Chinook salmon observed at these streams. This might indicate that these fish are primarily present due to previous or current releases of hatchery Chinook salmon in South Puget Sound. If this assumption is correct, designating these streams as critical habitat would not prove beneficial in aiding the recovery of the Puget Sound Chinook salmon ESU and could pose unintended consequences for the co-managers, Washington Department of Fish and Wildlife and Western Washington Treaty Indian Tribes, responsible for managing the salmonids present in these streams.
iv
Table of Contents
List of Figures…………………………………………………………………........... vi List of Tables……………………………………………………………………….... vii List of Appendices…………………………………………………………………… viii List of Acronyms…………………………………………………………………….. x Acknowledgments…………………………………………………………………… xi Introduction………………………………………………………………………….. 1 Background………………………………………………………………………….. 5 Chinook Salmon Life History……………………………………………………… 5 Policy………………………………………………………………………………. 7 The Endangered Species Act and Evolutionary Significant Units………………... 7 The Puget Sound Technical Recovery Team and the 1992 Washington State Salmon and Steelhead Stock Inventory (SaSSI)……………………………….… 10 Critical Habitat Designation and its Application in South Puget Sound………… 16 Genetic Samples from Nisqually River and South Puget Sound Tributary Streams 19 Review of South Puget Sound Hatchery Releases of Chinook Salmon…………… 19 Nisqually River Hatchery Facilities……………………………………………… 24 McAllister Creek Hatchery……………………………………………………….. 24 Chambers Creek Basin Hatchery Facilities……………………………………… 25 Deschutes Basin Hatchery Facilities……………………………………………... 25 South Sound Net Pens…………………………………………………………….. 26 Elson Creek Hatchery…………………………………………………………….. 27 Minter Creek Hatchery………………………………………………………….... 27 Coulter Creek Hatchery…………………………………………………………... 28 Fox Island Net Pens………………………………………………………………. 29 Mass Marking of South Puget Sound Hatchery Fall Chinook Salmon…………… 29 Historical and Current Escapement Estimates for Nisqually River Chinook Salmon 30 Historical and Current Abundance Estimates for South Sound Tributaries Chinook Salmon…………………………………………………………………………….. 33 Comparison of the Physical Characteristics of South Puget Sound Streams with Known Chinook Salmon Systems………………………………………………… 35 Methods……………………………………………………………………………… 41 Comparing In-stream Abundance with In-stream Hatchery Releases……………... 46 Comparing Regionwide Abundance Estimates with Regionwide Hatchery Releases…………………………………………………………………………… 50 Comparing Mark Recovery Data with Hatchery Mark Rates……………………… 54 Results………………………………………………………………………………. 57
v
Comparing In-stream Abundance with In-stream Hatchery Releases……………. 57 Comparing Regionwide Abundance Estimates with Regionwide Hatchery Releases…………………………………………………………………………... 58 Comparing Mark Recovery Data with Hatchery Mark Rates…..…………………. 61 Discussion………………………………………………………………………….. 69 Comparing In-stream Abundance with In-stream Hatchery Releases……………. 69 Comparing Regionwide Abundance Estimates with Regionwide Hatchery Releases…………………………………………………………………………... 72 Comparing Mark Recovery Data with Hatchery Mark Rates…..…………………. 77 Implications…………………………………………………………………………. 87 Potential Role of South Puget Sound Tributaries Chinook Salmon in Recovery Efforts of Nisqually River Chinook and the Puget Sound Chinook Salmon ESU 87 Designation of South Puget Sound Tributaries as Critical Habitat for Nisqually River Chinook Salmon: Context, Benefits, and Consequences……………..…… 90 Conclusion………………………………………………………………………….. 93 Literature Cited……………………………………………………………………... 95 Appendices...........................................................................…………………… 102 (Use enclosed CD for hard copy; see List of Appendices for electronic copy)
vi
List of Figures
Figure 1: South Puget Sound study site map…………………………………….…... 4 Figure 2: Areas designated as critical habitat within the Nisqually Sub-basin for the Puget Sound Chinook Salmon ESU……………………………….. 18 Figure 3: Hatchery fall Chinook salmon releases in South Puget Sound, brood years 1952-2004……………………………………………………. 21 Figure 4: Nisqually River Chinook salmon escapement totals for adult hatchery and naturally spawning fish, 1986-2006…………………………………... 32 Figure 5: Coulter Creek relative presence estimates, 1960-1979…………….….…... 57 Figure 6: Coulter Creek relative presence estimates and hatchery escapement counts, 1960-2006……………………………………………………......... 58 Figure 7: South Puget Sound AUC and peak abundance estimates, 1987-2006…….. 60 Figure 8: South Puget Sound Chinook salmon run reconstruction, 1987-2006……... 61 Figure 9: Hammersley Inlet streams revised mark recovery data, 2002-2006………. 64 Figure 10: Case Inlet streams revised mark recovery data, 2002-2006………………. 64 Figure 11: Carr Inlet streams revised mark recovery data, 2002-2006………………. 65
vii
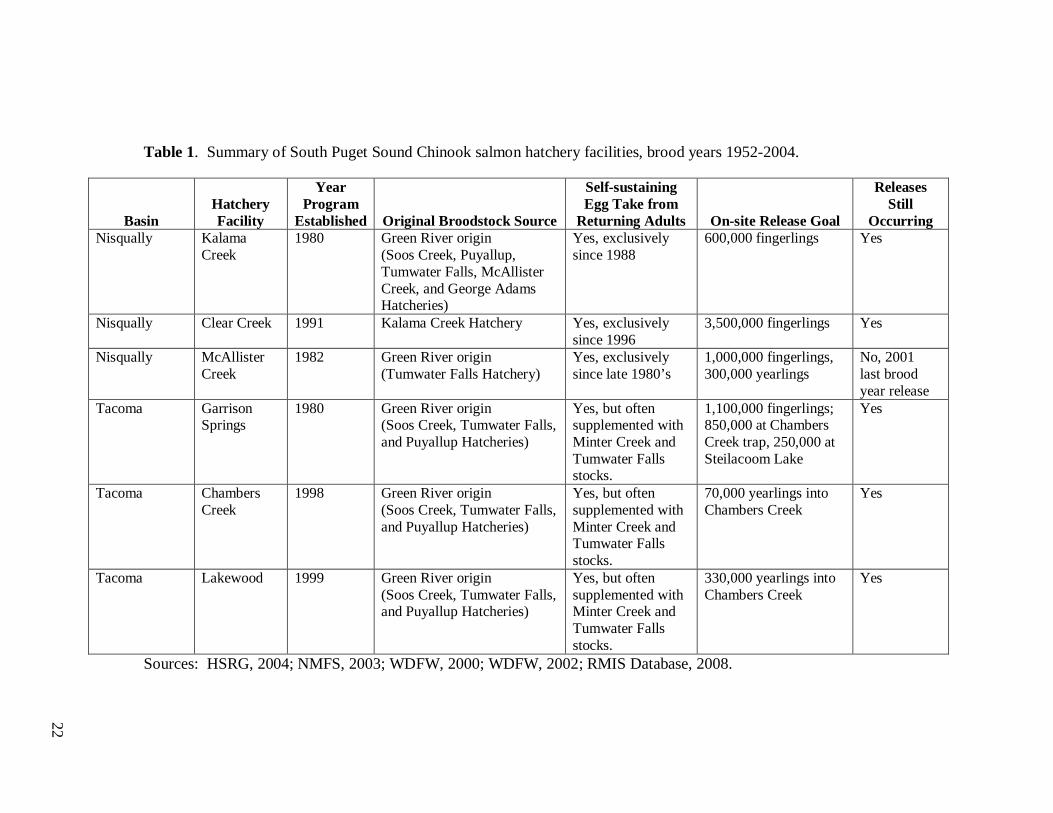
List of Tables
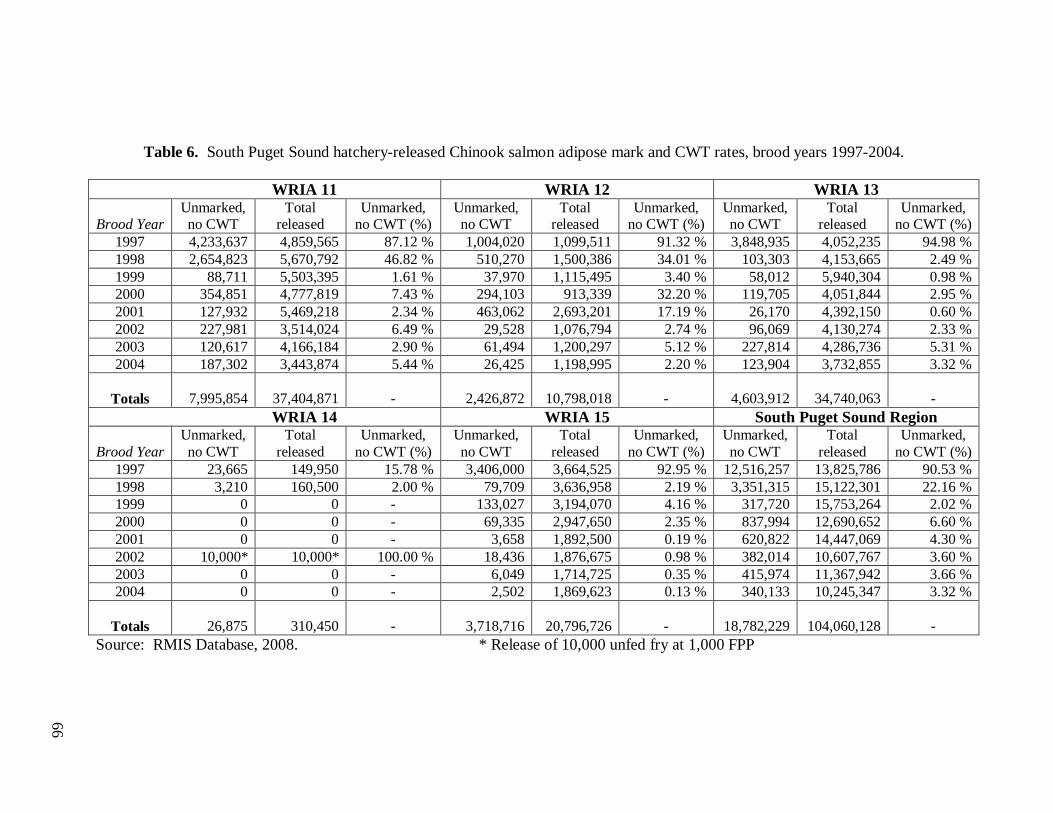
Table 1: Summary of South Puget Sound Chinook salmon hatchery facilities, 22 brood years 1952-2004…………………………………………………….. Table 2: 1991 escapement estimates of Chinook salmon for miscellaneous South Puget Sound tributary streams…………………………………......... 35 Table 3: Comparison of stream characteristics of miscellaneous South Puget Sound tributary streams with three Puget Sound fall Chinook systems…… 39 Table 4: Hatchery fall Chinook salmon releases at Coulter Creek, 1957-1962……… 48 Table 5: Explanation of mark recovery categories used in WDFW spawning ground surveys……………………………………………………............... 56 Table 6: South Puget Sound hatchery-released Chinook salmon adipose mark and CWT rates, brood years 1997-2004………………………………........ 66 Table 7: Weighted average mark rates for Chinook salmon hatchery brood year releases that contributed to return years 2002-2006 (South Puget Sound and WRIA 15)………………………………………... 68 Table 8: Coded wire tag recoveries at South Puget Sound streams, 1984-2006...…… 81
viii
List of Appendices
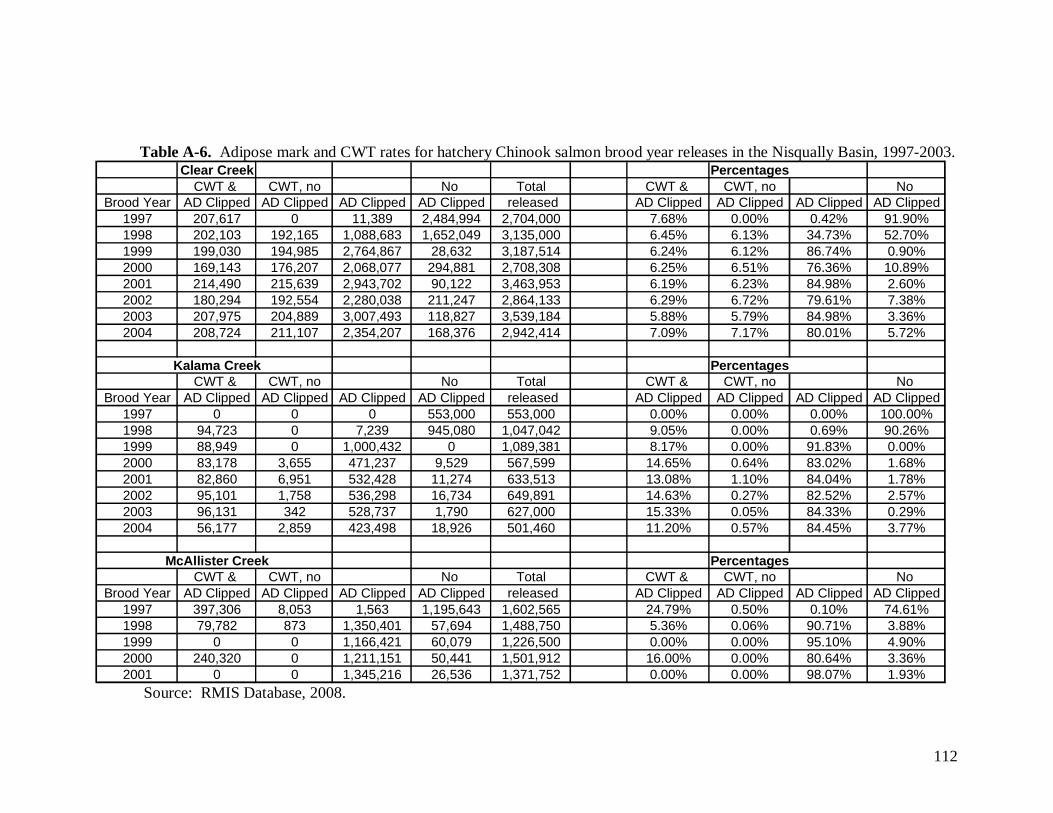
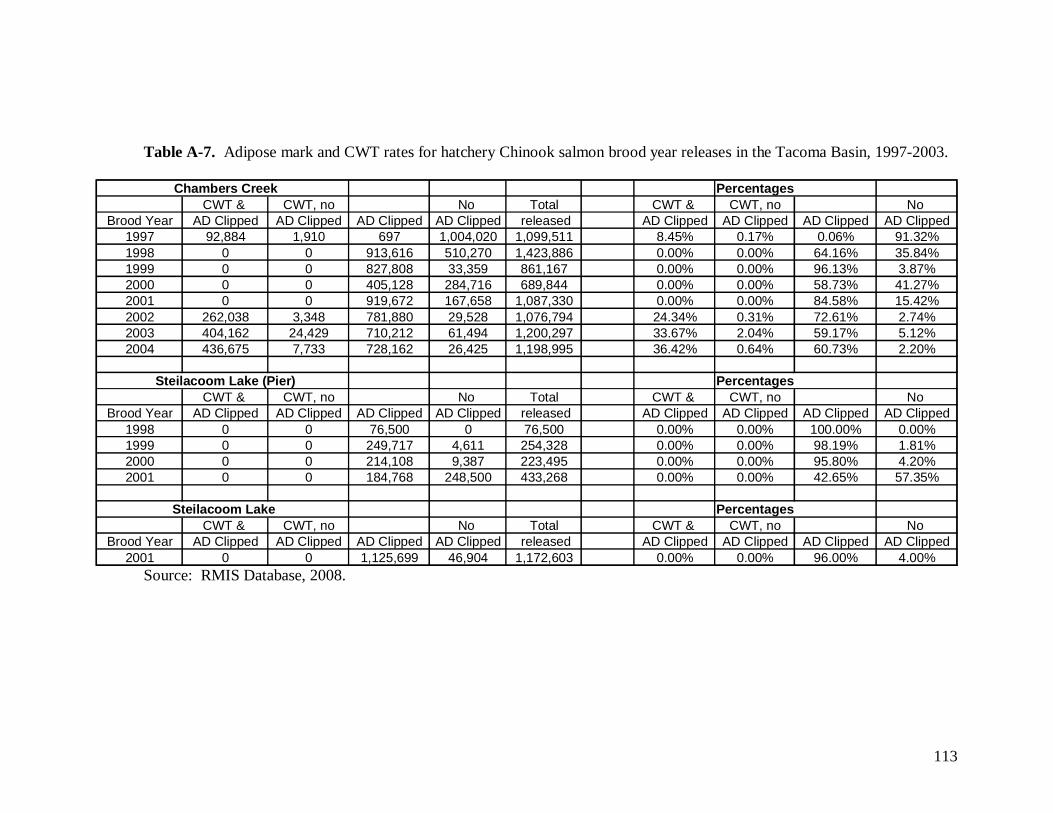
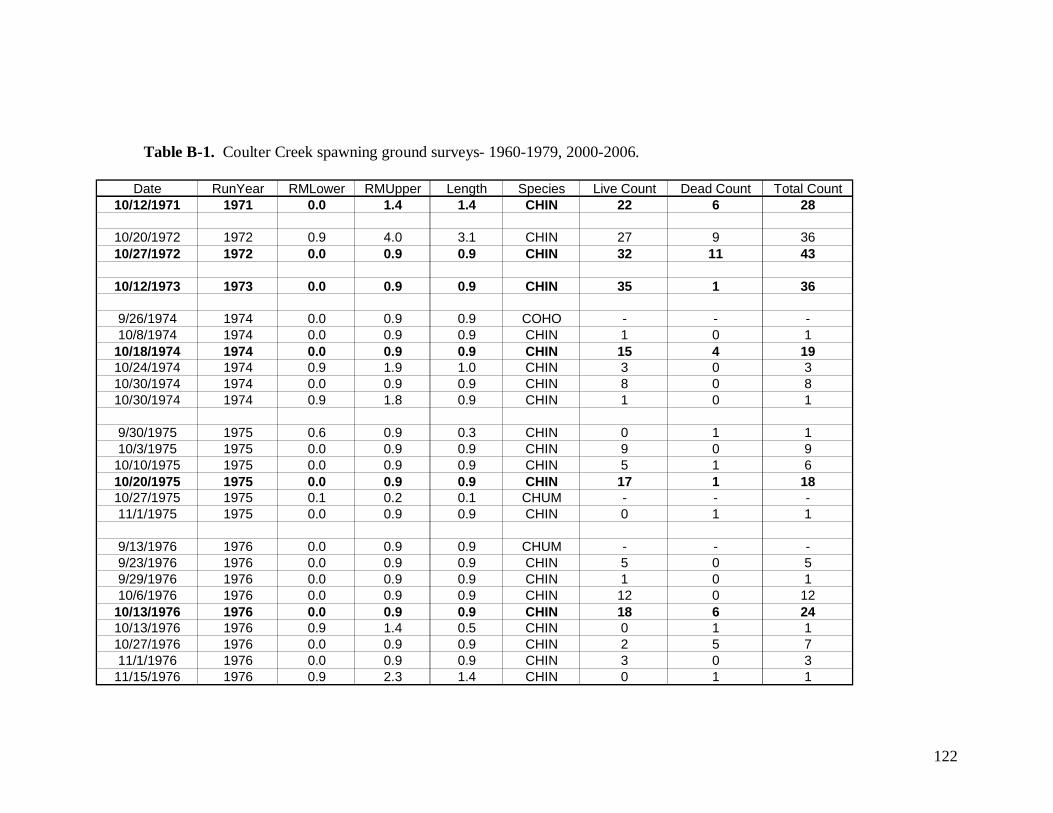
Table Table A-1: Hatchery Chinook salmon brood year releases in the Nisqually Basin (WRIA 11), 1952-2004………………………………………………….. 102 Table A-2: Hatchery Chinook salmon brood year releases in the Tacoma Basin (WRIA 12), 1952-2004………………………………………………….. 104 Table A-3: Hatchery Chinook salmon brood year releases in the Deschutes Basin (WRIA 13), 1952-2004………………………………………………….. 106 Table A-4: Hatchery Chinook salmon brood year releases in the Shelton Basin (WRIA 14), 1952-2004………………………………………………….. 108 Table A-5: Hatchery Chinook salmon brood year releases in the Kitsap Basin (WRIA 15), and WRIA’s 11-15, 1952-2004……………………………. 110 Table A-6: Adipose mark and CWT rates for hatchery Chinook salmon brood year releases in the Nisqually Basin, 1997-2003……………………….. 112 Table A-7: Adipose mark and CWT rates for hatchery Chinook salmon brood year releases in the Tacoma Basin, 1997-2003…………………………. 113 Table A-8: Adipose mark and CWT rates for hatchery Chinook salmon brood year releases in the Deschutes Basin, 1997-2003………………………. 114 Table A-9: Adipose mark and CWT rates for hatchery Chinook salmon brood year releases in the Shelton Basin, 1997-2003…………………………. 115 Table A-10: Adipose mark and CWT rates for hatchery Chinook salmon brood year releases in the Kitsap Basin, 1997-2003…………………………. 116 Table A-11: Nisqually River fall Chinook salmon run reconstruction, 1986-2006….. 117 Table A-12: Mean monthly stream flow averages (cubic feet per second) for miscellaneous South Puget Sound streams and three fall Chinook salmon systems (Lower Skagit, Snohomish, and Nisqually Rivers)........ 118 Table A-13: USGS Stream gaging stations, locations, and years of operation............. 119 Table A-14: Mean monthly average stream temperatures (° C) for three USGS gaging stations in the Skagit River and Snohomish River Basin............. 120 Table B-1: Coulter Creek spawning ground surveys- 1960-1979, 2000-2006……... 121 Figure B-2: Coulter Creek spawning ground survey effort- 1960-1979, 2000-2006 127
ix
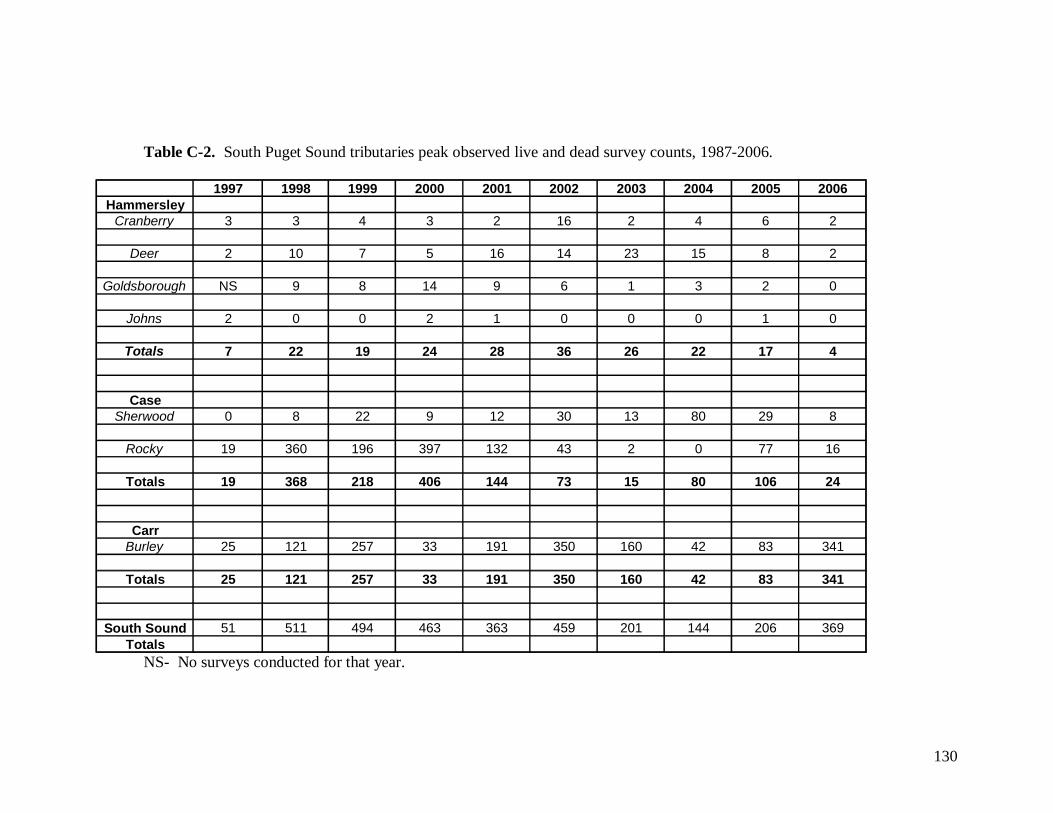
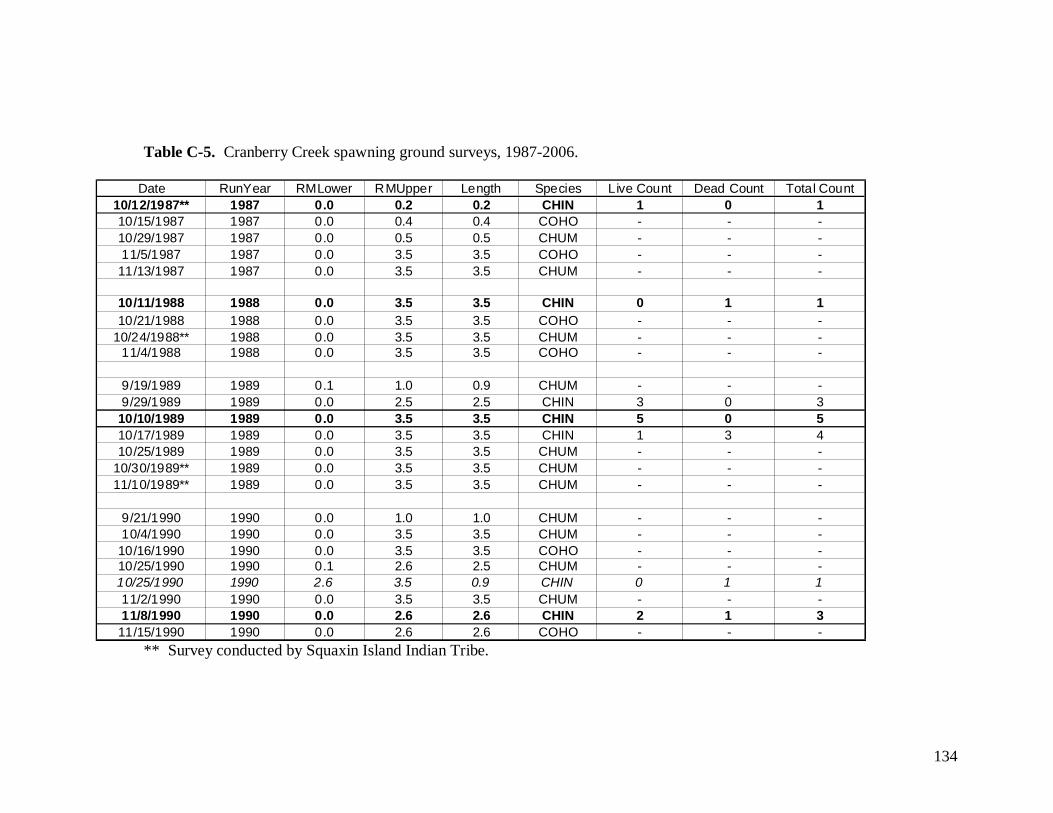
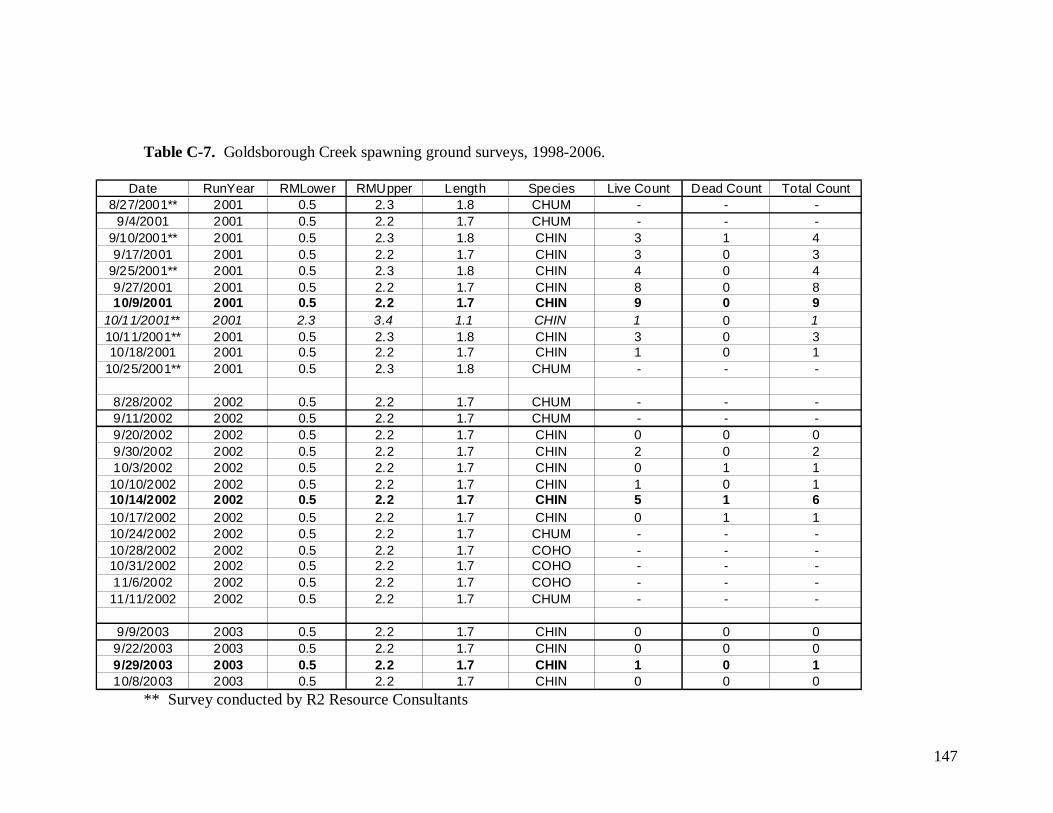
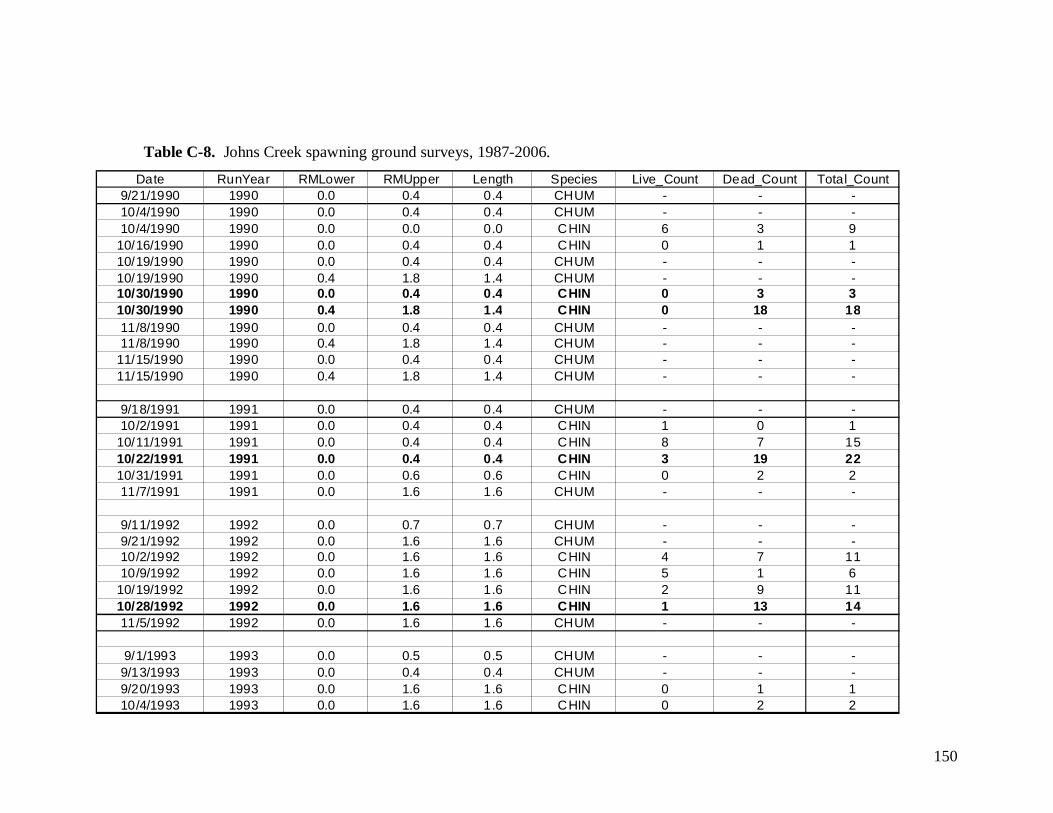
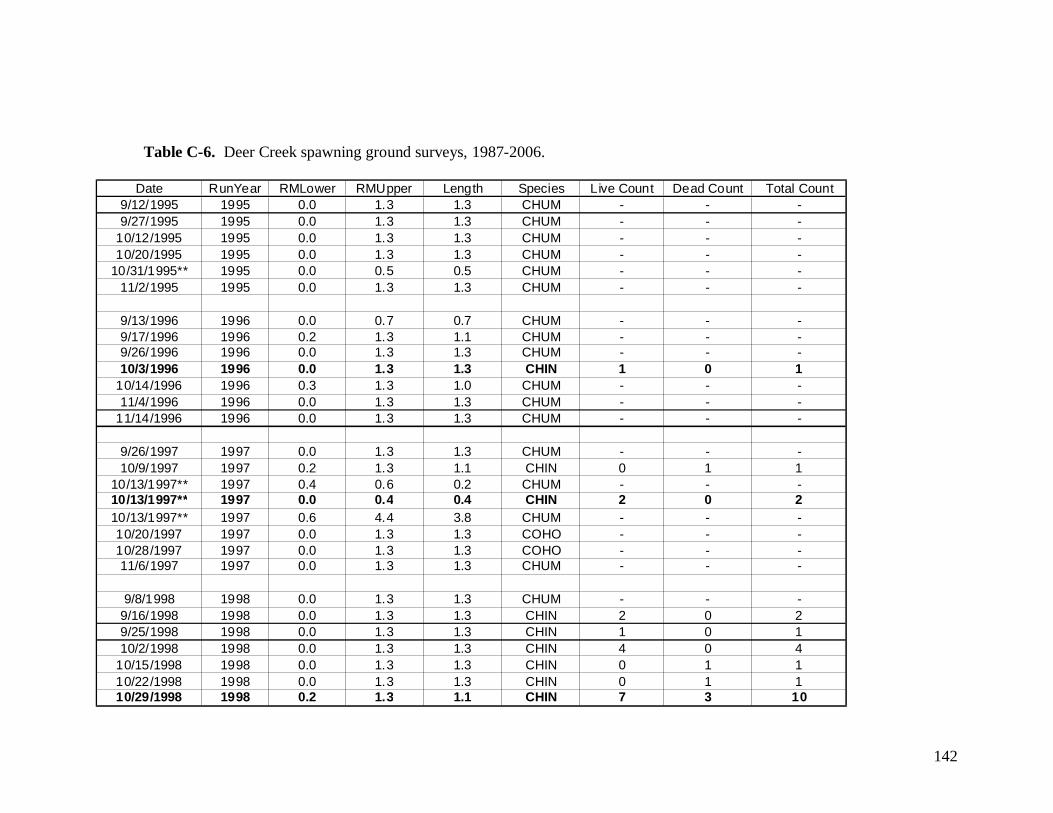
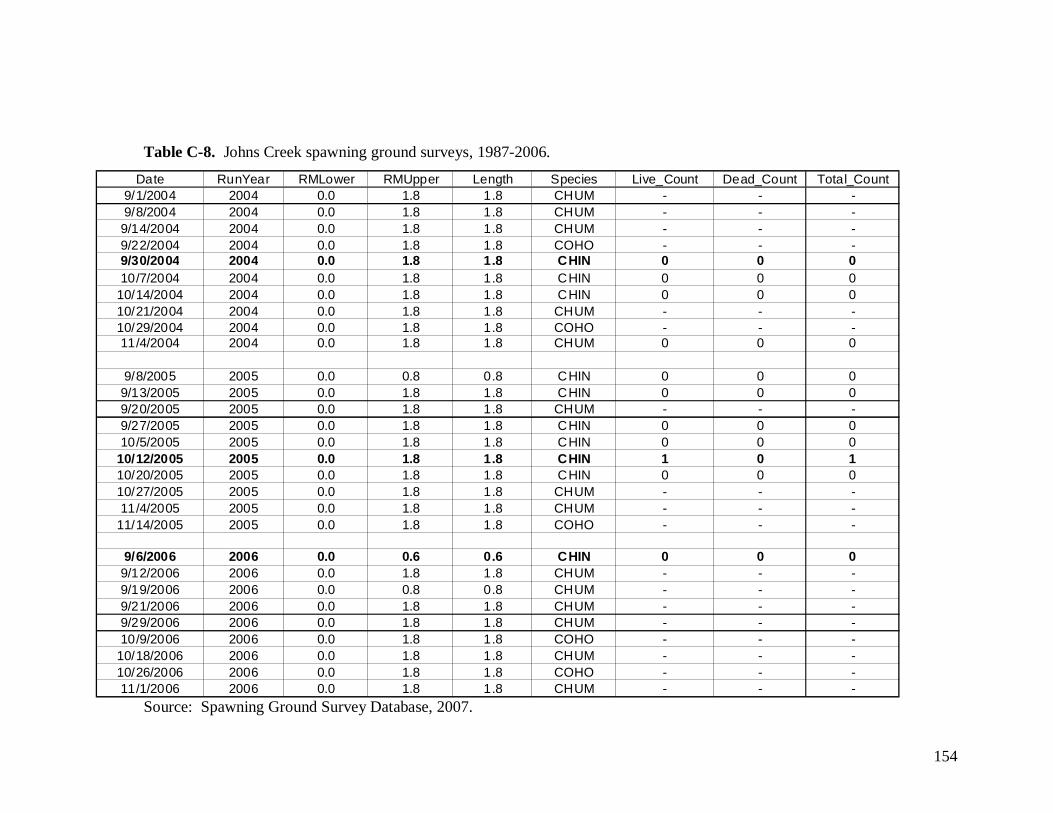
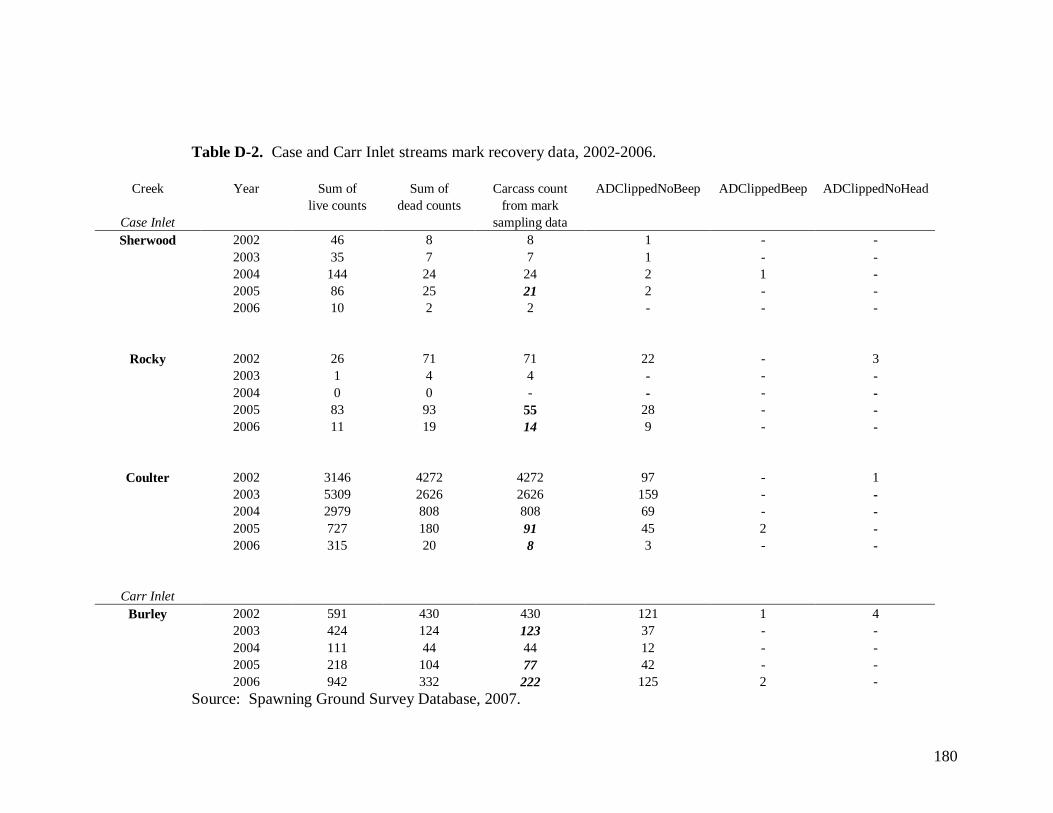
Figure B-3: Coulter Creek peak observed survey count dates- 1960-1979, 2000-2006……………………………………………………………. 127 Table C-1: Chinook salmon hatchery releases in South Puget Sound tributaries, brood years 1952-2004……………………………………………….. 128 Table C-2: South Puget Sound tributaries peak observed live and dead survey counts, 1987-2006……………………………………………………. 129 Table C-3: South Puget Sound tributaries AUC relative abundance estimates, 1987-2006.……………………………………………………………. 131 Table C-4: South Puget Sound Chinook salmon run reconstruction, 1987-2006… 133 Table C-5: Cranberry Creek spawning ground surveys, 1987-2006……………… 134 Table C-6: Deer Creek spawning ground surveys, 1987-2006…………………… 140 Table C-7: Goldsborough Creek spawning ground surveys, 1998-2006…………. 146 Table C-8: Johns Creek spawning ground surveys, 1987-2006…………………... 149 Table C-9: Sherwood Creek spawning ground surveys, 1987-2006……………... 155 Table C-10: Rocky Creek spawning ground surveys, 1987-2006…………………. 161 Table C-11: Burley Creek spawning ground surveys, 1987-2006…………………. 166 Table D-1: Hammersley Inlet streams mark recovery data, 2002-2006………….. 177 Table D-2: Case and Carr Inlet streams mark recovery data, 2002-2006………… 180 Table D-3: Hammersley Inlet streams revised mark recovery data, 2002-2006..... 183 Table D-4: Case Inlet streams revised mark recovery data, 2002-2006………….. 185 Table D-5: Carr Inlet streams revised mark recovery data, 2002-2006………….. 186 Table D-6: Releases of eyed Chinook salmon eggs in Sherwood Creek by the Sherwood Creek Cooperative and Allyn Salmon Enhancement Group, brood years 1990-2003………………………………………………. 187 Table D-7: Estimated return of Chinook salmon at Sherwood Creek due to eyed egg releases by regional enhancement groups, 1998-2006 188
x
List of Acronyms
AD Adipose fin marked
AUC Area-under-the-curve
CWT Coded wire tag
DPS Distinct population segment
EDT Ecosystem diagnosis treatment
ESA Endangered Species Act
ESU Evolutionary significant unit
FPP Fish per pound
HGMP Hatchery and Genetic Management Plan
NMFS National Marine Fisheries Service
NOAA National Oceanic and Atmospheric Administration
NWMT Northwest Marine Tech
RM River mile
RMIS Regional Mark Information System
RSI Remote site incubator
SaSI Salmonid Stock Inventory
SaSSI Salmon and Steelhead Stock Inventory
TRT Technical Recovery Team
USFWS United States Fish and Wildlife Service
USGS United States Geological Survey
WDF Washington Department of Fisheries
WDFW Washington Department of Fish and Wildlife
WDW Washington Department of Wildlife
WRIA Water Resource Inventory Area
WWTIT Western Washington Treaty Indian Tribes
xi
Acknowledgments
This thesis would not have been possible without the generous input, support, and
guidance of many individuals. First, I would like to thank my thesis advisors for their
help throughout this arduous process. Dr. Amy Cook read over numerous drafts, and
supplied helpful comments and edits through the entire writing process. Dr. Paul Butler
provided edits and suggestions helpful in creating a polished final draft. Scott Steltzner,
Squaxin Island Indian Tribe, was instrumental in developing the premise for this thesis,
and was very helpful in providing proper context for many of the policy aspects therein.
Tremendous support was also provided by two individuals: Kyle Brakensiek,
who spent countless hours providing guidance and suggestions, while simultaneously
listening to my findings and frustrations, and Larry Phillips, Washington Department of
Fish and Wildlife, who spent extensive amounts of time explaining WDFW data and
policies, and provided feedback that greatly improved the final document.
Assistance was also provided by many local natural resource professionals. Craig
Smith, Nisqually Indian Tribe, promptly provided tribal hatchery release and escapement
data. Amy Callahan, Thurston County Geodata, produced an excellent map of the South
Puget Sound study site and provided the use of an IBM ThinkPad. WDFW personnel,
who are so numerous they cannot be named, provided answers to numerous questions
throughout the process. In addition, advice provided by USFWS personnel, during my
employment with the agency, was also influential.
I would also like to thank friends, roommates, and fellow Evergreen students for
providing humor, and inquiring about my progress and mental state, throughout this long
process.
Finally, I want to thank my loving family, including my loving parents and sister,
for their continued support and encouragement during graduate school and throughout
my life.
1
Introduction
Wild Chinook salmon (Oncorhynchus tshawytscha) populations have declined
throughout the Puget Sound region in recent decades. These population declines
prompted the National Marine Fisheries Service (NMFS) to designate the Puget Sound
Chinook salmon evolutionary significant unit (ESU) as threatened under the Endangered
Species Act (ESA), first in 1999 and again in 2005 (NMFS, 1999; NMFS, 2005a). In the
South Puget Sound region, which encompasses all Puget Sound waterways that lie south
of the Tacoma Narrows, there is currently only one independent population of Chinook
salmon in the Puget Sound ESU, located in the Nisqually River. Due to its unique
position, some policymakers and scientists deem this independent population important
for the recovery of the entire Puget Sound ESU (Shared Strategy Development
Committee, 2007). In addition to the Nisqually River population, Chinook salmon have
been observed, in recent times, in the small, independent streams that feed into South
Puget Sound. These small, independent tributaries, defined as individual streams that
drain directly into Puget Sound, will hereafter be referred to as South Puget Sound
tributaries (Figure 1). The number of Chinook salmon observed in South Puget Sound
tributaries is small, in comparison to Chinook abundance in the Nisqually River, and also
intermittent, with tens to hundreds of fish observed in some years but none in other years
(Ruckelshaus et al., 2006). Historical records regarding the abundance and spawning
presence of Chinook salmon in these tributary streams are lacking, so the origin of these
fish, and their potential relationship to independent Puget Sound Chinook salmon
populations, is currently unknown.
The historical presence, or absence, and origin of the Chinook salmon that
currently return to South Puget Sound tributaries is alluded to in a document published by
the Puget Sound Technical Recovery Team (TRT), a committee designated the task of
identifying independent populations of Chinook salmon in the Puget Sound region. The
TRT did not assign all groups of Chinook salmon, which are reported to spawn naturally
in Puget Sound streams, to independent populations for two reasons. One reason is that
the small numbers of Chinook, which intermittently return to certain streams, might be
part of larger independent populations and only return to these small streams during years
2
of high abundance or favorable habitat conditions. The second reason why Chinook
salmon that return to these streams are not designated as an independent population is
because the streams may not have supported naturally spawning Chinook populations
historically, and the only reason Chinook return to these streams currently may be due to
returning adults from hatchery production. In the interim, the TRT document suggests
that Chinook salmon that return to these small streams, which are not within the
geographic boundaries of independent Chinook populations, should be given
consideration towards possibly contributing to the population dynamics of independent
Puget Sound Chinook salmon populations (Ruckelshaus et al., 2006). The suggestion
that small numbers of Chinook salmon returning to streams, for which historic presence
or absence is unknown, might contribute to the population dynamics of independent
Chinook populations in the Puget Sound could be an indication that the Chinook in these
small streams might be considered as beneficial towards recovery efforts for the Puget
Sound Chinook salmon ESU. If this hypothesis were proven true, or accepted as policy,
it could potentially mean the designation of these small streams as critical habitat for the
Puget Sound Chinook salmon ESU.
The origin of Chinook salmon that return to South Puget Sound tributaries has
been studied from many angles, including genetic analysis comparing fish found in these
small streams with fish from the Nisqually River and various South Puget Sound
hatchery programs, as well as habitat surveys comparing the parameters of these small
streams with known information on Chinook spawning needs and preferences. Another
possible area of study is to summarize historical records of spawning presence, timing,
and abundance of Chinook salmon in the small, independent tributaries of South Puget
Sound in order to determine the origin of these fish (Ruckelshaus et al., 2006). An
analysis of existing spawning ground surveys and hatchery release records pertaining to
the small, independent tributaries of South Puget Sound will be conducted to assess how
extensive the influence of hatchery-origin fish is among the Chinook salmon observed in
these small streams.
This document is designed to test for indications of hatchery influence among the
Chinook salmon using the small, independent tributary streams that feed into South Puget
Sound. It will begin with a general description of Chinook life history, an in-depth
3
review of this issue within the broader policy arena, existing genetic information about
South Sound Chinook stocks, and a review of South Puget Sound hatchery releases of
Chinook salmon. Past abundance estimates for both Nisqually and South Puget Sound
Tributaries Chinook will be summarized, and a comparison of the characteristics of South
Puget Sound streams with known Puget Sound Chinook salmon systems will be
provided. Existing spawning ground survey and hatchery release records will be
analyzed in three scenarios that test for indications of hatchery-origin fish among the
Chinook salmon observed in these streams. These will be followed by results, a
discussion of the results, and the implications of these results in relation to the recovery
of the Puget Sound Chinook salmon ESU.
4
Figure 1. South Puget Sound study site map.
Source: Amy Callahan, Thurston County Geodata, 2008.
5
Background
Chinook Salmon Life History
Chinook salmon (Oncorhynchus tshawytscha) are the largest of the five species of
Pacific salmon in the genus Oncorhynchus, and like the other four species Chinook are
anadromous (migrate to sea and return to freshwater to spawn) and semelparous (spawn
only once before dying). They are a commercially valuable species and are highly sought
after by commercial, tribal, and recreational fisheries. There are two recognized forms or
races of Chinook salmon, stream-type and ocean-type, which display differing life history
attributes, including: length of freshwater, estuarine, and oceanic residence, age at
seaward migration, ocean distribution and migratory patterns, and age and time of
spawning migration. The two forms of Chinook salmon, stream-type and ocean-type,
and their typical life history characteristics are summarized in Healey (1991).
Stream-type Chinook have a long freshwater residence time after emerging from
the gravel of their natal streams, spending one or more years in freshwater, as fry, before
migrating to sea as yearlings. While at sea, stream-type Chinook migrate into offshore
waters, and return to their natal river in the spring or summer (typically February through
July) several months prior to spawning. Stream-type Chinook salmon are typically found
in Asia, and North American populations north of 56°N, but are also found in some
headwater tributaries of southern North American populations. Ocean-type Chinook
salmon, unlike stream-type Chinook, have a shorter freshwater residence period. They
migrate to sea during their first year, as subyearlings, within three months of emergence
from the gravel where they were spawned. Ocean-type Chinook typically spend most of
their ocean residence in coastal waters and return to their natal river in late summer or fall
(typically July through December), only a few days or weeks before spawning proceeds.
The ocean form of Chinook salmon is typically found in North American coastal
populations south of 56°N (Healey, 1991). In addition to the variation in life history
characteristics between the two forms or types of Chinook salmon, there exists variation
of life history characteristics within each form as well. Given these life history
characteristics, the coastal and relatively southern latitude of Puget Sound, the tendency
of Puget Sound Chinook to migrate north along the Canadian Coast (Shared Strategy
6
Development Committee, 2007), and because Puget Sound Chinook salmon return to
their natal rivers in late summer or fall, it is presumed that Puget Sound Chinook are
ocean-type; all subsequent references to Chinook salmon from South Puget Sound and
other river systems will be in reference to ocean-type, and particularly fall, Chinook
salmon unless otherwise noted.
Like other ocean-type Chinook, the majority of Puget Sound Chinook salmon
migrate out of their natal, freshwater streams during their first year and make use of the
productive estuarine and nearshore habitats of the Puget Sound. These waters provide an
excellent environment for juvenile Chinook because they provide plenty of food in the
form of insects and forage fish (Fresh et al., 1979), protection from predators (Beamer et
al., 2003), and a place to undergo the physiological transition to saltwater (Simenstad et
al., 1985). It is during their residence in the highly productive estuarine and nearshore
waters that juvenile salmon experience the highest growth rates of their lives (Shared
Strategy Development Committee, 2007). As juvenile Chinook continue to feed and
grow in the estuarine environment of Puget Sound, they venture into deeper, and further
offshore, habitats until they complete their migration to the ocean environment (Fresh,
2006).
Chinook salmon remain at sea from one to six years, but most commonly two to
four years. Some yearling males, also known as “jacks”, either mature exclusively in
freshwater or enter the saltwater environment for only two or three months before
returning to freshwater, but the proportion of these precocious males is normally small
(Myers et al., 1998). The majority of Puget Sound Chinook stocks mature as three- or
four-year olds (Shared Strategy Development Committee, 2007), and the distribution of
age at return for the Nisqually River Chinook stock supports the findings of Myers et al.,
1998. Unpublished hatchery return data from the Nisqually Indian tribe states that age at
return rates of adult Chinook, from 1990-1999, are 49.0% for three-year olds, 48.4% for
four-year olds, and 2.5% for five-year olds (Nisqually Indian Tribe, 2007a). Age at
return data does not exist specifically for South Puget Sound Tributaries Chinook natural
spawners, but is likely similar to that of the Nisqually stock, since 85% of the Green
River Chinook stock, the main hatchery broodstock used throughout Puget Sound during
7
the latter half of the twentieth century, return as three- and four-year olds (Shared
Strategy Development Committee, 2007).
Scientific evidence suggests that the time of year at which adult Chinook salmon
return to freshwater, and to spawn, is related to local temperature and flow regimes
(Miller and Brannon, 1982). Adult Puget Sound Chinook salmon return to freshwater
from late March to early December, with the peak spawning period occurring from mid-
to late August through mid-October (Shared Strategy Development Committee, 2007).
Summer and fall Chinook salmon runs predominate in Puget Sound, as many of the early,
or spring, runs have been extirpated (Myers et al., 1998). In South Puget Sound, both
Nisqually River and South Sound Tributaries Chinook salmon exhibit similar spawning
behavior, with the former returning to the river from late July through mid-September
and spawning from mid-September through October, and the later spawning from late-
September through October (WDF et al., 1993). While numerous studies reveal that
adult salmon return to their natal streams with high success (Quinn and Fresh, 1984;
McIsaac and Quinn, 1988), adult salmon do sometimes stray to systems other than their
natal stream. Straying is considered a response to perturbed or unfavorable conditions at
one’s natal stream (Quinn, 1993). Other important reasons why salmon stray include low
competition for colonizing new systems, including newly created habitat following the
recession of glaciers (Milner et al., 2000) or after natural disasters such as volcanic
eruptions (Quinn, 2005).
Policy
The Endangered Species Act and Evolutionary Significant Units
The Endangered Species Act was enacted by Congress in 1973 to allow for the
conservation of species that were in danger of or threatened with extinction (USFWS,
1973). NMFS, through the National Oceanic and Atmospheric Administration (NOAA),
was assigned the task of designating anadromous salmonids under the ESA, while the
United States Fish and Wildlife Service (USFWS) designated all non-anadromous fish.
The initial enactment of the ESA only permitted the listing of full species, but the ESA
was amended in 1978 to allow for the listing of distinct population segments (DPS) of
8
vertebrates (including fish), as well as subspecies (Good et al., 2005). Since the ESA was
ambiguous in providing guidelines for determining what constitutes a DPS, NMFS
published a policy describing how the agency would apply the definition of species in the
ESA towards anadromous salmonid species (Good et al., 2005). According to NMFS
policy, a salmon population, or group of populations, is considered distinct for ESA
purposes if it represents an ESU of the biological species (Waples, 1991). An ESU is
defined as a population that 1) is reproductively isolated from conspecific populations
(other population units of the same species), and 2) represents an important component in
the evolutionary legacy of the species (Waples, 1991). Insight into evolutionary
significance can be provided by data on genetic and life history characteristics, habitat
differences, and the effects of supplementation efforts and stock transfers (hatchery
releases). Information useful for determining the degree of reproductive isolation
includes recolonization rates, incidences of straying, degree of genetic differentiation,
and the existence of barriers to migration (Good et al., 2005).
In 1998, NMFS completed a status review of Chinook salmon from Washington,
Oregon, Idaho, and California. The Biological Review Team that completed the status
review reported that the overall abundance of Chinook salmon in the Puget Sound ESU
had declined substantially from historical levels for a variety of reasons, including
decreased access to spawning habitat, degraded freshwater habitat, and an increasing
reliance on hatchery fish for achieving escapement and harvest goals (Myers et al., 1998).
Following the status review of West Coast Chinook salmon, NMFS listed the Puget
Sound Chinook salmon ESU as a threatened species under the ESA on March 24, 1999
(NMFS, 1999). According to Section 3.19 of the ESA, a threatened species is “any
species which is likely to become an endangered species within the foreseeable future
throughout all or a significant portion of its range”. Thus, at the time of this listing, the
Puget Sound Chinook Salmon ESU was at risk of becoming endangered, but not at risk of
becoming extinct, in the foreseeable future.
Not long after the Puget Sound Chinook Salmon ESU was listed as threatened
under the ESA, a few factors led NMFS to conduct a systematic update of all listed
Pacific salmon and steelhead ESUs. First, a court ruling from September 2001 brought
into question NMFS’ decision not to list several hatchery populations that were
9
considered to be part of the Oregon Coast coho salmon ESU (Alsea Valley Alliance v.
Evans, 161 F. Supp. 2d 1154, D. Oreg.). The Alsea decision, as it will hereafter be
called, held that the ESA does not permit the listing of any unit smaller that a DPS (in
this case an ESU), and that NMFS had violated this provision of the ESA by listing only
part of an ESU. Prior to this decision, NMFS had listed very few hatchery populations
under the ESA, and those listed were either closely associated with natural salmon
populations or ESUs considered at high risk of extinction (Good et al., 2005). In addition
to the Alsea decision, this discrepancy regarding NMFS’ interpretation of the ESA was
raised by two additional, and similar, lawsuits regarding steelhead ESUs in California. In
these lawsuits [EDC v. Evans, SACV-00-1212-AHS (EEA); MID v. Evans, CIV-F-02-
6553 OWW DLB (E.D. Cal.)], it was determined that NMFS had violated the ESA by
listing only the anadromous population of the ESU while excluding the resident
population, part of the same ESU, from listing. The outcome of the Alsea decision, and
steelhead lawsuits, meant that for any subsequent listings of Pacific salmon and
steelhead, NMFS must list, or exclude from listing, an ESU in its entirety. It also meant
that NMFS would now have to consider how to view hatchery populations of salmon that
reside within an ESU containing natural populations.
These court decisions, coupled with the fact that nearly a decade had passed since
the first ESUs were listed in the Sacramento and Snake Rivers and several years of
additional data were available for other ESUs, prompted NMFS to begin an update of all
listed ESUs of Pacific salmon and steelhead in 2002 (Good et al., 2005). An updated
status review of listed ESUs of West Coast salmon and steelhead was completed in 2005,
and the majority of the NMFS Biological Review Team members assigned to the
Chinook salmon species decided that the Puget Sound Chinook Salmon ESU should be
designated as threatened (Good et al., 2005). On June 28, 2005, NMFS reaffirmed
threatened status for the Puget Sound Chinook salmon ESU under the ESA (NMFS,
2005a).
10
The Puget Sound Technical Recovery Team and the 1992 Washington State Salmon
and Steelhead Stock Inventory (SaSSI)
Between the timing of NMFS’ first and subsequent listings of the Puget Sound
Chinook Salmon ESU, the Puget Sound Technical Recovery Team (TRT) was formed.
The TRT was assigned the task, for recovery planning purposes, of identifying
populations that historically existed and currently remain within the geographical
boundaries that encompass the Puget Sound Chinook Salmon ESU (Ruckelshaus et al.,
2006). The TRT, which began work in 2000, included one or more representatives from
the following organizations: Northwest Fisheries Science Center, Northwest Indian
Fisheries Commission, Washington Department of Natural Resources, National Marine
Fisheries Service, King Country Department of Natural Resources and Parks, Tulalip
Tribe, and Washington Department of Fish and Wildlife (WDFW). The process the TRT
used to identify populations of Chinook salmon within the Puget Sound ESU was similar
to the process used by NMFS to identify ESUs of Chinook salmon and other salmonids,
in that both processes involved distinguishing a smaller, independent population from a
larger population based on biological and geographical differences.
The TRT defined an independent population using Ricker’s definition of a
“stock” as “a group of fish of the same species that spawns in a particular lake or stream
(or portion thereof) at a particular season and which, to a substantial degree, does not
interbreed with fish from any other group spawning in a different place or in the same
place at a different season” (Ricker, 1972). The significant information necessary to
identify independent populations, under the previously mentioned definition, is migration
rates between groups and their demographic distribution (Ruckelshaus et al., 2006).
Since information regarding salmon straying between streams was lacking, the TRT had
to rely on different types of information to infer the degree of reproductive isolation
between Chinook salmon groups. The TRT decided on six indicators of historical
population structure, ordered by the strength of inference: 1) geographic orientation of
groups 2) migration rates 3) genetic attributes 4) patterns of life history or phenotypic
characteristics 5) population dynamics 6) environmental/habitat characteristics. Not all
of the indicators proved useful in this analysis, and only geography, genetics, and some
11
life history information were used as indicators to distinguish independent populations
within the Puget Sound Chinook Salmon ESU (Ruckelshaus et al., 2006).
In making decisions regarding designation of independent populations of Puget
Sound Chinook salmon, the TRT reviewed all Chinook salmon groups that spawned
naturally in Puget Sound streams. Information about Puget Sound Chinook salmon
spawning groups was obtained from the 1992 Washington State Salmon and Steelhead
Stock Inventory (SaSSI); updates to the 1992 version, completed in 2002, were also
considered. (In 1997, SaSSI was renamed SaSI (Salmonid Stock Inventory) and stock
assessments have been updated periodically since that time, with the last update for
Chinook salmon stocks completed in 2002. The 1992 version will be referenced as
SaSSI and be cited as WDF et al., 1993; the latter version will be referred to as SaSI and
will be cited as WDF et al., 1993; updated 2002). SaSSI was written by Washington
Department of Fisheries (WDF), Washington Department of Wildlife (WDW), and
Western Washington Treaty Indian Tribes (WWTIT), hereafter referred to as the co-
managers. The co-managers were given the task of identifying all existing stocks of
salmon and steelhead that naturally reproduce in Washington waters, regardless of origin,
including native, non-native and mixed stocks (WDF et al., 1993). In SaSSI, a native
stock is defined as an indigenous stock that has not been substantially altered by genetic
interactions with non-native stocks and is still present in all or part of its original range.
A non-native stock is one that has established itself outside of its original range, and a
mixed stock is one whose individuals originated from native and non-native parents. A
mixed stock can also refer to a native stock that has undergone substantial genetic
alteration (WDF et al., 1993). SaSSI also determined that some stocks had insufficient
information to be adequately defined, so these stocks were listed as unknown.
The co-managers used a definition of stock that was very similar to that
developed by Rickers, focused on a group of fish that spawns in a particular place at a
particular season and does not substantially interbreed with other groups spawning in a
different place, or in the same place at a different season (WDF et al., 1993). The co-
managers used criteria to define stocks centered on distinct spawning distribution,
temporal distribution, biological characteristics, and genetics. Despite differences in
terminology, it appears that there are similarities in how both parties identified groups of
12
spawning Chinook salmon. The co-manager’s choice of the term “stock” and the TRT’s
use of the term “independent population” both are used to distinguish one group of fish
from other groups on the basis of geography, genetics, and life history characteristics (i.e.
spawning timing, freshwater entry). Given these similarities, it appears that the stock
listings in SaSSI lent themselves well for use by the TRT in its designation of
independent populations of Puget Sound Chinook salmon.
According to SaSSI, the Nisqually summer/fall Chinook stock, as it was referred
to in 1992, was rated as a healthy stock, meaning that production levels were consistent
with its available habitat and within the natural variations expected for survival in that
stock. The origin of the Nisqually stock was listed as mixed, likely because of the
influence of non-native Green River hatchery-origin fish, which, in combination with
habitat loss and high harvest rates, is presumed to have extirpated the natural Nisqually
stock (Nisqually Chinook Recovery Team, 2001). The Nisqually production type was
listed as composite, meaning the stock is sustained through a combination of wild
(natural) and artificial production. In 2002, SaSI rated Nisqually Chinook, the current
name for that stock, as depressed. A depressed stock is one whose production level is
below expected levels based on available habitat and natural variations in levels of
survival. (While a “depressed stock” rating suggests that a stock is declining in
abundance, it is not as serious a rating as that given to a critical stock, which is a stock
that has such low production levels that permanent damage to the stock has likely
occurred or will occur. Another way to comprehend this terminology is to view a
depressed stock rating as similar to that of a threatened designation under the ESA, while
a critical stock rating is similar to an ESA designation of endangered.) The Nisqually
stock was rated as depressed because of low stock productivity, meaning the stock
produced fewer returning offspring than would be expected given the estimated number
of spawners. As in 1992, the Nisqually stock was listed as mixed and the production type
was determined to be composite.
Using information regarding stock listings in SaSSI, the Puget Sound Technical
Recovery Team determined that there were 22 historical populations that currently
existed within the Puget Sound Chinook Salmon ESU, and 16 additional spawning
aggregations or populations that were now putatively extinct. The Nisqually River is
13
listed as one of the 22 existing historical populations, and is one of six independent
populations classified in the Central and South Puget Sound Region. The Nisqually
River independent population is the furthest south, geographically, of the 22 Puget Sound
populations.
The TRT noted that both the early- and late-run Nisqually spawning aggregations
are considered to be extinct (Ruckelshaus et al., 2006). Uncertainty over whether these
aggregations of spawners might represent distinct populations led the TRT to term them
as “spawning aggregations”, split into early- and late-run times. While little historical
information regarding early-run Nisqually Chinook salmon is available, Smoker et al.
(1952) noted that historical peak harvest occurred more than a month earlier than the
current harvest on naturalized, nonnative, Green River origin Chinook salmon. This
observation might suggest that an earlier run timing of Nisqually River Chinook existed
historically, and the lack of Chinook returning to the river earlier in the season in recent
decades is presumably what prompted Nehlsen et al. (1991) to consider this early-run
spawning aggregation extinct. It should be noted that Nehlsen et al. referred to the
Nisqually River Chinook early-run spawning aggregation as the Nisqually spring/summer
race, but it is assumed that these two different terms refer to the same spawning
aggregation of Chinook salmon.
Although there is currently a late-run Nisqually River Chinook salmon spawning
aggregation, stock origin is difficult to determine. Research suggests that Nisqually
River Chinook are genetically similar to Green River Chinook (Marshall 1999; Marshall
2000), but genetic samples of Nisqually Chinook were not taken prior to the introduction
of non-native, Soos Creek Hatchery (Green River) origin Chinook into the Nisqually
River. Thus, this could imply that, genetically, either the native Nisqually stock may
have resembled other South Puget Sound Chinook stocks, including Green River
Chinook, or that the indigenous Nisqually River population has been replaced by Green
River origin Chinook salmon (WDF et al,, 1993, updated 2002). Given that early-run
Nisqually Chinook salmon, which may have contributed to the viability of Chinook
salmon in the watershed, are considered to be extinct, and the fact that late-run Nisqually
Chinook spawning aggregations have presumably been replaced by naturalized, non-
native hatchery broodstock, recovery efforts for Nisqually River Chinook are currently
14
focused on developing a locally adapted Chinook population in the long term (Nisqually
Chinook Recovery Team, 2001). This course of action is considered essential to ensure
that the Nisqually River Chinook population will provide a critically important
contribution to the recovery of the Puget Sound Chinook Salmon ESU (Shared Strategy
Development Committee, 2007).
In reviewing all Puget Sound Chinook salmon spawning groups, the TRT decided
not to assign all of the spawning groups documented in SaSSI as independent populations
for two reasons:
1) Spawning adults are known to occur intermittently in certain streams- spawning in groups of tens to hundreds of fish in some years and none in others. A plausible explanation for intermittent occurrence of Chinook salmon in some streams is that those adults are part of a larger independent population that uses some spawning habitats only during years of high abundance or favorable habitat conditions. The streams that intermittently harbor spawning adults also could contain fish from more that one independent population, depending on their locations relative to the primary spawning areas of independent populations.
2) It is possible that some streams presently containing Chinook salmon never
supported naturally spawning Chinook salmon historically. In many of these instances, the origin of the naturally spawning Chinook salmon present is most likely due to returning adults from hatchery production. Some streams may therefore contain Chinook salmon only because of the presence of a hatchery or releases of hatchery fish, and these streams would not have represented historical Chinook salmon spawning habitat that could sustain an independent population (Ruckelshaus et al., 2006).
These two statements are representative of the differing theories, referred to in the
introduction, regarding the population structure of Chinook salmon in the small,
independent tributaries of South Puget Sound. The first theory, which suggests that the
Chinook salmon intermittently observed in small tributaries to Puget Sound might be part
of larger independent Puget Sound populations, appears to rely on information from
SaSSI’s 1992 stock list for summer/fall Chinook in South Sound tributaries. The second
population structure theory for these small groups of Chinook salmon suggests that their
current presence in these streams is due to hatchery releases, and appears to rely on the
co-managers 2002 SaSI stock list for South Sound Tributaries Chinook. There exists a
15
significant difference between the 1992 and 2002 stock listing for Chinook salmon from
South Sound tributaries, and these differences are most likely responsible for the
differing theories regarding the population structure of these salmon groups.
The 1992 SaSSI stock list rated Chinook salmon from South Sound tributaries as
a healthy stock of mixed origin and composite production type. This stock was described
as one dependent upon hatchery production, from Green River hatchery stock, with some
sustained natural spawning occurring (WDF et al., 1993). The stock had a listed spawn
timing of September through October, and a spawning distribution that included
Chambers Creek, McAllister Creek, Deschutes River, Carr Inlet Streams, and other South
Sound streams. Another notable statement from the stock listing is a suggestion that
some of these fish may be part of a self-sustainable population of natural spawners, but
no data exists to quantify that statement (WDF et al., 1993).
The co-managers came to a much different conclusion in their 2002 rating of
South Sound Tributaries Chinook. In SaSI, the fall Chinook spawning aggregations, as
they were now referred to, were not rated and were no longer considered a distinct stock.
The co-managers supported this course of action based on the following rationale. First,
the streams in South Puget Sound are not typical Chinook habitat due to their relatively
small size and low flows during the typical fall Chinook spawning season (late
summer/early fall). Second, low escapement numbers from streams without on-site
Chinook hatchery operations likely resulted from past hatchery plants, or straying from
either current South Sound hatchery programs or viable South Puget Sound natural
populations. Third, fall Chinook were likely not historically self-sustaining in South
Sound streams and have little chance of establishing self-sustaining populations through
natural production. The co-managers concluded that Chinook salmon present in South
Sound tributaries in recent times are due to the large, numerous releases of Chinook from
South Sound hatcheries, and suggested that the large escapement numbers that led them
to classify the naturally spawning Chinook aggregations as a stock in 1992 consisted of
hatchery returns released or escaping above hatchery racks (WDF et al., 1993; updated
2002).
16
Critical Habitat Designation and its Application in South Puget Sound
The designation of critical habitat under the ESA is an important conservation
tool for listed species because it designates, and protects, habitat important to the
recovery of that species. Land designated as critical habitat is afforded protection from
human activities, such as development or resource extraction, which could potentially
degrade the condition of the land and further imperil the plight of a listed species.
Section 3(5)(A) of the ESA defines critical habitat for a threatened or endangered species
as:
(i) the specific areas within the geographical area occupied by the species, at the time it is listed … on which are found those physical or biological features (I) essential to the conservation of the species and (II) which may require special management considerations or protection; and
(ii) specific areas outside the geographical area occupied by the species at the
time it is listed upon a determination by the Secretary that such areas are essential for the conservation of the species.
Section 4 of the ESA requires the Secretary of the Department of the Interior to
designate critical habitat for listed species, and make revisions thereto, “on the basis of
the best scientific data available”. In deciding which lands to designate as critical habitat,
the Secretary looks at all lands that are eligible for inclusion, under Section 3(5)(A) of the
ESA, minus some lands that are eligible for exclusion due to reasons of economy,
national security, or Tribal/private ownership. Lands eligible for exclusion from critical
habitat designation include Department of Defense Lands, Tribal Lands, and private
landholdings with contractual commitments to conservation. The Secretary can also
exclude lands from critical habitat designation, under Section 4(b)(2) of the ESA, on
economic grounds if it is determined that the economic benefits of excluding an area
from critical habitat designation outweigh the conservation benefits of designating that
area. It merits noting that the Secretary is not permitted to exclude an area from critical
habitat designation if such an exclusion would result in the extinction of that species.
In September of 2005, critical habitat was designated for 12 ESUs of salmon and
steelhead in Washington, Oregon, and Idaho, including the Puget Sound Chinook salmon
ESU. Areas that were designated in the Nisqually Sub-basin include the entire mainstem
17
Nisqually River from its outlet in Puget Sound to the city of La Grande, McAllister
Creek, the nearshore marine area of the Nisqually Sub-basin, and numerous tributaries to
the Nisqually River, many of which serve as spawning grounds for Chinook and other
Pacific salmon species. Those areas of the Nisqually Sub-basin which were excluded
from critical habitat designation include the segment of the lower Nisqually River which
lies adjacent to the Nisqually Indian Reservation and the Fort Lewis Military Reservation
(NMFS, 2005b). Figure 2 provides a detailed map of the areas, within the Nisqually Sub-
basin, that were included in the final critical habitat designation for the Puget Sound
Chinook salmon ESU. The only other areas of South Puget Sound which were
designated as critical habitat for the Puget Sound Chinook ESU are the nearshore marine
areas of the Deschutes, Shelton, and Kitsap Sub-basins. Nearshore marine areas are areas
adjacent to the shoreline that span from the line of extreme high tide out to a depth of no
more then 30 meters relative to the mean lower low water. These areas are important to
Puget Sound Chinook because they provide food (aquatic invertebrates and fishes) and
cover (submerged and overhanging trees, aquatic vegetation, and boulders) that permit
juveniles to successfully transition from their natal streams to offshore marine areas
(NMFS, 2005b).
18
Figure 2. Areas designated as critical habitat within the Nisqually Sub-basin for the Puget Sound Chinook Salmon ESU.
Source: NMFS, 2005b.
19
Genetic Samples from Nisqually River and South Puget Sound Tributary Streams
Very little genetic analysis has been conducted on Nisqually River Chinook
salmon and none has been done for South Sound Tributaries Chinook. An analysis of
Chinook spawning in the mainstem Nisqually River, Mashel River, and Ohop Creek in
1998 through 2000 revealed that the allele frequencies of the combined samples were
similar to those of some South Puget Sound hatchery and wild populations, but the extent
of hatchery-origin fish in the genetic samples is unknown (WDF et al., 1993; updated
2002). While the Nisqually summer/fall Chinook stock is identified as a stock based on
their distinct spawning distribution (WDF et al., 1993), it is currently believed that the
indigenous population may have been replaced by Soos Creek Hatchery (Green River)
origin Chinook salmon (Marshall et al., 1995). Given the massive influx of South Sound
hatchery-origin Chinook salmon in South Puget Sound, and the lack of information
regarding the life history and genetic composition of both the native Nisqually stock and
South Sound tributaries spawning aggregation, the use of these attributes to determine
whether or not these two Chinook spawning aggregations coincided historically, and
potentially shared members of the same population, is not currently relevant.
Review of South Puget Sound Hatchery Releases of Chinook Salmon
Hatchery-origin Chinook salmon have been released in the Nisqually River, and
other South Puget Sound rivers and streams, since at least 1943 (WDFW, 2000). The
Regional Mark Information System (RMIS) is a comprehensive database that summarizes
all known releases and recoveries of hatchery-origin Pacific salmon in the Pacific
Northwest for brood years 1950-2007. The RMIS Database will serve as the main record
for summarizing releases of hatchery-origin Chinook salmon in the South Puget Sound
region for brood years 1952-2004. In compiling these records for summation, certain
assumptions and guidelines were made that will likely result in a negative bias toward
estimating the actual number of Chinook salmon released during this time period. First,
sites where releases of Chinook salmon occurred were only included in this summary if
the total number of fish released exceeded 500,000 for the entire 53 year time period.
Half a million was chosen as an arbitrary number to permit focus on areas with large
and/or consistent releases of hatchery-origin Chinook salmon. Choosing 500,000 as a
20
minimum total release number did exclude many release locations from the summary, but
considering the small number of fish released, and the scarcity of overall releases at many
of these sites, the impact of their exclusion from the summary of hatchery-origin Chinook
salmon released in the South Puget Sound region should be minimal.
Second, although the RMIS Database summarizes releases of Chinook salmon
from WDFW, USFWS, WWTIT, and local salmon enhancement groups, there exists a
likelihood that the actual number of Chinook salmon released exceeds the numbers
reported. Some releases of Chinook salmon may have been misreported or unreported
over this time period, especially towards the beginning of the time period when computer
usage for database management was not prevalent. Another reason to expect that the
actual number of Chinook salmon released in the region may exceed reported releases is
due to the fact that small releases by local salmon enhancement groups, and potential
releases by private citizens, are less likely to be reported than releases made by federal,
state, and tribal resource managers. While these events cannot be accounted for, the
effects of these plantings is likely minimal in comparison to the massive amount of
hatchery-origin Chinook salmon released into Southern Puget Sound since 1953.
The results of this summary are provided in Tables A-1 through A-5 and Figure 3.
Tables A-1- A-5 summarized brood year releases of Chinook salmon by WRIA
(Watershed Resource Inventory Area), while Figure 3 displays annual brood year releases
for the entire South Puget Sound region from 1952-2004. The annual brood year release
totals are included in Table A-5. Since the overwhelming majority of Chinook releases
occurred from hatchery facilities, a summary of the production facilities used by WDFW,
and the Nisqually Indian Tribe, was provided.
WDFW manages or co-manages ten facilities which produced, reared, or served
as release locations for fall Chinook salmon. The Nisqually Indian Tribe currently
manages two facilities which produce, rear, and release Chinook salmon, and the Squaxin
Island Indian Tribe managed or co-managed two facilities which released Chinook
salmon. All WDFW hatcheries, as well as Squaxin Island Indian Tribal facilities,
produce or produced Chinook salmon for the purpose of harvest by tribal, commercial,
and recreational fisheries. One of these facilities, Minter Creek Hatchery, also operates
for the purpose of recovering White River spring Chinook, listed as critical in SaSI
21
(WDF et al., 1993; updated 2002). The Nisqually hatcheries serve the dual purpose of
providing fish for harvest opportunity, while also aiding in the long-term recovery goal of
establishing a self-sustaining, locally adapted spawning population. The hatchery
facilities will be summarized according to the basin they occupy. Of the five basins
summarized, only the Nisqually River Basin is cited as historically supporting native
populations of Chinook salmon, and it is currently believed that the native population has
been replaced by fall Chinook salmon of various hatchery origins (WDFW, 2000). A
table summarizing the individual South Puget Sound Chinook salmon hatchery release
facilities is provided in Table 1.
Figure 3. Hatchery fall Chinook salmon releases in South Puget Sound, brood years 1952-2004.
Source: RMIS Database, 2008. * Release of 10,000 unfed fry at 1,000 FPP
66
67
In order to compare hatchery release mark and tagging rates with mark recovery
rates, it was necessary to look at brood year hatchery release rates three, four, and five
years prior to the return year being studied. Since Chinook salmon in the Puget Sound
region return primarily as three- and four-year olds (Shared Strategy Development
Committee, 2007), it was necessary to calculate a weighted average for each brood year
release that contributed to a given return year. The weighted average hatchery mark rates
for a given return year were calculated by multiplying each years mark rate by the
expected age of return rate for Nisqually River hatchery fall Chinook, which was 49.04%,
48.43%, and 2.5% for three-, four-, and five-year olds, respectively (Nisqually Indian
Tribe, 2007a). (South Puget Sound tributaries specific distribution of age at return data
could not be located, but Nisqually data were selected because the Nisqually River is
located within the South Puget Sound region and had these data available). The results
for all South Puget Sound hatchery releases, as well as those within WRIA 15, were
summarized in Table 7. Rates for WRIA 15 were provided because this region included
the Case and Carr Inlet streams that were mark sampled. Weighted average mark rates
for WRIA 14 were not calculated due to the small number of recent Chinook hatchery
releases in this area, and because collective recovery rates at Hammersley Inlet streams
were minimal, ranging from 1 to 7 sampled carcasses. Its use in this analysis was
excluded so as not to skew the results.
Hatchery mark and tagging rates from carcasses recovered on the spawning
grounds of South Puget Sound streams were compared with mark and tagging rates from
Chinook salmon released from South Puget Sound hatchery facilities and streams to see
if the rates were similar. A similar rate was defined as a mark recovery rate that was
within ± 3% of the hatchery mark and tagging rate. This number was chosen because the
likelihood that mark rates between the two data sets will match identically is minimal,
given the much smaller numbers of carcasses recovered and sampled on the spawning
grounds. A comparison of hatchery mark and tagging rates from streams, lumped
together by inlet, with mark and tagging rates from hatchery-released Chinook salmon
revealed that the rates of the latter were greater than the rates of the former for all but one
year at both inlets, even with the adjustment rate factored in. In 2002, mark and tag
recovery rates from carcasses sampled at Case Inlet streams was 87.3%, which was
68
within the ± 3% range of the South Puget Sound weighted average mark rate of 86.0%,
but not the WRIA 15 rate of 94.5%. In 2006, the mark and tagging recovery rate at
Burley Creek, the only stream sampled in Carr Inlet, was 97%. This rate was within the
range of both the weighted average mark rates for South Puget Sound and WRIA 15,
which were 96.4% and 99.4% respectively.
Table 7. Weighted average mark rates for Chinook salmon hatchery brood year releases that contributed to return years 2002-2006 (South Puget Sound and WRIA 15).
Minter Creek 3 1984, 2006 Fox Island Net Pens 5 1992, 1993 South Sound Net Pens 1 1993 Grovers Creek 11 1989, 1993, 1996,
2001-2003, 2006 Sund Rock Net Pens 1 2001
Case Coulter Creek Hupp Springs Rearing 7 1990, 1993, 2000, 2005
Minter Creek 2 2005 Fox Island Net Pens 6 1993-1995, 2000 George Adams 2 1993, 2004 Hoodsport 1 2001 Rocky Creek Fox Island Net Pens 2 1999, 2001 South Sound Net Pens 2 1992 Sherwood George Adams 1 2004 Long Live the Kings-
Lilliwaup 1 1999
Hammersley Deer Creek South Sound Net Pens 1 1993
George Adams 1 2000 Goldsborough South Sound Net Pens 1 1999
Little Skookum
Skookum South Sound Net Pens 3 1989
Budd Moxlie Creek South Sound Net Pens 9 1993, 1994, 2001
Percival Capitol Lake Rearing 3 1989 Allison Springs
Rearing 1 1989
Percival Cove Net Pens 2 1999, 2000 Woodland Fox Island Net Pens 1 1999 Source: RMIS Database, 2008.
Second, Chinook salmon released from Fox Island and South Sound Net Pens
were recovered at streams throughout the South Puget Sound region, indicating that they
strayed to sites both and close and far from their release site. CWTs released from the
two net pen sites were recovered at all but two of the streams, Sherwood Creek and
Percival Creek. Chinook salmon released from Fox Island Net Pens strayed to locations
82
both in close (Burley Creek) and far (Coulter Creek, Rocky Creek, and Woodland Creek)
proximity from their release site. The same was observed for Chinook released from
South Sound Net Pens, which were recovered at streams within close proximity (Deer
Creek, Goldsborough Creek, and Skookum Creek) as well as further proximity (Rocky
Creek and Burley Creek) from the net pens. Third, some Chinook salmon released from
hatcheries outside of South Puget Sound were recovered in South Puget Sound streams.
Most of these recoveries were from Chinook released at Hood Canal facilities, although
11 CWTs from Grovers Creek Hatchery, located in Central Puget Sound on the North
Kitsap Peninsula, were recovered at Burley Creek.
Although it is difficult to account for Chinook salmon from outside the South
Puget Sound region that strayed to streams within the region, CWT recoveries from these
streams suggested that most straying within the region occurred from either nearby
hatchery releases sites, or net pen release sites. Releases of yearling Chinook salmon
from both South Sound and Fox Island Net Pens have been discontinued, with the last
brood year release group of 1998 for the former and 1999 for the latter. With the
cessation of hatchery releases from these net pen sites, the number of Chinook straying
from net pen sites would be expected to diminish after 2003, the year that four-year olds
from the 1999 brood year returned. Thus, most straying of post 1999 brood year hatchery
Chinook released within South Puget Sound would be expected to come from fish
released at sites in close proximity to the streams where the fish strayed. Yet, if
proximity to a Chinook hatchery release site were primarily responsible for the number
and percentage of hatchery-marked carcasses observed at South Puget Sound streams,
then all streams within close proximity to a Chinook salmon hatchery release site should
have exhibited larger numbers and percentages of hatchery-marked carcasses than
streams that are located further away from a hatchery release site. While this rationale
might explain the numbers and percentages of hatchery-marked carcasses observed in
Burley Creek, Rocky Creek, Coulter Creek, and the four Hammersley Inlet streams, it
does not explain the low numbers and percentages of hatchery-marked carcasses
observed at Sherwood Creek.
Despite being in closer proximity to Coulter Creek than is Rocky Creek,
Sherwood Creek had a smaller sample size and much lower percentage of hatchery-
83
marked carcasses than the other two nearby streams located in Case Inlet. This might
imply that fish straying from Coulter Creek preferred Rocky Creek to Sherwood Creek.
Yet, the most recent releases of hatchery Chinook from Coulter Creek, brood years 1998-
2000, were entirely untagged, so there exists no definitive way to prove this theory.
Another possible explanation for the unexpected trend observed at Sherwood Creek
might be unmarked hatchery Chinook salmon releases within Sherwood Creek itself.
The Hatchery and Genetic Management Plan for Minter Creek stated that 10,000 unfed
fry, at 1,000 FPP, were provided to regional enhancement groups for release into
Sherwood Creek in April or May of the following year (WDFW, 2002). Hatchery release
records from the RMIS Database indicated that at least one release of 10,000 unmarked,
unfed fry, at 1,000 FPP, occurred at Sherwood Creek in November of 2002, through a
RSI Cooperative project. RSI stands for remote site incubator and is a device that
permits on-site rearing of salmonid eggs in remote stream reaches.
A conversation with John McAllister, a volunteer with the Sherwood Creek
Cooperative, which later merged with the Allyn Salmon Enhancement Group (ASEG),
revealed that these organizations received eyed Chinook salmon eggs from WDFW’s
Minter Creek Hatchery for release into Sherwood Creek in 1990, and from 1995-2003.
The mission and objectives of the Allyn Salmon Enhancement Group include enhancing,
protecting, and recovering indigenous populations of North Bay salmon, including
Sherwood Creek, where they still occur (Allyn Salmon Enhancement Group, 2008).
Eyed eggs were placed inside corrugated plastic tubes, with crushed rock above and
below the eggs and metal screening covering the top of the tube, at locations throughout
Sherwood and Schumocher Creek to permit the release of Chinook salmon fry directly
into the watershed (John McAllister- ASEG, Personal Communication). A summary of
these releases of eyed Chinook salmon eggs from the Sherwood Creek Cooperative and
Allyn Salmon Enhancement Group, which ranged from 10,000-100,000 per release year,
are summarized in Table D-6. A search of WDFW Future Brood Documents for 2004-
2007 indicated no transfers of unfed fry from Minter Creek to regional enhancement
groups for release into Sherwood Creek (WDFW, 2004- WDFW, 2006; WDFW, 2007a).
There exists a possibility that at least some of the small numbers of mostly
unmarked fish observed at Sherwood Creek could be attributed to the on-site release of
84
unfed fry. The number of Chinook salmon returning to Sherwood Creek as a result of
tube and RSI releases from 1995-2003 is likely minimal, given that survival of groups of
fish released in excess of 200 FPP are considered to have very low survival rates (Larry
Phillips- WDFW, personal communication). Yet, given the small numbers of Chinook
carcasses observed at Sherwood Creek from 2002-2006, even a small contribution from
these releases might explain the low percentage of unmarked hatchery carcasses
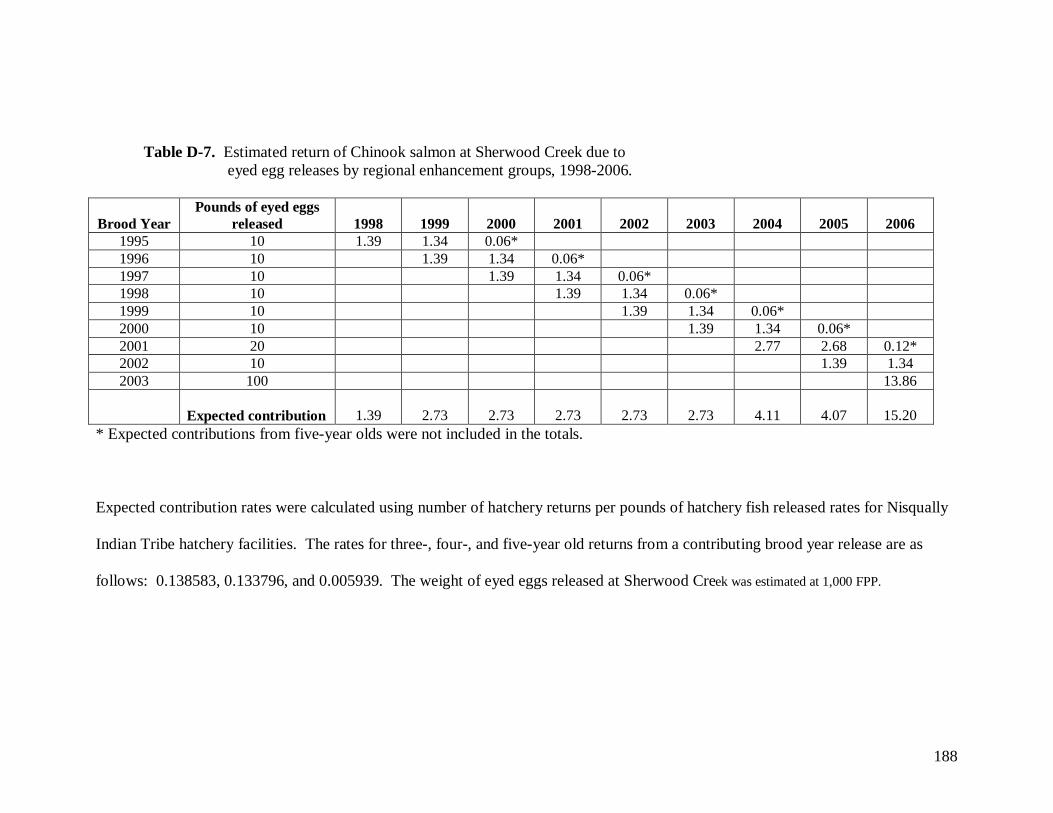
observed. A calculation of expected returns of eyed eggs released at Sherwood Creek
from 1995-2003 revealed that 1.4 and 1.3 unmarked fish would be expected to return as
three- and four-year olds following a release of 10,000 eyed eggs in years prior.
Expected contributions from five-year olds are so small from a release group of 10,000
(<0.1 fish) that it was ignored in this analysis. These figures, documented in Table D-7,
were calculated using Nisqually River fall Chinook salmon return rates per pounds of
hatchery fish released. This method of calculation is different than that used for
Nisqually River Chinook, which averages the projected return numbers that are
calculated using both fish returning per number released and fish returning per pounds of
fish released. The latter figure was chosen to calculate return rates in this instance,
because using the return rate per number released would project a much larger number of
returns than would be expected from a group of such a small physical size.
Assuming that these projected return rates for releases from 1995-2003 are
relatively accurate, expected contributions to returning Chinook salmon would be as
follows: two to three fish from 1999-2003, four fish in 2004 and 2005, and 15 fish in
2006 (Table D-7). While four fish returning per year, due to eyed egg releases, would not
explain the 13 unmarked carcasses observed at Sherwood Creek in 2004 and 2005, it
would definitely seem more plausible in years such as 2002 and 2003, when three and
four unmarked carcasses were recovered. The year 2006 appears to be an anomaly as
only two unmarked carcasses were recovered, although 15 fish were expected to return
due to the large, and last, release of 100,000 eyed eggs in Sherwood Creek. Still, it is
unlikely that the numbers of unmarked hatchery carcasses observed at Sherwood Creek
could be attributed solely to unmarked releases of fed fry, since AUC estimates at
Sherwood Creek from 2002-06 suggested larger numbers of live Chinook in the system,
ranging from 10-103, than observations of carcasses accounted for (Table C-3). This
85
indicated that greater numbers of live versus dead Chinook were observed in Sherwood
Creek from 2002-2006, which could be attributed to scavenging by predators, poaching
by humans, or carcasses being washed downstream or above the creek bank due to high
flows. Although all of the unmarked carcasses observed in Sherwood Creek cannot be
directly attributed to releases of unfed fry into the watershed from 1995-2003 by regional
enhancement groups, the expected contribution of Chinook returning due to these
releases could account for some of the unmarked carcasses observed during these years.
Unmarked carcasses observed at Sherwood Creek, and other South Puget Sound
tributaries, could be attributed to three groups of Chinook salmon: unmarked and
untagged hatchery strays, hatchery-origin recruits, or strays from naturally producing,
self-sustained populations within Puget Sound. There exits a distinct possibility that
unmarked carcasses recovered on South Puget Sound spawning grounds could be
attributed to one or all of these groups of unmarked Chinook salmon. With the advent of
mass marking of hatchery Chinook released from South Puget Sound hatchery facilities,
beginning with the 1998 brood year, an effort has been made to mark or tag 100% of all
fish released. Yet, hatchery release records from the RMIS Database indicate that a
100% mark or tagging rate has never been achieved at any South Puget Sound hatchery
facility. Rates of marked and tagged hatchery releases have ranged from 77.8- 98.0% at
all South Puget Sound hatchery facilities and from 95.8- 99.9% for WRIA 15 facilities
for brood years 1998-2003 (Table 6). Despite the high percentage of hatchery-released
fish marked and tagged, large numbers of unmarked releases have occurred during these
years, ranging from 318,000- 3,351,000 for all South Puget Sound hatchery facilities and
2,500- 133,000 for WRIA 15 facilities (Table 6).
Given the numbers of unmarked hatchery Chinook salmon released from WRIA
15 hatchery facilities during these brood years, and the small numbers of unmarked fish
observed in Hammersley, Case, and Carr Inlet streams, cumulatively ranging from 8 to
80 fish (Tables D-3 through D-5), the contribution of unmarked hatchery fish towards
unmarked carcasses observed at these streams could be significant. Yet, assuming that
both marked and unmarked hatchery-released fish strayed to these streams at the same
rate, it must also be assumed that unmarked hatchery Chinook strayed to these streams at
a rate equal to their proportion of overall hatchery-released Chinook salmon. Given the
86
recent high percentages of marked hatchery releases from WRIA 15 hatchery facilities,
an expectation would be to observe only one to four unmarked hatchery carcasses per 96-
99 hatchery-marked carcasses observed on the spawning grounds, depending on the
hatchery mark release rates from brood years three, four, and five years prior. The mark
recovery data revealed very few instances where this occurred, other than at Rocky Creek
and Burley Creek in 2006, so it was not possible to attribute all of the unmarked
carcasses observed to unmarked and untagged hatchery-released fish.
The other two options explaining how unmarked Chinook salmon could return to
South Puget Sound streams- attributing their presence to hatchery-origin recruits, or
strays from naturally producing, self-sustained populations within Puget Sound- are more
difficult to account for. There exists a possibility that hatchery strays that returned to the
spawning grounds in these streams could have successfully spawned, but it is difficult to
prove this with existing data. As for determining whether Chinook salmon from naturally
producing, self-sustained Puget Sound populations are returning to South Puget Sound
tributaries, CWT recoveries of Chinook from these populations could help answer this
question. Yet, only one naturally producing Chinook salmon population exists in South
Puget Sound, in the Nisqually River, and this population currently depends on hatchery
returns for the large numbers of Chinook returning to the system in recent years. A
search for CWT releases from Clear Creek and Kalama Creek Hatcheries in the Nisqually
River Basin was made using the RMIS Database. This search indicated that no CWTs
from Nisqually River hatchery Chinook salmon, out of 23,940 recoveries throughout
Puget Sound, were recovered in any South Puget Sound tributary streams located in
WRIAs 14 or 15. While this information only indicates that tagged releases of Nisqually
River hatchery Chinook salmon have not strayed to South Puget Sound tributaries located
in other inlets within the greater region, an inference could be made that the same would
hold true for other Chinook salmon which are released or spawned naturally in the
Nisqually River Basin.
87
Implications
Potential Role of South Puget Sound Tributaries Chinook Salmon in Recovery
Efforts of Nisqually River Chinook and the Puget Sound Chinook Salmon ESU
An attempt to establish the extent of hatchery-origin fish among Chinook salmon
observed in South Puget Sound streams has been made. While mark recovery rates and
certain abundance trends observed in these streams suggest a large influence of hatchery
Chinook straying from South Puget Sound hatchery facilities and release sites, the current
data are insufficient to attribute all the fish observed at spawning grounds to these
hatchery releases. The unmarked carcasses observed at South Puget Sound tributaries
were likely the result of unmarked hatchery releases, hatchery-origin recruits, or strays
from independent populations. Given these collective results, and the relatively small
size of these streams in comparison to other Puget Sound Chinook systems, it is unlikely
that the Chinook salmon observed in South Puget Sound tributaries could realistically
contribute to the recovery of Chinook salmon in South Puget Sound, and to further
extent, the recovery of the entire Puget Sound Chinook salmon ESU.
It is not possible to determine whether the presence of small numbers of
unmarked and untagged Chinook salmon observed in South Puget Sound tributary
streams could be attributed to fish that strayed from larger independent populations such
as the Nisqually River. Even if it were determined that these small aggregations of
unmarked and untagged fish strayed from the Nisqually River, two potential problems
exist which might suggest that Chinook salmon in small tributary streams could not likely
aid in the recovery of the Nisqually River Chinook salmon population. The first problem
is the current genetic state of the Nisqually River Chinook salmon stock. As previously
stated, genetic analysis suggests that the historic Nisqually fall Chinook salmon
population is likely now extant, as recent evidence revealed that this stock was
genetically similar to Green River hatchery-origin broodstock. Presuming that the
historically present Nisqually Chinook salmon stock, from which these small
aggregations of Chinook salmon theoretically strayed, is likely extant due to hatchery
releases of out-of-basin Chinook salmon stocks, an expectation should exist that these
fish, which may have historically strayed from the Nisqually River, would also be extant.
88
It appears that the only way that these small numbers of Chinook, which supposedly
strayed from the Nisqually River, could have served this historic role is if they managed
to avoid 50 plus years of hatchery supplementation within a basin with extensive records
of Chinook hatchery releases. The fact that no tagged Chinook salmon released from
Nisqually River hatcheries have been recovered at any of the South Puget Sound tributary
streams, which are not currently hatchery release sites, suggests that this theory is not
currently plausible.
Another reason to expect that small numbers of Chinook salmon that return to
South Puget Sound tributaries could not realistically contribute to recovery efforts for the
Nisqually River Chinook salmon independent population can be explained by population
viability. Theories on population viability suggest that salmon populations require
numbers of returning salmon above immediate replacement levels in order to prevent
extinction and ensure genetic integrity. NOAA fisheries generally employs a 50 fish
quasi-extinction threshold and 500 fish minimum population viability level to ensure that
normal environmental variation (i.e. floods, volcanic eruptions, and poor ocean
conditions) does not result in critically low return numbers for independent salmon
populations (McElhany, et al., 2003). Quasi-extinction is defined as abundance at a low
level which does not guarantee extinction, but cannot ensure recovery of the population
(Lower Columbia Fish Recovery Board, 2004). This “50/500 rule” is a general guideline
for minimum effective population size, identified in Thompson (1991), which relies on
studies by Soule (1980) and Franklin (1980), respectively. Since these minimum
numbers serve merely as rules of thumb that are used in relation to independent salmon
populations, or ESUs, their use to interpret minimum population viability of a potential
sub-population of a larger independent population is problematic. Yet, the numbers of
unmarked carcasses observed at South Puget Sound streams from 2002-2006 were quite
small, collectively ranging from 8 to 80 (Tables D-3 through D-5). These numbers
indicate that even if all of these unmarked carcasses observed could be attributed to
naturally produced Chinook that strayed from larger independent Puget Sound
populations, these numbers are often less than the 50 fish required to prevent abundance
from falling below levels from which recovery cannot be assured, raising doubt over the
recovery role that these small aggregations of Chinook salmon could potentially serve.
89
The role that small aggregations of Chinook salmon that appear in South Puget
Sound streams might provide towards the recovery of Nisqually River Chinook salmon
can also be questioned due to current management practices within the Nisqually River
itself. The Nisqually River Chinook stock is currently managed to provide for tribal
treaty and non-treaty sport and commercial harvest opportunities, with a long-term goal
of establishing a locally adapted Chinook salmon population. Yet, an analysis of recent
hatchery releases and harvest rates by the Nisqually Indian Tribe suggests that only the
former goal is currently being met. Recent in-river harvest rates by the Nisqually Indian
Tribe are indicative of harvest rates normally attributed to hatchery-managed runs, not
stocks managed for natural production (WDFW, 2000). Current hatchery and harvest
practices in the Nisqually River Basin suggest that the goal of establishing a locally
adapted Chinook salmon population will not be met in the near future. One way to
accomplish this goal would be to continue with in-basin hatchery releases, but cut harvest
rates so that larger numbers of Chinook salmon could naturally spawn. Once numbers of
naturally spawning fish reached a level where hatchery releases could be discontinued,
harvest of Chinook salmon could proceed. Yet complications in establishing a locally
adapted Chinook population in the Nisqually River Basin exist. The Nisqually Indian
Tribe currently has an annual in-river harvest management goal of 10,000- 15,000
Chinook salmon (WDFW, 2000). This a legally protected tribal treaty obligation granted
to the tribe through the Boldt decision of 1974 [U.S. vs. Washington, 384 F. Supp. 312
(W.D. Wash.)]. The level of Chinook production to meet this tribal harvest goal, as well
as provide for recreational harvest opportunities in the South Puget Sound region, cannot
currently be met without artificial production of Chinook salmon.
It is also unlikely that the Nisqually River Basin could produce enough Chinook
salmon to provide these levels of harvest, even if Chinook were returning at historic
levels. The EDT analysis previously mentioned suggests that the Nisqually River could
potentially support 19,000 Chinook salmon if the estuarine and riparian habitat within the
basin were restored to historic levels (Nisqually Chinook Recovery Team, 2001). Even
assuming that the conditions of the Nisqually River Basin could be restored to historic
conditions, it is unlikely that this number of returning Chinook salmon (19,000) would
support current levels of Chinook salmon in-river and sport harvest, which ranged from
90
11,000- 21,000 (Table A-11) and 1,200- 2,700 (WDFW, 2007d) for 2003-2006,
respectively. Thus, it appears that current harvest practices for fish returning to the
Nisqually River Basin and the goal of establishing a locally adapted Chinook salmon
population are mutually exclusive. Given the current management system in place for the
Nisqually River, it does not appear that small aggregations of Chinook salmon observed
at South Puget Sound streams, which may or may not have historically strayed from the
Nisqually River Basin, could aid in the recovery of the Nisqually River Chinook salmon
independent population.
Designation of South Puget Sound Tributaries as Critical Habitat for Nisqually
River Chinook Salmon: Context, Benefits, and Consequences
Although critical habitat designation of South Puget Sound tributary streams for
the sake of recovering the Nisqually River Chinook salmon independent population has
not been proposed as legislation, the issue remains unresolved, as evidenced by the two
theories of origin outlined in the Puget Sound Technical Recovery Team document. In
addition to uncertainty among policy makers, there also appears to be a belief held by
certain citizens, including some regional salmon enhancement groups, that Chinook
utilized these streams historically. This is likely evidenced by the recovery efforts of the
Allyn Salmon Enhancement Group in the Sherwood Creek watershed. This organization,
which aims to recover indigenous salmon populations in North Bay streams where they
still occur, might have requested and planted eyed Chinook salmon eggs, supplied from
WDFW, in Sherwood Creek from 1995-2003 in the belief that these efforts could restore
a historically present Chinook salmon population within this watershed. Thus, a lack of
historical evidence as to the presence or absence of Chinook salmon in these small
streams, combined with political pressure from certain private citizens, regional salmon
enhancement groups, and policy makers who believe that these fish may have been
present in these streams historically, suggests that designation of South Puget Sound
tributary streams as critical habitat for the recovery of the Puget Sound Chinook salmon
ESU could remain a pertinent issue for years to come.
Considering the speculation over whether or not South Puget Sound tributaries
Chinook salmon could aid in the recovery of the Nisqually River Chinook independent
91
population, and to some extent the entire Puget Sound Chinook salmon ESU, it is
necessary to discuss how critical habitat designation of these small streams would affect
both the people and biota that utilize these ecosystems. There are certainly some benefits
that would come with listing these streams as critical habitat for Puget Sound Chinook
salmon. Federal funds would be provided which could be used to either restore degraded
riparian areas or protect existing, in-tact riparian areas from further development. This
could provide benefits not only to Chinook salmon that return to these streams, but also
for other salmon stocks and animal species that currently reside in or use these habitats.
Critical habitat designation could also prove beneficial to citizens and government
officials concerned with the pressures that residential or commercial development pose to
salmon and their ecosystems. Yet, protections provided to ecosystems through critical
habitat designation only apply to a specific habitat during the interval that the listed
species is recovering, so these protections would likely disappear if the listed species
successfully recovered.
Despite the benefits of critical habitat designation for organisms that utilize South
Puget Sound tributary streams, unintended consequences could result from designating
these streams as critical habitat for the recovery of Puget Sound Chinook salmon. One
potential drawback to designating these small streams as critical habitat is that funds
granted to these sites might subsequently take money away from existing, and proven,
Chinook salmon recovery efforts in the greater Puget Sound region. Recovery efforts for
Chinook salmon populations in systems where Chinook occurred both historically and
presently could be negatively affected by recovery efforts in streams where historical
presence of Chinook salmon is currently unknown. A second concern with listing South
Puget Sound streams as critical habitat for the recovery of Puget Sound Chinook salmon
is that these listings would make the co-managers, including WDFW and the Squaxin
Island Indian Tribe, legally responsible for recovering Chinook salmon in these streams.
This could prove to be a large burden, since the co-managers would be legally mandated
to recover Chinook salmon in streams that may not have historically provided habitat
suitable to this species.
Another concern with listing these small streams as critical habitat for the sake of
recovering the Puget Sound Chinook salmon ESU is the potential precedent it could
92
establish in regards to listing hatchery-origin fish under the ESA. NOAA currently
defines fish returning to spawning grounds as either hatchery-origin or natural-origin
fish; a natural-origin fish is defined as the progeny of naturally spawning fish
(Ruckelshaus, et al., 2006). This means that hatchery-origin recruits, which are the
progeny of hatchery-origin fish that successfully spawn in natural habitats, are considered
to be natural-origin fish, whether or not the place where they were spawned historically
had salmon populations. There presently exists no evidence suggesting that Chinook
salmon historically returned to these small streams. Listing these streams as critical
habitat for the recovery of Puget Sound Chinook salmon, without sufficient historic or
current evidence suggesting that these fish represent a sub-population of a larger
independent population, could potentially allow the inclusion of South Puget Sound
Chinook hatchery strays under the ESA. This could set a bad precedent of permitting the
listing of salmon populations or sub-populations that may or may not have historically
existed. Although the Endangered Species Act does permit the listing and inclusion of
independent salmon populations in basins where that species was not historically present
(USFWS, 1973), this clause is meant to be used only if it is determined that the existing
habitat available to the species is so limited, or degraded, that recovery of the species
confined to those areas could potentially contribute to the permanent extinction of that
species. Given the current status of the Puget Sound Chinook salmon ESU, and the doubt
surrounding whether or not Chinook salmon historically appeared in South Puget Sound
tributaries, it would appear to be both a violation and misuse of the ESA, in its current
state, to designate these streams as critical habitat for the sake of recovering the Puget
Sound Chinook salmon ESU.
93
Conclusion
An attempt has been made to establish the extent of hatchery-origin fish among
Chinook salmon observed in South Puget Sound streams. While mark recovery rates,
and certain abundance trends, suggest that large numbers and percentages of Chinook
salmon observed in these streams can be attributed to Chinook released from South Puget
Sound hatchery facilities and release sites, it is not possible to attribute all the fish
observed at spawning grounds to hatchery releases. The small numbers of unmarked
carcasses observed at South Puget Sound streams might be attributed to unmarked
hatchery fish, hatchery-origin recruits, or fish that stray from independent Puget Sound
populations. Based on the data presently available, it is difficult to account for the origin
of the unmarked fish observed in these streams. Many attributes that would prove helpful
in identifying the origin of unmarked Chinook observed in these streams, including
historic evidence indicating the abundance or presence of Chinook, current and historic
genetic information, and consistent spawning ground survey data, are lacking.
Meanwhile, hatchery records from South Puget Sound production facilities indicate that
millions to tens of millions of unmarked hatchery Chinook salmon have been released
throughout the region for at least 50 years, with mass marking of hatchery-released fish
becoming a regionwide practice as recently as 1999.
Mark recovery data from WFDW spawning ground surveys conducted between
2002 and 2006 revealed a rather large (majority) presence of hatchery markings on
Chinook salmon carcasses. Relative presence and abundance estimates generated from
spawning ground surveys indicated that the numbers of fish returning to these streams
was rather modest in comparison to both the large numbers of hatchery-released Chinook
salmon, and run reconstruction figures for South Puget Sound Chinook salmon. The
abundance of Chinook tended to be greater in streams with previous or current hatchery
releases of Chinook salmon within the same inlet (Case and Carr Inlets) versus streams
flowing into inlets that did not have records indicating extensive hatchery releases
(Hammersley Inlet). Mass marking or tagging of 100% of all future hatchery releases,
combined with consistent or increased spawning ground surveys by WDFW at the small
streams where these fish return, could prove useful in providing information on the
94
numbers and percentages of hatchery-origin Chinook salmon that return to South Puget
Sound tributary streams. Presence and abundance trends could assist policy makers in
making tough decisions about when and where to survey to effectively estimate Chinook
salmon abundance in South Puget Sound streams, given limited resources of time and
money. In the interim, given the large numbers and percentages of hatchery-marked and
tagged Chinook salmon observed in South Puget Sound streams, and the lack of
definitive evidence to discern either the origin of the unmarked carcasses or the historic
presence of Chinook salmon in these streams, it would be imprudent to suggest listing
these streams as critical habitat to aid in the recovery of the Puget Sound Chinook salmon
ESU.
95
Literature Cited
Ahmed, A., and C. Hempleman. 2006. Tributaries to Totten, Eld, and Little Skookum Inlets - Fecal coliform bacteria and temperature total maximum daily load. Water Quality Improvement Report, Publication No. 06-03-007. Washington State Department of Ecology, Environmental Assessment Program, Olympia.
Ahmed, A., and L. Sullivan. 2005. Total maximum daily load analysis for temperature in
tributaries to Oakland Bay-Hammersley Inlet: Mill Creek, Cranberry Creek, and Johns Creek. Quality Assurance Project Plan, Publication No. 05-03-107. Washington State Department of Ecology, Environmental Assessment Program, Olympia.
Allyn Salmon Enhancement Group. 2008. Allyn Community Association website. Online
at http://www.allynaca.com [accessed 13 March 2008]. Ames, J., and D.E. Phinney. 1977. 1977 Puget Sound summer-fall Chinook methodology:
escapement goals, run size forecasts, and in-season run size updates. Technical Report No. 29. Washington Department of Fisheries (WDF), Olympia.
Baranski, Chuck. 2007. District Fish Biologist, Washington Department of Fish and
Wildlife (WDFW). Personal communication. Beamer, E., Henderson, R., McBride, A., and K.W. Wolf. 2003. The importance of non-
natal pocket estuaries in Skagit Bay to wild Chinook salmon: an emerging priority for restoration. Skagit System Cooperative Research Department, LaConnor, WA.
Cousens, N.B.F., G.A. Thomas, C.G. Swann, and M.C. Healey. 1982. A review of
salmon escapement estimation techniques. Canadian Technical Report of Fisheries and Aquatic Sciences, No. 1108. Department of Fisheries and Oceans, Nanaimo, BC. 122 p.
Evans, Bill. 2007. Fish Biologist, Washington Department of Fish and Wildlife
(WDFW). Personal communication. Franklin, I. R. 1980. Evolutionary change in small populations. In: M.E. Soulé and B.A. Wilcox (editors). Conservation biology, an evolutionary-ecological perspective. Sinauer Associates, Sunderland, MA. p 135-49. Fresh, K.L., Rabin, D., Simenstad, C., Salo, E.O., Garrison, K., and L. Matheson. 1979.
Fish ecology studies in the Nisqually Reach area of Southern Puget Sound, Washington. Final Report, Fisheries Research Institute, FRI-UW-7904. University of Washington, Seattle.
Partnership Report No. 2006-06. U.S. Army Corps of Engineers, Seattle.
96
Fryer, J.L. and K.S. Pilcher. 1974. Effects of temperature on diseases of salmonid fishes. Ecological Research Series, EPA-660/3-73-202. U.S. Environmental Protection Agency (EPA), Office of Research and Development.
Fulton, L.A. 1968. Spawning areas and abundance of Chinook salmon, Oncorhynchus
tschawytscha, in the Columbia River Basin- past and present. Special Scientific Report- Fisheries, No. 57126. United States Fish and Wildlife Service (USFWS).
Good, T.P., R.S. Waples, and P. Adams (editors). 2005. Updated status of federally listed
ESUs of West Coast salmon and steelhead. U.S. Department of Commerce, NOAA Technical Memorandum NMFS-NWFSC-66. 598 p.
Hatchery Scientific Review Group (HSRG) – Lars Mobrand (chair), John Barr, Lee
Blankenship, Don Campton, Trevor Evelyn, Tom Flagg, Conrad Mahnken, Robert Piper, Paul Seidel, Lisa Seeb and Bill Smoker. April 2004. Hatchery Reform: Principles and Recommendations of the HSRG. Long Live the Kings, 1305 Fourth Avenue, Suite 810, Seattle, WA 98101 (available from www.hatcheryreform.org).
Healey, M.C. 1991. Life history of Chinook salmon (Oncorhynchus tshawytscha). In: C.
Groot and L. Margolis (editors). Pacific salmon life histories. University of British Columbia Press, Vancouver. p 311-93.
Hill, R.A. 1997. Optimizing aerial count frequency for the area-under-the-curve method
of estimating escapement. North American Journal of Fisheries Management 17(2): 461-66.
Kuttel, M. (Jr). 2002. Salmonid habitat limiting factors, Water Resource Inventory Area
14, Kennedy-Goldsborough Basin. Washington State Conservation Commission, Olympia.
Lower Columbia Fish Recovery Board. 2004. Lower Columbia salmon recovery and Fish
& Wildlife sub-basin plan. Marshall, A., C. Smith, R. Brix, W. Dammers, J. Hymer and L. LaVoy. 1995. Genetic
diversity units and major ancestral lineages for Chinook salmon in Washington. In: C.B. Busack and J.B. Shaklee (editors). Genetic diversity units and major ancestral lineages of salmonid fishes in Washington. Washington Department of Fish and Wildlife (WDFW), Fish Management Program, Resource Assessment Division, Olympia. p D1-62.
Marshall, A.R. 1999. Genetic diversity analysis of Bear Creek/Cottage Lake Creek
naturally spawning fall-run Chinook salmon. Washington Department of Fish and Wildlife (WDFW), Olympia.
97
Marshall, A.R. 2000. Genetic diversity analysis of Cottage Lake Creek/Bear Creek and Issaquah Creek naturally spawning fall-run Chinook salmon. Washington Department of Fish and Wildlife (WDFW), Olympia.
Materna, E. 2001. Issue paper 4: temperature interaction. Prepared as part of EPA Region
10 Temperature Water Quality Criteria Guidance Development Project. EPA-910-D-01-004. U.S. Environmental Protection Agency (EPA), Region 10, Seattle.
McAllister, John. 2008. Volunteer, Allyn Salmon Enhancement Group. Personal
2000. Viable salmonid populations and the recovery of evolutionary significant units. U.S. Department of Commerce, NOAA Technical Memorandum NMFS-NWFSC-42. 156 p.
McEhlany, P., and 11 coauthors. 2003. Interim report on viability criteria for Willamette
and Lower Columbia Basin Pacific salmonids. Willamette/Lower Columbia Technical Recovery Team Interim Report. National Oceanic and Atmospheric Administration (NOAA) Fisheries, Portland.
McIsaac, D.O., and T.P. Quinn. 1988. Evidence for a hereditary component in homing
behavior of Chinook salmon. Canadian Journal of Fisheries and Aquatic Sciences 45(12):2201-05.
McIsaac, D.O. 1990. Factors affecting the abundance of 1977-1979 brood wild fall
Chinook salmon (Oncorhynchus tshawytscha) in the Lewis River, Washington. Ph.D. Dissertation, University of Washington, Seattle.
Miller, R.J. and E.L. Brannon. 1982. The origin and development of life-history patterns
in Pacific Salmon. In: E.L. Brannon and E.O. Salo (editors). Proceedings of the salmon and trout migratory behavior symposium. University of Washington Press, Seattle. p 296-309.
Milner, A.M., E.E. Knudsen, C. Soiseth, A.L. Robertson, D. Schell, I.T. Phillips, and K.
Magnusson. 2000. Colonization and development of stream communities across a 200-year gradient in Glacier Bay National Park, Alaska, U.S.A. Canadian Journal of Fisheries and Aquatic Sciences 57(11):2319-35.
Grant, F.W. Waknitz, K. Neely, S.T. Lindley, and R.S. Waples. 1998. Status review of Chinook salmon from Washington, Idaho, Oregon, and California. U.S. Department of Commerce, NOAA Technical Memorandum NMFS-NWFSC-35, 443 p.
98
National Marine Fisheries Service (NMFS). 1999. Endangered and threatened species; threatened status for three chinook salmon evolutionary significant units (ESUs) in Washington and Oregon, and endangered status for one chinook salmon ESU in Washington. Federal Register 64:14308-28.
National Marine Fisheries Service (NMFS). 2003. Hatchery broodstock summaries and
assessments for chum, coho and chinook salmon and steelhead stocks within evolutionarily significant units listed under the Endangered Species Act. Salmon and Steelhead Hatchery Assessment Group (SSHAG). National Oceanic and Atmospheric Administration (NOAA) Fisheries, Northwest and Southwest Fisheries Science Centers.
National Marine Fisheries Service (NMFS). 2005a. Endangered and threatened species:
final listing determinations for 16 ESUs of west coast salmon, and final 4(d) protective regulations for threatened salmonid ESUs. Federal Register 70:37160-204.
National Marine Fisheries Service (NMFS). 2005b. Endangered and threatened species:
designation of critical habitat for 12 evolutionary significant units of west coast salmon and steelhead in Washington, Oregon, and Idaho. Federal Register 70:52630-858.
Nehlsen, W., J.E. Williams, and J.A. Lichatowich. 1991. Pacific salmon at the
crossroads: stocks at risk from California, Oregon, Idaho, and Washington. Fisheries 16(2):4-21.
Neilson, J.D., and G.H. Geen. 1981. Enumeration of spawning salmon from spawner
residence time and aerial counts. Transactions of the American Fisheries Society 110(4):554-56.
Nisqually Chinook Recovery Team. 2001. Nisqually Chinook Recovery Plan. Nisqually Indian Tribe. 2007a. 2006 preliminary Nisqually River hatchery fall Chinook
salmon forecast. Nisqually Indian Tribe. Unpublished document. Nisqually Indian Tribe. 2007b. Nisqually River Chinook salmon escapement 1986-2006.
Nisqually Indian Tribe. Unpublished document. Parken, C.K., R.E. Bailey, and J.R. Irvine. 2003. Incorporating uncertainty into area-
under-the-curve and peak count salmon escapement estimation. North American Journal of Fisheries Management 23(1): 78-90.
Perrin, C.J., and J.R. Irvine. 1990. A review of survey life estimates as they apply to the
area-under-the-curve method for estimating the spawning escapement of Pacific salmon. Canadian Technical Report of Fisheries and Aquatic Sciences, No. 1733. Department of Fisheries and Oceans, Nanaimo, BC. 29 p.
99
Phillips, Larry. 2007. Fish Biologist, Washington Department of Fish and Wildlife
(WDFW). Personal communication. Quinn, T.P. and K. Fresh. 1984. Homing and straying in Chinook salmon from Cowlitz
River Hatchery, Washington. Canadian Journal of Fisheries and Aquatic Sciences 41(7):1078-82.
Quinn, T.P. 1993. A review of homing and straying of wild and hatchery-produced
salmon. Fisheries Research 18(1-2):29-44. Quinn, T. P. 2005. The behavior and ecology of Pacific salmon & trout. University of
Washington Press, Seattle. 378 p. Regional Mark Information System Database [online database]. Updated continuously
since 1977. Portland (OR): Regional Mark Processing Center, Pacific States Marine Fisheries Commission. Online at http://www.rmpc.org.
Ricker, W.E. 1972. Hereditary and environmental factors affecting certain salmonid
populations. In: R.C. Simon and P.A. Larkin (editors). The stock concept in Pacific salmon. University of British Columbia Press, Vancouver. p 27-160.
Sands, and J.B. Scott. 2006. Independent populations of Chinook salmon in Puget Sound. U.S. Department of Commerce, NOAA Technical Memorandum NMFS-NWFSC-78, 125 p.
Schuett-Hames, D., H. Flores, and I. Child. 1996. An assessment of salmonid habitat and
water quality for streams in the Eld, Totten-Little Skookum and Hammersley Inlet-Oakland Bay Watersheds in Southern Puget Sound, Washington, 1993-1994. Squaxin Island Tribe.
Shared Strategy Development Committee. 2007. Puget Sound salmon recovery plan.
Shared Strategy for Puget Sound, Seattle. Simenstad, C.A., Fresh, K.L., and E.O. Salo. 1985. The role of Puget Sound and
Washington coastal estuaries in the life history of Pacific salmon: an unappreciated function. In V.S. Kennedy (editor). Estuarine comparisons. Academic Press, New York. p 343-63.
Smith, C.J., and P. Castle. 1994. Puget Sound Chinook salmon (Oncorhynchus
tshawytscha) escapement estimates and methods – 1991. Washington Department of Fish and Wildlife (WDFW), Olympia.
Smoker, W.A., H.M. Jensen, D.R. Johnson, and R. Robison. 1952. The Skokomish
Indian fishery. Washington Department of Fisheries (WDF), Olympia.
100
Soulé, M.E. 1980. Thresholds for survival: maintaining fitness and evolutionary
potential. In: M.E. Soulé and B.A. Wilcox (editors). Conservation Biology. Sinauer Associates, Inc., Sunderland, MA. p 151-70.
Spawning Ground Survey Database [disk]. 2007 (last update). Washington Department of
Fish and Wildlife (WDFW), Olympia. Thompson, G.G. 1991. Determining minimum viable populations under the Endangered Species Act. NOAA Technical Memorandum NMFS F/NWC-198. 78 p. United States Fish & Wildlife Service (USFWS). 1973. Endangered Species Act. United
States Department of the Interior. Waples, R.S. 1991. Pacific salmon, Oncorhymchus spp., and the definition of “species”
under the Endangered Species Act. Marine Fisheries Review 53(3): 11-21. Warren, R. 2008. Hatchery Divisions Manager, Washington Department of Fish and
Wildlife (WDFW). Personal communication. Washington Department of Fisheries (WDF). 1992. A manual for Puget Sound Chinook
spawning ground surveys. Washington Department of Fisheries (WDF), Olympia. Washington Department of Fisheries, Washington Department of Wildlife, and Western
Washington Treaty Indian Tribes (WDF, WDW, and WWTIT). 1993. 1992 Washington State salmon and steelhead stock inventory (SaSSI). WDFW, Olympia. Online at http://wdfw.wa.gov/fish/sassi/sassi.htm [accessed 10 January 2008].
Washington Department of Fish and Wildlife (WDFW). 2000. Hatchery and genetic
management plan (HGMP)- Kalama Creek Hatchery, Clear Creek Hatchery. WDFW, Olympia. Online at http://wdfw.wa.gov/hat/hgmp [accessed 17 January 2008].
Washington Department of Fish and Wildlife (WDFW). 2002. Hatchery and genetic
management plan (HGMP)- Chambers Creek Hatchery, Garrison Springs Hatchery, Tumwater Falls Hatchery, Minter Creek Hatchery. WDFW, Olympia. Online at http://wdfw.wa.gov/hat/hgmp [accessed 17 January 2008].
Washington Department of Fish and Wildlife (WDFW). 2004. 2004 future brood
document. WDFW, Olympia. Online at http://wdfw.wa.gov/hat/hgmp [accessed 12 March 2008].
Washington Department of Fish and Wildlife (WDFW). 2005. 2005 future brood
document. WDFW, Olympia. Online at http://wdfw.wa.gov/hat/hgmp [accessed 12 March 2008].
101
Washington Department of Fish and Wildlife (WDFW). 2006. 2006 future brood
document. WDFW, Olympia. Online at http://wdfw.wa.gov/hat/hgmp [accessed 12 March 2008].
Washington Department of Fish and Wildlife (WDFW). 2007a. 2007 future brood document. WDFW, Olympia. Online at http://wdfw.wa.gov/hat/hgmp [accessed 12 March 2008].
Washington Department of Fish and Wildlife (WDFW). 2007b (last update). Area-under-
the-curve for stream survey data [Computer software]. Version 2.01. WDFW, Olympia.
Washington Department of Fish and Wildlife (WDFW). 2007c. Run reconstruction
estimates for Chinook salmon in Washington State, 1987-2006. WDFW, Olympia. Unpublished document.
Washington Department of Fish and Wildlife (WDFW). 2007d. Freshwater salmon catch
estimates from catch record card information, 2003-2006. WDFW, Olympia. Unpublished document.
Washington Department of Fish and Wildlife (WDFW). 2008. Annual hatchery
escapement reports- 1980-1981 through 1999-2000. WDFW, Olympia. Online at http://wdfw.wa.gov/hat/escape/escape.htm [accessed 10 March 2008].
Whiley, A.J., and G. Walter. 2000. The review and analysis of water quality for the
Nisqually River and the major lakes of the Nisqually Basin. Technical Report No. 6. Nisqually Indian Tribe, Natural Resources Water Quality Program, Olympia.
Williams, J.R., H.E. Pearson, and J.D. Wilson. 1985a. Streamflow statistics and drainage-
basin characteristics for the Puget Sound Region, Washington: volume 1, Western and Southern Puget Sound. U.S. Geological Survey, Tacoma.
Williams, J.R., H.E. Pearson, and J.D. Wilson. 1985b. Streamflow statistics and drainage-
basin characteristics for the Puget Sound Region, Washington: volume 2, Eastern Puget Sound from Seattle to the Canadian Border. U.S. Geological Survey, Tacoma.
Williams, J.R., and S.A. Riis. 1989. Miscellaneous streamflow measurements in the State
of Washington, January 1961 to September 1985. U.S. Geological Survey, Tacoma.
Williams, R.W., R.M. Laramie, and J.J. Ames. 1975. A catalog of Washington streams and salmon utilization: volume 1, Puget Sound Region. Washington Department of Fisheries (WDF), Seattle.
102
Table A-1. Hatchery Chinook salmon brood year releases in the Nisqually Basin (WRIA 11), 1952-2004.
Kalama Creek PercentagesCWT & CWT, no No Total CWT & CWT, no No
Brood Year AD Clipped AD Clipped AD Clipped AD Clipped released AD Clipped AD Clipped AD Clipped AD Clipped1997 0 0 0 553,000 553,000 0.00% 0.00% 0.00% 100.00%1998 94,723 0 7,239 945,080 1,047,042 9.05% 0.00% 0.69% 90.26%1999 88,949 0 1,000,432 0 1,089,381 8.17% 0.00% 91.83% 0.00%2000 83,178 3,655 471,237 9,529 567,599 14.65% 0.64% 83.02% 1.68%2001 82,860 6,951 532,428 11,274 633,513 13.08% 1.10% 84.04% 1.78%2002 95,101 1,758 536,298 16,734 649,891 14.63% 0.27% 82.52% 2.57%2003 96,131 342 528,737 1,790 627,000 15.33% 0.05% 84.33% 0.29%2004 56,177 2,859 423,498 18,926 501,460 11.20% 0.57% 84.45% 3.77%
McAllister Creek PercentagesCWT & CWT, no No Total CWT & CWT, no No
Brood Year AD Clipped AD Clipped AD Clipped AD Clipped released AD Clipped AD Clipped AD Clipped AD Clipped1997 397,306 8,053 1,563 1,195,643 1,602,565 24.79% 0.50% 0.10% 74.61%1998 79,782 873 1,350,401 57,694 1,488,750 5.36% 0.06% 90.71% 3.88%1999 0 0 1,166,421 60,079 1,226,500 0.00% 0.00% 95.10% 4.90%2000 240,320 0 1,211,151 50,441 1,501,912 16.00% 0.00% 80.64% 3.36%2001 0 0 1,345,216 26,536 1,371,752 0.00% 0.00% 98.07% 1.93%
Source: RMIS Database, 2008.
113
Table A-7. Adipose mark and CWT rates for hatchery Chinook salmon brood year releases in the Tacoma Basin, 1997-2003.
Chambers Creek PercentagesCWT & CWT, no No Total CWT & CWT, no No
Brood Year AD Clipped AD Clipped AD Clipped AD Clipped released AD Clipped AD Clipped AD Clipped AD Clipped1997 92,884 1,910 697 1,004,020 1,099,511 8.45% 0.17% 0.06% 91.32%1998 0 0 913,616 510,270 1,423,886 0.00% 0.00% 64.16% 35.84%1999 0 0 827,808 33,359 861,167 0.00% 0.00% 96.13% 3.87%2000 0 0 405,128 284,716 689,844 0.00% 0.00% 58.73% 41.27%2001 0 0 919,672 167,658 1,087,330 0.00% 0.00% 84.58% 15.42%2002 262,038 3,348 781,880 29,528 1,076,794 24.34% 0.31% 72.61% 2.74%2003 404,162 24,429 710,212 61,494 1,200,297 33.67% 2.04% 59.17% 5.12%2004 436,675 7,733 728,162 26,425 1,198,995 36.42% 0.64% 60.73% 2.20%
Steilacoom Lake (Pier) PercentagesCWT & CWT, no No Total CWT & CWT, no No
Brood Year AD Clipped AD Clipped AD Clipped AD Clipped released AD Clipped AD Clipped AD Clipped AD Clipped1998 0 0 76,500 0 76,500 0.00% 0.00% 100.00% 0.00%1999 0 0 249,717 4,611 254,328 0.00% 0.00% 98.19% 1.81%2000 0 0 214,108 9,387 223,495 0.00% 0.00% 95.80% 4.20%2001 0 0 184,768 248,500 433,268 0.00% 0.00% 42.65% 57.35%
Steilacoom Lake PercentagesCWT & CWT, no No Total CWT & CWT, no No
Brood Year AD Clipped AD Clipped AD Clipped AD Clipped released AD Clipped AD Clipped AD Clipped AD Clipped2001 0 0 1,125,699 46,904 1,172,603 0.00% 0.00% 96.00% 4.00%
Source: RMIS Database, 2008.
114
Table A-8. Adipose mark and CWT rates for hatchery Chinook salmon brood year releases in the Deschutes Basin, 1997-2003. Capitol Lake Percentages
CWT & CWT, no No Total CWT & CWT, no No Brood Year AD Clipped AD Clipped AD Clipped AD Clipped released AD Clipped AD Clipped AD Clipped AD Clipped
Deschutes River PercentagesCWT & CWT, no No Total CWT & CWT, no No
Brood Year AD Clipped AD Clipped AD Clipped AD Clipped released AD Clipped AD Clipped AD Clipped AD Clipped1997 0 0 0 1,006,125 1,006,125 0.00% 0.00% 0.00% 100.00%1998 0 0 679,131 12,699 691,830 0.00% 0.00% 98.16% 1.84%1999 0 0 3,869,190 54,937 3,924,127 0.00% 0.00% 98.60% 1.40%2000 0 10,044 0 0 10,044 0.00% 100.00% 0.00% 0.00%2001 0 0 84,150 0 84,150 0.00% 0.00% 100.00% 0.00%2002 266,087 18,430 3,068,106 85,901 3,438,524 7.74% 0.54% 89.23% 2.50%2003 257,134 10,224 2,562,081 153,697 2,983,136 8.62% 0.34% 85.89% 5.15%2004 272,010 2,175 3,334,766 123,904 3,732,855 7.29% 0.06% 89.34% 3.32%
Deschutes River PercentagesCWT & CWT, no No Total CWT & CWT, no No
Brood Year AD Clipped AD Clipped AD Clipped AD Clipped released AD Clipped AD Clipped AD Clipped AD Clipped1997 0 0 54,000 54,000 0.00% 0.00% 0.00% 100.00%1998 75,498 329 112,574 489 188,890 39.97% 0.17% 59.60% 0.26%
McLane Creek PercentagesCWT & CWT, no No Total CWT & CWT, no No
Brood Year AD Clipped AD Clipped AD Clipped AD Clipped released AD Clipped AD Clipped AD Clipped AD Clipped1997 10,800 0 1,200 0 12,000 90.00% 0.00% 10.00% 0.00%
Source: RMIS Database, 2008.
115
Table A-9. Adipose mark and CWT rates for hatchery Chinook salmon brood year releases in the Shelton Basin, 1997-2003.
Sherwood Creek PercentagesCWT & CWT, no No Total CWT & CWT, no No
Brood Year AD Clipped AD Clipped AD Clipped AD Clipped released AD Clipped AD Clipped AD Clipped AD Clipped2002 0 0 0 10,000 10,000 0.00% 0.00% 0.00% 100.00%
South Sound Net Pens PercentagesCWT & CWT, no No Total CWT & CWT, no No
Brood Year AD Clipped AD Clipped AD Clipped AD Clipped released AD Clipped AD Clipped AD Clipped AD Clipped1997 126,032 0 253 23,665 149,950 84.05% 0.00% 0.17% 15.78%1998 0 0 157,290 3,210 160,500 0.00% 0.00% 98.00% 2.00%
Source: RMIS Database, 2008.
116
Table A-10. Adipose mark and CWT rates for hatchery Chinook salmon brood year releases in the Kitsap Basin, 1997-2003.
Coulter Creek PercentagesCWT & CWT, no No Total CWT & CWT, no No
Brood Year AD Clipped AD Clipped AD Clipped AD Clipped released AD Clipped AD Clipped AD Clipped AD Clipped1997 0 0 0 1,337,000 1,337,000 0.00% 0.00% 0.00% 100.00%1998 0 0 1,269,229 24,771 1,294,000 0.00% 0.00% 98.09% 1.91%1999 0 0 947,237 42,033 989,270 0.00% 0.00% 95.75% 4.25%2000 0 0 819,428 14,272 833,700 0.00% 0.00% 98.29% 1.71%
Fox Island Net Pens PercentagesCWT & CWT, no No Total CWT & CWT, no No
Brood Year AD Clipped AD Clipped AD Clipped AD Clipped released AD Clipped AD Clipped AD Clipped AD Clipped1997 239,089 4,336 0 0 243,425 98.22% 1.78% 0.00% 0.00%1998 0 0 249,395 1,815 251,210 0.00% 0.00% 99.28% 0.72%1999 0 0 213,967 14,783 228,750 0.00% 0.00% 93.54% 6.46%
Minter Creek PercentagesCWT & CWT, no No Total CWT & CWT, no No
Brood Year AD Clipped AD Clipped AD Clipped AD Clipped released AD Clipped AD Clipped AD Clipped AD Clipped1997 13,496 302 1,302 2,069,000 2,084,100 0.65% 0.01% 0.06% 99.28%1998 0 0 2,038,625 53,123 2,091,748 0.00% 0.00% 97.46% 2.54%1999 0 0 1,899,839 76,211 1,976,050 0.00% 0.00% 96.14% 3.86%2000 0 0 2,058,887 55,063 2,113,950 0.00% 0.00% 97.40% 2.60%2001 0 0 1,888,842 3,658 1,892,500 0.00% 0.00% 99.81% 0.19%2002 192,690 2,407 1,663,142 18,436 1,876,675 10.27% 0.13% 88.62% 0.98%2003 196,942 810 1,510,924 6,049 1,714,725 11.49% 0.05% 88.11% 0.35%2004 199,863 1,395 1,665,863 2,502 1,869,623 10.69% 0.07% 89.10% 0.13%
Source: RMIS Database, 2008.
117
Table A-11. Nisqually River fall Chinook salmon run reconstruction, 1986-2006.
No data for sports catch but Nisqually harvest management biologist, Craig Smith, estimates 1,000- 1,500 for 2003-2006. Data for hatchery jacks excluded. Source: Nisqually Indian Tribe, 2007b.
118
Table A-12. Mean monthly stream flow averages (cubic feet per second) for miscellaneous South Puget Sound streams and three fall Chinook salmon systems (Lower Skagit, Snohomish, and Nisqually Rivers).
River/Creek Jan. Feb. Mar. Apr. May Jun. Jul. Aug. Sep. Oct. Nov. Dec. Huge Creek 24 22 16 10 7.4 6.0 5.0 4.6 4.6 5.6 10 18
* Data includes a gap of more than 14 days between surveys ** Data includes a first or last survey with a live count of 60 or greater ^ Data does not include a survey prior to September 25 NC- AUC not calculated because less than four surveys conducted. NS- No surveys conducted for that year.
* Data includes a gap of more than 14 days between surveys ** Data includes a first or last survey with a live count of 60 or greater ^ Data does not include a survey prior to September 25 NC- AUC not calculated because less than four surveys conducted. NS- No surveys conducted for that year.
133
Table C-4. South Puget Sound Chinook salmon run reconstruction, 1987-2006.
Run Year 1987 1988 1989 1990 1991 1992 1993 1994 1995 1996
Table D-4. Case Inlet streams revised mark recovery data, 2002-2006. Creek Year Number of Adipose marked, Adipose unmarked, Adipose marked, Adipose unmarked,
carcasses sampled CWT CWT no CWT no CWTSherwood 2002 4 0 0 1 3
Table D-6. Releases of eyed Chinook salmon eggs in Sherwood Creek by the Sherwood Creek Cooperative and Allyn Salmon Enhancement Group, brood years 1990-2003.