38
The External Environment for Developing Countries December 2008 The World Bank Development Economics Prospects Group
| Date post: | 22-Dec-2015 |
| Category: |
Documents |
| Upload: | osborn-stokes |
| View: | 218 times |
| Download: | 1 times |
The External Environment for Developing Countries
December 2008The World Bank
Development EconomicsProspects Group

A deep synchronous downturn for OECD countries in fourth quarter... growth GDP growth **, percentage
change, q/q saar
-6
-4
-2
0
2
4
2008-Q1 2008-Q2 2008-Q3 2008-Q4E
Source: World Bank and National Agencies ** Q4 JPMorgan.
Japan
Euro Area
United States

-10
-5
0
5
10
15
20
25
30
Jan-07 May-07 Sep-07 Jan-08 May-08 Sep-08
...with developing-country production now in decline, led by China
industrial production percentage change, saar
Source: World Bank data.
China
Developing excl China
Developing

Industrial countries

0.9
2.8
-0.5
-4
-3
-2
-1
0
1
2
3
4
5
Q1-2008 Q2-2008 Q3-2008
Source: Department of Commerce and DECPG calculations.
U.S. Q3-GDP drops 0.5% on massiveretrenchment by the consumer
growth of real GDP, and contributions to growth in percentage points

Key indicators point to deepU.S. recession in fourth quarter
retail sales, mfgr IP % saar [L], change in employment [R]
-20
-15
-10
-5
0
5
10
Jan-07 Apr-07 Jul-07 Oct-07 Jan-08 Apr-08 Jul-08 Oct-08
-500
-400
-300
-200
-100
0
100
200
Source: Departments of Commerce and Labor; Federal Reserve.
Industrial production [L]
Retail sales [L]
Change in non-farm employment (3mma, ‘000) [R]

0
1
2
3
4
5
6
Aug-07 Nov-07 Feb-08 May-08 Aug-08 Nov-08
Source: Thomson/Datastream.
Fed cuts Funds target to 0.0-to 0.25% with heavy “flight to quality” underway
Fed Funds target- and effective rates; T-
note- 2yr, T-note 10 yr
Fed Funds Target
LIBOR 3 months
T-note 10-year
T-note 2-yr

2.4
-3.7
-1.8
-5
-4
-3
-2
-1
0
1
2
3
4
Q1-2008 Q2-2008 Q3-2008
Source: Japan Cabinet Office and DECPG calculations.
Japan GDP drops 1.8% in Q3 oncontinuing negative trade outcomes
growth of real GDP, and contributions to growth in percentage points
ConsumptionGovernmentInvestment
Stocks Net Exports
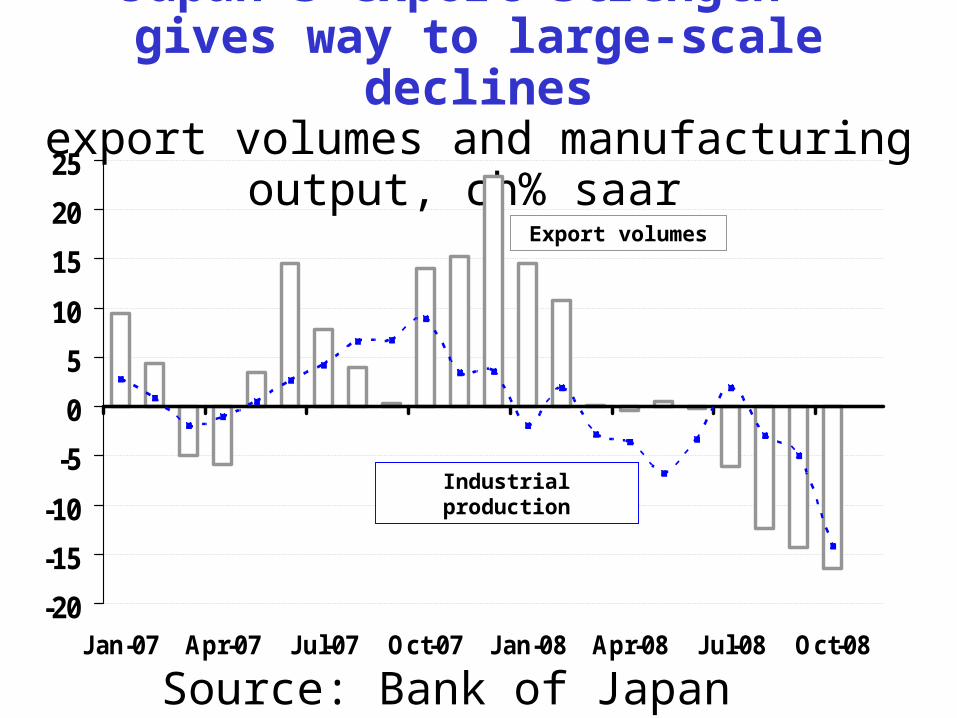
Japan’s export strength gives way to large-scale declines
export volumes and manufacturing output, ch% saar
-20
-15
-10
-5
0
5
10
15
20
25
Jan-07 Apr-07 Jul-07 Oct-07 Jan-08 Apr-08 Jul-08 Oct-08
Source: Bank of Japan and Japan Cabinet Office.
Industrial production
Export volumes
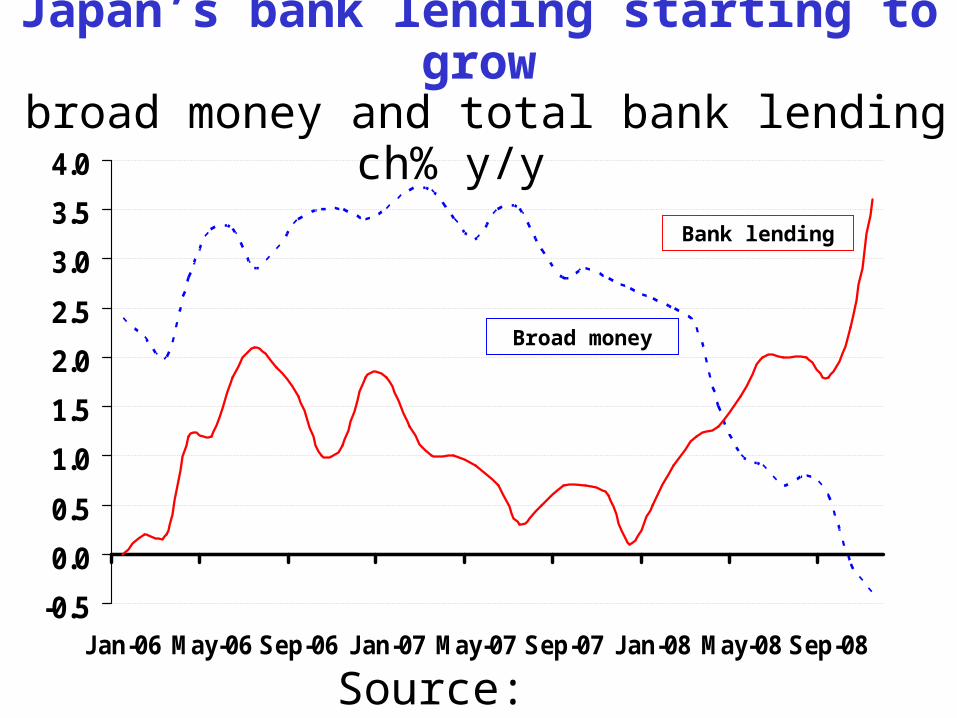
Japan’s bank lending starting to grow broad money and total bank lending ch
% y/y
-0.5
0.0
0.5
1.0
1.5
2.0
2.5
3.0
3.5
4.0
Jan-06 May-06 Sep-06 Jan-07 May-07 Sep-07 Jan-08 May-08 Sep-08
Source: Bank of Japan.
Bank lending
Broad money

2.7
-0.7 -0.8
-3
-2
-1
0
1
2
3
4
Q1-2008 Q2-2008 Q3-2008
Source: Eurostat and DECPG calculations.
Net exports pull Euro Area GDPfurther into recession in 3rd quarter
growth of real GDP, and contributions to growth in percentage points
Change in stocks GovernmentConsumptionInvestment Net Exports

German exports now in decline following sharp falloff in foreign orders
export volume ch% 3mma y/y [L] and
export orders, ch% saar [R]
-2.5
0.0
2.5
5.0
7.5
10.0
12.5
Jan-07 Apr-07 Jul-07 Oct-07 Jan-08 Apr-08 Jul-08 Oct-08-35
-28
-21
-14
-7
0
7
14
21
28
35
Source: Bundesbank-- Thomson/Datastream.
Export volume [L]
Export orders [R]

Inflation– an eventual “silver lining” for Europe?
HICP total ch% y/y [L], HICP-energy, ch% y/y [R]
0
1
2
3
4
Jan-06 May-06 Sep-06 Jan-07 May-07 Sep-07 Jan-08 May-08 Sep-08
-5
0
5
10
15
20
Source: Eurostat through Thomson/Datastream.
HICP-Total [L]
HICP-Energy [R]

Industrial production

Downturn in IP across OECD to dateas pronounced as in 2001 recession
industrial production, ch% (3m/3m saar)
-20
-16
-12
-8
-4
0
4
8
12
16
Jan-01 Jan-02 Jan-03 Jan-04 Jan-05 Jan-06 Jan-07 Jan-08
Source: Thomson/Datastream, DECPG.
USA
Eurozone
Japan
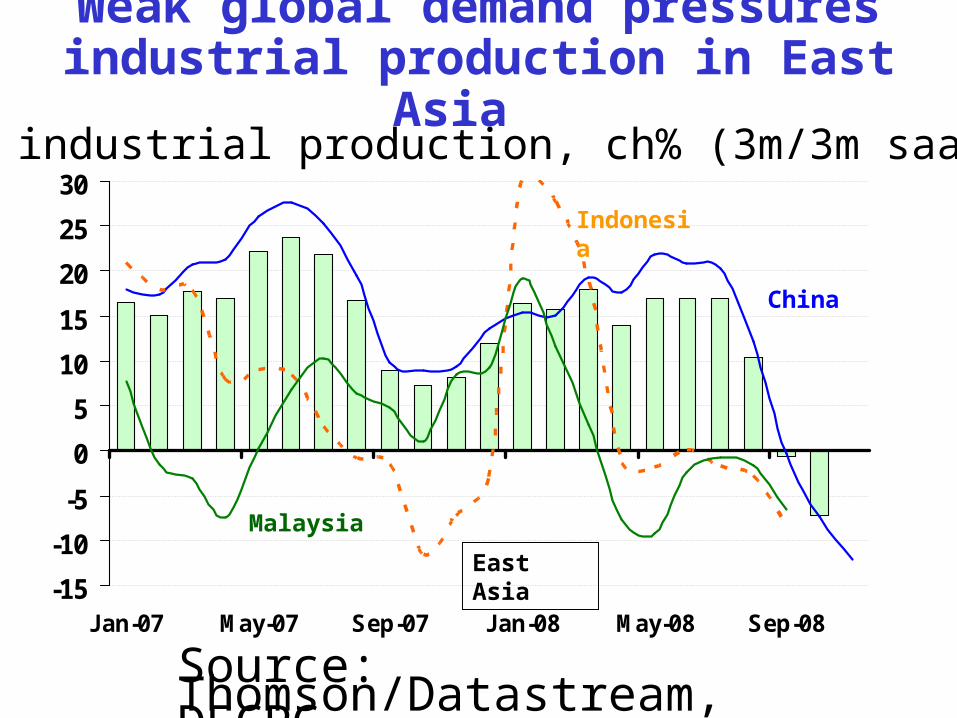
Weak global demand pressuresindustrial production in East Asia
-15
-10
-5
0
5
10
15
20
25
30
Jan-07 May-07 Sep-07 Jan-08 May-08 Sep-08
Source: Thomson/Datastream, DECPG.
East Asia
China
industrial production, ch% (3m/3m saar)
Indonesia
Malaysia
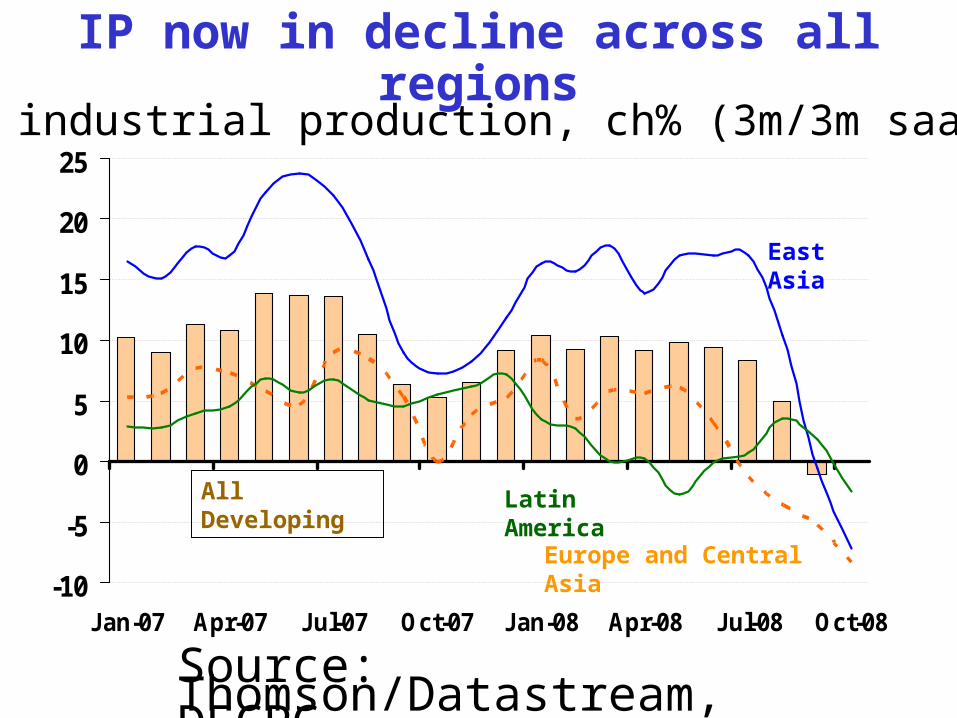
IP now in decline across all regions
-10
-5
0
5
10
15
20
25
Jan-07 Apr-07 Jul-07 Oct-07 Jan-08 Apr-08 Jul-08 Oct-08
Source: Thomson/Datastream, DECPG.
All Developing
East Asia
industrial production, ch% (3m/3m saar)
Europe and Central Asia
Latin America

International trade

Key OECD imports compress as domestic demand falters
import volume: U.S, Japan, Germany and U.K. ch% 3mma y/y
-5.0
-2.5
0.0
2.5
5.0
7.5
10.0
Jan-07 Apr-07 Jul-07 Oct-07 Jan-08 Apr-08 Jul-08 Oct-08
Source: National Agencies through Thomson/Datastream.
United States
Japan
Germany
U.K.
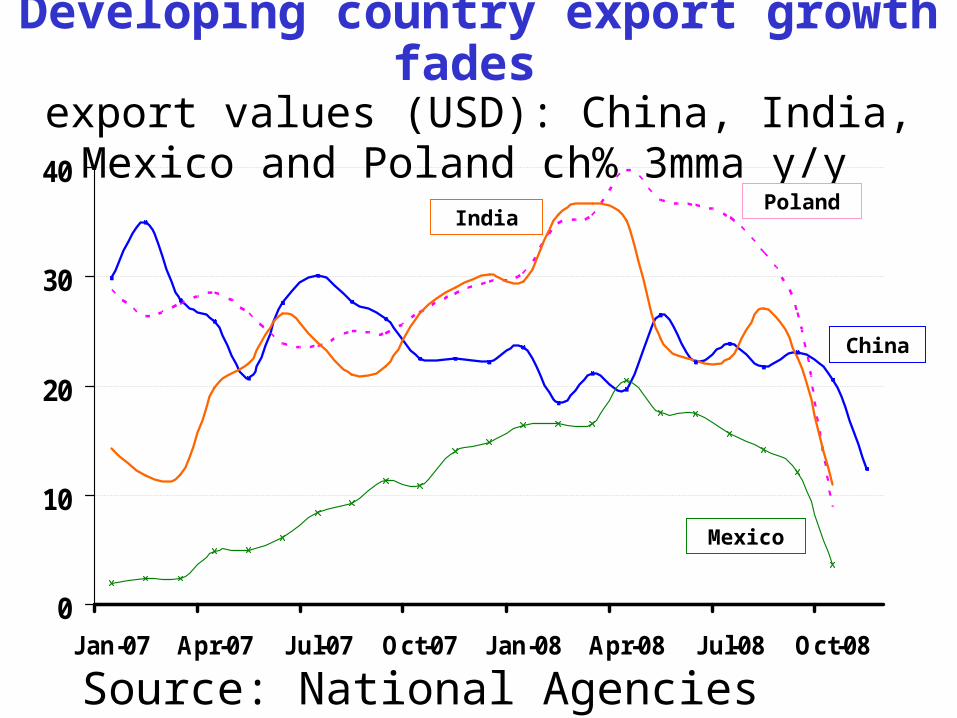
Developing country export growth fades export values (USD): China, India, Mexico
and Poland ch% 3mma y/y
0
10
20
30
40
Jan-07 Apr-07 Jul-07 Oct-07 Jan-08 Apr-08 Jul-08 Oct-08
Source: National Agencies through Thomson/Datastream.
China
PolandIndia
Mexico

-250
-200
-150
-100
-50
0
50
100
Q1-2007 Q2-2007 Q3-2007 Q4-2007 Q1-2008 Q2-2008 Q3-2008
Source: Department of Commerce.
U.S. current balance improves slightlyin third quarter on better balance on non-
oil trade
Income
Services
Non-oilBOT
Oil balance
Transfers
Current account

Oil prices

Crude oil prices plunge back to 2004 levels on falling demand
20
40
60
80
100
120
140
160
Jan-04Jan-05
Jan-06Jan-07
Jan-08
$/bbl
World Bank Average
Source: Datastream and DECPG Commodities Group.
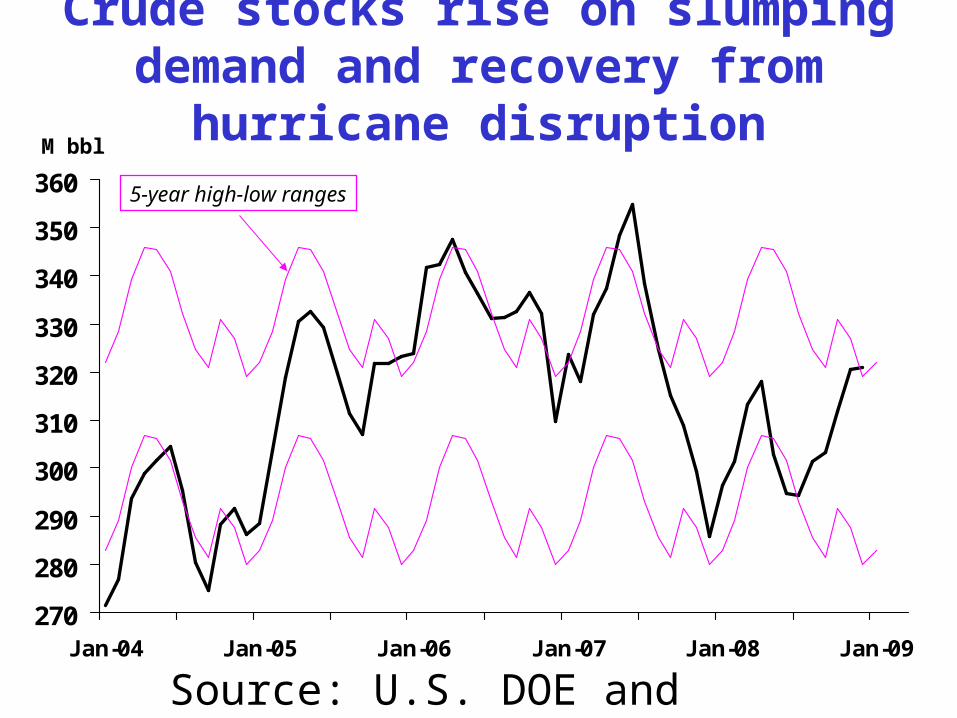
Crude stocks rise on slumping demand and recovery from hurricane disruption
270
280
290
300
310
320
330
340
350
360
Jan-04 Jan-05 Jan-06 Jan-07 Jan-08 Jan-09
M bbl
5-year high-low ranges
Source: U.S. DOE and DECPG Commodities Group.

WTI Futures Prices - NYMEX
40
50
60
70
80
90
100
110
120
Dec-07 Dec-08 Dec-09 Dec-10 Dec-11 Dec-12 Dec-13
Dec 15
$/bbl
Monthly contract prices to Dec 2013* on select dates in 2008
Oct 31
Sep 30
Aug 29
Dec 5
Source: NYMEX and DECPG Commodities Group.

Non-oil commodity prices

100
150
200
250
300
350
Jan-05 Jan-06 Jan-07 Jan-08 Jan-09
Grains
Fats & Oils
Other Food
Agriculture prices plummet on weak demand, falling oil costs and better
supply prospectsIndex 2000=100
Source: Datastream and DECPG Commodities Group.

Metals prices plunge on sharp decline in demand
2,000
3,000
4,000
5,000
6,000
7,000
8,000
9,000
Jan-05Jan-06
Jan-07Jan-08
5,000
10,000
15,000
20,000
25,000
30,000
35,000
40,000
45,000
50,000
55,000
Cu $/ton Ni $/ton
Copper
Nickel
Source: LME and DECPG Commodities Group.

Ocean freight rates sink on lack of demand and credit concerns
0
2,000
4,000
6,000
8,000
10,000
12,000
Jan-05 Jan-06 Jan-07 Jan-08
Baltic dry freight index
Source: Datastream and DECPG Commodities Group.

International Finance

Capital flows come to an effectivehalt over October and November
Source: DECPG Finance Team.
Gross capital flows to emerging markets
$ billion
H1 Q3 Total H1 Q3 Oct Nov YTD
Total 349 163 652 249 70 18 9 346
Bonds 107 20 146 58 9 0 0 67
Banks 156 101 312 146 60 18 9 232
Equity 86 42 194 45 2 0 0 47
Lat. America 69 54 156 57 13 3 1 73
Bonds 31 6 45 17 1 0 0 18
E. Europe 156 45 247 101 34 12 4 153
Bonds 50 5 64 32 8 0 0 40
Asia 93 47 188 64 14 2 2 81
Bonds 18 5 23 7 0.4 0 0 7
Others 31 16 61 27 9 1 2 39
2007 2008
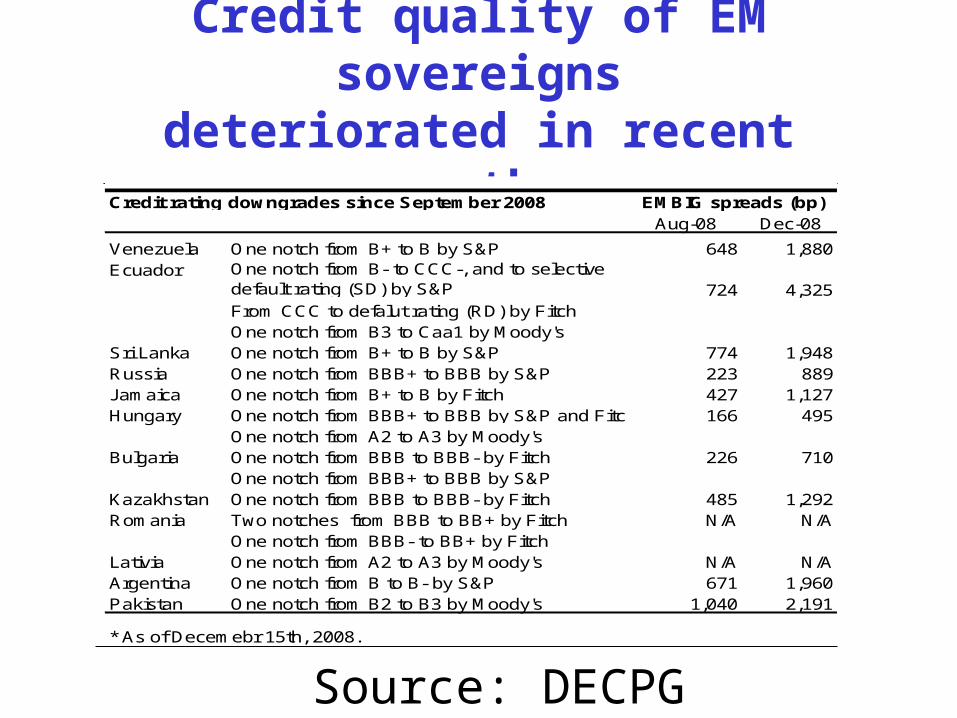
Credit quality of EM sovereignsdeteriorated in recent months
Source: DECPG Finance Team.
Credit rating downgrades since September 2008Aug-08 Dec-08
Venezuela One notch from B+ to B by S&P 648 1,880Ecuador One notch from B- to CCC-, and to selective
default rating (SD) by S&P 724 4,325From CCC to defalut rating (RD) by FitchOne notch from B3 to Caa1 by Moody's
Sri Lanka One notch from B+ to B by S&P 774 1,948Russia One notch from BBB+ to BBB by S&P 223 889Jamaica One notch from B+ to B by Fitch 427 1,127Hungary One notch from BBB+ to BBB by S&P and Fitch 166 495
One notch from A2 to A3 by Moody'sBulgaria One notch from BBB to BBB- by Fitch 226 710
One notch from BBB+ to BBB by S&P Kazakhstan One notch from BBB to BBB- by Fitch 485 1,292Romania Two notches from BBB to BB+ by Fitch N/A N/A
One notch from BBB- to BB+ by FitchLativia One notch from A2 to A3 by Moody's N/A N/AArgentina One notch from B to B- by S&P 671 1,960Pakistan One notch from B2 to B3 by Moody's 1,040 2,191
* As of Decemebr 15th, 2008.
EMBIG spreads (bp)
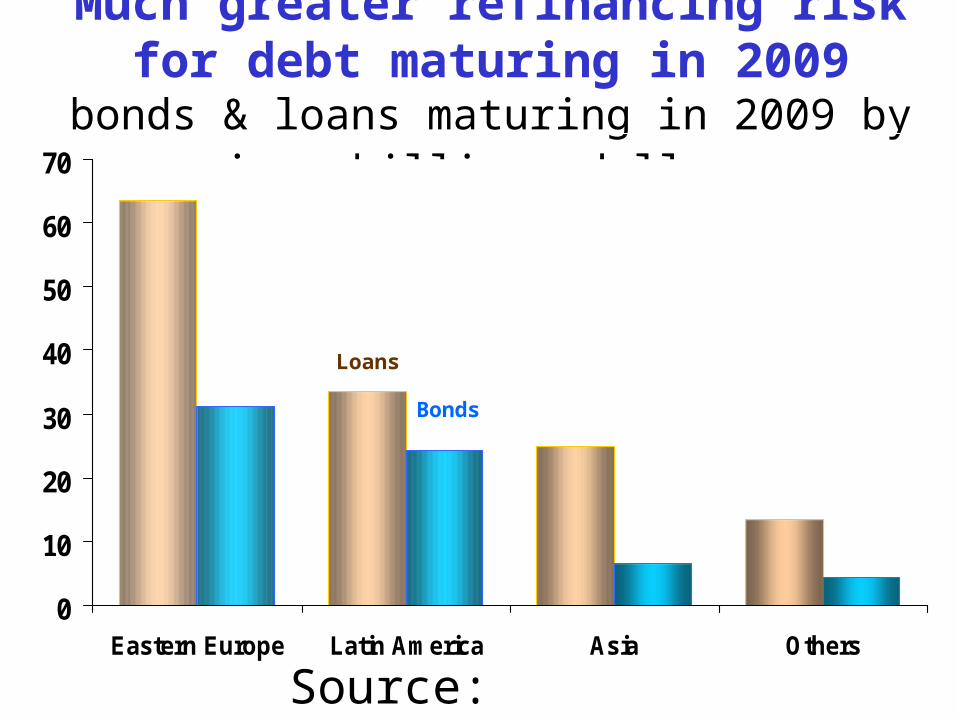
Much greater refinancing risk for debt maturing in 2009
bonds & loans maturing in 2009 by region, billions dollars
0
10
20
30
40
50
60
70
Eastern Europe Latin America Asia Others
Source: Bondware/Loanware.
Loans
Bonds

Currencies

1.230
1.270
1.310
1.350
1.390
1.430
1.470
1.510
1.550
1.590
1.630
Jan-08 Mar-08 May-08 Jul-08 Sep-08 Nov-08
86
90
94
98
102
106
110
Source: Thomson/Datastream.
yen/USD
USD/Euro (inverse)
Dollar plummets since early December to reverse earlier gains
USD per Euro (inverse) [Left] and Yen per USD [right]
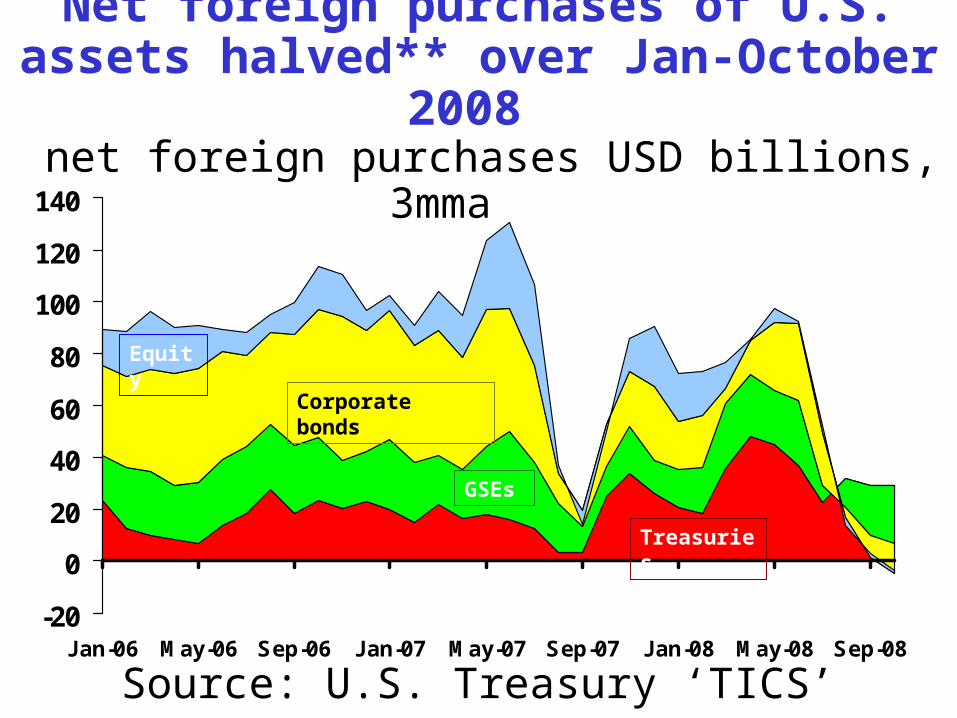
Net foreign purchases of U.S. assets halved** over Jan-October 2008
net foreign purchases USD billions, 3mma
-20
0
20
40
60
80
100
120
140
Jan-06 May-06 Sep-06 Jan-07 May-07 Sep-07 Jan-08 May-08 Sep-08
Treasuries
Source: U.S. Treasury ‘TICS’ database. ** Jan-Oct08 vs Jan-Oct07
GSEs
Corporate bonds
Equity

80
90
100
110
120
130
140
150
160
Jan-08 Mar-08 May-08 Jul-08 Sep-08 Nov-08
Source: Thomson/Datastream.
Dollar surges... then retreats against EM currencies
LCU per USD indexes, Jan1 2008=100 [*increase = weaker LCU]
Turkish lira
Brazilian real
Indonesian rupiah
Korean won
Russian rouble

The External Environment for Developing Countries
December 2008The World Bank
Development EconomicsProspects Group


