The External Impact of China’s Exchange Rate Policy: Evidence from Firm Level Data Barry Eichengreen and Hui Tong 1 July 2011 Abstract We examine the impact of renminbi revaluation on foreign firm valuations, considering two surprise announcements of changes in China’s exchange rate policy in 2005 and 2010 and employing data on some 6,000 firms in 44 economies. Stock returns rise with renminbi revaluation expectations. This reaction appears to reflect a combination of improvements in general market sentiment and specific trade effects. Expected renminbi appreciation has a positive effect on firms exporting to China but a negative impact on those providing inputs for the country’s processing exports. Stock prices rise for firms competing with China in their home market but fall for firms importing Chinese products with large imported-input content. There is also some evidence that expected renminbi appreciation reduces the valuation of financially- constrained firms, presumably because appreciation implies reduced Chinese purchases of foreign securities. The results carry over when we consider ten instances of market-perceived changes in prospective Chinese currency policy. 1 Contact Information: Barry Eichengreen, Economics Department, University of California at Berkeley, Berkeley, CA 94720, email: [email protected]; Hui Tong, Research Department, International Monetary Fund, 700 19th St. NW, Washington, D.C. 20431, e-mail: [email protected]. We thank Rudolfs Bems, Olivier Blanchard, Nigel Chalk, Roberto Chang, Stijn Claessens, Charles Engel, Kristin Forbes, Jeffery Frankel, Marcel Fratzscher, Takatoshi Ito, Andrei Levchenko, Shang-Jin Wei, and seminar participants at the IMF, the ECB, the 2011 Econometrics Society Winter Meeting, and the NBER IFM 2011 Spring Meeting for helpful comments and Mohsan Bilal for excellent research assistance. The views in the paper are those of the authors and do not necessarily reflect those of the IMF.
Transcript
The External Impact of China’s Exchange Rate Policy: Evidence from Firm Level Data
Barry Eichengreen and Hui Tong1
July 2011
Abstract
We examine the impact of renminbi revaluation on foreign firm valuations, considering two
surprise announcements of changes in China’s exchange rate policy in 2005 and 2010 and
employing data on some 6,000 firms in 44 economies. Stock returns rise with renminbi
revaluation expectations. This reaction appears to reflect a combination of improvements in
general market sentiment and specific trade effects. Expected renminbi appreciation has a
positive effect on firms exporting to China but a negative impact on those providing inputs for
the country’s processing exports. Stock prices rise for firms competing with China in their home
market but fall for firms importing Chinese products with large imported-input content. There is
also some evidence that expected renminbi appreciation reduces the valuation of financially-
constrained firms, presumably because appreciation implies reduced Chinese purchases of
foreign securities. The results carry over when we consider ten instances of market-perceived
changes in prospective Chinese currency policy.
1 Contact Information: Barry Eichengreen, Economics Department, University of California at Berkeley, Berkeley, CA 94720, email: [email protected]; Hui Tong, Research Department, International Monetary Fund, 700 19th St. NW, Washington, D.C. 20431, e-mail: [email protected]. We thank Rudolfs Bems, Olivier Blanchard, Nigel Chalk, Roberto Chang, Stijn Claessens, Charles Engel, Kristin Forbes, Jeffery Frankel, Marcel Fratzscher, Takatoshi Ito, Andrei Levchenko, Shang-Jin Wei, and seminar participants at the IMF, the ECB, the 2011 Econometrics Society Winter Meeting, and the NBER IFM 2011 Spring Meeting for helpful comments and Mohsan Bilal for excellent research assistance. The views in the paper are those of the authors and do not necessarily reflect those of the IMF.
2
1. Introduction
The effects of China’s exchange rate are a prominent topic in both policy debate and
analytical discussion. In policy circles, the questions include whether China should allow its
currency to appreciate to encourage global rebalancing – that is, to shift the composition of
activity away from exports and facilitate the efforts of deficit countries like the United States to
export more.2 They include whether a change in Chinese currency policy would have a
significant impact on growth of U.S. output and employment.3
In analytical discussions, the questions include how a change in Chinese exchange rate
policy would affect different sectors and activities in other countries. China exports a wide range
of final goods. Foreign firms competing with Chinese exporters of these products should
therefore feel positive effects from a change in policy that signals greater Chinese willingness to
allow the renminbi to appreciate. Similarly, China is increasingly important as a source of parts
and components for manufacturing in other countries. Firms relying on these inputs will
therefore be adversely affected by renminbi appreciation that makes those inputs more
expensive. Some investigators focusing on the United States conclude that this channel has
grown to the point where the impact of renminbi appreciation on U.S. firms would be negative
on balance.4
Foreign producers exporting final goods to China, for their part, would benefit from
renminbi appreciation that increases the purchasing power of Chinese firms and households.
Insofar as currency appreciation is accompanied by other measures designed to stimulate
domestic spending, the benefit to countries exporting final goods to China would be greater still.
China is also a source of demand for parts and components produced in Asia and elsewhere.5
While renminbi appreciation would increase China’s command over these products, it might also
2 For competing perspectives, see Eichengreen (2007), Dooley et al. (2009), Hanson and Robertson (2010), and Blanchard and Milesi-Ferretti (2011). 3 For competing perspectives see Scott (2010) and Evenett and Francois (2010). 4 As documented in the U.S. case by Evenett and Francois (2010) and, in more detail, by Francois (2010). 5 Based on Chinese trade statistics, 45.7 per cent of China’s imports in 2006 were used for so-called processing exports (35.7 per cent being intermediate inputs and 10 per cent being capital-goods imports).
3
signal a shift away from the export-oriented assembly operations that have been a source of this
demand.6
Finally, China is an important purchaser of foreign assets and an influence on foreign
financial conditions. Its purchases of U.S. treasury securities are a concomitant of its exchange
rate regime; they are required to prevent the renminbi from rising more rapidly against the dollar.
Greater willingness to allow the renminbi to rise might imply fewer Chinese purchases and, in
turn, higher foreign yields (e.g. Bernanke 2005, Bernanke et al 2011). This could affect the cost
of funding for foreign corporations insofar as that cost is linked to conditions in treasury markets.
Foreign firms that depend most on external finance would presumably be hit hardest.
These effects could then be tempered or reinforced by the foreign response to changes in
China’s currency policy. Indications that China is prepared to allow its currency to appreciate
would reduce the risk of trade sanctions by countries that have strongly advocated renminbi
revaluation, positively affecting foreign firms that benefit from trade with the country. The
currencies of other emerging markets might appreciate along with the renminbi, something that
would have further implications for foreign firms and their competitors.7
In this paper we test for the importance of these channels through which a change in
Chinese exchange rate policy potentially impacts firms in other countries. We ask how
announcements by the People’s Bank of China (PBOC) on July 21st, 2005 and June 19th, 2010,
both of which gave rise to greater expectations of currency appreciation, affected the market
valuation of foreign firms. These two events were driven more by political factors than
concurrent macroeconomic news in China, with the timing and the extent being a surprise to the
6 Garcia-Herrero and Koivu (2008) estimate that a ten per cent rise in the renminbi would reduce China’s imports of components by as much as 6 per cent. Ahmed (2009) also find that renminbi appreciation could cause both China’s processing and non-processing exports to go down, by examining the latest data till 2009. His finding reinforces the conclusions of some earlier studies, such as Marquez and Schindler (2006), which found that Chinese exports respond strongly to movements in the real exchange rate. 7 It is worth mentioning that we focus on the exchange rate angle. As the currency may be only one part of the global rebalancing, our exercise is therefore narrowly defined and examining just one piece of the global rebalancing.
4
market.8 This provides us with a way of dealing with the endogeneity problem that plagues
studies of the impact of exchange-rate announcements on financial variables.
Since we have only two PBOC announcements, we also consider a set of politically-
driven changes in prospective Chinese exchange rate policy as perceived by the markets. We
identify large movements in renminbi non-deliverable forward contracts (RMB NDFs) and use
media coverage to distinguish movements driven by political factors rather than macroeconomic
news.9 We obtain 10 dates of expectations of politically-driven RMB NDF appreciation using
this approach.
By focusing on these politically-driven events, we aim to address a basic challenge in the
empirical literature on exchange rates, i.e., the difficulty of separating the impact of exchange
rate changes on other macroeconomic variables from causality running in the opposite direction.
As Engel (2009) writes of the exchange-rate-trade-balance nexus, “…it is very difficult to assess
the effect of exchange rates on trade balances. There are few if any cases of “exogenous”
changes in the exchange rate…Instead, any comovements between exchange rates and trade
quantities are confounded by the forces that cause the exchange rate to change in the first
place…But then it is hard econometrically to separate out the effect of the depreciation on the
trade balance and the effect of the trade balance on the depreciation.”10 To the extent that the
PBOC announcements and NDF movements we consider reflect political rather than economic
factors, the problem of reverse causality flagged by Engel (2009) will not be as serious as in
other contexts.
Firm-level data permit us to distinguish different channels through which Chinese
currency policy affects other countries. We can distinguish firms that compete with Chinese
8At the time of both announcements, there was little indication of inflation accelerating to unacceptably high levels or of irrational exuberance in asset markets. In the second case, Chinese inflation did eventually accelerate, but considerably later (in early 2011).
9 Such as new data on trade balance. For example, on Nov 23, 2007 (Friday), there was a large appreciation of RMB Forward due to the coming Sino-Euro meeting the following week. The market expected that China might speed up its appreciation after the meeting. Meanwhile, there was no major release of macroeconomic data, such as trade surplus or inflation, in either China or the United States. 10 Earlier studies have examined how exchange rates affect equity prices (see for example Phylaktis and Ravazzolo 2005). Effects for individual firms vary in expected way by exposures to exchange rates (firm size, multinational status, foreign sales, international assets, competitiveness and so forth; see Griffin and Stulz 2001, and Dominguez and Tesar, 2006).
5
exports of similar products from firms that export directly to China. We can distinguish
exporters of parts and components from exporters of final goods. We can distinguish foreign
firms according to their degree of dependence on external finance.
We find that the stock returns of non-Chinese corporations rise in response to
expectations of renminbi appreciation. This response appears to be associated with both general
market sentiment, which we interpret in terms of reduced risk of trade-policy conflict, and
specific trade effects. There are, at the same time, pronounced differences in response across
firms. A large positive effect is evident for exporters of final goods to China. Suppliers of
inputs for China’s processing exports, however, experienced no significant net market-valuation
effects at the time of the two PBOC announcements.11
We find similar patterns when examining the implications of Chinese currency policy for
competition in the firm’s home and third markets. Firms face less competition from China after
renminbi appreciation if they compete with China in home or third markets in selling final
products but do not benefit significantly if they compete with China in processing trade. In
addition, there is some support for the view that announcements of changes in Chinese currency
policy, by causing investors to revise upward their estimates of actual and expected treasury
yields, reduce the market valuation of firms that depend on external finance for funding their
investment.
These patterns are still evident when we control for firm-specific characteristics and
sector, year and country fixed effects. They carry over when we control for local currency
movements associated with renminbi appreciation. They hold whether total stock returns or
abnormal returns are used as the dependent variable. Placebo tests for similar effects on
adjoining days do not find them, suggesting that these effects are not being caused by other
events affecting market valuations. Finally, these patterns continue to hold when we expand our
sample to ten dates of market expectations of politically-motivated changes in renminbi policy.
11 Possibly, the positive income effect of renminbi appreciation is offset by the negative effect from reduced derived demand for processing inputs. Other recent work also finds a negative long-term impact of renminbi appreciation on China’s imports, plausibly reflecting this imported-input effect. For example Marquez and Schindler (2006), and Cheung, Chinn and Fujii (2010), using aggregate country-level data, find that Chinese ordinary imports rise in response to renminbi depreciation.
6
We describe our data and methodology in Section 2. Section 3 presents results for the
two PBOC announcements. Section 4 reports robustness checks. Section 5 extends the sample to
10 dates of market expectations of politically-motivated changes in Chinese exchange rate
Here “Stock Return” is the one-day return for firm i in sector j in country k at time t. “Trade
Channel” encompasses three trade-related effects of China’s exchange rate announcements: the
impact on exports to China, the impact on imports from China, and the impact on competition
with China in third markets. Trade data are collected from the UN Comtrade data set, which
provides information on bilateral imports and exports for each country pair at the 4-digit US SIC
level.
The problem of reverse causality running from stock prices to exchange rate policy
should not be as serious here as in other studies of the connections between exchange rates and
related variables, since our stock price variable is highly disaggregated while the exchange rate is
a macroeconomic variable. (In other words, movements in individual share prices are unlikely to
affect an economy-wide aggregate like the exchange rate.) Nonetheless, to further address the
possibility of reverse causality, we lag the trade data, using 2004 observations for the 2005
announcement and 2008 observations for the 2010 announcement, respectively.12 We also focus
on episodes where expectations of changes in the exchange rate arise from political as opposed
to economic developments, as further explained below.
In practice we distinguish the importance for these various classes of firms of (a) China’s
own market, as captured by exports to China by sector j of country k divided by global exports of
sector j of country k, (b) the impact on home-market competition, as captured by imports from
China by sector j in country k divided by total imports of sector j in country k, and (c) Chinese
12 2009 data would be contaminated by the effects of the financial crisis.
7
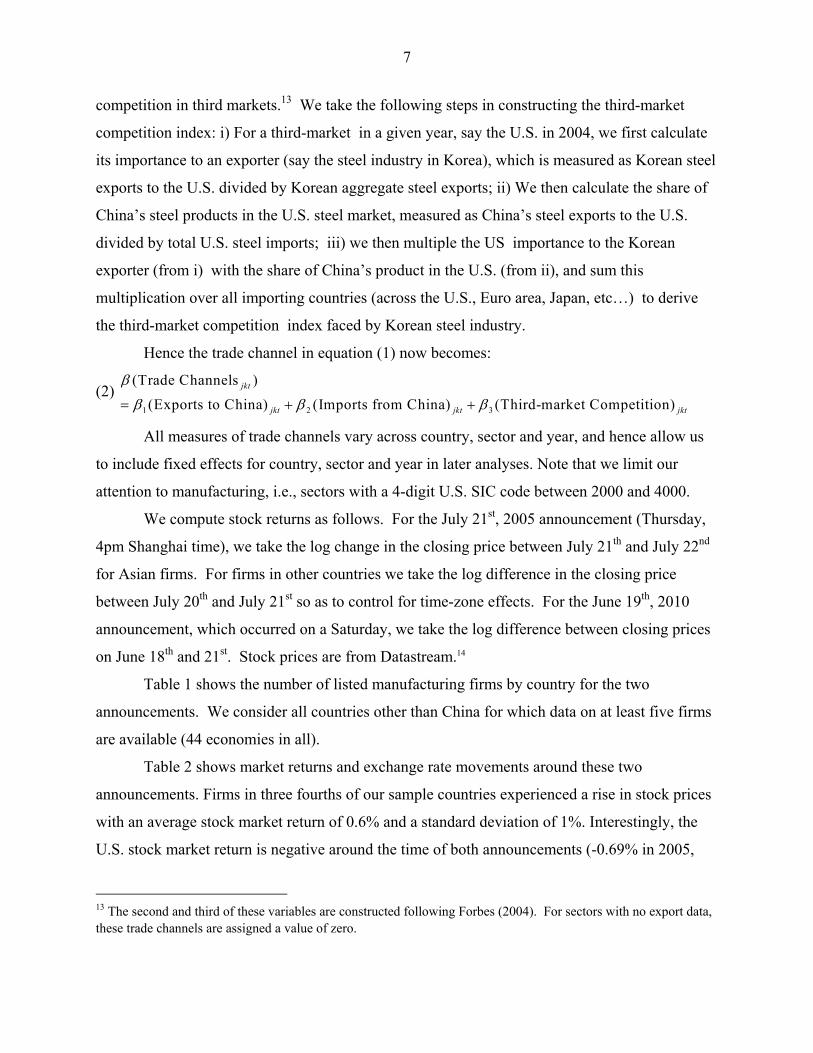
competition in third markets.13 We take the following steps in constructing the third-market
competition index: i) For a third-market in a given year, say the U.S. in 2004, we first calculate
its importance to an exporter (say the steel industry in Korea), which is measured as Korean steel
exports to the U.S. divided by Korean aggregate steel exports; ii) We then calculate the share of
China’s steel products in the U.S. steel market, measured as China’s steel exports to the U.S.
divided by total U.S. steel imports; iii) we then multiple the US importance to the Korean
exporter (from i) with the share of China’s product in the U.S. (from ii), and sum this
multiplication over all importing countries (across the U.S., Euro area, Japan, etc…) to derive
the third-market competition index faced by Korean steel industry.
Hence the trade channel in equation (1) now becomes:
(2) 1 2 3
(Trade Channels )
(Exports to China) (Imports from China) (Third-market Competition)
jkt
jkt jkt jkt
All measures of trade channels vary across country, sector and year, and hence allow us
to include fixed effects for country, sector and year in later analyses. Note that we limit our
attention to manufacturing, i.e., sectors with a 4-digit U.S. SIC code between 2000 and 4000.
We compute stock returns as follows. For the July 21st, 2005 announcement (Thursday,
4pm Shanghai time), we take the log change in the closing price between July 21th and July 22nd
for Asian firms. For firms in other countries we take the log difference in the closing price
between July 20th and July 21st so as to control for time-zone effects. For the June 19th, 2010
announcement, which occurred on a Saturday, we take the log difference between closing prices
on June 18th and 21st. Stock prices are from Datastream.14
Table 1 shows the number of listed manufacturing firms by country for the two
announcements. We consider all countries other than China for which data on at least five firms
are available (44 economies in all).
Table 2 shows market returns and exchange rate movements around these two
announcements. Firms in three fourths of our sample countries experienced a rise in stock prices
with an average stock market return of 0.6% and a standard deviation of 1%. Interestingly, the
U.S. stock market return is negative around the time of both announcements (-0.69% in 2005,
13 The second and third of these variables are constructed following Forbes (2004). For sectors with no export data, these trade channels are assigned a value of zero.
8
and -0.39% in 2010). Whether these heterogeneous responses are due to idiosyncratic shocks or
systematic factors is to be determined.
Some currencies, particularly in Asia, appreciated together with the renminbi around the
time of the two announcements (again see Table 2). This suggests another channel through
which renminbi announcements can affect foreign stock markets: by affecting other exchange
rates.15
Figure 1 juxtaposes stock market returns and trade with China for different countries.
The top two charts consider exports to China over total exports around the time of the two PBOC
announcements. It is hard to detect a significant association between the stock market reaction
and total exports to China. The bottom two charts consider imports from China over total
imports, again for the two PBOC announcements. Once more it is hard to discern a simple
correlation.16
However, the absence of an obvious correlation could result from the presence of
different factors working in opposite directions and affecting different firms differentially.
While foreign firms exporting final products to China should benefit from the additional demand
that comes with appreciation, foreign firms exporting components to China for processing trade
could suffer due to the decline in demand for China’s final exports. Similarly, firms relying
Chinese products as inputs into their own production, including the parent companies of Chinese
subsidiaries and other upstream companies that are part of the same global supply chain, may
find their costs increased by renminbi appreciation.
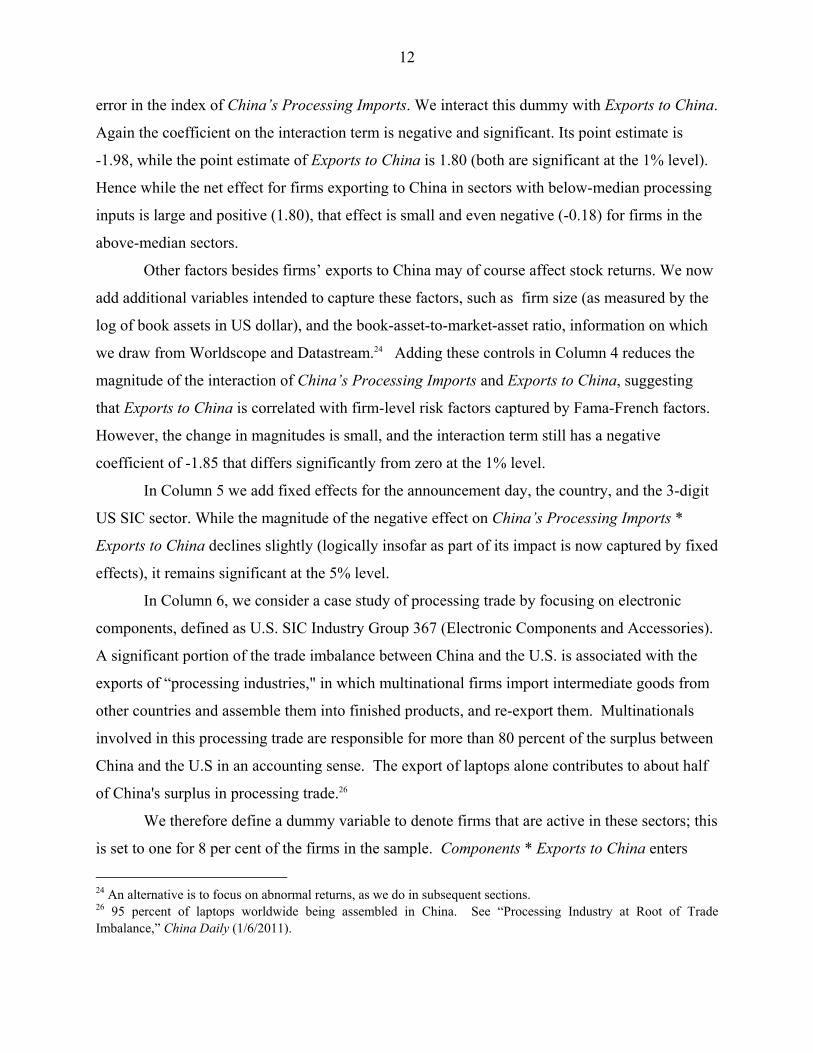
To control for these factors we extend the analysis of trade effects as follows:
(3)
11 12
21 22
31 32
Trade Channels ( China's Processing Imports )*(Exports to China)
( China's Processing Exports )*(Imports from China)
14 In robustness checks, we will also study abnormal stock market returns (see below). 15 We will consider this as well in the analysis. 16 The association between the stock market reaction and import exposure to China was actually negative in 2005.
9
where the expectation is that 12 0 . That is, firms supplying inputs to China for that country’s
processing trade will experience stock-price declines. We similarly expect 22 0 , since firms
importing inputs from China will experience higher costs as well.
Data for China’s processing trade are from Koopman, Wang and Wei (2008), who use the
UN BEC classification and processing-trade information from China Customs Trade Statistics to
identify the use for imports of some 60 manufacturing sectors in China in 2002.17 The authors
estimate the shares of intermediates for processing exports, intermediates for normal use, capital
goods for normal use, capital goods for processing exports, and final consumption goods.18 They
then use China’s 2002 input-output table to calculate the percentage of processing exports in
China’s exports, by industry.19
“Financial Channel” is designed to capture the impact of renminbi appreciation
expectations on corporate funding costs, for firms that depend on external finance in particular,
insofar as renminbi appreciation is expected to imply reduced Chinese purchases of U.S.
treasury securities and put upward pressure on yields more generally. We construct a sector-
level approximation of a firm’s intrinsic dependence on external finance for capital investment
following the methodology of Rajan and Zingales (1998):
(4) capital expenditures - cash flow
Dependence on external finance for investment = ,capital expenditures
where “cash flow” denotes cash flow from operations plus reductions in inventories plus
decreases in receivables plus increases in payables. Conceptually, the Rajan-Zingales (RZ)
17 China’s Customs Trade Statistics classifies imports to China as for processing trade or for normal usage. See also Koopman, Powers, Wang, and Wei (2010) for more details. 18 Sectors with large share of intermediates for processing exports include, for example electronic element and device, and plastic products, while sectors with small share of intermediates for processing exports include chemical fertilizers and medical products. 19 The sectors identified with large processing exports include for example electronic and communication equipment and household electric appliances, while sectors with small processing exports include chemical pesticides and cement, lime and plaster.
10
index aims to identify sectors that are naturally more dependent on external financing for their
investment and other business operations.20
Following standard practice, the RZ index is calculated using data for U.S. firms, which
are assumed to be least likely to suffer from financing constraints of a sort likely to disguise their
underlying reliance on external finance. While the original Rajan and Zingales (1998) paper
covers 40 (mainly SIC 2-digit) sectors, we expand the coverage to 110 SIC 3-digit sectors. To
calculate the dependence external financing of U.S. firms, we first sort all firms listed in
COMPUSTA USA into SIC 3-digit sectors. We then calculate the external-finance-dependence
ratio (eqn. 4) for each firm on average for the period 1990-2006. Finally we take the sector-level
median from firm ratios for each SIC 3-digit sector with at least 5 firms as the index of demand
for external finance by firms in that sector. To capture the percentage of capital expenditure
financed externally, we winsorize our version of the RZ index so that it ranges from 0 to 1.
Asset pricing models provide guidance for control variables. As in Whited and Wu
(2006), we add two variables: firm size (log assets in US dollars) and the ratio of the book value
to market value.21 These control variables are lagged one year when included in our estimating
equation. Table 3 provides summary statistics for the dependent variables and explanatory
variables.
Throughout we cluster the standard errors by sector.22
3. Results for the Two PBOC Announcements
i. Exports to China
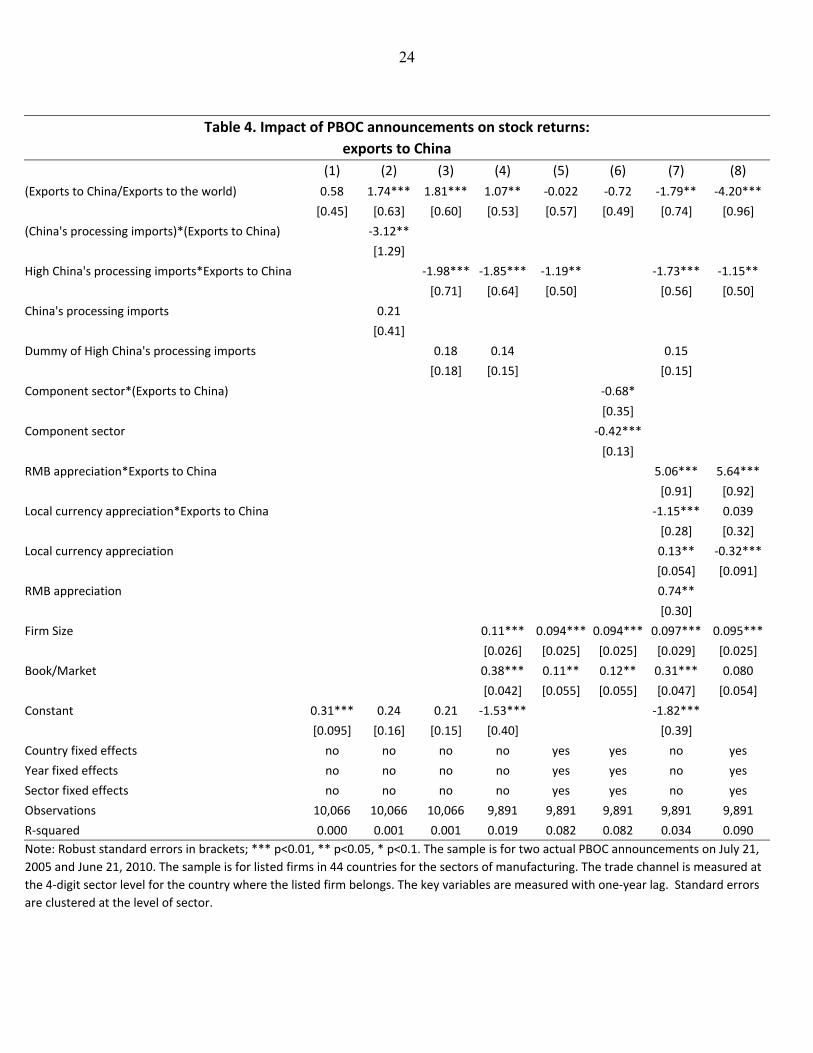
Table 4 presents benchmark estimates for firms exporting to China. The first column
shows that, on average, firms exporting to China benefit from RMB appreciation, although the
20 In so doing it ignores the question of which firms within a sector are more liquidity constrained. What the RZ index measures could be regarded as a technical or technological characteristic of the sector, almost like a part of the production function. 21 We follow Whited and Wu (2006) by entering the relevant firm characteristics directly into our regressions rather than by first going through a factor model. For control variables, these two ways of incorporating the three factors should be equivalent. Entering firm characteristics directly into our regressions is easier to implement, though the interpretation of the coefficients on these factors is less straightforward. 22 It turns out that we get very similar results when clustering at the country-sector level.
11
coefficient in question is insignificantly different from zero at standard confidence levels. The
absence of a strong correlation is consistent with Figure 1 above.
Now however the coefficient on Exports to China is insignificant, while the constant term
is positive and significant at the 1 per cent confidence level. This raises the question of whether
the observed increase in stock valuations is driven by trade-related effects or general market
sentiment, where market sentiment might improve because expectations of renminbi appreciation
reduce fears that the U.S. might brand China as a currency manipulator and impose trade
sanctions (to which China might retaliate). Public commentary is consistent with at least some
role for this second factor.23 Improved sentiment will reduce perceived market risk and hence
boost stock prices for firms. The significance of constant term, the insignificance of Exports to
China, and the aforementioned market comments are all consistent with the hypothesis that
China’s exchange rate announcements boosted share prices through this sentiment effect (by,
inter alia, reducing the perceived likelihood of a trade war) as well as through specific trade
effects (such as creating the prospect of additional exports to China).
In Column 2 we therefore add the interaction of China’s Processing Imports and Exports
to China, as in equation (3), including also its individual constituents as controls. Exports to
China now has a significant positive coefficient, suggesting that firms selling final products to
China experience a positive stock return. In addition, the interaction term has a negative
coefficient which differs significantly from zero at the 5% level. Evidently, the positive impact
otherwise felt by firms exporting to China is smaller for sectors where China imports products
for use in the production of processing exports.
In Column 3, we add a dummy variable that equals one if the sector has an above-median
value for China’s Processing Imports (i.e, >=0.16). This should help to control for measurement
23 BBC Business (6/21/2010) noted in the wake of the 2010 announcement that Chinese yuan flexibility comments buoyed markets, as “the move, ahead of the G20 summit later this month, has tempered market fears of a possible trade war between China and the U.S.” Deutsche Bank Global Market Research (6/21/2010) noted that “the decline in the probability of a trade war between China and the US – as a result of China’s currency move -- should help lift market sentiment for risky asset classes.” AFP London (Jun 21, 2010) similarly noted that “Global equities surged on Monday after China said it would relax constraints on the yuan, in a surprise move seen by analysts as an attempt to defuse tensions before a crucial G20 summit this weekend … Investor sentiment has improved quite dramatically over the weekend, with the news that China has pledged to allow its yuan to appreciate, helping to drive all major markets higher.”
12
error in the index of China’s Processing Imports. We interact this dummy with Exports to China.
Again the coefficient on the interaction term is negative and significant. Its point estimate is
-1.98, while the point estimate of Exports to China is 1.80 (both are significant at the 1% level).
Hence while the net effect for firms exporting to China in sectors with below-median processing
inputs is large and positive (1.80), that effect is small and even negative (-0.18) for firms in the
above-median sectors.
Other factors besides firms’ exports to China may of course affect stock returns. We now
add additional variables intended to capture these factors, such as firm size (as measured by the
log of book assets in US dollar), and the book-asset-to-market-asset ratio, information on which
we draw from Worldscope and Datastream.24 Adding these controls in Column 4 reduces the
magnitude of the interaction of China’s Processing Imports and Exports to China, suggesting
that Exports to China is correlated with firm-level risk factors captured by Fama-French factors.
However, the change in magnitudes is small, and the interaction term still has a negative
coefficient of -1.85 that differs significantly from zero at the 1% level.
In Column 5 we add fixed effects for the announcement day, the country, and the 3-digit
US SIC sector. While the magnitude of the negative effect on China’s Processing Imports *
Exports to China declines slightly (logically insofar as part of its impact is now captured by fixed
effects), it remains significant at the 5% level.
In Column 6, we consider a case study of processing trade by focusing on electronic
components, defined as U.S. SIC Industry Group 367 (Electronic Components and Accessories).
A significant portion of the trade imbalance between China and the U.S. is associated with the
exports of “processing industries," in which multinational firms import intermediate goods from
other countries and assemble them into finished products, and re-export them. Multinationals
involved in this processing trade are responsible for more than 80 percent of the surplus between
China and the U.S in an accounting sense. The export of laptops alone contributes to about half
of China's surplus in processing trade.26
We therefore define a dummy variable to denote firms that are active in these sectors; this
is set to one for 8 per cent of the firms in the sample. Components * Exports to China enters
24 An alternative is to focus on abnormal returns, as we do in subsequent sections. 26 95 percent of laptops worldwide being assembled in China. See “Processing Industry at Root of Trade Imbalance,” China Daily (1/6/2011).
13
with a negative coefficient in Column 6, consistent with the idea that firms exporting
components to China are negatively impacted by renminbi appreciation.
So far we have shown that the pattern of stock returns across firms is consistent with the
global-production-chain story. We now consider alternative explanations, such as the possibility
that countries exporting more to China experience faster appreciation of their own currencies. It
is widely argued, for example, that neighboring Asian countries that trade heavily with China are
reluctant to allow their currencies to rise for fear of losing market share there or in their home
markets, fears that should be attenuated if the renminbi is itself allowed to rise against extra-
regional currencies.
To capture this possibility we add two interaction terms: Local Currency Appreciation *
Exports to China, and RMB Appreciation*Exports to China.27 While the preceding logic
suggests that local currency appreciation is likely to be endogenous with respect to renminbi
appreciation, the level of the exchange rate is a country-level variable beyond the influence of
individual firms. Hence it should still provide some insight into the question at hand.
In Column 7 of Table 4, RMB Appreciation*(Exports to China) has a significant positive
coefficient, while Local Currency Appreciation*(Exports to China) has a significant negative
coefficient. Both signs accord with the preceding intuition. Moreover, the interaction of High
Chinese Processing Imports and Exports to China still has a negative coefficient (-1.73) that is
statistically significant at the 1% level, consistent with earlier results.28 In Column 8, we add
country, date and sector fixed effects. In this case Local Currency Appreciation * Exports to
China is no longer significant, while (China's Processing Exports )*(Imports from China)j jkt
remains significant at the 5% level. Reassuringly, the previous results continue to hold for the
interaction of China’s Processing Imports with Exports to China.
27 In a sense we have already provided for this possibility by including country fixed effects and year fixed effects. But the two new variables should capture this possibility more directly. 28 The interaction term in question took on a value of -1.50 in Table 3.
14
Evidently, then, allowing for the asymmetric response of local currencies leaves our
interpretation in terms of global supply chains unaffected.
ii. Competition in home market
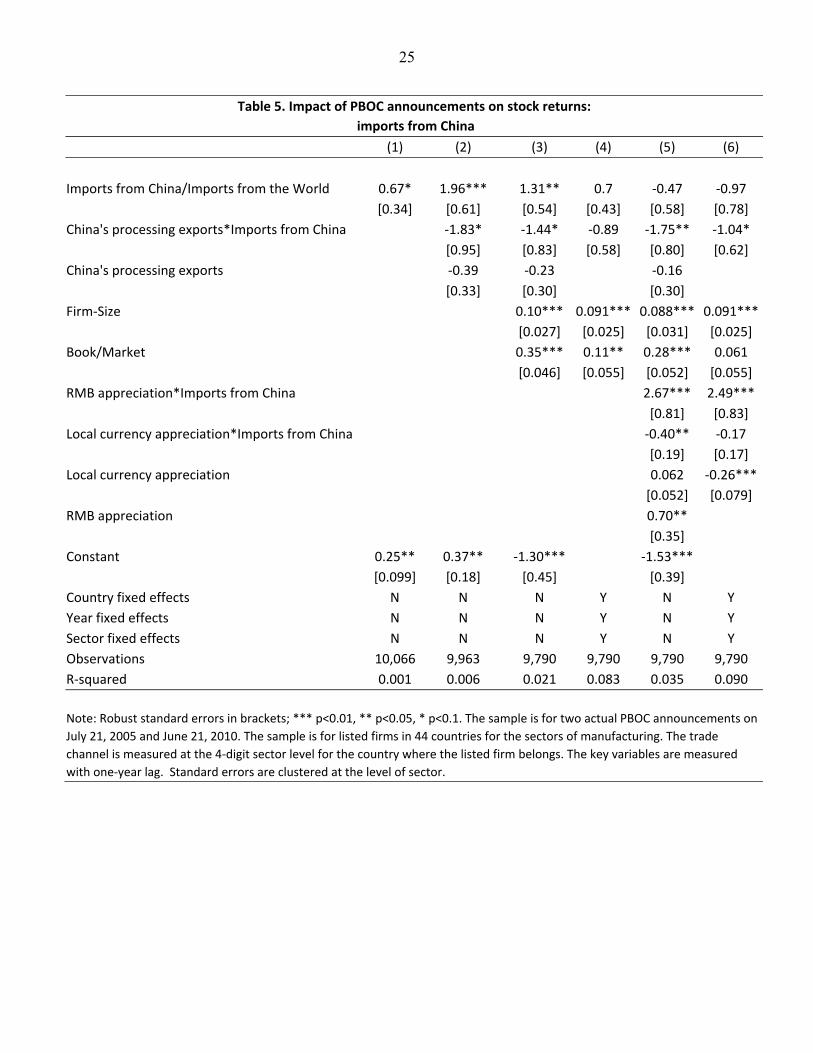
In Table 5 we consider competition in the firm’s home market as captured by imports
from China as a share of total imports. Specifically, we ask how imports from China affect stock
prices. In Column 1, the coefficient in question is positive and significant at the 10% level. It
would appear that expectations of renminbi appreciation boost stock prices for firms that
compete with China in their home markets. In Column 2 we ask whether the results vary with
the degree of processing trade in imports from China, adding
(China's Processing Exports )*(Imports from China)j jkt. Our hypothesis is that firms importing
Chinese products that themselves possess high imported-input content are likely to feel negative
effects insofar as they are parent companies of Chinese subsidiaries or reside upstream of China
in the relevant production chain. The index of China’s Processing Exports comes from
Koopman et al (2008), which uses China’s input-output table to calculate the contribution of
processing trade to final exports for 61 manufacturing sectors for year 2002.
The coefficient on (China's Processing Exports )*(Imports from China)j jkt is negative and
significantly different from zero at standard confidence levels, indicating that expectations of
renminbi appreciation depress stock returns for firms importing products from China with high
processing content. In contrast, Imports from China is positive, suggesting that international
firms, if they compete with China in final-product trade, are expected to face less competition in
their home market. The point estimate for the interaction term is -1.9, while the point estimate
for Imports from China is 0.79. Given that the median ratio of China's Processing Exports jis
0.43, this means that about half of all sectors experience a decline in stock prices as a result of
expectations operating through this home market channel.
In Column 3, we again add as controls the firm’s size and the firm’s book-to-market
ratio. The magnitude of the coefficient on (China's Processing Exports )*(Imports from China)j jkt
now falls slightly, but remains significant at the 10% confidence level. In Column 4, we add
county, date and 3-digit sector dummies. The coefficient on the interaction term is somewhat
reduced in magnitude and becomes insignificant at the traditional confidence level.
15
In Columns 4 and 5 we control for exchange rate movements in local currencies. We find
that RMB appreciation * Imports from China has a significant positive coefficient, while Local
Currency Appreciation * Imports from China has a significant negative coefficient, consistent
with preceding intuition. Moreover, the interaction of Imports from China with Chinese
Processing Exports now has a larger magnitude and is significant at the 5% level. In Column 5,
where we add country, year and sector effects, the results carry over.
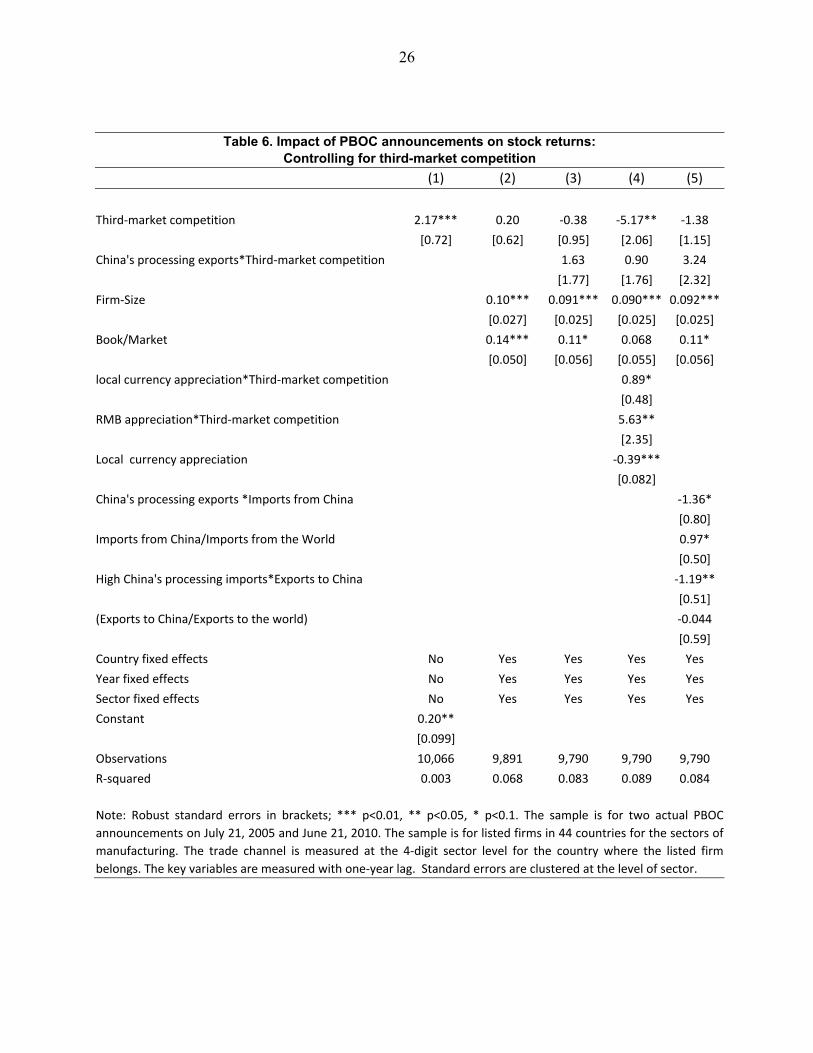
iii. Third-market competition
In Table 6 we focus on third-market competition. In Column 1, we include third-market
competition. It enters with a positive and significant coefficient. This suggests that firms
competing with Chinese firms in the third market indeed benefit from renminbi appreciation. In
Column 2, we include firm-level controls and country and year fixed effects. Third-market
competition still enters with a positive coefficient but does not differ significantly from zero at
traditional confidence levels.
In Column 3 we add the interaction between Third-Market Competition and China’s
Processing Exports. The new term enters with a positive but insignificant coefficient. It would
appear that expectations of renminbi appreciation increase stock returns for firms competing with
China in third markets in products with high processing content, although the effect is weak.
The positive sign of the interaction term also suggests that our earlier findings of negative
coefficient for (China's Processing Exports )*(Imports from China)j jkt is unlikely due to some
intrinsic sectoral features such as income sensitivity, as these intrinsic features would generate
same signs for (China's Processing Exports )*(Imports from China)j jkt and
(China's Processing Exports )*(Third-market competition)j jkt. In other words, the opposite signs
of (China's Processing Exports )*(Imports from China)j jkt and
(China's Processing Exports )*(Third-market competition)j jkt are more consistent with the global
production chain story.
In Column 4, we add proxies for Imports from China and Exports to China. In their
presence, the interaction between Third-market Competition and China’s Processing Exports is
still positive, albeit remaining insignificant. Reassuringly, however, the key results in earlier
tables on Imports from China and Exports to China continue to hold.
16
iv. Financial channel
In Table 7, we consider the possibility that expectations of renminbi appreciation put
upward pressure on treasury yields, making it more expensive for financially-dependent firms to
fund their investments. U.S. treasury bond yields in fact rose on both announcement dates,
consistent with the idea that faster renminbi appreciation would mean fewer PBOC purchases of
U.S. treasury bonds. The question is whether this had a differential impact on more financially
dependent firms. As Column 1 shows, financially dependent firms saw their share prices decline
with both two announcements of prospective changes in China’s exchange rate regime,
consistent with the hypothesis. The results carry through when we include firm-level control
variables, i.e., firm size and book-to-market ratio in Column 2, and when we further add country
and year fixed effects in Column 3.
In Column 4, we further include an interaction term of financial dependence and financial
openness. We measure financial openness by the country’s foreign assets and liabilities over
GDP, following Lane and Milesi-Ferretti (2007). The hypothesis is that countries more
integrated with the global financial market will be affected more by a rise in treasury yield. We
find the interaction term indeed has a negative coefficient significant at the 1% level. The results
for the financial channel remain also the same if we further add sector fixed effects, as in
Column 5.
4. Robustness Checks
Abnormal returns have also been studied as a measure of the impact of macroeconomic
shocks (by e.g, Mackinlay 1997). A common model of normal returns assumes a stable linear
relation between the market return and the individual security return:
(5) , , , , ,* i t i t i t i t k tAbnormal return = Stock return Alpha Beta Market return
17
We construct each firm’s beta annually based on the correlation of weekly firm-level
stock returns and local market returns.32 We then construct each firm’s alpha as the annual
average of its weekly average return minus the beta multiplied by the annual average market
return. We use the one-year-lagged beta and alpha in constructing the abnormal return around
the two renminbi appreciation dates.33 We winsorize the dependent variable at the 1% level to
reduce the influence of outliers.
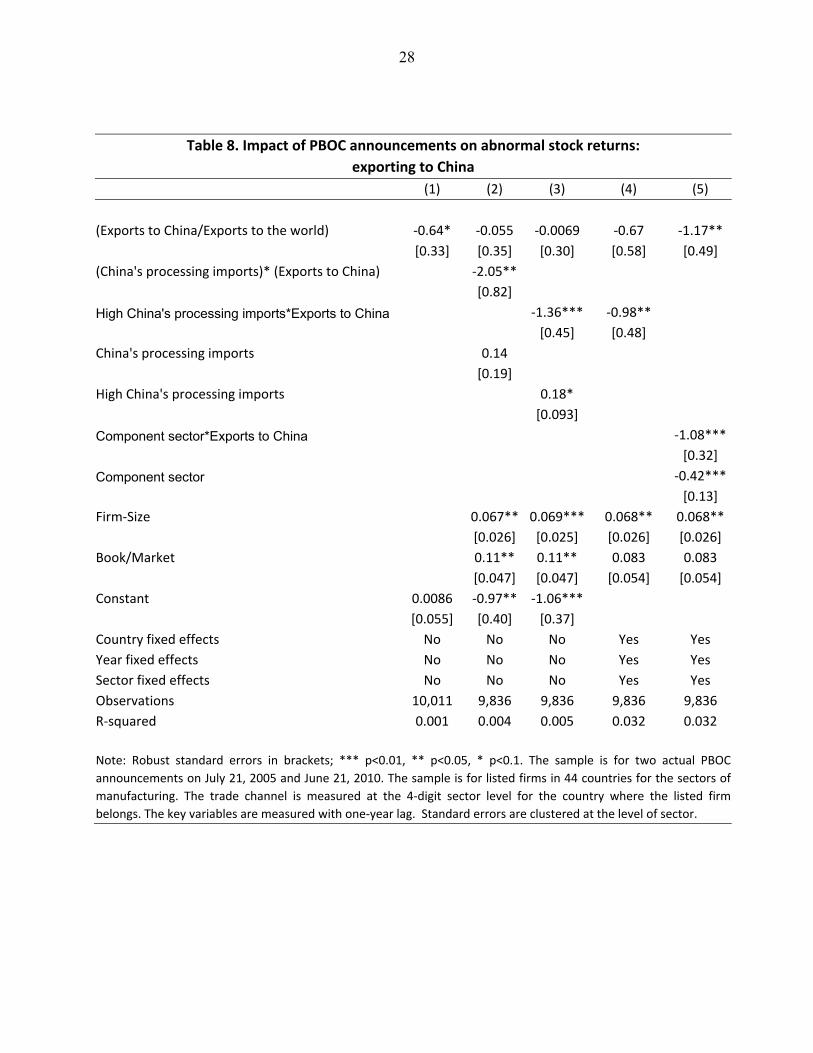
The results using abnormal returns are in Table 8 for exports to China and Table 9 for
imports from China. They confirm the findings in Tables 4 and 5. In Column 1 of Table 8, we
find that firms exporting to China experience a decline in their abnormal stock returns around the
time of the two reminbi appreciation announcements. While this finding is surprising, it is
consistent with the findings in Cheung, Chinn and Fujii (2010), where renminbi appreciation
reduces China’s imports. In Column 2, we include the interaction of Exports to China with
China’s Processing Imports. This interaction term also has a negative coefficient that differs
significantly from zero at the 1% confidence level. However, the coefficient for Exports to
China in levels is no longer significant, suggesting that the negative coefficient in Column 1 is
driven mainly by firms exporting processing inputs to China.
In Column 3, we add a dummy variable that equals one if the sector has an above-
median value for China’s Processing Imports (i.e, >=0.16). We interact this dummy with
Exports to China. Again the coefficient on the interaction term is negative and significant. In
Column 4, where we add country, year and sector fixed effects, the interaction term is reduced
somewhat in magnitude but remains significant at the 5% level. In Column 4, we replace
China’s Processing Imports with a dummy variable indicating components-producing industries,
while keeping the fixed effects. Again, Components * Exports to China enters with a negative
coefficient that differs significantly from zero at the 1% level.
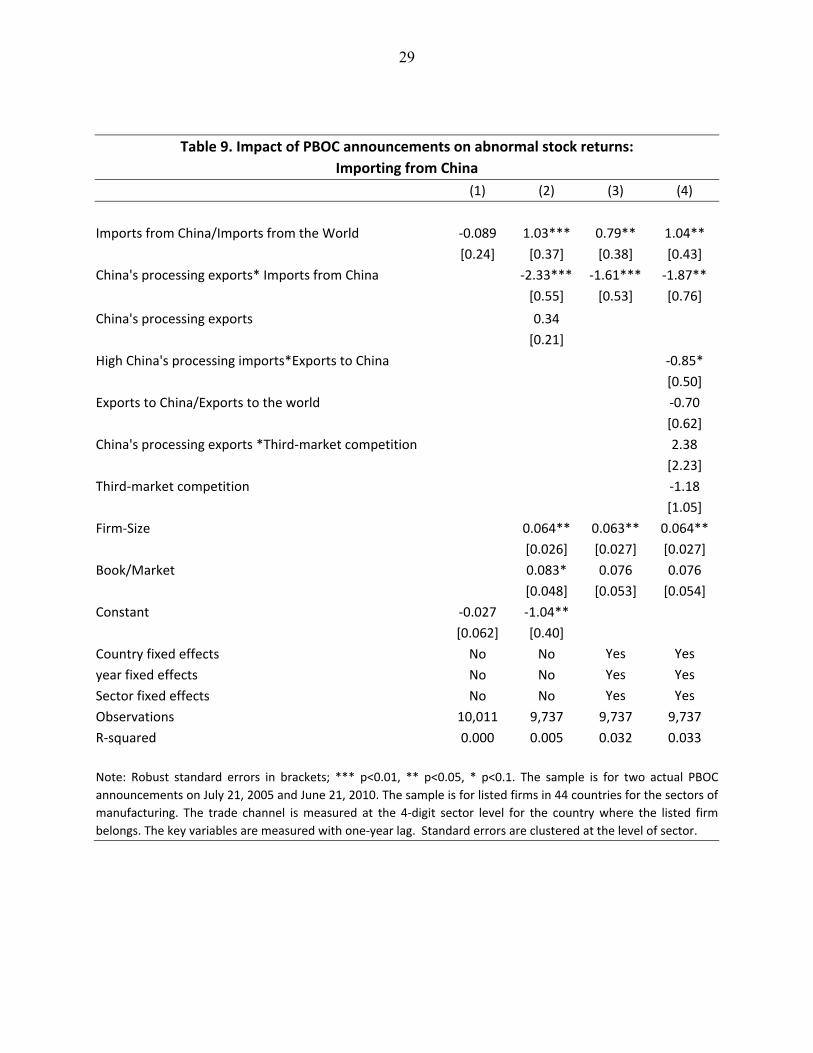
In Table 9 we consider imports from China in a specification like that in Table 5 but now
using abnormal stock returns as the dependent variable. In Column 1, Imports from China enters
negatively but does not differ significantly from zero. In Column 2 we include the interaction of 32 We use the domestic beta rather than a beta based on a world factor model because Griffin (2002) finds that domestic factor models perform better in explaining time-series variations in returns and have lower pricing errors than the world factor model. 33 As the alpha is constructed from weekly stock data, we use (1/5)*alpha in constructing the abnormal stock return from day t-1 to t.
18
Imports from China with China's Processing Exports. This interaction enters negatively, and its
coefficient differs significantly from zero at the 1% confidence level. It remains significant at the
1% level when we add country, year and sector fixed effects (Column 3). In Column 4, we add
the interaction of Exports to China with High China’s Processing Imports. Reassuringly, both
interaction terms – the new one and that on which we focused previously – enter negatively and
significantly. Hence the analysis of abnormal stock returns confirms our earlier findings based
on total returns.
Finally, in a placebo test we considered daily stock returns on 7/19/2005 and 6/17/2010,
i.e., two trading days before the PBOC announcements. For these two days we do not find a
significant coefficient for the trade channels.34 This reassures us that the stock-market response
we detect is not reflecting other events occurring around the time of the PBOC announcements.
5. Results for Market-Perceived Policy Changes
While moving from country- to firm-level data extends the sample along one dimension –
the number of responders (firms) – it does little to address the problem of limited variation along
the other dimension, that as of the time of writing there have only two official announcements
pointing to the prospect of future appreciation.
We address this problem by considering in addition to actual announcements sharp
changes in market expectations. We focus on sharp changes in the price of nondeliverable
forward (NDF) dollar-renminbi contracts that coincide with newspaper articles about possible
changes in Chinese exchange rate policy owing to foreign political pressure. We identify 10
dates between 2003 and 2010 when movements in the renminbi NDF rate reacted significantly to
upcoming G-7 meetings, China-US/Euro Summit meetings, or speeches by senior U.S. officials.
(From 2003 to 2010, there were 48 dates when the daily change of 12 month-NDF was larger
than or equal to 0.6%.) We use media coverage from Factiva to check that these NDF
movements were not obviously responding to other macroeconomic news, such as new
information on inflation, central bank policy rates or trade balances in China or the U.S., ruling
out observations where this was the case.
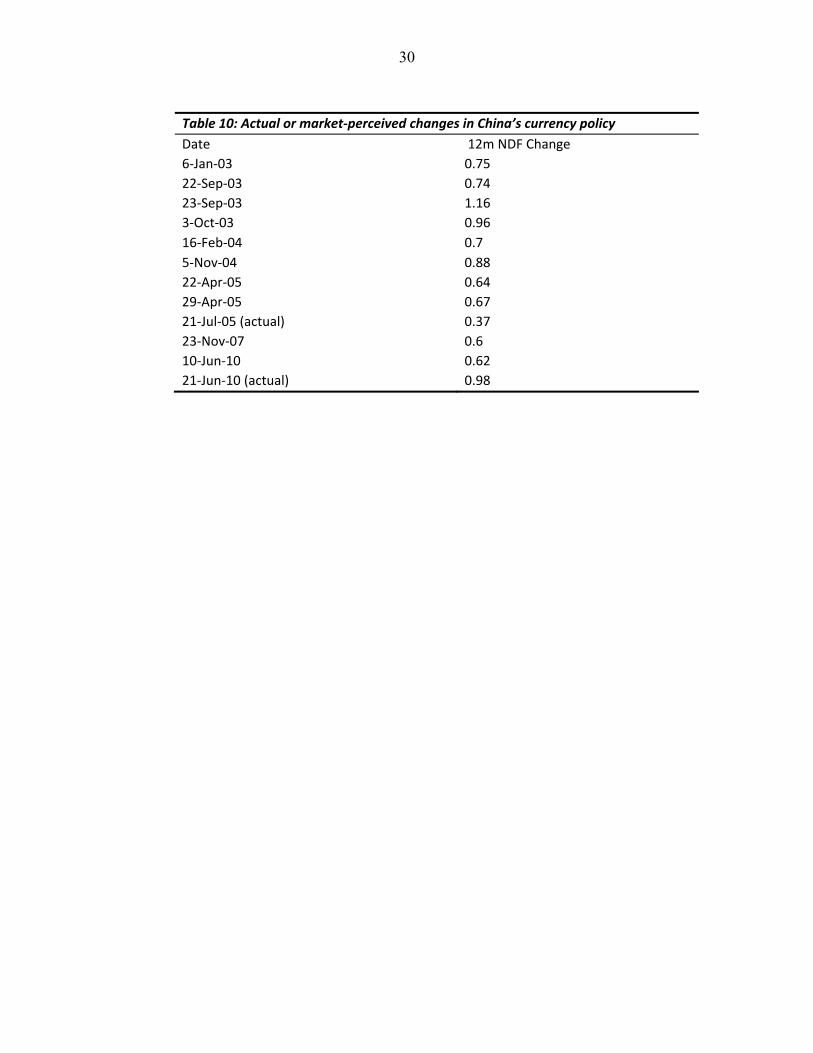
Table 10 lists the 10 episodes. Daily appreciation of the 12-month renminbi NDF rate on
these 10 days ranges from 0.6 per cent to 1.16 per cent, with a mean of 0.77 per cent. In the case
34 Results available from the authors on request.
19
of the two PBOC announcements, by comparison, the daily change in the 12-month NDF is 0.37
per cent and 0.98 per cent. In terms of the magnitude of the exchange rate response, then, the
two types of episodes are broadly comparable.
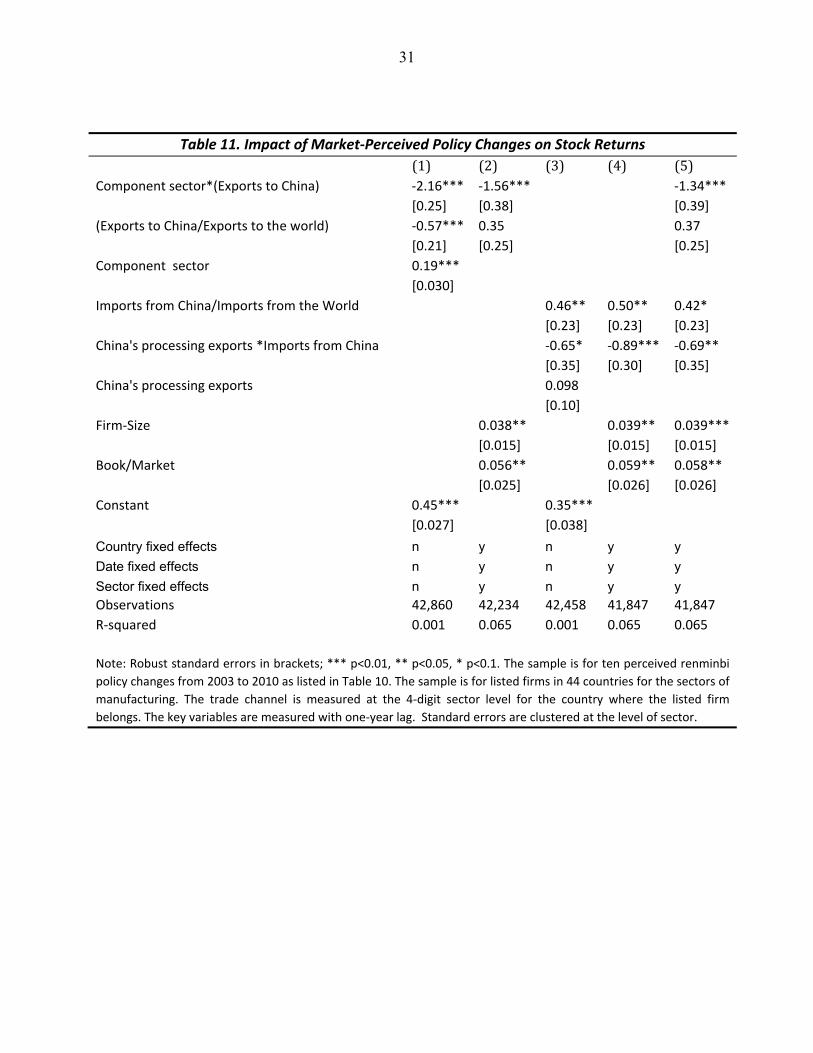
In Column 1 of Table 11, where we examine the impact of renminbi NDF appreciation on
firm valuations, the coefficient on Components * Exports to China is negative and differs
significantly from zero at the 1% confidence level, consistent with our earlier results for the two
PBOC announcements, although the point estimate is a bit smaller in magnitude.35 The results
carry over when we include firm-level controls and country, year and sector dummies, as in
Column 2.
In Columns 3 and 4 we examine home-market competition as captured by Imports from
China. There j jkt(China's Processing Exports )* (Imports from China) enters with a negative
coefficient that differs significantly from zero at the 10% confidence level. That interaction term
becomes significant at the 1% level when we include firm controls and country, year and sector
dummies (Column 4). ). In Column 5, we add Components * Exports to China. Reassuringly,
both interaction terms – the new one and that on which we focused previously – enter negatively
and significantly. Hence extending our sample to market-perceived policy changes confirms our
earlier findings for the two actual PBOC announcements.
6. Conclusions
We have extended existing research on the prospective impact of appreciation of the
renminbi exchange rate on the rest of the world using firm-level data. We examine the response
of share prices to two announcements of changes in China’s currency policy in 2005 and 2010,
both of which plausibly created expectations of faster renminbi appreciation, using movements
in stock prices of some 6,000 manufacturing firms in 44 economies. We then consider 10
instances of market-perceived changes in exchange rate policy, as reflected in unusually large
renminbi movements on the NDF market, each of which was associated with political as opposed
to economic factors.
Expectations of renminbi appreciation appear to impact foreign firm valuations both
through a general market-sentiment effect, which appears to reflect diminished fears of trade
35 We cluster standard errors at the level of sector as before.
20
sanctions and retaliation, and specific trade-related channels. In terms of the trade effects,
renminbi-appreciation expectations negatively impact firms selling inputs to China for its
processing trade. In contrast, such expectations do not negatively impact firms selling final
goods to China; if anything the effect on them is positive. There is some evidence as well that
renminbi appreciation positively affects firms competing with China in home and third markets,
but the effect is weaker for firms in sectors where China’s exports have large imported-input
content. Finally, there is evidence of a negative impact on financially-dependent firms which
may find it more costly to fund their investments as a result of the upward pressure on yields
resulting from reduced Chinese purchases of foreign treasury bonds.
These patterns remain when we control for firm-specific characteristics and sector, year
and country fixed effects. They are still evident when we control for local currency movements
associated with renminbi appreciation. They continue to hold when abnormal rather than total
stock returns is used as the dependent variable. Finally, placebo tests for similar effects on
adjoining days do not find them, suggesting that these stock-price responses are not being caused
by other events affecting market valuations.
Overall, the message is that across-the-board inferences are misleading. The impact of
renminbi appreciation, actual and prospective, on firms, sectors and countries will be very
different depending on their circumstances and the specific nature of their interaction with China.
21
Table 1. Number of Listed Firms
Country # of Firms Country # of Firms
ARGENTINA 17 JAPAN 1,159
AUSTRALIA 101 SOUTH KOREA 538
AUSTRIA 30 MALAYSIA 228
BELGIUM 34 MEXICO 20
BRAZIL 39 NETHERLANDS 36
CANADA 199 NEW ZEALAND 8
CHILE 17 NORWAY 27
COLOMBIA 6 PAKISTAN 40
CZECH REPUBLIC 4 PERU 11
DENMARK 35 PHILIPPINES 8
EGYPT 21 POLAND 56
FINLAND 50 PORTUGAL 11
FRANCE 163 RUSSIAN FEDERATION 19
GERMANY 207 SINGAPORE 117
GREECE 77 SOUTH AFRICA 32
HONG KONG, SAR 142 SPAIN 34
HUNGARY 8 SWEDEN 74
INDIA 529 SWITZERLAND 82
INDONESIA 47 THAILAND 118
IRELAND 10 TURKEY 79
ISRAEL 35 UNITED KINGDOM 194
ITALY 87 UNITED STATES 1,304
Note: These are listed manufacturing firms in 44 economies on July 21, 2005
and June 21, 2010.
22
Table 2. Stock Market Returns and Exchange Rate Movements around Two PBOC Announcements COUNTRY Market return 2005 Exchange rate 2005 Market return 2010 Exchange rate 2010
(Exports to China/Exports to the world) -0.57*** 0.35 0.37
[0.21] [0.25] [0.25]
Component sector 0.19***
[0.030]
Imports from China/Imports from the World 0.46** 0.50** 0.42*
[0.23] [0.23] [0.23]
China's processing exports *Imports from China -0.65* -0.89*** -0.69**
[0.35] [0.30] [0.35]
China's processing exports 0.098
[0.10]
Firm-Size 0.038** 0.039** 0.039***
[0.015] [0.015] [0.015]
Book/Market 0.056** 0.059** 0.058**
[0.025] [0.026] [0.026]
Constant 0.45*** 0.35***
[0.027] [0.038]
Country fixed effects n y n y y
Date fixed effects n y n y y
Sector fixed effects n y n y y
Observations 42,860 42,234 42,458 41,847 41,847
R-squared 0.001 0.065 0.001 0.065 0.065
Note: Robust standard errors in brackets; *** p<0.01, ** p<0.05, * p<0.1. The sample is for ten perceived renminbi
policy changes from 2003 to 2010 as listed in Table 10. The sample is for listed firms in 44 countries for the sectors of
manufacturing. The trade channel is measured at the 4-digit sector level for the country where the listed firm
belongs. The key variables are measured with one-year lag. Standard errors are clustered at the level of sector.
32
Figure 1. Correlation of stock market return (vertical axis) and trade exposure to China (horizontal axis) around the time of two PBOC announcements Exports exposure to China, measured by exports to China over total exports, for PBOC announcement in 2005.
Exports exposure to China, measured by exports to China over total exports, for PBOC announcement in 2010.
imports from China, as measured by imports from China over total imports, for PBOC announcement in 2005.
imports from China, as measured by imports from China over total imports, for PBOC announcement in 2010 .
-10
12
0 .05 .1 .15 .2 .25expchn
mktchange Fitted values
-10
12
3
0 .05 .1 .15 .2expchn
mktchange Fitted values
-10
12
0 .05 .1 .15 .2impchn
mktchange Fitted values
-10
12
3
0 .05 .1 .15 .2impchn
mktchange Fitted values
33
References Ali, Shimelse and Uri Dadush (2010), “Who Gains from a Renminbi Revaluation?” VoxEU (9 December), www.voxeu.org. Ahmed, Shaghil (2009),"Are Chinese exports sensitive to changes in the exchange rate?," International Finance Discussion Papers 987, Board of Governors of the Federal Reserve System. Bernanke, Ben S. (2005). "The Global Saving Glut and the U.S. Current Account Deficit," speech delivered for the Sandridge Lecture at the Virginia Association of Economists, Richmond, March10, www.federalreserve.gov/boarddocs/speeches/2005/200503102/default.htm. Bernanke, Ben S., Bertaut, Carol, DeMarco, Laurie Pounder and Kamin, Steven, (2011), “International capital flows and the returns to safe assets in the United States, 2003-2007,” No 1014, International Finance Discussion Papers, Board of Governors of the Federal Reserve System. Blanchard, Olivier and Gian Maria Milesi-Ferretti (2011), “(Why) Should Current Account Balances Be Reduced?,” Staff Discussion Note, SDN/11/03. Cheung, Yin-Wong, Menzie D. Chinn, and Eiji Fujii (2010), “China's Current Account and Exchange Rate," in Robert C. Feenstra and Shang-Jin Wei, editors, "China's Growing Role in World Trade" University of Chicago Press (2010). Dominguez, Kathryn and Linda Tesar(2006), “Exchange Rate Exposure," Journal of International Economics 68, pp.188-218. Dooley, Michael, David Folkerts-Landau and Peter Garber (2009), “Bretton Woods II Still Defines The International Monetary System,” Pacific Economic Review 14(3), pages 297-311. Eichengreen, Barry (2007), “China’s Exchange Rate Regime: The Long and Short of It,” in Charles Calomiris (ed.), China’s Financial Transition at a Crossroads, New York: Columbia University Press, pp.314-342. Engel, Charles (2009), “Exchange Rate Policies,” Federal Reserve Bank of Dallas Staff Paper, Dallas: Federal Reserve Bank of Dallas. Evenett, Simon and Joseph Francois (2010), “Will Chinese Revaluation Create American Jobs?” VoxEU (April). Fama, Eugene F. and Kenneth. R. French (1992), The cross-section of expected stock returns. Journal of Finance 47(2): 427-465.
34
Forbes, Kristin (2004), “The Asian Flu and the Russian Virus: The International Transmission of Crises in Firm-Level Data,” Journal of International Economics 63, pp.59-92. Francois, Joseph (2010), “Deconstructing Sino-US Codependence: Revaluation, Tariffs, Exports and Jobs,” in Simon Evenett (ed.), The US-Sino Currency Dispute: New Insights from Economics Politics and Law, London, CEPR and VoxEU. Hanson, Gordon and Raymond Robertson (2010), “China and the Manufacturing Exports of Other Developing Countries,” in Robert Feenstra and Shang Jin Wei, eds., China’s Growing Role in World Trade, Chicago: University of Chicago Press and the NBER, 2010, 137-159. Garcia-Herrero, Alicia and Tuuli Koivu (2009), “China’s Exchange Rate Policy and Asian Trade,” Economie Internationale 116, pp.53-92. Griffin, John M., 2002, “Are the Fama and French Factors Global or Country Specific?” Review of Financial Studies 15, 783–803. Griffin, John M and Stulz, Rene M (2001), “International Competition and Exchange Rate Shocks: A Cross-Country Industry Analysis of Stock Returns," Review of Financial Studies 14, pages 215-41. Koopman, Robert, Zhi Wang, Shang-jin Wei (2008), “How Much of Chinese Exports Is Really Made in China? Assessing Foreign and Domestic Value-Added in Gross Exports”, United States International Trade Commission working paper. Koopman, Robert, William Powers, Zhi Wang, Shang-Jin Wei (2010), “Give Credit Where Credit Is Due: Tracing Value Added in Global Production Chains”, NBER Working Paper No. 16426. Lane, Philip and Milesi-Ferretti, Gian Maria, 2007, “The External Wealth of Nations Mark II: Revised and Extended Estimates of Foreign Assets and Liabilities, 1970-2004,” Journal of International Economics 73, 223–50. Ma, Jun and Wenjie Lu (2010), “Quantifying the Impact of RMB Appreciation,” Deutsche Bank Global Markets Research (21 June). Mackinlay, Craig, 1997, “Event Studies in Economics and Finance”, Journal of Economic Literature, Vol 35, pp.13-39.
35
Marquez, Jaime and Schindler, John W. (2006), “Exchange-Rate Effects on China's Trade: An Interim Report.” FRB International Finance Discussion Paper No. 861. Phylaktis, Kate and Ravazzolo, Fabiola (2005), “Stock Prices and Exchange Rate Dynamics,” Journal of International Money and Finance 24, pp. 1031-1053. Rajan, Raghuram and Luigi Zingales, 1998, “Financial Dependence and Growth,” American Economic Review 88, pp.559–86. Scott, Robert E. (2010), “Unfair China Trade Costs Local Jobs,” Economic Policy Institute Policy Brief no. 260 (March). Whited, Toni and Guojun Wu. 2006. Financial constraints risk. Review of Financial Studies, 19(2): 531-559.