Page 1
© 2014 – APL Apollo Tubes Ltd. All Rights Reserved | www.aplapollo.com
NSE Symbol: APLAPOLLO | BSE Code: 533758 | ISIN: INE702C01019
the fastest growing manufacturer of ERW steel tubes, pipes and hollow sections in India
CIN: L74899DL1986PLC023443
Investor PresentationApril 2015
Page 2
Safe Harbour
Except for the historical information contained herein, statements in this presentation and the
subsequent discussions, which include words or phrases such as "will", "aim", "will likely
result", "would", "believe", "may", "expect", "will continue", "anticipate", "estimate", "intend",
"plan", "contemplate", seek to", "future", "objective", "goal", "likely", "project", "should",
"potential", "will pursue", and similar expressions of such expressions may constitute
"forward-looking statements“. These forward looking statements involve a number of risks,
uncertainties and other factors that could cause actual results to differ materially from those
suggested by the forward-looking statements. These risks and uncertainties include, but are
not limited to our ability to successfully implement our strategy, our growth and expansion
plans, obtain regulatory approvals, our provisioning policies, technological changes,
investment and business income, cash flow projections, our exposure to market risks as well
as other risks. The Company does not undertake any obligation to update forward-looking
statements to reflect events or circumstances after the date thereof.
2Investor Presentation - APL Apollo Tubes Limited
Page 3
Contents
Industry01
Financials03
Road Ahead04
3Investor Presentation - APL Apollo Tubes Limited
Operations02
Page 4
© 2014 – APL Apollo Tubes Ltd. All Rights Reserved | www.aplapollo.com
NSE Symbol: APLAPOLLO | BSE Code: 533758 | ISIN: INE702C01019
the fastest growing manufacturer of ERW steel tubes, pipes and hollow sections in India
Industry
Page 5
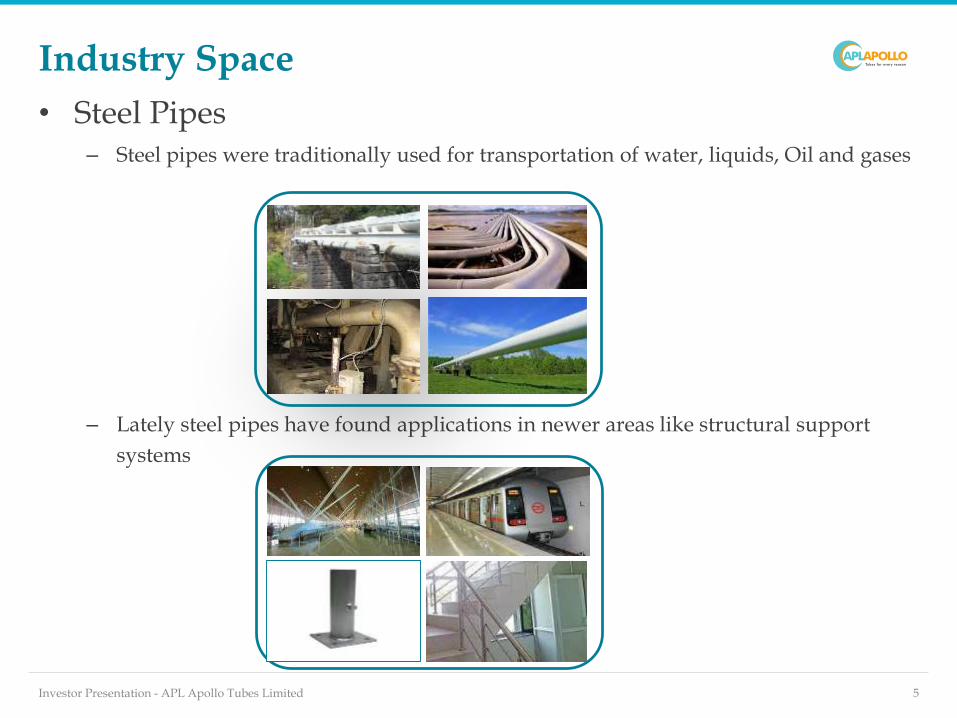
Industry Space
• Steel Pipes– Steel pipes were traditionally used for transportation of water, liquids, Oil and gases
– Lately steel pipes have found applications in newer areas like structural support
systems
Investor Presentation - APL Apollo Tubes Limited 5
Page 6
Industry Structure – Steel Tubes & Pipes
Steel Tubes & Pipes Industry
SAW(HSAW & LSAW)
ERW Precision (DOM)
ERW(Structural/ Commercial)
Oil &Gas, Water and sewage spiral
– long distance O&G and water transportation
Key Players
Jindal SAW, PSL,
Welspun Corp, Man
Industries, Ratnamani,
Automotive, White goods
Key Players
TI, Tata Steel,
Innoventive
Traditional: Engineering, Auto, Power, Oil & Gas (Last mile, city gas distribution), Water & sewage
New Age: Modern infrastructure –airport, malls, metros, bus-body, greenhouse structures, sprinklers, pre-fabricated structures, etc
Key players APL Apollo, Surya Roshni, Maharastra Seamless, Tata Steel, Welspun Corp, Bhushan Steels
Ductile Iron Seamless
Potable Water & Sewage
Transportation
Oil & Gas, Engineering,
Automotive and Power
Key Players
ISMT, Maharashtra
Seamless, Jindal SAW
Key Players
Electrosteel, Jindal
SAW, others
Welded
6Investor Presentation - APL Apollo Tubes Limited
Page 7
ERW Pipes – Advantages
Investor Presentation - APL Apollo Tubes Limited 7
• ERW pipes are manufactured using HRC (Hot Rolled coils)
– Thin walled pipes can be manufactured with closer tolerance to seamless pipes
– HRC can be used to make any shape of pipe
• Pipes offer greater economy
– Usage of HRC prevents wastage of material hence the scrap produced is very less
– Scrap from pipe is recycled and gets about 60% of steel price
• ERW pipes are no lesser in strength
– Newer applications in structural areas have proved the strength of ERW pipes as compared to
seamless pipes
• Versatile applications
– Not dependent on any one industry/sector
– The same ERW pipes can be used in multiple industries such as irrigation, construction,
fabrication, scaffoldings and many more
Page 8
Market Size
Investor Presentation - APL Apollo Tubes Limited 8
Global steel market (1,700 mn tonnes) / $1,000 bn
Welded steel (170 mn tonnes / $100 bn)
Indian ERW Steel tubes market ( 7 mn tonnes / $5 bn/Rs. 30,000 crore)
Source: Steel Ministry, Company Information as of FY 2014.
• India is among the leading ERW steel tubes manufacturing hubs in the world
– Other bigger manufacturers include China, Turkey, Italy and US
Page 9
Application of ERW Pipes
Investor Presentation - APL Apollo Tubes Limited 9
Traditional, 45%
Structural, 55%
APL Apollo’s Focus Area
Page 10
© 2014 – APL Apollo Tubes Ltd. All Rights Reserved | www.aplapollo.com
NSE Symbol: APLAPOLLO | BSE Code: 533758 | ISIN: INE702C01019
the fastest growing manufacturer of ERW steel tubes, pipes and hollow sections in India
Operations
Page 11
Pipe Making Process
Investor Presentation - APL Apollo Tubes Limited 11
HR Coil Folding Sheets Welding
ShapingCoolingTesting/Cut Off
Page 12
Manufacturing Facilities
12Investor Presentation - APL Apollo Tubes Limited
Hosur, Tamil Nadu
Unit No. 2
Page 13
Manufacturing Capacity
13Investor Presentation - APL Apollo Tubes Limited
Only player with manufacturing facilities across North, South and West India. Current capacity utilization is 85%.
Unit 1
Sikandarabad
Uttar Pradesh
180,000 MTPA Apollo Metalex
Sikandarabad
Uttar Pradesh
100,000 MTPA
SLMUL
Bangaluru
Karnataka
80,000 MTPA
Unit 2
Hosur
Tamil Nadu
270,000 MTPA
Lloyds Linepipes
Murbad
Maharashtra
210,000 MTPA
*Manufacturing capacity as on March, 2015
Page 14
Manufacturing Value Chain
14Investor Presentation - APL Apollo Tubes Limited
Power & Fuel
1.5%
Manpower
1.2%
Transportation
2.5%
Miscellaneous
1.8%
Margin
8.0%
Raw Material
85.0%
Page 15
Pricing
• Related to raw material price
– Direct linkage – HR coils prices are directly linked to steel prices
(Updated on 1st of every month)
– The increase / decrease in prices is directly passed on to customers
• 80 – 85% is raw material cost
• Transportation cost have a significant impact on total costs.
– Ranges between 4-8%. So the marginal players find it to difficult to
compete on an all India scale
• APL sells its products directly to distributors
Investor Presentation - APL Apollo Tubes Limited 15
Page 16
Product Information
Products MS Black Galvanized TubesPre-Galvanized
TubesHollow Sections
Size Range 21.3 – 335 mm 21 – 273 mm 19 – 127 mm15x15 - 250 x 250 mm15x 10 – 300x 200 mm
Products
Uses
Construction, Water & Sewage treatment, Converyors, Automobiles
Over and underground piping, Agriculture, General Engineering
Fencing, Cabling and Ducting, Green house structures, Electric Conduit Pipes
Construction, Transportation systems, Mining, Process Engineering
16Investor Presentation - APL Apollo Tubes Limited
Page 17
Revenue Breakup & Margin Profile
17Investor Presentation - APL Apollo Tubes Limited
Hollow Sections, 35%
MS Black, 25%
Pre-Galvanized Tubes, 24%
Galvanized Tubes, 16%
Revenue Break Up Product-wise (FY14)
5%
8%
14%
8%
0%
2%
4%
6%
8%
10%
12%
14%
16%
MS Black GalvanizedTubes
Pre-GalvanizedTubes
HollowSections
Product Margin Profile (FY14)
• Company plans to almost double its galvanized tube production capacity in near future.
4 - 6%
7 - 9%
13 - 15%
7 - 9%
Page 18
Advantage
APL Apollo
Distribution Network
Range of Products
Low Production
Costs
Fragmented Industry
Competition
New Products
Branding
APL – The Key Differentiators
18Investor Presentation - APL Apollo Tubes Limited
Page 19
Supply Chain
Investor Presentation - APL Apollo Tubes Limited 19
Distributors, 80%
Direct, 20%
State wise Wholesalers
District wise Distributors
Retailers
3 – Tier Distribution
• APL Apollo had 300 distributors and 26 warehouses as of FY 2014
Source: Company Information as of FY 2014.
Page 20
Extensive distribution network
Distribution network Zone-wise sales break-up
North, 16%
West, 28%
South, 45%
Central, 1%
Export, 6%Others, 4%
FY14
20Investor Presentation - APL Apollo Tubes Limited
• Wider geographical reach offers advantage over competitors by reducing logistics cost and lead time
• Proximity to key raw material procurement and client base ensures quicker delivery and lower risk of
transit damage
Page 21
Significant Range
Investor Presentation - APL Apollo Tubes Limited 21
400 + varieties of tubes
across wide range of
diameters and thickness
Recent developments:
― Colour-coated tubes
― Designer tubes
― Steel frames for doors
― Dynamically balanced
tubes
― API Tubes
Diameter Thickness
APL – ½” to 14”
2nd Largest peer –
½” to 20”
Varied diameters
APL – 0.7 mm to 10 mm
2nd largest peer –
2mm to 12mm
Local players –
2mm to 4mm
Page 22
Low Production Costs
• The company has cost advantages with respect to peers due
to the following reasons:
– Country wide manufacturing facilities -> Access to raw material
and dispatch of finished goods cheaper than competition
– Inline galvanizing facilities Reduces manufacturing costs for zinc
coating
– Low maintenance Lesser upkeep capex
Investor Presentation - APL Apollo Tubes Limited 22
Page 23
Fragmented Industry
• The industry is highly
fragmented with few large
players holding ~40% of the
pie
• Industry has not seen
significant capacity addition
over past 10 – 12 years,
primarily due to
– Low margin high volumes
business
– Need for strong R&D expenses
– Setting up of pan-country
distribution channel
Investor Presentation - APL Apollo Tubes Limited 23
There are ~1,000
SMEs (Small and
Medium enterprises)
operating in
unorganized segment
(3 lakh TPA)
60%Unorganized
40%Organized
(4 lakh TPA)(7 lakh TPA)
(4 lakh TPA)
Source: Steel Ministry, Company Information as of FY 2014.
(3 lakh TPA)
(2 lakh TPA) (2.8 lakh TPA)
Page 24
Competitive Landscape
• The competitors are not very active / aggressive in ERW space
– Competitors are focusing on selling the products in Tier I cities whereas APL is focusing
purely on Tier II & III cities
– Company has entered into focussed branding to compete aggressively with its peers
Investor Presentation - APL Apollo Tubes Limited 24
Players ERW segment
Surya Roshni • Company has diversified interests such as lighting, home appliances, and PVC pipes
• Operates with an installed capacity of 6,00,000 T. P.A. of ERW pipes
Bhushan Steel • Company’s financial status is not stable• A possible target for acquisition
Jindal India (B.C. JindalGroup)
• Manufactures only large diameter pipes, fusion bonded epoxy coated pipes, black and galvanized steel pipes
Jindal Pipes (D.P. JindalGroup)
• Manufactures Black, Galvanized steel tubes apart from hollow sections
• Operates with an installed capacity of 2,50,000 T.P.A of ERW pipes
TATA • Tata Pipes and Tata Structural steel hollow sections are manufactured by the High Frequency Induction Welding (HFIW) process
• Tubes are a small part of the entire steel business
Page 25
New Products
25Investor Presentation - APL Apollo Tubes Limited
• Door Frames: The Company has designed and patented door frames for use in
low-cost housing for the first time ever in India. These offer the following benefits:
• Cheaper by a third compared to wooden door frames
• Better strength and durability and can last close to 20 years without any wear
and tear
• High resale value of scrap
• Colour Coated Pipes: This will also be a first in India and offers the following
benefits:
• Pipe is colour coated at the production stage itself
• This results in better finish, longer life and lowers costs
• This is an established format in European countries where ERW pipes are sold
in a pre coloured format
Page 26
New Products
26Investor Presentation - APL Apollo Tubes Limited
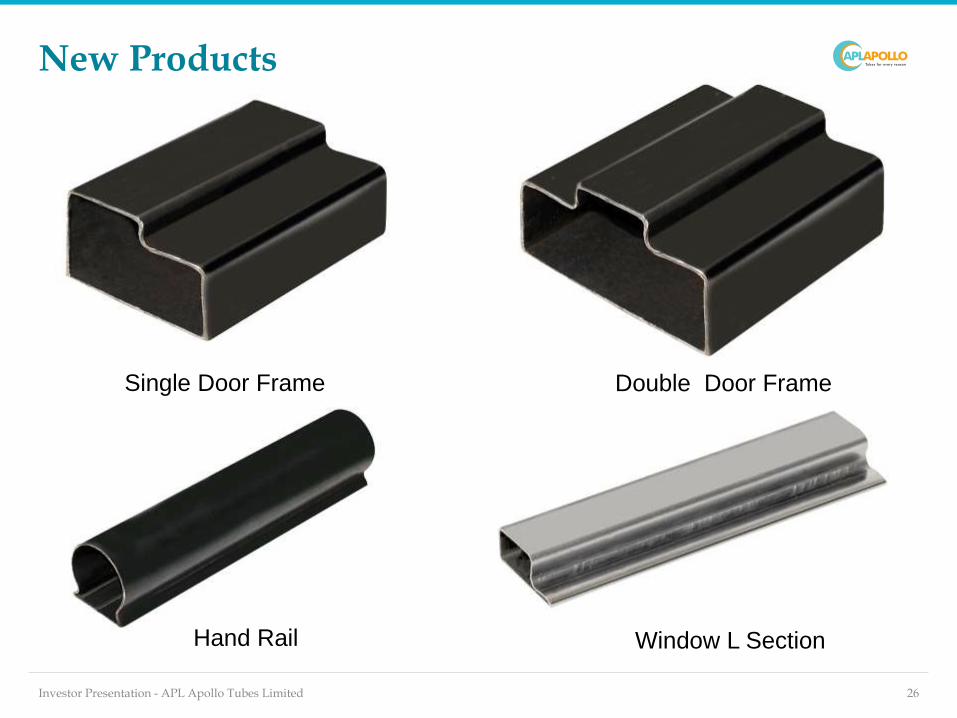
Single Door Frame Double Door Frame
Hand Rail Window L Section
Page 27
Branding
27Investor Presentation - APL Apollo Tubes Limited
• Intense focus on branding to garner a larger share of the market
• Targeting about 30,000 signage boards across the country for higher visibility
• Focused efforts at sponsoring plumbing meets and dealer meets and participation
in exhibitions in India and across the world
• One-of-a-kind “Fabricators and Plumbers” meet is being organized across the
length and breadth of the country to generate interest in APL Apollo’s products
among end users.
• The above meets have at least 100-150 participants and our technical and marketing
team give insights on products along with the advantages of using these products
• Star Cruise for 4 days organized for over 1000 dealers and distributors in Singapore
and Malaysia
• Approximate budget for branding in the current fiscal is about Rs. 10 crore.
Page 28
Branding
28Investor Presentation - APL Apollo Tubes Limited
Branding on Buses Signages on Highways
Fabricators MeetFabricators Meet
Page 29
© 2014 – APL Apollo Tubes Ltd. All Rights Reserved | www.aplapollo.com
NSE Symbol: APLAPOLLO | BSE Code: 533758 | ISIN: INE702C01019
the fastest growing manufacturer of ERW steel tubes, pipes and hollow sections in India
Financials
Page 30
Continuous Growth
30Investor Presentation - APL Apollo Tubes Limited
• Gross Revenue is expected to grow at a CAGR of 38% while volume CAGR is expected to be
around 32% from FY10 to FY15 E
• Company was able to maintain the growth momentum in spite of slowness of demand in the
industry in last 2-3 years
Sales/Volume
FY10 FY11 FY12 FY13 FY14 FY 15 E
Gross Revenue (INR m) 6,659 9,851 15,362 22,471 28,619 33,780
Volumes (LTPA) 1.7 2.0 2.9 4.6 5.7 6.8
0.0
1.0
2.0
3.0
4.0
5.0
6.0
7.0
8.0
0
5,000
10,000
15,000
20,000
25,000
30,000
35,000
40,000
LTPA – Lakh Tonnes Per Annum
Page 31
EBITDA
31Investor Presentation - APL Apollo Tubes Limited
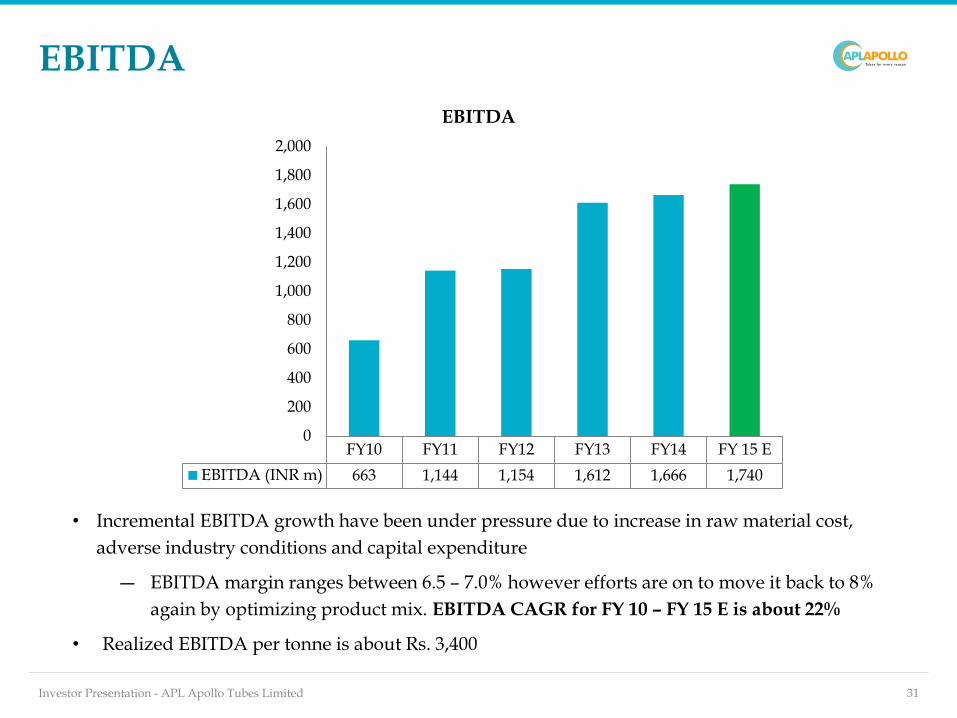
• Incremental EBITDA growth have been under pressure due to increase in raw material cost,
adverse industry conditions and capital expenditure
― EBITDA margin ranges between 6.5 – 7.0% however efforts are on to move it back to 8%
again by optimizing product mix. EBITDA CAGR for FY 10 – FY 15 E is about 22%
• Realized EBITDA per tonne is about Rs. 3,400
EBITDA
FY10 FY11 FY12 FY13 FY14 FY 15 E
EBITDA (INR m) 663 1,144 1,154 1,612 1,666 1,740
0
200
400
600
800
1,000
1,200
1,400
1,600
1,800
2,000
Page 32
Q3 2015 Highlights 9 M Analysis ( Dec 2014 vs Dec 2013)
• Consistent Revenue growth – 20% YoY growth over corresponding quarter
• EBITDA has also grown by 20% for the same period
• EPS has shown a sharp uptick of 27% to finish at 24.3 for the period ending Dec 31, 2014
32Investor Presentation - APL Apollo Tubes Limited
Particulars (INR mn.) Dec 2014 Dec 2013 YoY (%)
Net Revenue 22,880 18,950 21%
EBITDA 1,480 1,233 20%
Margin % 6.5% 6.5%
PAT 570 448 27%
EPS 24.3 19.1 27%
Page 33
Working Capital Management
33Investor Presentation - APL Apollo Tubes Limited
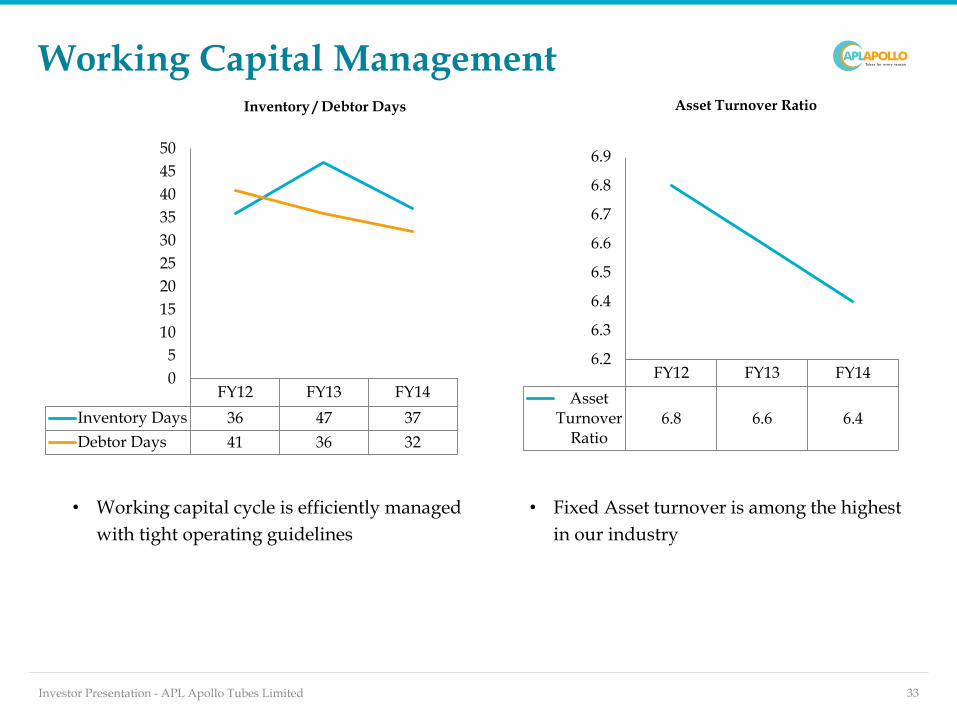
• Working capital cycle is efficiently managed
with tight operating guidelines
Inventory / Debtor Days Asset Turnover Ratio
FY12 FY13 FY14
Inventory Days 36 47 37
Debtor Days 41 36 32
0
5
10
15
20
25
30
35
40
45
50
FY12 FY13 FY14
AssetTurnover
Ratio6.8 6.6 6.4
6.2
6.3
6.4
6.5
6.6
6.7
6.8
6.9
• Fixed Asset turnover is among the highest
in our industry
Page 34
Debt / EBITDA and Optimal Leverage
• Debt / EBITDA has been maintained in the
range of 2.4 – 2.9 for last 5 years.
34Investor Presentation - APL Apollo Tubes Limited
FY12 FY13 FY14
Debt / EBITDA(x)
2.6 2.6 2.9
2.52.52.62.62.72.72.82.82.92.93.0
Debt / EBITDA
FY12 FY13 FY14
D/E(x) 1.01 1.16 1.12
Int. CoverageRatio (x)
3.16 3.42 2.43
0.00
0.50
1.00
1.50
2.00
2.50
3.00
3.50
4.00
Leverage Ratios
• Optimal leverage with D/E kept close to
1x
– Long-term Debt (FY14): Rs.1,396 mn.
– Working-capital Loan (FY14): Rs.
3,403 mn.
Page 35
Higher Returns
35Investor Presentation - APL Apollo Tubes Limited
• RONW expected to move back to 18-20% levels in the coming years
RONW
FY12 FY13 FY14
RONW 18.3% 20.6% 14.9%
10.0%
12.0%
14.0%
16.0%
18.0%
20.0%
22.0%
Page 36
Dividend Payout
36Investor Presentation - APL Apollo Tubes Limited
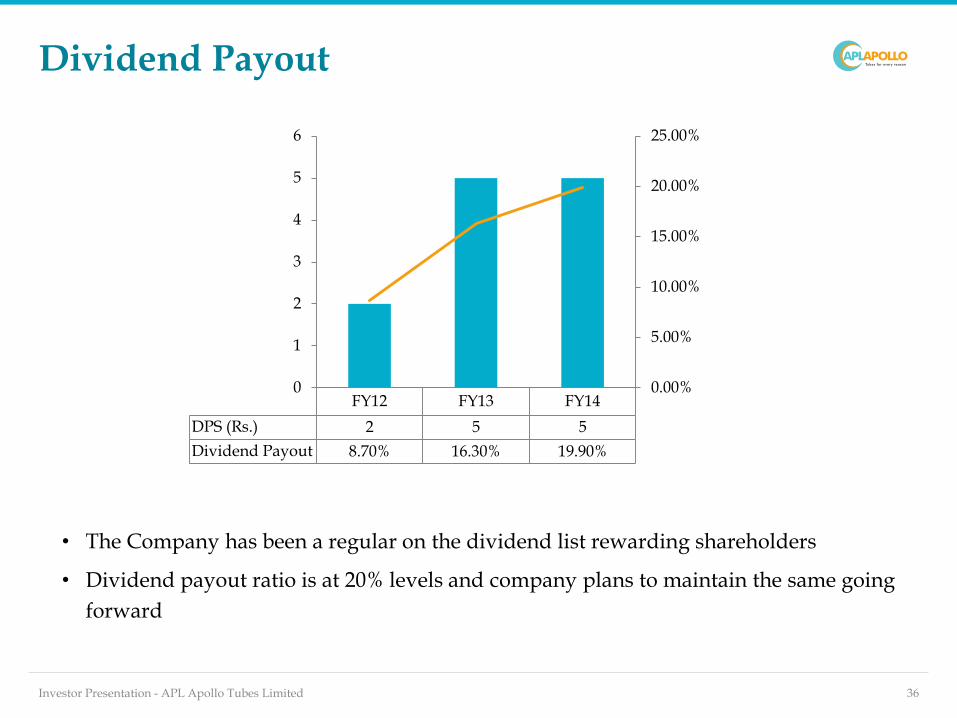
• The Company has been a regular on the dividend list rewarding shareholders
• Dividend payout ratio is at 20% levels and company plans to maintain the same going
forward
FY12 FY13 FY14
DPS (Rs.) 2 5 5
Dividend Payout 8.70% 16.30% 19.90%
0.00%
5.00%
10.00%
15.00%
20.00%
25.00%
0
1
2
3
4
5
6
Page 37
Income Statement
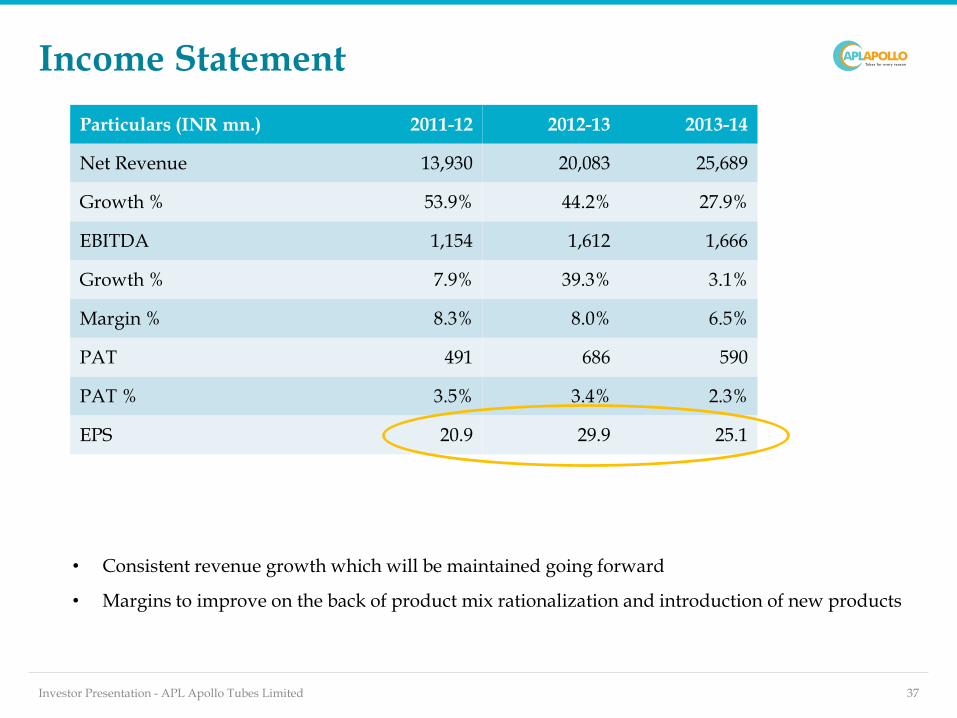
• Consistent revenue growth which will be maintained going forward
• Margins to improve on the back of product mix rationalization and introduction of new products
37Investor Presentation - APL Apollo Tubes Limited
Particulars (INR mn.) 2011-12 2012-13 2013-14
Net Revenue 13,930 20,083 25,689
Growth % 53.9% 44.2% 27.9%
EBITDA 1,154 1,612 1,666
Growth % 7.9% 39.3% 3.1%
Margin % 8.3% 8.0% 6.5%
PAT 491 686 590
PAT % 3.5% 3.4% 2.3%
EPS 20.9 29.9 25.1
Page 38
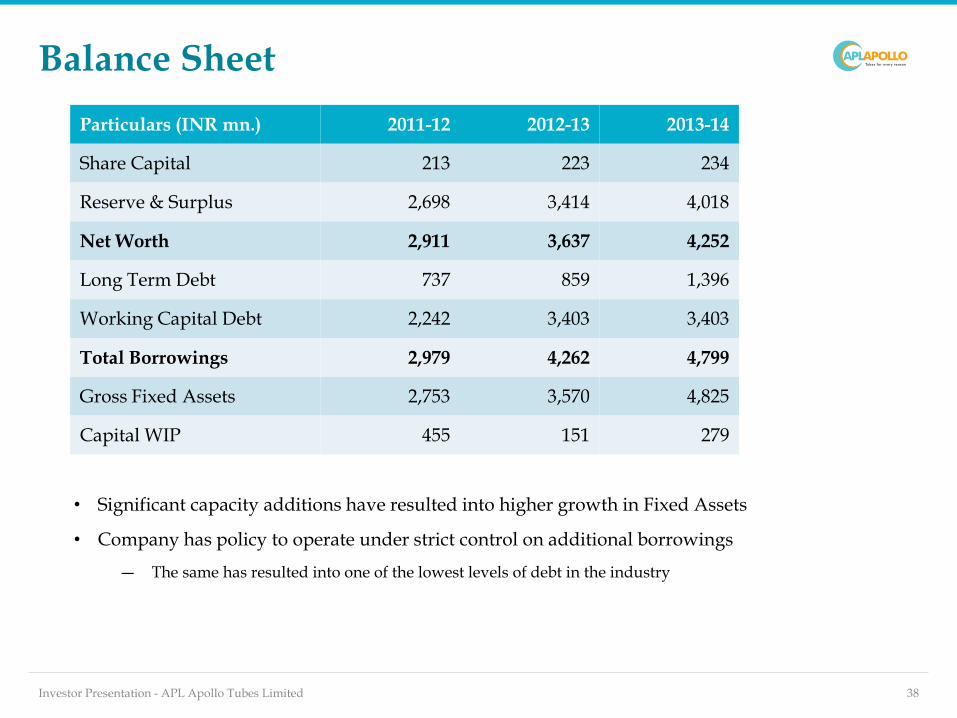
Balance Sheet
Particulars (INR mn.) 2011-12 2012-13 2013-14
Share Capital 213 223 234
Reserve & Surplus 2,698 3,414 4,018
Net Worth 2,911 3,637 4,252
Long Term Debt 737 859 1,396
Working Capital Debt 2,242 3,403 3,403
Total Borrowings 2,979 4,262 4,799
Gross Fixed Assets 2,753 3,570 4,825
Capital WIP 455 151 279
• Significant capacity additions have resulted into higher growth in Fixed Assets
• Company has policy to operate under strict control on additional borrowings
― The same has resulted into one of the lowest levels of debt in the industry
38Investor Presentation - APL Apollo Tubes Limited
Page 39
Peer Comparison
Note: Surya Roshi & Tube Investments Revenue & EBITDA has been taken only for the tube business however the other metrics are on company level. NM: Not meaningful. Jindal SAW reported loss in FY14.
39Investor Presentation - APL Apollo Tubes Limited
Peers / Metrics APL Apollo Jindal SAW Surya Roshni Tube Investments
Revenue (FY14) (INR mn.)
25,689 66,558 20,527 12,375
EBITDA (FY14) (INR mn.)
1,666 6,401 1,045 1,752
Market Cap (INR mn.)
10,641 16,490 4,852 70,470
P / E 11.5x NM* 10.1x 19.0 x
ROCE (FY 14) 12.5% 5.4% 8.0% 6.1%
RONW (FY 14) 14.9% NM* 7.1% 7.8%
Market Cap as on 15 April , 2015.
• APL Apollo has fared much better on giving higher shareholder’s return as compared to all its peers.
• APL trades almost at par with its peers i.e. the stock is not expensive on P/E basis.
Page 40
Stock Price Performance
• APL Apollo outperformed Sensex , BSE Metal Index and Mid Cap Index over past one year
− The share price has more than doubled from Rs.195 on April 2, 2014 to Rs 454 on April 15, 2015
40Investor Presentation - APL Apollo Tubes Limited
Source: BSE.
75
150
225
300
Apr-14 Jun-14 Aug-14 Oct-14 Dec-14 Feb-15 Apr-15
LTM Stock Price Performance
APL Sensex Metal Index Mid Cap Index
230
128
99
155
Page 41
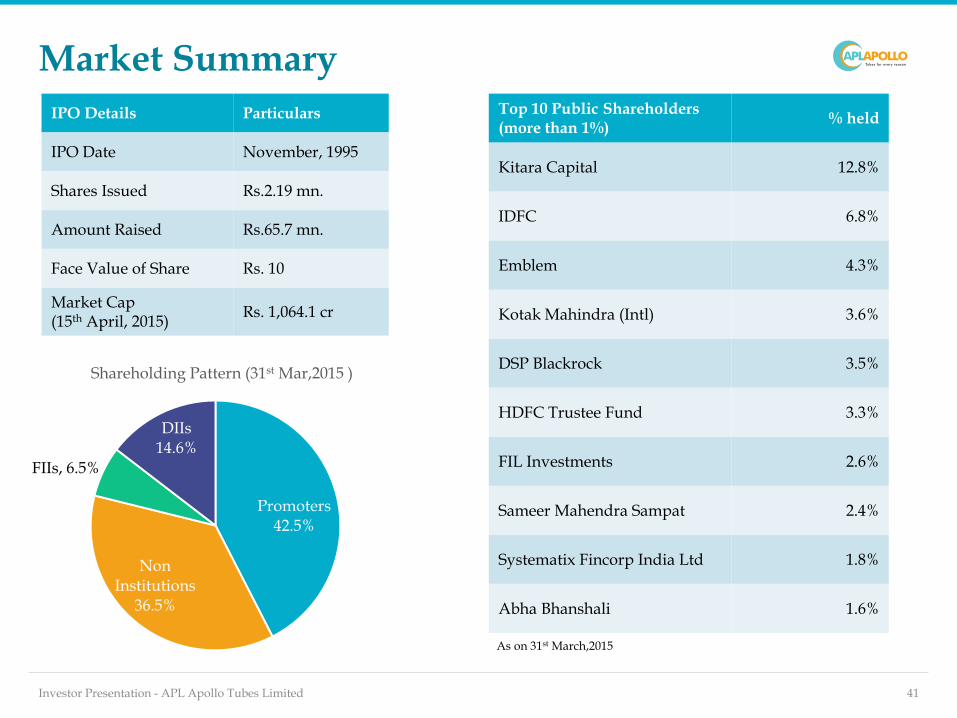
Market Summary
IPO Details Particulars
IPO Date November, 1995
Shares Issued Rs.2.19 mn.
Amount Raised Rs.65.7 mn.
Face Value of Share Rs. 10
Market Cap(15th April, 2015)
Rs. 1,064.1 cr
41Investor Presentation - APL Apollo Tubes Limited
Promoters42.5%
Non Institutions
36.5%
FIIs, 6.5%
DIIs14.6%
Shareholding Pattern (31st Mar,2015 )
Top 10 Public Shareholders (more than 1%)
% held
Kitara Capital 12.8%
IDFC 6.8%
Emblem 4.3%
Kotak Mahindra (Intl) 3.6%
DSP Blackrock 3.5%
HDFC Trustee Fund 3.3%
FIL Investments 2.6%
Sameer Mahendra Sampat 2.4%
Systematix Fincorp India Ltd 1.8%
Abha Bhanshali 1.6%
As on 31st March,2015
Page 42
© 2014 – APL Apollo Tubes Ltd. All Rights Reserved | www.aplapollo.com
NSE Symbol: APLAPOLLO | BSE Code: 533758 | ISIN: INE702C01019
the fastest growing manufacturer of ERW steel tubes, pipes and hollow sections in India
Road Ahead
Page 43
Vision FY 17: 1MTPA
Achieve 1MTPA production by FY 2017 and volume growth of over 25% p.a.
1mn MTPAproduction $1bn
turnover
• Proven ability to tap
industry demand and
grow sales volumes
above 30% sustainably
• Value added products
to replace low margin
products
• Greater focus on
product and corporate
branding
• Well-planned Roadmap
for capacity addition
across plants
• Profitable operations to
fund capex through
internal accruals
• Highly solvent Balance-
Sheet to support scaled
up operations
43Investor Presentation - APL Apollo Tubes Limited
Transformation into a Consumer Products Company
Page 44
Investments Required
• Planning greenfield projects of approximately 1 – 1.2
LTPA each in Eastern India and Middle East (Dubai)
• Capital cost of Rs. 100 crore for the two plants to be
funded through internal accruals
44Investor Presentation - APL Apollo Tubes Limited
Page 45
Financial Estimates
45Investor Presentation - APL Apollo Tubes Limited
• Revenue and Volume are expected to grow at a CAGR of roughly 22% for the period
2015 – 2017.
FY 15 E FY 16 E FY 17 E
Revenue ( in INR m) 33,780 42,000 49,980
Volume ( '000 TPA) 675 840 1000
0
200
400
600
800
1000
1200
0
10,000
20,000
30,000
40,000
50,000
60,000
Page 46
Investment Rationale
• Largest player in the ERW segment in India
• Nation wide operations with 5 plants across the length and breadth
of the country
• Strong distribution network with over 400+ distributors and 26
dealers
• Wide variety of products (400+) catering both to structural
applications and traditional usage
• Strong revenue and volume growth expected for the next 3 years
• Consistent dividend payout ratio
• Stock has outperformed all the indices on the market over the last 12
months
46Investor Presentation - APL Apollo Tubes Limited
Page 47
Contact
For any Investor Relations queries, please contact:
Deepak Goyal, CFO
APL Apollo Tubes Limited
Email:
[email protected]
Phone: +91 0120‐4041400
Diwakar Pingle
Christensen Investor Relations
Email: [email protected]
Phone: : +91 22 4215 0210
47Investor Presentation - APL Apollo Tubes Limited
Gaurav Sud
Kanav Capital
Email: [email protected]
Phone: : +91 98101 22432
Page 48
Thank You
48Investor Presentation - APL Apollo Tubes Limited