The fate and transport of nitrate in shallow groundwater in northwestern Mississippi, USA Heather L. Welch & Christopher T. Green & Richard H. Coupe Abstract Agricultural contamination of groundwater in northwestern Mississippi, USA, has not been studied extensively, and subsurface fluxes of agricultural chem- icals have been presumed minimal. To determine the factors controlling transport of nitrate-N into the Mis- sissippi River Valley alluvial aquifer, a study was conducted from 2006 to 2008 to estimate fluxes of water and solutes for a site in the Bogue Phalia basin (1,250 km 2 ). Water-quality data were collected from a shallow water-table well, a vertical profile of temporary sampling points, and a nearby irrigation well. Nitrate was detected within 4.4 m of the water table but was absent in deeper waters with evidence of reducing conditions and denitrification. Recharge estimates from 6.2 to 10.9 cm/ year were quantified using water-table fluctuations, a Cl – tracer method, and atmospheric age-tracers. A mathemat- ical advection-reaction model predicted similar recharge to the aquifer, and also predicted that 15% of applied nitrogen is leached into the saturated zone. With current denitrification and application rates, the nitrate-N front is expected to remain in shallow groundwater, less than 6–9 m deep. Increasing application rates resulting from intensifying agricultural demands may advance the nitrate-N front to 16–23 m, within the zone of ground- water pumping. Keywords Groundwater age . Nitrate . Recharge . Geochemical modeling . USA Introduction Nitrate is the primary form of dissolved nitrogen in natural waters (Mueller and Helsel 1996) and is one of the largest contributors to groundwater and surface-water contami- nation in the world. High concentrations of nitrate in groundwater have potential health effects on drinking- water sources (Ward et al. 2005), can lead to eutrophica- tion in streams where groundwater is a contributor to baseflow (Rabalais 2002), and can contribute to global warming (Galloway et al. 2003). Fertilizer use, livestock manure, soil mineralization, nitrogen fixation, and atmos- pheric deposition are the primary sources of N with farm fertilizer being one of the largest (Böhlke 2002). Increases in N fertilizer application have been significant since the late 1960s to 1970s as agricultural production has increased worldwide (Keeney 1986; Hallberg 1989). Between 1945 and 1985, the use of nitrogen fertilizer in the United States increased twenty-fold, from less than 1 million metric tons per year to more than 10 million metric tons (Mueller and Helsel 1996). As a result, several recent studies have noted concentrations above the drinking-water standards outlined by the World Health Organization (50 mg/L as NO 3 – ; World Health Organiza- tion 2004) and the US Environmental Protection Agency (10 mg/L as N; USEPA 2006) in countries like India, China, Denmark, and the USA (Agrawal et al. 1999; Chen et al. 2005; Liu et al. 2005; Hansen et al. 2011; Puckett et al. 2011). Nutrients, including NO 3 – as N (nitrate-N), are naturally occurring in soils, rocks, and the atmosphere, and a national background concentration of 1 mg/L has been established for nitrate-N in shallow groundwater (well depths ≤30 m) of the United States (Dubrovsky et al. 2010). Concentrations higher than the national back- ground can indicate influence from anthropogenic activ- ities (Dubrovsky et al. 2010). Due to the fertile soils in the Mississippi River alluvial plain, a region referred to locally as the Delta, the area is used extensively for agriculture. Although the primary land use is agricultural, there have been only low concentration detections of agricultural chemicals in water from pumping wells in the Mississippi River Valley alluvial (MRVA) aquifer, the irrigation source that under- lies the region. Landreth (2008) sampled 705 aquaculture and irrigation wells screened in the MRVA aquifer. Nitrate Received: 6 October 2010 /Accepted: 23 May 2011 Published online: 28 June 2011 * Springer-Verlag (outside the USA) 2011 H. L. Welch()) : R. H. Coupe US Geological Survey, 308 Airport Road, Jackson, MS 39208, USA e-mail: [email protected]Tel.: +1-601-9332900 Fax: +1-601-9332901 C. T. Green US Geological Survey, 345 Middlefield Road, Menlo Park, CA 94025, USA Hydrogeology Journal (2011) 19: 1239–1252 DOI 10.1007/s10040-011-0748-8
Transcript
The fate and transport of nitrate in shallow groundwater
in northwestern Mississippi, USA
Heather L. Welch & Christopher T. Green &
Richard H. Coupe
Abstract Agricultural contamination of groundwater innorthwestern Mississippi, USA, has not been studiedextensively, and subsurface fluxes of agricultural chem-icals have been presumed minimal. To determine thefactors controlling transport of nitrate-N into the Mis-sissippi River Valley alluvial aquifer, a study wasconducted from 2006 to 2008 to estimate fluxes of waterand solutes for a site in the Bogue Phalia basin(1,250 km2). Water-quality data were collected from ashallow water-table well, a vertical profile of temporarysampling points, and a nearby irrigation well. Nitrate wasdetected within 4.4 m of the water table but was absent indeeper waters with evidence of reducing conditions anddenitrification. Recharge estimates from 6.2 to 10.9 cm/year were quantified using water-table fluctuations, a Cl–
tracer method, and atmospheric age-tracers. A mathemat-ical advection-reaction model predicted similar recharge tothe aquifer, and also predicted that 15% of appliednitrogen is leached into the saturated zone. With currentdenitrification and application rates, the nitrate-N front isexpected to remain in shallow groundwater, less than6–9 m deep. Increasing application rates resulting fromintensifying agricultural demands may advance thenitrate-N front to 16–23 m, within the zone of ground-water pumping.
Keywords Groundwater age . Nitrate . Recharge .Geochemical modeling . USA
Introduction
Nitrate is the primary form of dissolved nitrogen in naturalwaters (Mueller and Helsel 1996) and is one of the largestcontributors to groundwater and surface-water contami-nation in the world. High concentrations of nitrate ingroundwater have potential health effects on drinking-water sources (Ward et al. 2005), can lead to eutrophica-tion in streams where groundwater is a contributor tobaseflow (Rabalais 2002), and can contribute to globalwarming (Galloway et al. 2003). Fertilizer use, livestockmanure, soil mineralization, nitrogen fixation, and atmos-pheric deposition are the primary sources of N with farmfertilizer being one of the largest (Böhlke 2002). Increasesin N fertilizer application have been significant since thelate 1960s to 1970s as agricultural production hasincreased worldwide (Keeney 1986; Hallberg 1989).Between 1945 and 1985, the use of nitrogen fertilizer inthe United States increased twenty-fold, from less than 1million metric tons per year to more than 10 millionmetric tons (Mueller and Helsel 1996). As a result, severalrecent studies have noted concentrations above thedrinking-water standards outlined by the World HealthOrganization (50 mg/L as NO3
–; World Health Organiza-tion 2004) and the US Environmental Protection Agency(10 mg/L as N; USEPA 2006) in countries like India,China, Denmark, and the USA (Agrawal et al. 1999; Chenet al. 2005; Liu et al. 2005; Hansen et al. 2011; Puckett etal. 2011). Nutrients, including NO3
– as N (nitrate-N), arenaturally occurring in soils, rocks, and the atmosphere,and a national background concentration of 1 mg/L hasbeen established for nitrate-N in shallow groundwater(well depths ≤30 m) of the United States (Dubrovsky et al.2010). Concentrations higher than the national back-ground can indicate influence from anthropogenic activ-ities (Dubrovsky et al. 2010).
Due to the fertile soils in the Mississippi River alluvialplain, a region referred to locally as the Delta, the area isused extensively for agriculture. Although the primaryland use is agricultural, there have been only lowconcentration detections of agricultural chemicals in waterfrom pumping wells in the Mississippi River Valleyalluvial (MRVA) aquifer, the irrigation source that under-lies the region. Landreth (2008) sampled 705 aquacultureand irrigation wells screened in the MRVA aquifer. Nitrate
Received: 6 October 2010 /Accepted: 23 May 2011Published online: 28 June 2011
* Springer-Verlag (outside the USA) 2011
H. L. Welch ()) :R. H. CoupeUS Geological Survey,308 Airport Road, Jackson, MS 39208, USAe-mail: [email protected].: +1-601-9332900Fax: +1-601-9332901
C. T. GreenUS Geological Survey,345 Middlefield Road, Menlo Park, CA 94025, USA
Hydrogeology Journal (2011) 19: 1239–1252 DOI 10.1007/s10040-011-0748-8
was detected in water from 20% of the wells, with amaximum detection of 2 mg/L. Previous studies also showthat water quality in the MRVA aquifer varies between twoidentified subunits. Twenty-five wells screened in Hol-ocene alluvium and 29 wells screened in Pleistocenevalley train deposits located in Arkansas, Louisiana,Mississippi, Missouri, and Tennessee were sampled aspart of the US Geological Survey’s National Water-QualityAssessment (NAWQA) program (Gonthier 2003). Nitrate-N was more frequently detected and at higher medianconcentrations in the valley train deposits than in thealluvium. When iron concentrations were greater than50 μg/L (under anoxic conditions), nitrate-N was notdetected or was present at concentrations less than 0.5 mg/L (Welch et al. 2009). These previous studies tended tofocus on the deeper portions of the aquifer currently in usefor irrigation. Although the shallowest portion of theaquifer is likely most strongly affected by modern waterand chemical uses, the water quality of this resourceremains uncharacterized.
The factors that dominate nitrate-N contamination ofgroundwater and how those factors interact with localconditions to contribute to groundwater concentrationsremain poorly understood. In some cases, low concen-trations have been attributed to high reaction rates at siteswith high concentrations of organic carbon or otherelectron donors (Korom 1992). In other cases, low ratesof vertical transport have been cited as a factor controllingnitrate-N fluxes in aquifers underlying fine-grained soils(National Research Council 1993). Because fine-grainedsoils are also commonly associated with high concen-trations of electron donors, the low concentrations of
nitrate-N in areas such as the Mississippi Delta could becontrolled by either effect. Quantitative comparisons offluxes from nitrate-N transport and reaction are needed todetermine factors controlling water quality in areas suchas the Mississippi Delta.
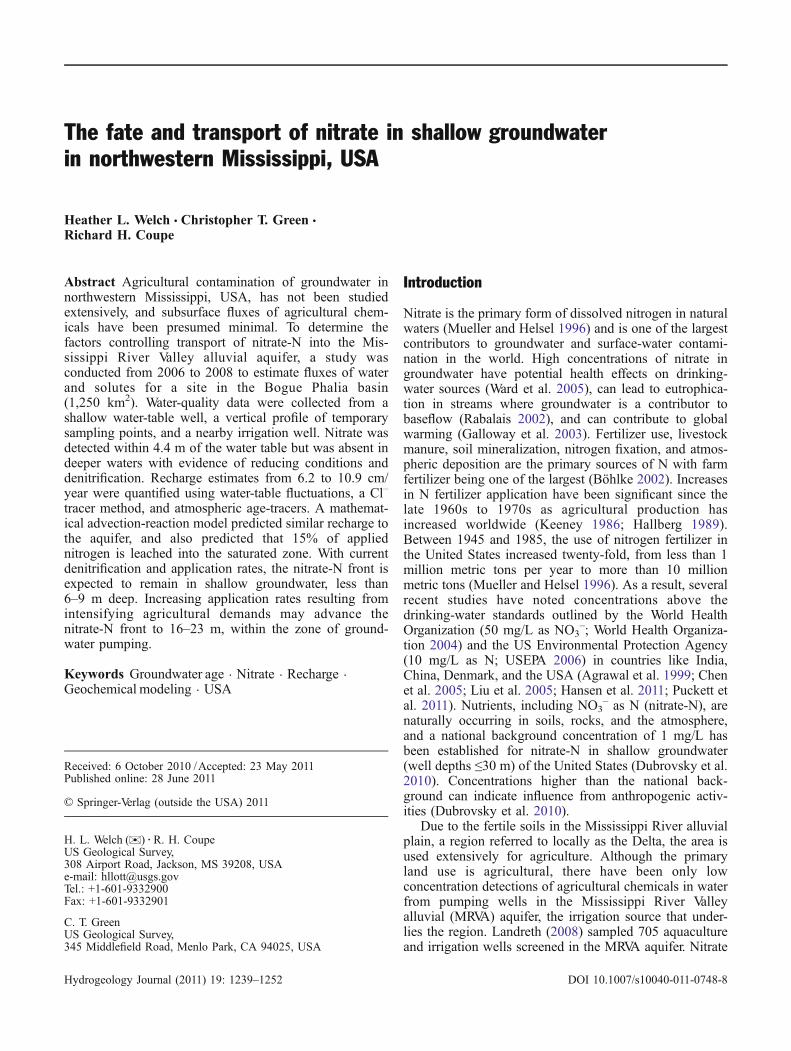
This report describes the results of a study designed tobetter understand the movement of nitrate-N through theunsaturated zone and groundwater in the delta environ-ment at a site in Bolivar County, Mississippi (Fig. 1).Groundwater chemistry was analyzed for a shallow wellscreened near the top of the water-table, a co-locatedvertical profile of five temporary sampling points, and adeep, abandoned irrigation well screened near the bottom,most-productive part of the MRVA aquifer. Groundwaterand nitrogen fluxes were estimated using geochemicalcharacterization, recharge estimates from analyses of Cl–
mass balances, water-table fluctuations, and age-tracerprofiles, as well as a mathematical model which wasinversely fitted to multiple tracer profiles, including Cl–,nitrate-N, and [N2,denit] (di-nitrogen gas produced bydenitrification). To evaluate the future effects of intensify-ing agriculture, groundwater quality responses fromvarious nitrogen input scenarios were modeled andprediction uncertainty was addressed.
Hydrogeology and study area description
The MRVA aquifer underlies an area of approximately18,000 km2 and 19 counties in northwestern Mississippi.The aquifer is composed of Quaternary age clay, silt, sand,and gravel deposited by the Mississippi River and its
EXPLANATIONBogue PhaliaBasin
SharkeyCommerceForestdaleDundeeAlligator
Bolivar County
0 5 10 MILES
0 5 10 KILOMETERS
Soils
CANADA
UNITEDSTATES
CUBAMEXICO
MississippiRiver
YazooRiverBasin
Bogue
Ph
alia
Directio
no
f riverflo
w
-91° 05´ -90° 38´
-33° 51´
-33° 27´
Fig. 1 Location of the study site in northwestern Mississippi (MS) and other agricultural study sites from the NAWQA program in theUnited States. WAWashington, CA California, NE Nebraska, IA Iowa, IN Indiana, MD Maryland
1240
Hydrogeology Journal (2011) 19: 1239–1252 DOI 10.1007/s10040-011-0748-8
tributaries (Arthur 1995). Average aquifer thickness is43 m with the coarse gravel at the bottom fining upwardinto a layer of silts and clays which form an upperconfining unit that ranges in thickness from less than 3 to30 m thick (Arthur 1994). The two subunits of the MRVAaquifer differ in environmental setting and geologic age.The Pleistocene valley train deposits are geologicallyolder and were deposited by high-energy braided streams.Sediments in the Pleistocene valley train deposits arecoarser in grain size, and the sand and gravel layer in thisportion of the aquifer is thicker and overlain by a thinnerclay and silt surficial unit than the Holocene alluvium(Autin et al. 1991; Saucier 1994). The younger Holocenealluvium was deposited by meandering stream depositsand overlies the Pleistocene valley train deposits except inareas where the alluvium has been eroded exposing thevalley train deposits.
Water-use data compiled in 2000 placed the MRVAaquifer as third largest in withdrawals of 66 largeaquifers across the United States (Maupin and Barber2005). Approximately 0.04 km3/day is being with-drawn, mainly for irrigation purposes (Maupin andBarber 2005). Regional groundwater flow prior topumping for irrigation was toward the Mississippi Riverand southward; however, modern pumping has reversedflow toward the inner parts of the Delta (Renken 1998).Transmissivity values from six pumping tests conductedfrom 1954 to 1971 at wells screened in the coarsegravel portion of the MRVA aquifer ranged from 1,100to 4,700 m2/day, and hydraulic conductivity valuesranged from 40 to 120 m/day (Slack and Darden 1991).Precipitation likely is the primary source of recharge, butother contributors could be streams, lakes, upward move-ment from underlying aquifers, or downward seepagefrom irrigated lands, and lateral groundwater flow fromthe Bluff Hills which bound the aquifer on the east(Boswell et al. 1968). Krinitzsky and Wire (1964) statedthat 5% of annual precipitation (approximately 6.6 cm) isrecharged to the aquifer. A previous groundwater flowmodel by Arthur (2001) estimated that aerial recharge tothe aquifer is 6.4 cm/year. A base-flow separationtechnique was used nationally to estimate values ofnatural groundwater recharge to the principal aquifers,which indicated that 12.7 to 25.4 cm is the mean annualrecharge to the MRVA aquifer from precipitation and theinteraction of groundwater with surface water (Reilly etal. 2008).
The Bogue Phalia basin (1,250 km2) is a watershed inthe Delta that lies within the larger Yazoo River basin(34,900 km2; Fig. 1). Most of the Bogue Phalia basin islocated in Bolivar County, MS. More than 90% of thecounty land use is for row-crop agriculture with the maincrops being cotton, corn, rice, sorghum, and soybeans(Coupe 2002). Cotton and corn planting occurs onDundee-type soils (fine-silty, mixed, active, thermic TypicEndoaqualfs) which compose 19% of the Delta land areaand have better drainage than the Sharkey clay (very-fine,smectitic, thermic Chromic Epiaquerts that cover 26% ofthe Delta land area), which occurs in the interstream areas
and is a dark, yellow waxy clay that tends to collect waterfor long periods of time (Fig. 1). Annual precipitation inthe basin ranges from 114 to 150 cm, and about half of theprecipitation returns to the stream as runoff from thefields, especially in the western part of the Delta wheresoils are much higher in clay content (Shaw et al. 2006).For the study period, annual precipitation ranged from aminimum of 92 cm in 2007 to a maximum of 132 cm in2006.
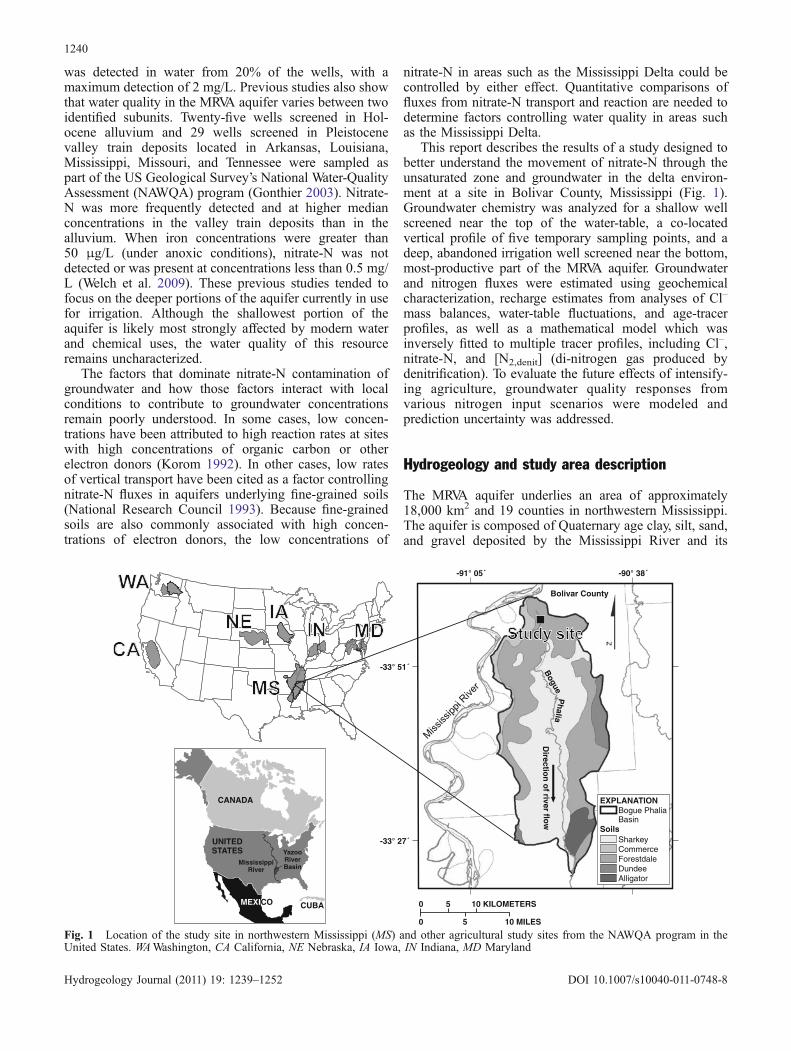
The study site is located in northwestern BolivarCounty just south of the headwaters of the BoguePhalia near the Mississippi River, in the top portion ofthe Bogue Phalia basin (Fig. 1). The site was selectedto investigate nitrate-N and water fluxes into the MRVAaquifer at a site in the Bogue Phalia basin with well-drained soils. Sediments in the shallow portion of theMRVA aquifer were characterized as well-sortedmedium sands, and the thickness of the fine-grainedunit overlying the aquifer was less than 3 m at the site(Arthur 1994). The local groundwater flow directionwas established using water levels collected bimonthlyat a network of five wells from June 2008 to May 2009(Fig. 2). Moving eastward from the Mississippi Rivertoward the Bogue Phalia at the study site, water levelsdecrease in elevation, on average, about 1.1 m/km.Hydrographs comparing rises and falls in the Missis-sippi River (located about 7.5 km away) show noinfluence on water levels in the MRVA aquifer at thestudy site. The sampled wells were located in a non-irrigated cotton field, while the rest of the land adjacentto and north of the field (which has historically beencotton) was planted with corn that was irrigated(Fig. 2). Although cotton and corn were the predom-inant crops at the site during the study period (2006–2008), the source area for the monitoring wells may belocated in areas that were used for the cultivation ofsorghum, rice, or soybeans.
Methods
In 2005, the Mississippi Embayment NAWQA study unitbegan collecting samples from air and rain, surface water,groundwater, and the unsaturated zone to investigate thesources, transport, and fate of agricultural chemicals in theBogue Phalia basin of northwestern Mississippi. To assessthe water quality of the MRVA aquifer at a site withrelatively permeable soils, water samples were collectedand analyzed for a variety of chemical constituents from ashallow water-table well, an irrigation well, and at avertical profile of temporary sample points. The two wellswere sampled nine times from 2006 to 2008 for major ionchemistry, nutrients, and field parameters (depth to water,pH, water temperature, specific conductance, dissolved O2
(DO), and turbidity). In addition, the five temporarysample points were sampled during June 2008 for SF6,CFCs, 3H, dissolved gases (CH4, N2, Ar, CO2, and O2),and stable isotope ratios of O and N in nitrate.
1241
Hydrogeology Journal (2011) 19: 1239–1252 DOI 10.1007/s10040-011-0748-8
Well installationThe study site in northwestern Bolivar County, MS, hadan existing 40.6-cm diameter well—hereafter referred toas the “irrigation well”—which was located approximately0.09 km west of the Bogue Phalia. The well has astainless-steel casing and is screened from 21.3 to 36.6 mbelow the land surface in the most productive, coarsegravel part of the MRVA aquifer. In April 2006, to betterunderstand the groundwater chemistry at the water table, ashallow 2.54-cm diameter PVC monitoring well—here-after referred to as the “water-table well”—was installedwith a screen from 8 to 10 m below the land surface usingdirect push methods. Once the PVC casing and screenwere installed, the bottom 3 m of the hole was backfilledwith sand and fine to coarse-grained bentonite up to theland surface. The well was later developed using aperistaltic-type pump until turbidity readings were lessthan 1 nephelometric turbidity unit (NTU). To characterizethe shallow geochemical gradient, five temporary sam-
pling points were installed in June 2008 using a directpush method at depths ranging from 11 to 18.3 m belowthe land surface (Table 1).
Groundwater samplingUsing a peristaltic-type pump at the water-table well and aportable, submersible pump at the irrigation well, samplecollection began after purging three casing volumes andstabilizing field measurements according to USGS proto-cols (Koterba et al. 1995). Sample collection from thetemporary sampling points differed in that Teflon tubingfrom the pump ran through the drill flights of the directpush equipment (the use of brand names in this report isfor identification purposes only and does not constituteendorsement by the US Geological Survey). The sameprotocols for purging and field parameter stabilizationwere followed. All samples were shipped overnight on icefor analysis at the USGS National Water-Quality Labo-
Gunnison
LOUISIANA
MISSISSIPPI
MISSISSIPPI RIVERN
1
1
BOGUE
PHALIA
C0029
C0032 C0005
IrrigationWell
32
EXPLANATIONBogue PhaliaBasinBogue Phalia
Water quality
Water levelC0032
0 1 MILE
0 1 KILOMETER
Groundwater Flow Direction
Groundwater Flow Direction
90°50´
Five co-locateddepthsMunicipality
32
32
Highway
90°57´
34°01´
33°56´
Water-tablewell
Fig. 2 Location of groundwater wells at the study site. The water-table well and five co-located depths are located at 33˚57’54”N latitudeand 90˚54’11”W longitude. The irrigation well is located at 33˚57’46”N latitude and 90˚53’29”W longitude
1242
Hydrogeology Journal (2011) 19: 1239–1252 DOI 10.1007/s10040-011-0748-8
ratory (NWQL) in Denver, CO. Major ions were measuredusing atomic absorption spectrometry, and nutrient con-centrations were quantified using colorimetry (Fishmanand Friedman 1989).
Stable isotope samples (δ15N and δ18O of nitrate) werecollected in a 125-ml amber polyethylene bottle with aconical-insert polyseal cap after the collection of theenvironmental sample. After field rinsing and collection ofthe isotope samples, the bottles were stored on ice. Oncecollection at all depth intervals was completed, the isotopesamples were filtered through a 0.2-μm filter, filling thebottle only three-fourths full. The bottles were then frozento prevent any biological reaction of the nitrogen-bearingspecies. Once nitrate-N concentrations were measured bythe NWQL, two samples containing nitrate-N>0.06 mg/Lwere shipped overnight on ice for analysis by the USGeological Survey Reston Stable Isotope Laboratory inReston, VA, using mass spectrometry (Révész andCasciotti 2007).
Water samples were analyzed for dissolved gases, 3H,chlorofluorocarbons CFCl3 (CFC-11), CF2Cl2 (CFC-12),and C2F3Cl3 (CFC-113), and SF6 to estimate apparentages of groundwater samples. Samples for 3H analysiswere unfiltered and collected in 1,000-ml polyethylenebottles with a polyseal cap after rinsing the bottle withsample water. Tritium samples were analyzed using thedirect liquid-scintillation counting method described byThatcher et al. (1977) at the US Geological SurveyTritium Laboratory in Menlo Park, CA.
Age-dating tracers were collected after the collectionof water for the analysis of nutrients, major ions, 3H,δ15N, and δ18O. All water samples were collectedusing nylon tubing with a 0.15-m length of Vitontubing in the peristaltic pumphead. CFCs werecollected in 125-mL glass bottles with foil-lined capsfollowing procedures outlined by the US GeologicalSurvey CFC laboratory (US Geological Survey 2009)in Reston, VA. All bottles were stored and shippedupside down to the CFC laboratory for analysis(Busenberg and Plummer 1992). Methane was detectedin some samples indicating conditions where CFCshave been known to degrade (Plummer et al. 1993).Concentrations of CFC-12, which is the most con-servative CFC, were used for groundwater age estima-tion because CFC-11 and CFC-113 tend to degrade inanaerobic conditions. SF6 samples were collected intwo 1-L plastic-coated safety amber glass bottlesaccording to established protocols (US GeologicalSurvey 2010). Bottles were shipped overnight to theReston CFC laboratory for analysis using the methoddescribed by Busenberg and Plummer (2000). Samplesfor analysis of dissolved gases (CH4, N2, CO2, O2, andAr) were collected in serum bottles with no headspaceand analyzed by gas chromatography after creation oflow-pressure headspace in the laboratory (US Geo-logical Survey 2006). Results of the analyses werecorrected for solubility in sample water at laboratorytemperatures and have typical uncertainties of ±1–2%.Dissolved gases were analyzed to estimate excess airTa
ble1
Sum
maryof
datacollected
inJune
2008
attwoperm
anentw
ellsandthefive
tempo
rary
samplingpo
intslocatedatthestud
ysitein
northw
estern
Mississippi.A
llconcentrations
inmg/Lun
less
otherw
iseno
ted.
Cation–anionbalances
alldiffered
less
than
2%
Type
ofwell
Screen
interval
(m)
Sam
ple
depth
(m)
Depth
towater
table
below
land
surface(m)
Depth
below
the
water
table(m
)
Specific
cond
uctance
(μS/cm)
Ca
Mg
KNa
Cl
Fl
Si
SO42–
TDS
NH4+
Nitrate–
NNO2–
PFe
Mn
CFC-12
apparent
agein
years
SF6
apparent
agein
years
Tritium
(pCi/
L)
Water-
table
8.3–9.8
9.5
7.5
2.0
822
121
32.6
1.50
12.0
9.19
0.40
21.1
31.4
504
ND
8.86
0.08
90.03
E0.00
60.36
234
.530
8.62
Tempo
rary
sample
point
9.9–11
10.7
7.5
3.2
884
120
33.4
1.83
13.5
110.34
21.7
35.5
529
0.087
5.9
0.04
90.04
5.42
0.91
646
NA
NA
Tempo
rary
sample
point
11.1–
12.2
11.9
7.5
4.4
897
128
36.9
2.25
15.1
9.95
0.30
17.3
36.3
524
0.030
ND
E0.00
10.08
4.8
0.95
930
9.5
NA
Tempo
rary
sample
point
12.3–
13.4
13.1
7.5
5.6
952
127
36.9
2.23
16.4
8.33
0.29
23.1
30.5
558
0.054
ND
E0.00
10.14
8.06
0.90
560
20NA
Tempo
rary
sample
point
14.8–
15.8
15.5
7.5
8.1
974
134
40.4
2.14
11.9
4.50
0.26
30.4
ND
573
0.101
ND
0.00
30.20
13.6
0.68
046
41NA
Tempo
rary
sample
point
17.2–
18.3
187.5
10.5
903
120
36.4
2.45
9.57
3.57
0.24
30.2
ND
546
0.103
ND
ND
0.17
17.4
0.63
460
39NA
Irrigatio
n21
.3–
36.6
25.9
8.3
17.6
580
7023
.23.37
11.6
3.93
0.31
36.2
0.67
348
1.92
ND
ND
1.15
10.4
0.23
3NA
NA
NA
ND
notdetected
(<0.18
forSO42–,<0.04
fornitrate-N,<0.00
2forNO2–);Eestim
ated;NAno
tavailable
1243
Hydrogeology Journal (2011) 19: 1239–1252 DOI 10.1007/s10040-011-0748-8
concentrations which affect calculated apparent agesfrom CFC and SF6 data (Plummer et al. 1993;Busenberg and Plummer 2000).
Dissolved gas calculationsIn groundwater, dissolved gases originate from equili-brium exchange with the atmosphere at the water table,and dissolution of entrapped air bubbles. Air bubbles canbecome trapped in recharging water and entrained in thesaturated zone. Similarly, denitrification produces N2 thatremains in solution in recharging groundwater. As long asthe hydrostatic pressure remains greater than the totalpressure of gases in solution, degassing is unlikely(Blicher-Mathiesen et al. 1998). In this report, the term“excess air” refers to atmospheric gases in excess ofatmospheric solubility, often caused by bubble entrain-ment during recharge (Aeschbach-Hertig et al. 2008), and“excess N2” refers to N2 originating from denitrification.
Excess air and excess N2 concentrations in groundwaterwere estimated using the concentration of N2 and Ar, theirsolubility in water (Weiss 1970), the atmospheric pressure,and the recharge temperature. Calculation of excess air andassumptions associated with the calculation are documentedby Green et al. (2008b). The recharge temperature used in thecalculation was based on the annual average groundwatertemperature in the water-table well (18.6°C).
Excess N2 derived from denitrification was calculatedusing
½N2;bub� ¼ ½airbub� � 34:8 ð1Þand
N2;denit
� � ¼ N2;meas
� �� N2;equil
� �T; elevð Þ � N2;bub
� �;
ð2Þwhere [N2,bub] is the N2 from entrained bubbles (μmol/L),34.8 is the conversion factor for the quantity of N2 pervolume of air (μmol/cm3) at standard temperature andpressure, [N2,denit] is the N2 from denitrification (μmol/L),[N2,meas] is the measured concentration of N2 in thesample (μmol/L), and [N2,equil](T,elev) is the concentrationof N2 in air-saturated water as a function of temperature, Tand elevation, elev.
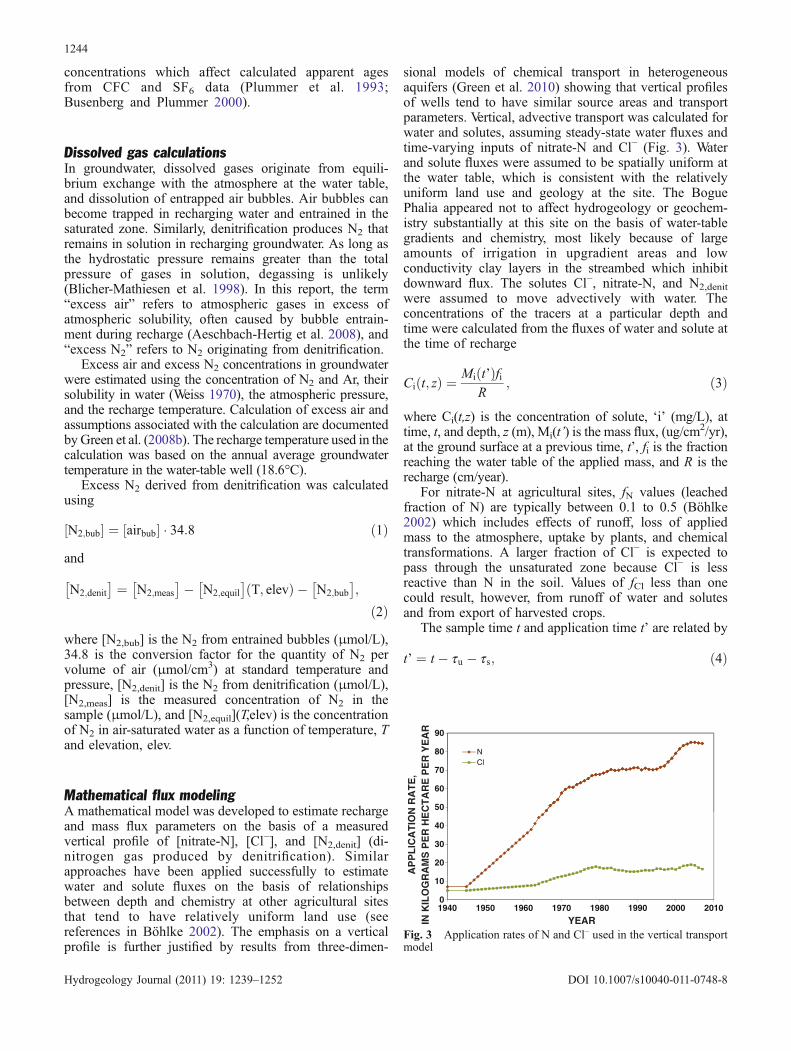
Mathematical flux modelingA mathematical model was developed to estimate rechargeand mass flux parameters on the basis of a measuredvertical profile of [nitrate-N], [Cl−], and [N2,denit] (di-nitrogen gas produced by denitrification). Similarapproaches have been applied successfully to estimatewater and solute fluxes on the basis of relationshipsbetween depth and chemistry at other agricultural sitesthat tend to have relatively uniform land use (seereferences in Böhlke 2002). The emphasis on a verticalprofile is further justified by results from three-dimen-
sional models of chemical transport in heterogeneousaquifers (Green et al. 2010) showing that vertical profilesof wells tend to have similar source areas and transportparameters. Vertical, advective transport was calculated forwater and solutes, assuming steady-state water fluxes andtime-varying inputs of nitrate-N and Cl− (Fig. 3). Waterand solute fluxes were assumed to be spatially uniform atthe water table, which is consistent with the relativelyuniform land use and geology at the site. The BoguePhalia appeared not to affect hydrogeology or geochem-istry substantially at this site on the basis of water-tablegradients and chemistry, most likely because of largeamounts of irrigation in upgradient areas and lowconductivity clay layers in the streambed which inhibitdownward flux. The solutes Cl−, nitrate-N, and N2,denit
were assumed to move advectively with water. Theconcentrations of the tracers at a particular depth andtime were calculated from the fluxes of water and solute atthe time of recharge
Ci t; zð Þ ¼ Mi t’ð ÞfiR
; ð3Þ
where Ci(t,z) is the concentration of solute, ‘i’ (mg/L), attime, t, and depth, z (m), Mi(t’) is the mass flux, (ug/cm2/yr),at the ground surface at a previous time, t’, fi is the fractionreaching the water table of the applied mass, and R is therecharge (cm/year).
For nitrate-N at agricultural sites, fN values (leachedfraction of N) are typically between 0.1 to 0.5 (Böhlke2002) which includes effects of runoff, loss of appliedmass to the atmosphere, uptake by plants, and chemicaltransformations. A larger fraction of Cl− is expected topass through the unsaturated zone because Cl− is lessreactive than N in the soil. Values of fCl less than onecould result, however, from runoff of water and solutesand from export of harvested crops.
The sample time t and application time t’ are related by
t’ ¼ t � tu � ts; ð4Þ
N
Cl
NCl
0
10
20
30
40
50
60
70
80
90
1940 1950 1960 1970 1980 1990 2000 2010
YEAR
AP
PL
ICA
TIO
N R
AT
E,
IN K
ILO
GR
AM
S P
ER
HE
CT
AR
E P
ER
YE
AR
Fig. 3 Application rates of N and Cl– used in the vertical transportmodel
1244
Hydrogeology Journal (2011) 19: 1239–1252 DOI 10.1007/s10040-011-0748-8
where τu is the unsaturated zone travel time and τs is thesaturated zone travel time. The unsaturated zone traveltime, in years, is estimated with
tu ¼ nuHu
R; ð5Þ
where nu is the unsaturated zone mobile water contentwhich is the specific volume through which the unsatu-rated zone water is transported and Hu is the unsaturatedzone thickness, in meters. The saturated zone travel time,in years, is estimated with
ts ¼ nsHs
Rln
Hs
Hs � z
� �; ð6Þ
where ns is the saturated mobile water content (assumed tobe approximately equal to the effective porosity), Hs is thesaturated zone thickness, in meters, and z is the depth of thesample point below the water table (Cook and Böhlke 2000)based on the assumption the aquifer system is homogeneous.
Values of Mi (kg/ha/year) were estimated for Cl− andnitrate-N (Fig. 3) using records of county agriculturalchemical use compiled from 1960–2008 (US Departmentof Agriculture 2010a, b). Modeled [nitrate-N] wasestimated using zero-order kinetics,-
nitrate �N½ � ¼ NO�3
h i0� tsk for NO�
3
h i0> tsk; ð7aÞ
nitrate �N½ � ¼ 0 for NO�3
h i0� tsk ð7bÞ
where [NO3–]0 is the original nitrate-N concentration
before denitrification, equal to [nitrate-N]+[N2,denit], andk is the zero order decay coefficient.
This parsimonious model of flow and transport was usedto calibrate values of adjustable parameters (Table 2). Otherfield-verified parameters, such as Hs and Hu, were heldconstant at measured values. The calibrated parameters werechanged to minimize the objective function, Φ, relatingmeasured and modeled [nitrate-N], [N2,denit], and [Cl−].
F ¼Xmi¼1
wN;i yN;i � y’N;i� �� �2
þXmi¼1
wN2;i yN2;i � y’N2;i� �� �2
þXmi¼1
wCl;i yCl;i � y’Cl;i� �� �2
; ð8Þ
where y is observed value, y’ is a modeled value, m is thenumber of observations, i, the subscript N indicates avalue of [nitrate-N], subscript N2 indicates [N2,denit],subscript Cl indicates [Cl–], and ω is a weight associated
with each measurement, equal to the inverse of thestandard error for that measurement (Doherty 2008). Theobjective function was minimized using a non-lineargeneralized reduced gradient solver (Lasdon et al. 1978)as implemented in the Risk Solver software 3 (FrontlineSystems, Inc.).
Uncertainty analysis was conducted to quantify thepotential variability of adjustable parameter values andpredicted profiles of nitrate-N at future times. In theuncertainty analysis, the objective function was allowed tovary by a factor, δ, defined by
d ¼ FminnFðn;m� nÞ
m� n; ð9Þ
(Hill and Tiedeman 2007) where Φmin is the minimizedobjective function from Eq. 8, n is the number of estimatedparameters, m is the number of observations, and F is the F-distribution. Nonlinear simultaneous 95% confidence inter-vals of parameters were computed by consistently raising(for upper confidence intervals) or lowering (for lowerconfidence intervals) the parameter of interest while adjust-ing all other parameters to maintain the objective function ata value of Φmin+δ. The confidence limit was set equal to thevalue of the parameter of interest at which the minimizedobjective function began to exceed Φmin+δ. For predictionsof future nitrate-N profiles, nonlinear simultaneous 95%confidence intervals were estimated by adjusting all param-eters tominimize or maximize the total N in the profile, whilemaintaining the objective function at a value of Φmin+δ. Allsolutions of confidence intervals for predictions and forparameters were validated by re-running multiple timesusing different starting values for the full set of parameters.
Recharge estimate methodsEstimates of recharge from the flux model werecompared with those from the water-table fluctuation(WTF) method, the chloride-tracer method, and atmos-
Table 2 Parameter values specified in the flux model and calibratedvalues estimated with the inverse model
Specified parameter values
Aquifer thickness, Hs 41.1 mUnsaturated zone thickness, Hu 7.6 mAdjustable parameter valuesRecharge rate, R 8.8 cm/year (2.9–22)a
Effective porosity, ns 0.32 (0.16–0.46)b
Fraction N leached, fN 0.15 (0.04–0.37)Fraction Cl leached, fCl 0.55 (0.17–1.0)Unsaturated zone mobilewater content, nu
0.20 (0.0–0.91)
Denitrification rate, k 0.53 mg/L/year (0.33–1.02)
a Values in parentheses are the upper and lower 95% nonlinearsimultaneous confidence limitsb Porosity of saturated zone was defined using a prior distributionwith expected value 0.32 and 95% confidence limits of 0.16 to 0.46based on values from McWhorter and Sunada (1977). This rangewas included in prediction uncertainty analysis, but was notincluded in calibration to avoid non-uniqueness of solution
1245
Hydrogeology Journal (2011) 19: 1239–1252 DOI 10.1007/s10040-011-0748-8
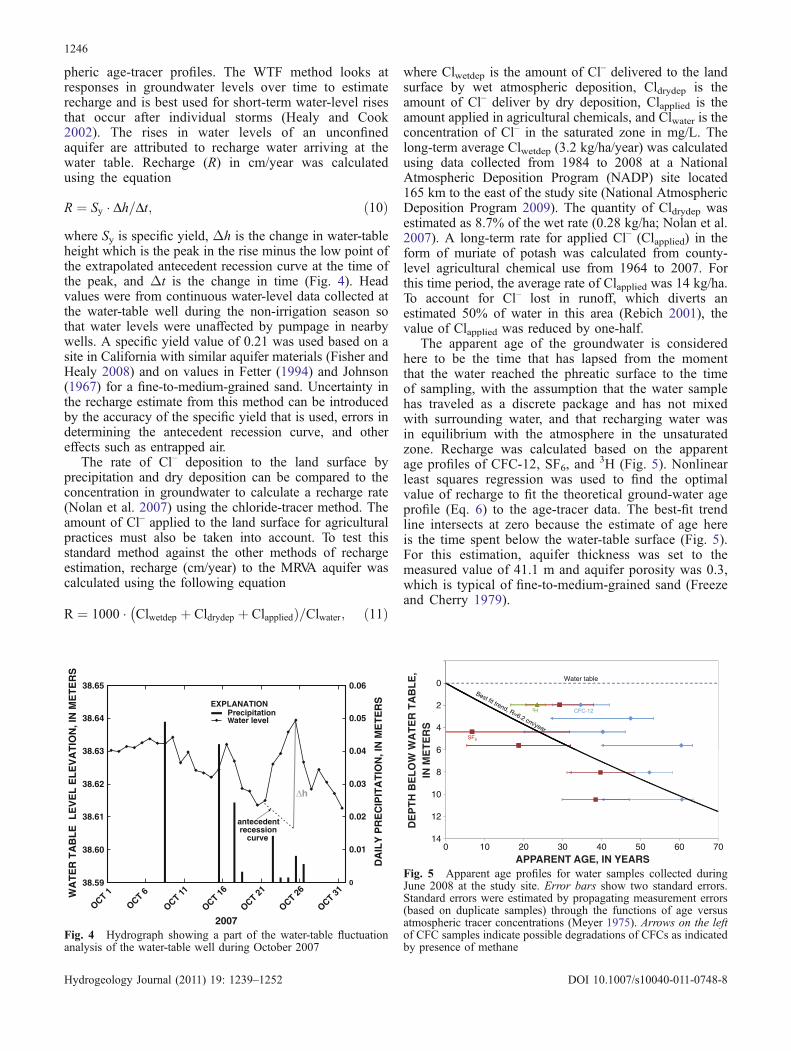
pheric age-tracer profiles. The WTF method looks atresponses in groundwater levels over time to estimaterecharge and is best used for short-term water-level risesthat occur after individual storms (Healy and Cook2002). The rises in water levels of an unconfinedaquifer are attributed to recharge water arriving at thewater table. Recharge (R) in cm/year was calculatedusing the equation
R ¼ Sy � Dh=Dt; ð10Þwhere Sy is specific yield, Δh is the change in water-tableheight which is the peak in the rise minus the low point ofthe extrapolated antecedent recession curve at the time ofthe peak, and Δt is the change in time (Fig. 4). Headvalues were from continuous water-level data collected atthe water-table well during the non-irrigation season sothat water levels were unaffected by pumpage in nearbywells. A specific yield value of 0.21 was used based on asite in California with similar aquifer materials (Fisher andHealy 2008) and on values in Fetter (1994) and Johnson(1967) for a fine-to-medium-grained sand. Uncertainty inthe recharge estimate from this method can be introducedby the accuracy of the specific yield that is used, errors indetermining the antecedent recession curve, and othereffects such as entrapped air.
The rate of Cl– deposition to the land surface byprecipitation and dry deposition can be compared to theconcentration in groundwater to calculate a recharge rate(Nolan et al. 2007) using the chloride-tracer method. Theamount of Cl– applied to the land surface for agriculturalpractices must also be taken into account. To test thisstandard method against the other methods of rechargeestimation, recharge (cm/year) to the MRVA aquifer wascalculated using the following equation
R ¼ 1000 � Clwetdep þ Cldrydep þ ClappliedÞ=Clwater;� ð11Þ
where Clwetdep is the amount of Cl– delivered to the landsurface by wet atmospheric deposition, Cldrydep is theamount of Cl– deliver by dry deposition, Clapplied is theamount applied in agricultural chemicals, and Clwater is theconcentration of Cl– in the saturated zone in mg/L. Thelong-term average Clwetdep (3.2 kg/ha/year) was calculatedusing data collected from 1984 to 2008 at a NationalAtmospheric Deposition Program (NADP) site located165 km to the east of the study site (National AtmosphericDeposition Program 2009). The quantity of Cldrydep wasestimated as 8.7% of the wet rate (0.28 kg/ha; Nolan et al.2007). A long-term rate for applied Cl– (Clapplied) in theform of muriate of potash was calculated from county-level agricultural chemical use from 1964 to 2007. Forthis time period, the average rate of Clapplied was 14 kg/ha.To account for Cl– lost in runoff, which diverts anestimated 50% of water in this area (Rebich 2001), thevalue of Clapplied was reduced by one-half.
The apparent age of the groundwater is consideredhere to be the time that has lapsed from the momentthat the water reached the phreatic surface to the timeof sampling, with the assumption that the water samplehas traveled as a discrete package and has not mixedwith surrounding water, and that recharging water wasin equilibrium with the atmosphere in the unsaturatedzone. Recharge was calculated based on the apparentage profiles of CFC-12, SF6, and
3H (Fig. 5). Nonlinearleast squares regression was used to find the optimalvalue of recharge to fit the theoretical ground-water ageprofile (Eq. 6) to the age-tracer data. The best-fit trendline intersects at zero because the estimate of age hereis the time spent below the water-table surface (Fig. 5).For this estimation, aquifer thickness was set to themeasured value of 41.1 m and aquifer porosity was 0.3,which is typical of fine-to-medium-grained sand (Freezeand Cherry 1979).
WA
TE
R T
AB
LE
LE
VE
L E
LE
VA
TIO
N, I
N M
ET
ER
S
38.65
DA
ILY
PR
EC
IPIT
AT
ION
, IN
ME
TE
RS
0
38.64
38.63
38.62
38.61
38.60
38.59
0.01
0.02
0.03
0.04
0.05
0.06
OCT 1
OCT 11
OCT 16
OCT 21
OCT 26
OCT 31
OCT 6
PrecipitationWater level
EXPLANATION
antecedentrecession
curve
2007
Δh
Fig. 4 Hydrograph showing a part of the water-table fluctuationanalysis of the water-table well during October 2007
2CFC-12
SF6
3H
0
4
6
8
10
12
140 10 20 30 40 50 60 70
Water table
Best fit trend, R=6.2 cm/year
DE
PT
H B
EL
OW
WA
TE
R T
AB
LE
,IN
ME
TE
RS
APPARENT AGE, IN YEARSFig. 5 Apparent age profiles for water samples collected duringJune 2008 at the study site. Error bars show two standard errors.Standard errors were estimated by propagating measurement errors(based on duplicate samples) through the functions of age versusatmospheric tracer concentrations (Meyer 1975). Arrows on the leftof CFC samples indicate possible degradations of CFCs as indicatedby presence of methane
1246
Hydrogeology Journal (2011) 19: 1239–1252 DOI 10.1007/s10040-011-0748-8
Results and discussion
Temporal samplingGroundwater samples collected from 2006 to 2008showed a surprising difference between the water-tableand irrigation wells. Median values of DO, SC, Cl–, Ca,Mg, SO4
2–, Mn, nitrate-N, and NO2– are higher in the
water-table well; whereas, for pH, K, Si, Fe, and NH4+,
median values are higher in the irrigation well (data notshown). Water quality in the water-table well may reflectthe influence of agricultural land use on shallow ground-water at this site because Cl−, Ca, Mg, SO4
2–, Mn, andnitrate-N are commonly applied to the land surface infertilizer (Hamilton and Helsel 1995) and other soilamendments. The presence of these applied inorganicconstituents at high concentrations near the water tablesuggests that there is downward infiltration through theunsaturated zone into the MRVA aquifer. Oxic conditions,high nitrate-N concentrations, and low Fe concentrationsin the water-table well, and subsequent anoxic conditions,high Fe concentrations, and no nitrate-N in the irrigationwell suggest reducing conditions in the deeper part of theMRVA aquifer.
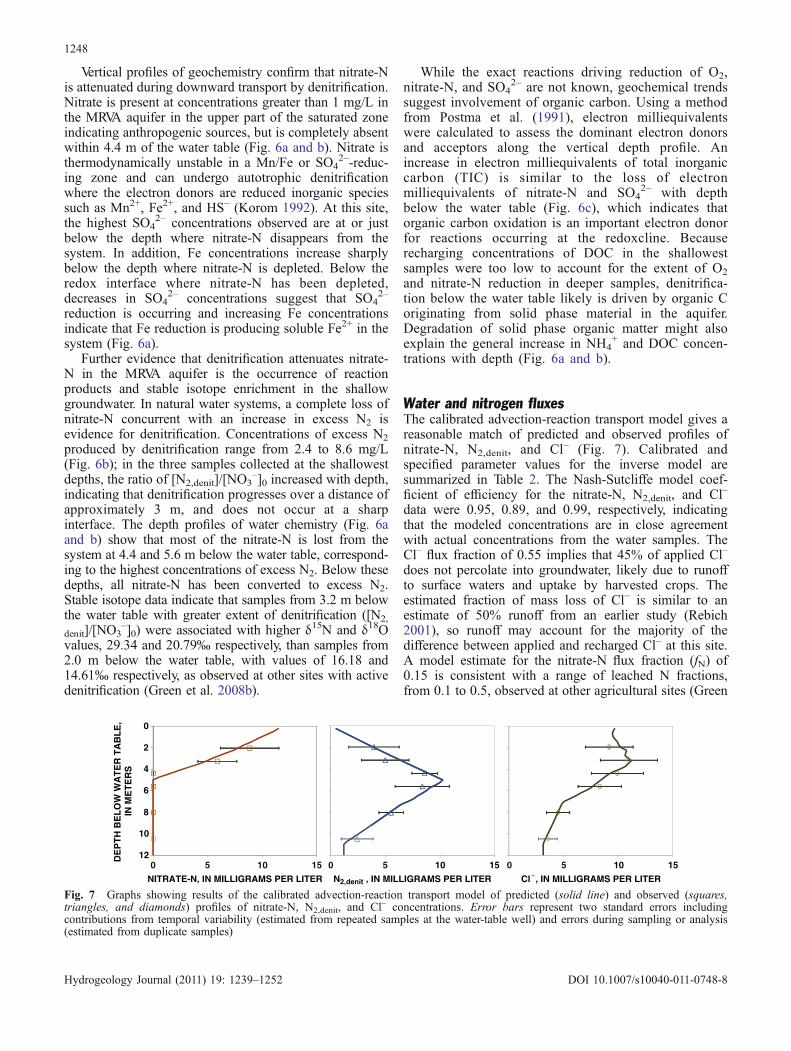
Vertical profiles of geochemistryVertical depth profile sampling was conducted in June2008 to better characterize the geochemical gradientwithin the aquifer. The vertical variability of ground-water chemistry at this site was consistent withinfluence of modern recharge on shallow groundwater(Table 1). The presence of nitrate-N with depthindicates downward transport into the MRVA aquifer(Fig. 6a). Oxidation-reduction (redox) conditions typi-cally progress sequentially from an oxygen-reducingenvironment to nitrate-N-, Mn-, Fe-, SO4
2–-reducingconditions, and finally to methanogenic conditionsunder which organic or inorganic carbon is reduced toform CH4 (Chapelle 1993). The presence or absence ofDO, nitrate-N, Fe, Mn, and SO4
2– in groundwater canbe used to characterize the redox conditions in theaquifer. High dissolved Fe concentrations, in additionto the generally low SO4
2– concentrations, suggestFe/ SO4
2–-reducing conditions in the irrigation well.Concentrations of Fe are 200 times higher than0.05 mg/L (Fig. 6a) which is the concentration at whichnitrate-N was no longer detected in the two subunits ofthe MRVA aquifer (Welch et al. 2009). Redox indicatorsshow anoxic conditions near the water table andchanges in water chemistry with depth (Fig. 6a). Ironis not present at the shallowest interval, but concen-trations increase with depth up to 10.5 m below thewater table and then start to decrease (Fig. 6a). Sulfateconcentrations are high in water collected from the fourshallowest intervals; however, SO4
2– is absent from thesystem below these intervals until it is detected at avery low level in water from the irrigation well. Manganeseconcentrations show an initial increase at 3.2 m below thewater table, but concentrations then decrease with depth. In
general, Fe concentrations increase and Mn and SO42–
concentrations decrease with increasing depth and increas-ingly reducing conditions in the aquifer.
DE
PT
H B
EL
OW
TH
E W
AT
ER
TA
BL
E, I
N M
ET
ER
S
50 10 15
0
2
4
6
8
10
12
14
16
18
20
Water tableN2, denit
EXPLANATION
DOCNH4
+
Reconstructed Nitrate-NNitrate-N
CONCENTRATION, IN MILLIGRAMS PER LITER
zone whereNitrate-N is reduced
zone where SO is reduced42-
0
2
4
6
8
10
12
14
16
18
200 10 20 30 40 50 60
Water tableNitrate-NSO4
2-
TIC
zone where Nitrate-N is reduced
DE
PT
H B
EL
OW
TH
E W
AT
ER
TA
BL
E, I
N M
ET
ER
S (
M)
CUMULATIVE ELECTRON MILLIEQUIVALENTS
zone where SO is reduced42-
EXPLANATION
DE
PT
H B
EL
OW
TH
E W
AT
ER
TA
BL
E, I
N M
ET
ER
S
0 5 10 20 2515 30 35 40
0
2
4
6
8
10
12
14
16
18
20
Water tableFe2+
EXPLANATION
DOCSO4
2-
Mn2+
Nitrate-N
zone where Nitrate-N is reduced
zone where SO is reduced42-
CONCENTRATION, IN MILLIGRAMS PER LITER
(a)
(b)
(c)
Fig. 6 Depth profile of a redox-sensitive indicators, b N speciesand DOC, and c cumulative electron milliequivalents of nitrate-N,SO4
2– and TIC, for water samples collected June 2008. See Table 1for screened intervals
1247
Hydrogeology Journal (2011) 19: 1239–1252 DOI 10.1007/s10040-011-0748-8
Vertical profiles of geochemistry confirm that nitrate-Nis attenuated during downward transport by denitrification.Nitrate is present at concentrations greater than 1 mg/L inthe MRVA aquifer in the upper part of the saturated zoneindicating anthropogenic sources, but is completely absentwithin 4.4 m of the water table (Fig. 6a and b). Nitrate isthermodynamically unstable in a Mn/Fe or SO4
2–-reduc-ing zone and can undergo autotrophic denitrificationwhere the electron donors are reduced inorganic speciessuch as Mn2+, Fe2+, and HS– (Korom 1992). At this site,the highest SO4
2– concentrations observed are at or justbelow the depth where nitrate-N disappears from thesystem. In addition, Fe concentrations increase sharplybelow the depth where nitrate-N is depleted. Below theredox interface where nitrate-N has been depleted,decreases in SO4
2– concentrations suggest that SO42–
reduction is occurring and increasing Fe concentrationsindicate that Fe reduction is producing soluble Fe2+ in thesystem (Fig. 6a).
Further evidence that denitrification attenuates nitrate-N in the MRVA aquifer is the occurrence of reactionproducts and stable isotope enrichment in the shallowgroundwater. In natural water systems, a complete loss ofnitrate-N concurrent with an increase in excess N2 isevidence for denitrification. Concentrations of excess N2
produced by denitrification range from 2.4 to 8.6 mg/L(Fig. 6b); in the three samples collected at the shallowestdepths, the ratio of [N2,denit]/[NO3
–]0 increased with depth,indicating that denitrification progresses over a distance ofapproximately 3 m, and does not occur at a sharpinterface. The depth profiles of water chemistry (Fig. 6aand b) show that most of the nitrate-N is lost from thesystem at 4.4 and 5.6 m below the water table, correspond-ing to the highest concentrations of excess N2. Below thesedepths, all nitrate-N has been converted to excess N2.Stable isotope data indicate that samples from 3.2 m belowthe water table with greater extent of denitrification ([N2,
denit]/[NO3–]0) were associated with higher δ15N and δ18O
values, 29.34 and 20.79‰ respectively, than samples from2.0 m below the water table, with values of 16.18 and14.61‰ respectively, as observed at other sites with activedenitrification (Green et al. 2008b).
While the exact reactions driving reduction of O2,nitrate-N, and SO4
2– are not known, geochemical trendssuggest involvement of organic carbon. Using a methodfrom Postma et al. (1991), electron milliequivalentswere calculated to assess the dominant electron donorsand acceptors along the vertical depth profile. Anincrease in electron milliequivalents of total inorganiccarbon (TIC) is similar to the loss of electronmilliequivalents of nitrate-N and SO4
2– with depthbelow the water table (Fig. 6c), which indicates thatorganic carbon oxidation is an important electron donorfor reactions occurring at the redoxcline. Becauserecharging concentrations of DOC in the shallowestsamples were too low to account for the extent of O2
and nitrate-N reduction in deeper samples, denitrifica-tion below the water table likely is driven by organic Coriginating from solid phase material in the aquifer.Degradation of solid phase organic matter might alsoexplain the general increase in NH4
+ and DOC concen-trations with depth (Fig. 6a and b).
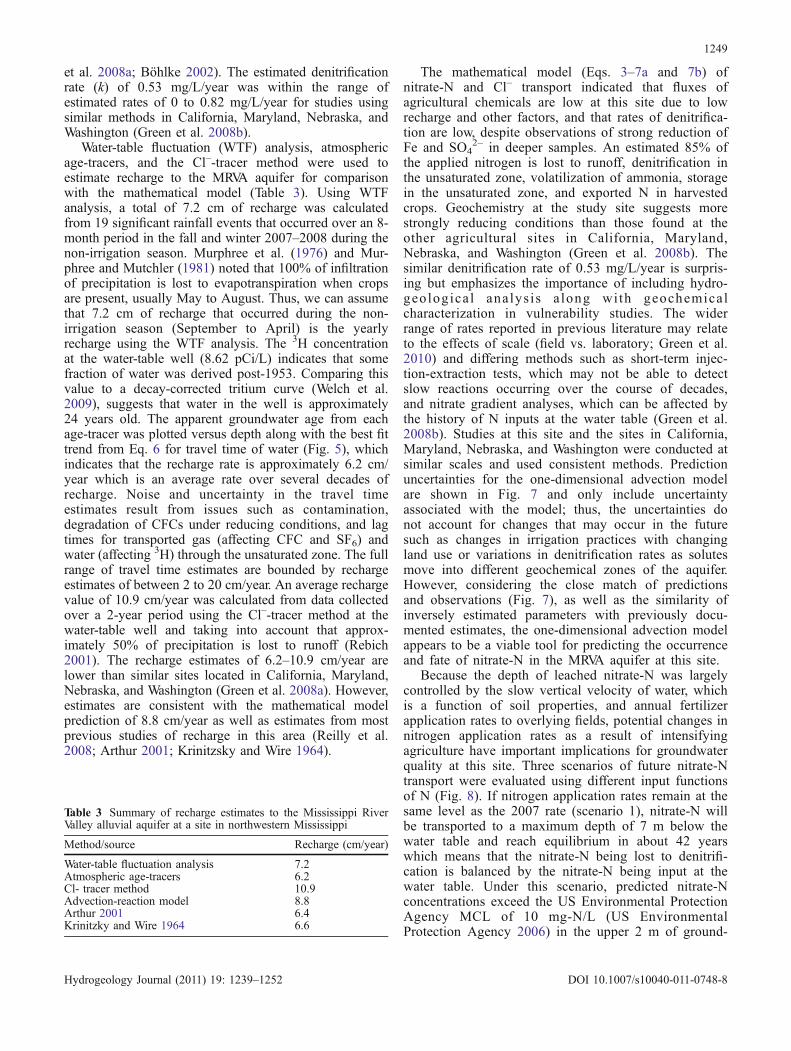
Water and nitrogen fluxesThe calibrated advection-reaction transport model gives areasonable match of predicted and observed profiles ofnitrate-N, N2,denit, and Cl– (Fig. 7). Calibrated andspecified parameter values for the inverse model aresummarized in Table 2. The Nash-Sutcliffe model coef-ficient of efficiency for the nitrate-N, N2,denit, and Cl–
data were 0.95, 0.89, and 0.99, respectively, indicatingthat the modeled concentrations are in close agreementwith actual concentrations from the water samples. TheCl– flux fraction of 0.55 implies that 45% of applied Cl–
does not percolate into groundwater, likely due to runoffto surface waters and uptake by harvested crops. Theestimated fraction of mass loss of Cl– is similar to anestimate of 50% runoff from an earlier study (Rebich2001), so runoff may account for the majority of thedifference between applied and recharged Cl– at this site.A model estimate for the nitrate-N flux fraction (fN) of0.15 is consistent with a range of leached N fractions,from 0.1 to 0.5, observed at other agricultural sites (Green
DE
PT
H B
EL
OW
WA
TE
R T
AB
LE
, IN
ME
TE
RS
NITRATE-N, IN MILLIGRAMS PER LITER
0 5 10 15
0
2
4
6
8
10
12
N2,denit , IN MILLIGRAMS PER LITER
0 5 10 15
Cl , IN MILLIGRAMS PER LITER
0 5 10 15
Fig. 7 Graphs showing results of the calibrated advection-reaction transport model of predicted (solid line) and observed (squares,triangles, and diamonds) profiles of nitrate-N, N2,denit, and Cl– concentrations. Error bars represent two standard errors includingcontributions from temporal variability (estimated from repeated samples at the water-table well) and errors during sampling or analysis(estimated from duplicate samples)
1248
Hydrogeology Journal (2011) 19: 1239–1252 DOI 10.1007/s10040-011-0748-8
et al. 2008a; Böhlke 2002). The estimated denitrificationrate (k) of 0.53 mg/L/year was within the range ofestimated rates of 0 to 0.82 mg/L/year for studies usingsimilar methods in California, Maryland, Nebraska, andWashington (Green et al. 2008b).
Water-table fluctuation (WTF) analysis, atmosphericage-tracers, and the Cl–-tracer method were used toestimate recharge to the MRVA aquifer for comparisonwith the mathematical model (Table 3). Using WTFanalysis, a total of 7.2 cm of recharge was calculatedfrom 19 significant rainfall events that occurred over an 8-month period in the fall and winter 2007–2008 during thenon-irrigation season. Murphree et al. (1976) and Mur-phree and Mutchler (1981) noted that 100% of infiltrationof precipitation is lost to evapotranspiration when cropsare present, usually May to August. Thus, we can assumethat 7.2 cm of recharge that occurred during the non-irrigation season (September to April) is the yearlyrecharge using the WTF analysis. The 3H concentrationat the water-table well (8.62 pCi/L) indicates that somefraction of water was derived post-1953. Comparing thisvalue to a decay-corrected tritium curve (Welch et al.2009), suggests that water in the well is approximately24 years old. The apparent groundwater age from eachage-tracer was plotted versus depth along with the best fittrend from Eq. 6 for travel time of water (Fig. 5), whichindicates that the recharge rate is approximately 6.2 cm/year which is an average rate over several decades ofrecharge. Noise and uncertainty in the travel timeestimates result from issues such as contamination,degradation of CFCs under reducing conditions, and lagtimes for transported gas (affecting CFC and SF6) andwater (affecting 3H) through the unsaturated zone. The fullrange of travel time estimates are bounded by rechargeestimates of between 2 to 20 cm/year. An average rechargevalue of 10.9 cm/year was calculated from data collectedover a 2-year period using the Cl–-tracer method at thewater-table well and taking into account that approx-imately 50% of precipitation is lost to runoff (Rebich2001). The recharge estimates of 6.2–10.9 cm/year arelower than similar sites located in California, Maryland,Nebraska, and Washington (Green et al. 2008a). However,estimates are consistent with the mathematical modelprediction of 8.8 cm/year as well as estimates from mostprevious studies of recharge in this area (Reilly et al.2008; Arthur 2001; Krinitzsky and Wire 1964).
The mathematical model (Eqs. 3–7a and 7b) ofnitrate-N and Cl– transport indicated that fluxes ofagricultural chemicals are low at this site due to lowrecharge and other factors, and that rates of denitrifica-tion are low, despite observations of strong reduction ofFe and SO4
2– in deeper samples. An estimated 85% ofthe applied nitrogen is lost to runoff, denitrification inthe unsaturated zone, volatilization of ammonia, storagein the unsaturated zone, and exported N in harvestedcrops. Geochemistry at the study site suggests morestrongly reducing conditions than those found at theother agricultural sites in California, Maryland,Nebraska, and Washington (Green et al. 2008b). Thesimilar denitrification rate of 0.53 mg/L/year is surpris-ing but emphasizes the importance of including hydro-geologica l analys is a long with geochemicalcharacterization in vulnerability studies. The widerrange of rates reported in previous literature may relateto the effects of scale (field vs. laboratory; Green et al.2010) and differing methods such as short-term injec-tion-extraction tests, which may not be able to detectslow reactions occurring over the course of decades,and nitrate gradient analyses, which can be affected bythe history of N inputs at the water table (Green et al.2008b). Studies at this site and the sites in California,Maryland, Nebraska, and Washington were conducted atsimilar scales and used consistent methods. Predictionuncertainties for the one-dimensional advection modelare shown in Fig. 7 and only include uncertaintyassociated with the model; thus, the uncertainties donot account for changes that may occur in the futuresuch as changes in irrigation practices with changingland use or variations in denitrification rates as solutesmove into different geochemical zones of the aquifer.However, considering the close match of predictionsand observations (Fig. 7), as well as the similarity ofinversely estimated parameters with previously docu-mented estimates, the one-dimensional advection modelappears to be a viable tool for predicting the occurrenceand fate of nitrate-N in the MRVA aquifer at this site.
Because the depth of leached nitrate-N was largelycontrolled by the slow vertical velocity of water, whichis a function of soil properties, and annual fertilizerapplication rates to overlying fields, potential changes innitrogen application rates as a result of intensifyingagriculture have important implications for groundwaterquality at this site. Three scenarios of future nitrate-Ntransport were evaluated using different input functionsof N (Fig. 8). If nitrogen application rates remain at thesame level as the 2007 rate (scenario 1), nitrate-N willbe transported to a maximum depth of 7 m below thewater table and reach equilibrium in about 42 yearswhich means that the nitrate-N being lost to denitrifi-cation is balanced by the nitrate-N being input at thewater table. Under this scenario, predicted nitrate-Nconcentrations exceed the US Environmental ProtectionAgency MCL of 10 mg-N/L (US EnvironmentalProtection Agency 2006) in the upper 2 m of ground-
Table 3 Summary of recharge estimates to the Mississippi RiverValley alluvial aquifer at a site in northwestern Mississippi
Method/source Recharge (cm/year)
Water-table fluctuation analysis 7.2Atmospheric age-tracers 6.2Cl- tracer method 10.9Advection-reaction model 8.8Arthur 2001 6.4Krinitzky and Wire 1964 6.6
1249
Hydrogeology Journal (2011) 19: 1239–1252 DOI 10.1007/s10040-011-0748-8
water. Scenario 2 includes an N application rate increaseof 1.1 kg/ha/year2 (the average rate of increase from1990 to 2007) until 2075 with a maximum of 160 kg-N/ha/year, which is comparable to current rates ofapplication at other intensively cultivated sites (Greenet al. 2008b). Under this scenario, equilibrium in thesystem will be reached in about 134 years, and nitrate-N will remain within 12 m of the water table. However,nitrate-N concentrations are higher than scenario 1,exceeding the MCL in the upper 6 m below the watertable. This scenario takes the longest to come toequilibrium because the input function does not leveloff until 2075. Scenario 3 simulates an extreme hypo-thetical case to illustrate the upper limits of nitrate-Nconcentrations and fastest rate of migration of thenitrate-N front. In recent years, crop acreage in theMississippi Delta has undergone a change from cottonto corn and/or soybeans, most noticeable was a 47%loss in cotton acreage, concurrent with a 288% gain incorn acreage in 2007 relative to 2006. More nitrogenfertilizer is recommended for corn cultivation thancotton, with recommended applications of 269 kg-N/ha/year (Mississippi State University 2009). In scenario3, the N applications increase suddenly to this recom-mended level for corn. Under this scenario, predictedlong-term nitrate-N concentrations in groundwater arehigher than either scenario 1 or 2, exceeding the MCL inthe upper 14 m below the water table, and the system comesto equilibrium in about 101 years. Nitrate-N reaches amaximum depth of 18 m, and migrates at a maximum rate of0.16 m/year. While the timing of the N application rateincrease is extreme, the maximum level of fertilization isfeasible under the current trends of increasing intensificationof agriculture to meet food and biofuel demands. Becausethe steady-state predicted profiles are controlled by theeventual N application rate, it is possible that N contami-nation will eventually penetrate to the zone being used forirrigation. These simple scenarios give a general idea of the
sensitivity of the hydrogeochemical system to the influenceof nitrogen inputs, and the upper limits of aquifer vulner-ability to N inputs.
Summary and conclusions
Geochemical profiles and a mathematical model ofvertical solute transport demonstrate that the MRVAaquifer underlying northwestern Mississippi at a site inBolivar County is vulnerable to anthropogenic contami-nation. The flux of nitrate-N into the aquifer implies thatother agricultural chemicals such as pesticides, could alsomigrate through the unsaturated zone into the shallowgroundwater. Although conditions in the MRVA aquiferare reducing, the estimated rate of denitrification at thissite, 0.53 mg/L/year, was surprisingly similar to rates thatoccur in aquifers with less reducing conditions. Often-times reducing conditions within an aquifer are seen as asign of intrinsic invulnerability to nitrate-N contamination;however, the lack of nitrate-N detection in deeper portionsof the MRVA aquifer may be a result of slow vertical traveltime due to hydrogeological factors. This long time frameaffords an opportunity to implement studies and balancedpolicies to mitigate loss of groundwater resources due toagricultural contamination.
The mathematical model of vertical movement of waterand solutes was used to evaluate scenarios of the effects ofincreased N-applications as a result of intensifyingagriculture. With current denitrification rates and currentN-application rates, the nitrate-N front will reach anequilibrium depth of 7 m below the water table. Underscenarios of moderately increasing N-application rates, themigration of the nitrate-N front is affected by both the rateof increase of application, as well as, the maximumapplication rate. With a greater increase in N-applications,the nitrate-N front will advance as quickly as 0.16 m/yearto an eventual maximum depth of 18 m below the water
(a)(b)
ACI
LP
PA
AR
NOI
T,
ET
TC
EH
RE
P S
MA
RG
OLI
K NI
ER
A
0
100
200
300
1900 1950 2000 2050 2100
YEAR
W W
OL
EB
HT
PE
D,
EL
BAT
RE
TA
SR
ET
EM
NI
15
10
5
0
20
2510 20 30 40 500
NITRATE-N, IN MILLIGRAMS PER LITERFig. 8 a Input mass application rates and b model predictions for three model scenarios for future agricultural practices and resultingwater quality. Scenario 1 assumes fertilizer application remains at 2006 levels, scenario 2 assumes an N application rate increase of 1.1 kg/ha/year2 (the average rate of increase from 1990 to 2007), and scenario 3 assumes an increase in fertilizer application rates to 269 kg/ha/year which is the recommended amount for corn cultivation. The lines show the prediction of the calibrated model. Shaded areas show thenonlinear simultaneous 95% confidence intervals on the predictions
1250
Hydrogeology Journal (2011) 19: 1239–1252 DOI 10.1007/s10040-011-0748-8
table which lies in the zone of pumpage from the alluvialaquifer. A great increase in N application rates is notunreasonable based on trends in use and intensifyingagricultural demands. Policies for land-use managementshould consider that short-term and long-term vulnerabil-ity can differ greatly, and agricultural activities occurringtoday have far reaching implications on water-qualitydecades into the future. Additional study is needed todetermine the sustainability of the electron donor pool andthe effects of changing hydrology on the long-termvulnerability of deep groundwater in the MRVA aquiferto agricultural contamination.
Acknowledgements The authors thank our colleagues in the USGeological Survey who contributed time, effort, and expertise,especially Patrick Mills who installed the water-table well and thefive temporary sampling points. The authors would also like toextend deep gratitude to Mr. Curtis Hood of Perthshire Farms forallowing us access to his land and introducing our group to the finerart of production agriculture and for his extensive knowledge of thelocal agricultural history. Thoughtful reviews by Andrew O’Reillyand Brian Katz improved this report.
References
Aeschbach-Hertig W, El-Gamal H, Wieser M, Palcsu L (2008)Modeling excess air and degassing in groundwater by equili-brium partitioning with a gas phase. Water Resour Res 44:W08449. doi:10.1029/2007WR006454
Agrawal GD, Lunkad SK, Malkhed T (1999) Diffuse agriculturalnitrate pollution of groundwaters in India. Water Sci Technol39:67–75
Arthur JK (1994) Thickness of the upper and lower confining unitsof the Mississippi River Valley alluvial aquifer in northwesternMississippi. US Geol Surv Water Resour Invest Rep 94–4172
Arthur JK (1995) Changes in the volume of water in the MississippiRiver Valley alluvial aquifer in the Delta, northwesternMississippi, 1980–94. US Geol Surv Water Resour Invest Rep95–4127, 12 pp
Arthur JK (2001) Hydrogeology, model description, and flowanalysis of the Mississippi River alluvial aquifer in NorthwesternMississippi. US Geol Surv Water Resour Invest Rep 01–4035, 47 pp
Autin WJ, Burns SF, Miller BJ, Saucier RT, Snead JI (1991)Quaternary geology of the Lower Mississippi Valley. In:Morrison RB (ed) Quaternary nonglacial geology: conterminousUS. The geology of North America, vol K-2. GeologicalSociety of America, Boulder, CO, pp 547–582
Blicher-Mathiesen G, McCarty GW, Nielsen LP (1998) Denitrifica-tion and degassing in groundwater estimated from dissolveddinitrogen and argon. J Hydrol 208:16–24
Böhlke JK (2002) Groundwater recharge and agricultural contam-ination. Hydrogeol J 10:153–179
Boswell EH, Cushing EM, Hosman RL (1968) Quaternary aquifersin the Mississippi Embayment. US Geol Surv Prof Pap 448-E,15 pp
Busenberg E, Plummer LN (1992) Use of chlorofluorocarbons(CCl3F and CCl2F2) as hydrologic tracers and age-dating tools:the alluvium and terrace system of central Oklahoma. WaterResour Res 28(9):2257–2283
Busenberg E, Plummer LN (2000) Dating young groundwater withsulfur hexafluoride: natural and anthropogenic sources of sulfurhexafluoride. Water Resour Res 36(10):3011–3030
Chapelle FH (1993) Ground-water microbiology and geochemistry.Wiley, New York, 424 pp
Chen J, Tang C, Sakura Y, Yu J, Fukushima Y (2005) Nitratepollution from agriculture in different hydrogeological zones of
the regional groundwater flow system in the North China Plain.Hydrogeol J 13:481–492
Cook PG, Böhlke JK (2000) Determining timescales for ground-water flow and solute transport. In: Cook PG, Herczeg A (eds)Environmental tracers in subsurface hydrology. Kluwer, Boston,pp 1–30
Coupe RH (2002) Nitrogen and phosphorus concentrations andfluxes of streams in the Mississippi Embayment study unit. USGeol Surv Water Resour Invest Rep 01–4024, 65 pp
Fisher LH, Healy RW (2008) Water movement within theunsaturated zone in four agricultural areas of the United States.J Environ Qual 37(3):1051–1063
Fishman MJ, Friedman LC eds. (1989) Methods for determinationof inorganic substances in water and fluvial sediments. US GeolSurv Techniques of Water Resources Investigations, book 5,chapter A1, US Geological Survey, Reston, VA, 545 pp
Galloway JN, Aber JD, Erisman JW, Seitzinger SP, Howarth RW,Cowling EB, Cosby BJ (2003) The nitrogen cascade. Bio-science 53(4):341–356
Gonthier GJ (2003) Quality of ground water in Pleistocene andHolocene subunits of the Mississippi River Valley alluvialaquifer, 1998. US Geol Surv Water Resour Invest Rep 03–4202,80 pp
Green CT, Fisher LH, Bekins BA (2008a) Nitrogen fluxes throughunsaturated zones in five agricultural settings across the UnitesStates. J Environ Qual 37:1073–1108
Green CT, Puckett LJ, Böhlke JK, Bekins BA, Phillips SP,Kauffman LJ, Denver JM, Johnson HM (2008b) Limitedoccurrence of denitrification in four shallow aquifers inagricultural areas of the United States. J Environ Qual 37(3):994–1009
Green CT, Böhlke JK, Bekins BA, Phillips SP (2010) Mixingeffects on apparent reaction rates and isotope fractionationfactors during denitrification in a heterogeneous aquifer. WaterResour Res 46:W08525. doi:10.1029/2009WR008903
Hallberg GR (1989) Pesticide pollution of groundwater in thehumid United States. Agric Ecosys Environ 26:299–367
Hamilton PA, Helsel DR (1995) Effects of agriculture on ground-water quality in five regions of the United States. Ground Water33(2):217–226
Hansen B, Thorling L, Dalgaard T, Erlandsen M (2011) Trendreversal of nitrate in Danish groundwater: a reflection ofagricultural practices and nitrogen surpluses since 1950.Environ Sci Technol 45:228–234
Healy RW, Cook PG (2002) Using groundwater levels to estimaterecharge. Hydrogeol J 10:91–109
Hill MC, Tiedeman CR (2007) Effective groundwater modelcalibration: with analysis of data, sensitivities, predictions, anduncertainty. Wiley, Chichester, UK, 464 pp
Johnson AI (1967) Specific yield: compilation of specific yields forvarious materials. US Geol Surv Water Suppl Pap 1662-D, 74pp
Keeney DR (1986) Sources of nitrate to ground water. Crit RevEnviron Control 16:257–304
Korom SF (1992) Natural denitrification in the saturated zone: areview. Water Resour Res 28(6):1657–1668
Koterba MT, Wilde FD, Lapham WW (1995) Ground-water datacollection protocols and procedures for the national water-quality assessment program: collection and documentation of
1251
Hydrogeology Journal (2011) 19: 1239–1252 DOI 10.1007/s10040-011-0748-8
water-quality samples and related data. US Geol Surv Open-FileRep 95–399, 113 pp
Krinitzsky EL, Wire JC (1964) Ground water in alluvium of lowerMississippi Valley (upper and central areas). Technical report 3–658, vols 1 and 2, US Army Corps Engineers WaterwaysExperimentation Station, Vicksburg, MS, 400 pp
Landreth S (2008) Mississippi Delta agricultural chemical ground-water monitoring program: summary of results MississippiDelta region, March 1, 1989 through December 31, 2007.Mississippi Department of Environmental Quality, Jackson, MS
Lasdon LS, Waren AD, Jain A, Rather M (1978) Design and testingof a generalized reduced code for nonlinear programming.ACM Trans Math Softw 4(1):34–50
Liu GD, Wu WL, Zhang J (2005) Regional differentiation of non-point source pollution of agriculture-derived nitrate nitrogen ingroundwater in north China. Agric Ecosys Environ 107:211–220
Maupin MA, Barber NL (2005) Estimated withdrawals fromprincipal aquifers in the United States, 2000. US Geol SurvCirc 1279, 46 pp
McWhorter D, Sunada D (1977) Ground-water hydrology andhydraulics. Water Resources, Littleton, CO, 290 pp
Meyer SL (1975) Data analysis for scientists and engineers. Wiley,New York, 513 pp
Mississippi State University (2009) Delta 2010 planning budgets:budget report 2009–06. Department of Agricultural Economics,MSU, Starkville, MS, 185 pp
Mueller DK, Helsel DR (1996) Nutrients in the Nation’s waters: toomuch of a good thing? US Geol Surv Circ 1136, 24 pp
Murphree CE, Mutchler CK (1981) Sediment yield from a flatlandwatershed. Trans ASAE 24(4):966–969
Murphree CE, Mutchler CK, McDowell LL (1976) Sediment yieldsfrom a Mississippi Delta watershed, Proc. 3rd Fed. InteragencySedimentation Conf., Denver, CO, 22–25 March 1976, pp 99–109
National Atmospheric Deposition Program (2009) NADP/NTNNational Trends Network. NADP Program Office, Champaign,IL. Data accessed at http://nadp.sws.uiuc.edu/. Cited April 2009
National Research Council (1993) Ground water vulnerabilityassessment: contamination potential under conditions of uncer-tainty. National Academy Press, Washington, DC
Nolan BT, Healy RW, Taber PE, Perkins K, Hitt KJ, Wolock DM(2007) Factors influencing ground-water recharge in the easternUnited States. J Hydrol 332:187–205
Plummer LN, Michel RL, Thurman EM, Glynn PD (1993)Environmental tracers for age dating young ground water. In:Alley WM (ed) Regional ground-water quality. Reinhold, NewYork, pp 255–293
Postma D, Boesen C, Kristiansen H, Larsen F (1991) Nitratereduction in an unconfined sandy aquifer: water chemistry,reduction processes, and geochemical modeling. Water ResourRes 27:2027–2045
Puckett LJ, Tesoriero AJ, Dubrovsky NM (2011) Nitrogen contam-ination of surficial aquifers: a growing legacy. Environ SciTechnol 45:839–844
Rabalais N (2002) Nitrogen in aquatic ecosystems. Ambio 31:102–112Rebich RA (2001) Quality of runoff in the Mississippi Delta
management systems evaluation areas project, 1996–1999 In:Mississippi Delta management systems evaluation areas project,1995–1999. Mississippi Agric For Exper Station Info Bull 377
Reilly TE, Dennehy KF, Alley WM, Cunningham WL (2008)Ground-water availability in the United States. US Geol SurvCirc 1323, 70 pp
Renken RA (1998) Ground water atlas of the United States segment5 Arkansas, Louisiana, and Mississippi. US Geol Surv HydrolInvest Atlas 730-F, 10 pp
Révész K, Casciotti K (2007) Determination of the δ(15 N/14N) andδ(18O/16O) of nitrate in water: RSIL Lab Code 2900, chap. C17.In: Révész K, Kinga, and Coplen, Tyler B (eds) Methods of theReston Stable Isotope Laboratory: Reston, Virginia, US GeolSurv Techniques and Methods, book 10, sec. C, chap. 17, USGeological Survey, Reston, VA, 24 pp
Saucier RT (1994) Geomorphology and quaternary geologic historyof the Lower Mississippi Valley, vol 1. US Army EngineersWaterways Experiment Station, Vicksburg, MS, 398 pp
Shaw DR, Schraer SM, Prince J, Boyette M (2006) Herbicidedynamics in the Bogue Phalia watershed in the Yazoo Riverbasin of Mississippi. Weed Sci 54:807–813
Slack LJ, Darden D (1991) Summary of aquifer tests in Mississippi,June 1942 through May 1988. US Geol Surv Water ResourInvest Rep 90–4155, 40 pp
Thatcher LL, Janzer VJ, Edwards KW (1977) Methods fordetermination of radioactive substances in water and fluvialsediments. USGS Techniques of Water Resources Investiga-tions, book 5, chap. A5, US Geological Survey, Reston, VA
US Department of Agriculture (2010a) National AgricultureStatistics Service. Accessed at http://www.nass.usda.gov/Statistics_by_State/Mississippi/Charts_and_Maps/index.asp.Cited 29 January 2010
US Department of Agriculture (2010b) Economic research servicefertilizer use data set. Accessed at http://www.ers.usda.gov/Data/FertilizerUse/. Cited 29 January 2010
US Environmental Protection Agency (2006) 2006 edition of theDrinking Water Standards and Health Advisories. EPA-822-R-06-013, USEPA, Washington, DC
US Geological Survey (2006) Dissolved gas sampling instructions.US Geological Survey, Reston, VA. Accessed at http://water.usgs.gov/lab/dissolved-gas/. Cited 5 April 2011
US Geological Survey (2009) CFC sampling method: bottles. TheReston Chlorofluorocarbon Lab., US Geological Survey, Reston,VA. Accessed at http://water.usgs.gov/lab/chlorofluorocarbons/sampling/bottles/. Cited 5 April 2011
US Geological Survey (2010) SF6 sampling. The Reston Chloro-fluorocarbon Lab., US Geological Survey, Reston, VA. Accessedat http://water.usgs.gov/lab/sf6/sampling/. Cited 5 April 2011
Weiss RF (1970) The solubility of nitrogen, oxygen, and argon inwater and seawater. Deep Sea Res 17:721–735
Welch HL, Kingsbury JA, Tollett RW, Seanor RC (2009) Quality ofshallow groundwater and drinking water in the MississippiEmbayment-Texas Coastal uplands aquifer system and Mis-sissippi River Valley alluvial aquifer, south-central UnitedStates, 1994–2004. US Geol Surv Sci Invest Rep 2009–5091,51 pp
World Health Organization (2004) Guidelines for drinking-waterquality, 3rd edn., vol 1: recommendations. WHO, Geneva
1252
Hydrogeology Journal (2011) 19: 1239–1252 DOI 10.1007/s10040-011-0748-8