THE FEASIBILITY OF MICRONUTRIENT (IRON) FOOD FORTIFICATION IN PACIFIC ISLAND COUNTRIES Report prepared for the WHO Western Pacific Regional Office RG Hughes Division of International & Indigenous Health School of Population Health University of Queensland Brisbane April 2006
Transcript
THE FEASIBILITY OF MICRONUTRIENT (IRON) FOOD FORTIFICATION IN PACIFIC ISLAND COUNTRIES
Report prepared for the WHO Western Pacific Regional Office
RG Hughes Division of International & Indigenous Health
School of Population Health University of Queensland
Brisbane
April 2006
1
EXECUTIVE SUMMARY Objectives: The main aim of the consultancy was to obtain information on food production and distribution, availability and consumption in the Pacific to determine the best vehicles for food fortification. Specific objects were: 1. Determination of the total volume of possible vehicles for fortification available for
consumption in Pacific Island Countries (PIC) by source of origin. 2. Description of distribution and marketing structure (in bulk or labeled), as well as
agreements among countries regarding importations and food control. 3. Investigate the availability of information from food consumption studies that can help
determine the distribution of the above foods (potential vehicles for fortification) in each country in order to estimate nutritional implications for urban vs rural population, different age groups, males/females and socio-economic classes.
4. Draw conclusions on the most suitable vehicles for a fortification program for the Pacific countries and propose the steps needed to implement this.
Summary of activities, findings, conclusions and recommendations: • The prevalence of anaemia is high in the region and the most likely causes are diets
insufficient in iron and/or parasite infections. • The prevalence of anaemia in women and children in PICs is high enough to warrant a
public health intervention. • Fortifying the food supply with iron would be an effective way of increasing population
iron intakes. • The most effective programs to reduce iron deficiency anaemia would involve the
elimination of helminth and parasite infections and increasing dietary iron intakes of Pacific populations.
• Food import volumes were determined for 10 PICs. • The principal sources of origin of flour and rice for most PICs were Fiji, Australia and the
USA and imported rice and flour from these countries now provide the main staple foods. • Literature searches found only three recent Pacific food consumption studies. • Low proportions of rural populations consume flour and rice (14.7%) in Vanuatu and
possibly most of rural/remote Melanesia. • On the basis of evidence food availability data and limited consumption studies, flour and
rice appear to be the most suitable vehicles for fortification. • Results of 3 food consumption studies may not be sufficient on which to base a food
fortification program. • Imported flour and rice is already enriched in many PICs. • Food production in Australia, NZ and the USA shows a general trend towards enriching
foods for domestic consumption with additional nutrients, including iron. • The issue of fortifying multiple food vehicles becomes an alternative to fortification of a
single food. • Food availability data collected and analysed by FAO remains the best source of food
availability in the Pacific. Unfortunately, these data only provide information for 8 PICs and at best, are only rough estimates.
2
• In many cases country import data were either, unreliable, inappropriate, or not available in a form that could be analysed, raising more issues than solely determining the nutrient quality of the food supply.
Recommendations From the results of this consultancy, it is recommended that: 1. Wheat flour and rice are the most suitable vehicles for iron fortification in PICs.
Issues such as levels and safety of iron fortificants, policing of mandatory fortification, quality control, contamination and producer compliance are beyond the scope of this consultancy.
2. Fortification and helminth elimination programs be undertaken in unison. There is enough evidence to suggest that a food fortification program should not be undertaken in isolation. Iron deficiency anaemia is an outcome of a range of influencing factors that include an iron deficient diet and helminth/parasite infections. Since fortified foods seem to be imported into many PICs, the question of whether a fortification program is necessary arises. More data should be collected to determine the exact proportions of fortified foods already entering PICs. Pacific governments should be alerted to this in order to make informed decisions about the development of national and/or regional food fortification programs. This also enables governments and regional bodies to determine whether a single or multiple food vehicle program will be the most effective.
3. Regular low-cost food and nutrition surveys be undertaken. The searches undertaken during this consultancy showed that little is known about the dietary habits and food consumption patterns of Pacific populations. Very little is known about food distribution within countries and what proportion of anaemia prevalence is due to parasitic infection. Accurate information on food consumption is necessary for governments to make decisions about a range of food and health issues in order to develop policy and programs.
4. A uniform regional approach to food import and availability data collection and analysis be taken. This consultancy found it difficult to access individual PIC food availability data and of data received, many were incomplete, difficult to interpret and/or inconsistent. This raises issues of national food security, disaster preparedness and emergency relief. Every country government should have easy access to up-to-date per capita food availability of nutrient rich foods in order to determine quantities of foods available to feed populations in times of emergency.
3
Table of Contents EXECUTIVE SUMMARY...................................................................................................... 1 1.0: PURPOSE.......................................................................................................................... 4
2.0: BACKGROUND ............................................................................................................... 5 3.0: ACTIVITIES AND FINDINGS....................................................................................... 6
3.1: Anaemia........................................................................................................................... 6 3.2: Pacific food supply .......................................................................................................... 8 3.3: Food consumption studies and estimates ........................................................................ 9 3.4: Fortified foods available in PICs ................................................................................... 12 3.5: Influence of Australia, NZ and the USA on food availability in PICs .......................... 14 3.6 Reliability of the data...................................................................................................... 17
Flour millers in Pics.............................................................................................................. 22 Australian and NZ flour millers............................................................................................ 23 Australian rice Exporters ...................................................................................................... 24 Australian enriched rice in Samoa........................................................................................ 24
ANNEX 2: PREVALENCE OF ANAEMIA........................................................................ 25 Best estimates of anaemia prevalence in PICs...................................................................... 25 Iron deficiency anaemia in Australia .................................................................................... 26 References............................................................................................................................. 27
ANNEX 3: PACIFIC IMPORTS FROM AUSTRALIA, NZ & USA; RAW DATA ....... 28
4
1.0: PURPOSE
1.1: Objective The aim of the consultancy was to obtain information on food industrial production and marketing distribution, as well as availability and consumption in the Pacific in order to determine the best vehicles for food fortification for the Pacific, especially for population groups at highest risk, such as infants, children and women of child bearing age. The foods that may be suitable for fortification include wheat flour and related products, complementary foods, instant noodles, oil, sugar, condiments (such as soy sauce) and possibly evaporated milk and rice. The choice of foods to be considered for fortification will depend on the industrial production of those foods and suitable marketing and delivery systems, as well as food availability and the food supply for each country. A previous study by Gibson identified wheat flour and rice as the best options for Pacific countries, however the industrial production and economical feasibility was not an element in the analysis. The feasibility of fortification of food vehicles would depend on:
a) the major suppliers of food vehicles have been identified; b) there are a small number of suppliers; c) the possibility of governmental enforcement; and d) consumption by the target population frequently and in sufficient amounts..
1.2: Methods The total volumes and potential vehicles for fortification available for consumption in PICs for which information can be obtained was estimated by following the steps outlined below and in consultation with the regulatory consultant. 1. Determination of the total volume of possible vehicles for fortification available for consumption in PICs by source of origin.
This was achieved considering FAO food balance sheets and other sources of information such as Ministries of Commerce and Trade, the Pacific Forum Secretariat, FAO, the Secretariat for the Pacific Community (SPC), food importers and exporters and other sources, in collaboration with WHO, FAO and UNICEF country offices.
2. Description of distribution and marketing structure (in bulk or labeled), as well as agreements among countries regarding importations and food control.
The sources of wheat flour, rice and other possible vehicles for fortification consumed in PICs were identified. This was achieved by contacting producers, processors and suppliers within each PIC; and in Australia, Fiji, New Zealand and PNG.
3. Investigate the availability of information from food consumption studies that can help determine the distribution of the above foods (potential vehicles for fortification) in each country in order to estimate nutritional implications for urban vs rural population, different age groups, males/females and socio-economic classes. 4. Draw conclusions on the most suitable vehicles for a fortification program for the Pacific countries and propose the steps needed to implement this.
5
Although anaemia prevalence in PICs is not defined as a task of this consultancy, it was felt a short description was necessary to provide information about the magnitude of iron deficiency in PICs. It can be assumed that iron deficiency rates (sub-clinical and clinical) are higher than recorded anaemia rates no matter the cause. It is not within the brief of this consultancy to provide the technical information about types, costs, availability and quantities of iron supplementation required for enrichment of individual foods.
2.0: BACKGROUND The foundations of the feasibility of food fortification for Pacific countries were laid in a consultancy report for WHO WPRO by Professor Rosalind Gibson in 2003 (Gibson 2003). The report concluded that the prevalence of anaemia is still high in several countries in the region, especially among women of child-bearing-age and children less than five years of age. The most frequent nutrient inadequacies found were for iron and calcium in all the countries examined. Wheat flour was identified as a potential food vehicle probably providing adequate coverage in Fiji but daily per capita amount of wheat available for consumption in Papua New Guinea, Solomon Islands and Vanuatu was estimated to be too low for a national wheat micronutrient fortification programme. Additionally fortification of rice at the time was technically difficult and expensive and not feasible for national fortification programmes. The report identified Fiji, Kiribati, New Caledonia, Papua New Guinea, Solomon Islands and Vanuatu as having likely iron deficits (Table 2.1) and candidates for food fortification and that flour and rice seemed to be the most suitable vehicles for fortification (Table 2.2). The other PICs were not included due to insufficient data to make a decision. Fiji is the only PIC to have a mandatory fortification program. It requires that 60ug iron be added to every gram of milled flour.
Table 2.1: Population iron status in Pacific countries
Country Deficient?
Y/N % Australia Y Fiji Islands Y Kiribati Y New Caledonia Y New Zealand Y Papua New Guinea Y Solomon Islands Y Vanuatu Y
Source: Gibson 2003
6
Table 2.2: Potential food vehicles suggested by Gibson 2003 for selected PICs
Country Food vehicles
Fiji Islands Wheat flour Kiribati Wheat flour New Caledonia Wheat flour New Zealand Wheat flour Papua New Guinea Rice Solomon Islands Rice Vanuatu Rice
Source: Gibson 2003 According to Gibson (2003) the critical factor that determines selection of food products to be fortified is, “…at least 50% of the population at risk should consume the potential food vehicle throughout the year”. At the time of the Gibson review the availability of wheat flour and rice was determined for selected Pacific countries by FAO in terms of per capita availability (Table 2.3). However, the proportions of people consuming and the foods they consume were not identified. Table 2.3: Availability of wheat and rice in PICs (g/capita/day, kcal/capita/day and % of
3.1: Anaemia From a search of past and current literature, surveys and unpublished reports, it seems that the prevalence of anaemia in most PIC is very high, especially among women. Few data are from national surveys. Most data are old or of sub-population groups, especially women and children. However, it is the best available at present. Table A2.1 in Annex 2 shows anaemia prevalence in PICs and Tables A2.2 and A2.3 shows prevalences in Australia. Table 3.1.1 below shows a summary of very crude estimates of the maximum anaemia prevalence rates per country. Even by these very crude estimations, most countries have anaemia rates above the 25% required by WHO as a trigger for action on anaemia.
7
Table3.1.1: Summary of best estimates of anaemia in PICs Country %
Am. Samoa 20% Cook Islands: 37% Fiji 32% FSM 40% French Polynesia 26% Kiribati 25% Marianas 10% Marshall Islands 26% Nauru 11% New Caledonia N/A Niue 7% Papua New Guinea 45% Palau 5% Samoa 56% Solomon Islands 29% Tonga 37% Tuvalu 23% Vanuatu 57% Wallis & Futuna N/A Australia 2-5% New Zealand <5%
nb. The best estimates are shown as the maximum prevalence recorded by the latest available data. The Gibson report stated that non-nutritional factors may also exacerbate iron deficiency anaemia (p.8). They include parasitic infections, especially hook worm (Trichuri trichiura), chronic hemolysis induced by malaria and schistosomiasis (e.g., Schistosomiasis japonicm and S. mansoni), and hemoglobinopathies. Helminth infections can contribute to iron deficiency anaemia by 20-30% or more. This is verified in a recent study carried out in 2001-2002 among Pacific school children (Hughes, Sharp et al. 2004). Two primary schools were selected in each of 13 PICs and children were assessed for helminth infection and Hb status. The results show that children with helminth infection were twice as likely to be anaemic than children with no helminth infections and that rises in anaemia follow rises in helminth infection. These trends are shown in Figure 3.1.1. These results do not represent all primary school children in each of the countries named in Figure 3.1.1 but they do show the relationship between helminth infection and anaemia. World wide studies have shown that iron deficient diets contribute to iron deficiency anaemia in all populations. However, helminth and other infections also make a substantial contribution. Figure 3.1.1 shows anaemia rates of over 20% for the selected school children in 4 PICs. Helminth infection was between 30-94% among the same school children. The diets of these children are not known.
8
Figure 3.1.1: Relationship between anaemia and helminth infection among Pacific school children
3.2: Pacific food supply Food availability data were collected from Australian, NZ and US databases and FAO estimates and individual PIC government import data (FAO 2002; US Department of Agriculture 2006). Australian, NZ and US export data are listed in Annex 3. The analysis showed that foods imported in the largest volumes were wheat, wheat flour, rice, pasta/noodles and milk. These foods were then taken as a short list of possible food fortification vehicles. Import volumes were determined where approximate agreement was reached between individual PIC import data and exporting country data. This was then calculated into per capita intakes using Secretariat of the Pacific Community (SPC) population estimates for 2003 for each country. These data are presented in Table 3.2.1. As can be seen in Table 3.2.1, only flour, rice and milk remain on the short list. Information on pasta/noodles was difficult to extract for many countries because in most cases, they are included under the heading “flour” or “flour products”. Therefore, to avoid duplication pasta/noodles were omitted. In Table 3.2.1 a large proportion of cells are empty because agreement was not reached between individual country import data and exporting country data or that no information was available. However, it does show that for those countries with data, sufficient quantities of wheat flour and rice were available to justify them as suitable vehicles for fortification. The principal sources of origin of flour and rice for most PICs were Fiji, Australia and the USA, although small proportions of rice were imported from Asian countries. A search
0 10 20 30 40 50 60 70 80 90 100
Am. Samoa Cook Islands
Niue
Fiji Vanuatu
Tonga Nauru
FSM - Pohnpei French Polynesia Marshall Islands Solomon Islands
FSM - Yap Tuvalu Kiribati
prevalence (%)
Helminth infection
Anaemia
Helminth trend
Anaemia trend
9
revealed that 5 countries have flour mills: Fiji, New Caledonia, Solomon Islands and Papua New Guinea. Details are given in Annex 1 along with Australian and NZ flour millers who export to PICs. With only a few flour millers in the region it becomes easier to operationalise a flour fortification program. Additionally, flour exports from Australia and the USA to many PICs are already fortified to some extent. For more details of this see Section 3.4. Similarly, all Australian rice exports seem to be made through the Ricegrowers Association of Australia. Details are given in Annex 1. Again, most exports from Australia and the USA seem to be already fortified. The levels of iron and other fortificants in imported flour and rice are not known. Additionally, it is not known how and to whom rice and flour are distributed with each country. Industry data does show what countries flour and rice are distributed to (see Section 3.4) and food consumption studies do show some patterns of distribution (see Section 3.3).
Table 3.2.1: Per capita availability of flour, rice and milk 2002 Availability flour rice milk
Country (g/day) (g/day) (g/day) American Samoa Cook Islands Fiji 281.2 116.7 74.3 French Polynesia 186.6 84.2 77.2
nb French Polynesia FAO 1995 availability g/capita/day: wheat 178.0, rice 99.0, milk 272.6
3.3: Food consumption studies and estimates In section 3.1 of the Gibson report (p26) it is reported, “For national fortification programs to be effective, at least 50% of the population at risk to the micronutrient deficiencies should consume the potential food vehicle throughout the year.”
10
The best way to determine what foods and how often Pacific populations consume is from food consumption studies. However, very few food consumption studies have been undertaken in PICs within the last 10 years. The most recent was a 2005 cross-sectional study of diet carried out in Kosrae, Federated States of Micronesia (Englberger, Marks et al. 2005). The study aimed to assess intakes of vitamin A and other nutrients among preschool children and their carers. Primary data from 282 children were collected and analysed in 2000. Of these 267 carers with their children were available and consented to respond to a 7-day repeated food frequency questionnaire. A sub-sample of 65 carers and children consented to participate in 3 repeated, non-consecutive quantitative 24-hour recalls. The results of the 7-day food frequency questionnaire show that rice was the most frequently consumed food. Rice was consumed by 100% of children and 99% of carers at least once in the previous week and consumed by 95% of the participants on each of the previous seven days. Ramen noodles were consumed by 74% of the participants with nearly 30% consuming 3-7 times per week. Milk was consumed by 85% of children with 64% consuming 3-7 times per week. Result of the 24-hour recall showed similar pattern of results but marked differences in intakes were identified between children and carers. 100% of children and 89% of careers and children ate rice, 51% of children and 43% of carers ate flour products but only 14% of children and 8% of carers consumed milk on all three days. It is interesting to note that some ramen noodles imported from Asia are fortified. However it was found that only 0.7% of respondents reported consuming. Food consumption was measured by using a food frequency questionnaire during a national non-communicable disease survey in Vanuatu in 1998 (Carlot-Tary, Hughes et al. 1999). The survey was carried out by the Nutrition Section and the Health Promotion Section of the Vanuatu Department of Public Health assisted by provincial clinic staff. Technical assistance and support was provided by the Secretariat of the Pacific Community (SPC). The survey was conducted amongst 1638 adults, aged 20 years and over, from randomly selected households and villages in the provinces of Sanma, Penama, Malampa, Shefa and Tafea. Food consumption data were obtained through face-to-face interviews. Results show that 79.0% of respondents ate rice, noodles and bread at least once per week and 56.4% of ate rice and bread daily. Salt was used every day by 93.0% of respondents and sugar by 62.2%. There was no significant difference in the proportions of rice and bread consumed between males and females. However, the proportion of respondents consuming bread or rice at least once a day, significantly decreased from urban to rural areas. Only 14.7% of respondents consumed bread and rice in rural areas as opposed to 78.4% of respondents in urban areas. Milk was consumed at least once per day by 19.6% of respondents. There was a very large difference in consumption between urban and rural respondents. Only 3.7% of rural respondents reported consuming milk as opposed to 29.4% of urban respondents. A national food consumption survey was carried out in French Polynesia in 1995 (Bricas, Etienne et al. 2001). It was undertaken by CIRAD and Ministere de l’Agriculture Service du Developpment Rural among 317 people aged over 16 years of age. The sample included residents of Tubuai (rural), Huahine (intermediate), Moorea (peri-urban) and Papeete (urban).
11
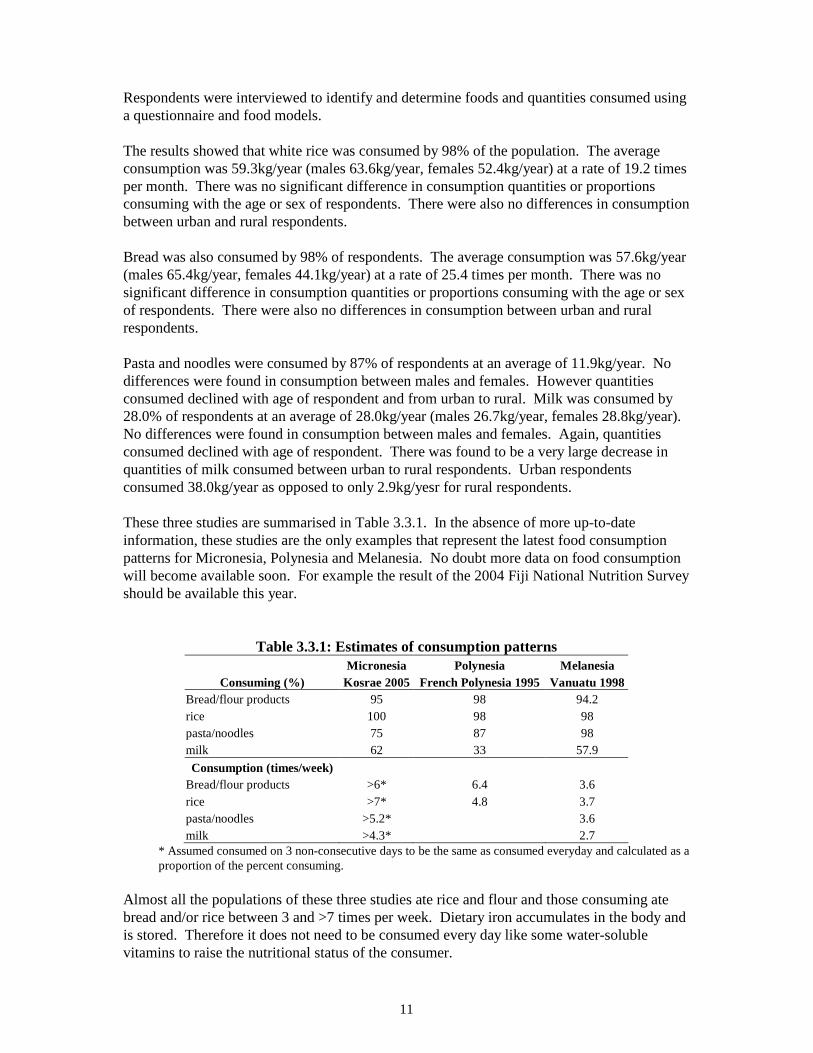
Respondents were interviewed to identify and determine foods and quantities consumed using a questionnaire and food models. The results showed that white rice was consumed by 98% of the population. The average consumption was 59.3kg/year (males 63.6kg/year, females 52.4kg/year) at a rate of 19.2 times per month. There was no significant difference in consumption quantities or proportions consuming with the age or sex of respondents. There were also no differences in consumption between urban and rural respondents. Bread was also consumed by 98% of respondents. The average consumption was 57.6kg/year (males 65.4kg/year, females 44.1kg/year) at a rate of 25.4 times per month. There was no significant difference in consumption quantities or proportions consuming with the age or sex of respondents. There were also no differences in consumption between urban and rural respondents. Pasta and noodles were consumed by 87% of respondents at an average of 11.9kg/year. No differences were found in consumption between males and females. However quantities consumed declined with age of respondent and from urban to rural. Milk was consumed by 28.0% of respondents at an average of 28.0kg/year (males 26.7kg/year, females 28.8kg/year). No differences were found in consumption between males and females. Again, quantities consumed declined with age of respondent. There was found to be a very large decrease in quantities of milk consumed between urban to rural respondents. Urban respondents consumed 38.0kg/year as opposed to only 2.9kg/yesr for rural respondents. These three studies are summarised in Table 3.3.1. In the absence of more up-to-date information, these studies are the only examples that represent the latest food consumption patterns for Micronesia, Polynesia and Melanesia. No doubt more data on food consumption will become available soon. For example the result of the 2004 Fiji National Nutrition Survey should be available this year.
Table 3.3.1: Estimates of consumption patterns Micronesia Polynesia Melanesia
* Assumed consumed on 3 non-consecutive days to be the same as consumed everyday and calculated as a proportion of the percent consuming.
Almost all the populations of these three studies ate rice and flour and those consuming ate bread and/or rice between 3 and >7 times per week. Dietary iron accumulates in the body and is stored. Therefore it does not need to be consumed every day like some water-soluble vitamins to raise the nutritional status of the consumer.
12
The studies also provide some indication of food distribution within countries and whether there are differences in consumption between rural and urban populations and other groups. The French Polynesia study was undertaken nationally and there were few differences between urban and rural consumption patterns of rice and flour. There is no reason to expect different consumption patterns for the rest of Polynesia. The Kosrae study was in effect a rural study and would reflect minimum access to imported rice and flour. It would be expected that the population of urban areas of Micronesia would consume higher intakes of rice and flour because the have easier access. The Vanuatu study was also a national study and showed there are large differences in consumption patterns of rural and urban consumers. Large urban-rural differences are characteristics of all Melanesian countries (except possibly New Caledonia) with the poorest health outcomes attributed to population living in remote rural areas. Therefore, given the limited evidence available, flour and rice appear to be the most suitable vehicles for fortification in PICs. Issues of access and availability in remote/rural Melanesia remain unresolved.
3.4: Fortified foods available in PICs
From discussions with industry representatives and database searches it appears that enriched or fortified foods are already available in most PICs. The majority of these foods come from Australia, New Zealand and the USA. Many foods available in Australia and New Zealand are voluntarily fortified with iron and in the USA flour is mandatory fortified with iron. Most of the white rice consumed in the United States is also enriched to bring the nutritional level of milled rice up to that of the whole grain (brown) rice. It is enriched with thiamin, niacin and iron. All enriched rice is additionally fortified with folic acid.
For Australia and New Zealand, FSANZ Standard 1.3.2 permits iron to be voluntary added to biscuits, bread, breakfast cereals, cereal flours, pasta, meat extracts and analogues of meat. Some fruit juices and milks contain added iron. Modified milks may be protein enriched, high in calcium, iron fortified or low in lactose to cater for a range of dietary requirements.
Many of these fortified products are exported to PICs, especially breakfast cereals, cereal flours, milk and pasta. At least one of these products can be seen in all PICs. Australian and NZ flour, milk, pasta are a regular feature in shops and supermarkets in PNG, Fiji, FSM, Guam, Solomon Islands, Samoa, Tonga, Nauru, Kiribati, New Caledonia and Vanuatu. Although rice is not fortified for the Australian domestic market, it is fortified with iron for the export market and does make its way to many Pacific countries. For example, iron enriched rice can be seen in supermarkets in Samoa (see picture in Annex 1). Table 3.4.1 shows that Australian rice is exported to 19 PICs and of these 12 PICs receive iron-enriched rice. Rice produced in the USA is also required to be fortified for the domestic market. Therefore, all US territories and protectorates a likely to receive enriched rice imports from the USA.
13
These countries include American Samoa, Federated States of Micronesia, Guam, Marshall Islands, Northern Mariana Islands and Palau. Australia (34%) and the USA (64%) supplied 98% of all rice imported into Samoa during 2004-2005. It is highly likely that most of this was enriched with iron. Many PICs import fortified flour from Fiji. Table 3.4.2 shows quantities and destinations for FFM flour products. Fiji iron-fortified flour supplied 86% and nearly 72% respectively, of all the flour imported into Samoa (2004-2005) and Tonga (2003) (see Tables 3.4.3 and 3.5.2).
Table 3.4.1: Australian rice exports Country Enriched
American Samoa Y Cook Islands Federated States of Micronesia Y Fiji French. Polynesia Guam Y Kiribati Y Marshall Islands Y Nauru New Caledonia North Mariana Islands Y Palau Y Papua New Guinea Y Samoa Y Solomon Islands Y Tonga Tuvalu Y Wallis and Futuna Vanuatu Y
Source: FFM 2006 Australia also produces iron-fortified flour for the domestic and export markets. For example Allied Mills produce “Outback Flour” specifically developed for Aboriginal people living in remote Australia. It is supplied in 10kg functional pails rather than bags. The pails have post purchase usage and ensure storage integrity in areas where refrigeration is not readily
14
available and increase the shelf-life to six months. The flour is enriched with niacin thiamin, folate as well as iron (6.7mg/100gms). Flour produced for the Australian domestic market can be voluntarily fortified with iron up to 3mg per reference serve. As a proportion of the RDI this is equal to 25%.
Table 3.4.3: Flour imports: Samoa 2004-2005 Exporting country Tonnes %
Australia 534.6 8.9 Fiji 5169.8 86.4 Total flour imports 5985.7
Source: Samoa Customs 2006 It is difficult to estimate what proportion of PIC food imports are already fortified with iron and more importantly, what proportion of Pacific populations already consume iron fortified foods. However, a summary of countries that do import enriched flour and rice is presented in Table 3.4.4. Where country data has been provided, the proportion of fortified food is given as a percentage of the total supply. Levels of enrichment and fortificants are not given. However, all flour produced and exported from Australia is fortified with thiamine.
Table 3.4.4: Countries receiving enriched rice and flour Enriched rice Enriched flour
Country % total
supply
Source % total
supply
Source American Samoa Y USA, Aust Y Fiji, USA Cook Islands Federated States of Micronesia Y USA, Aust Y Fiji, USA, Aust Fiji Y 100.0 Fiji, Aust French. Polynesia Y Fiji Guam Y USA, Aust Y USA, Aust Kiribati Y Aust Y Fiji Marshall Islands Y USA, Aust Y Nauru Aust New Caledonia Aust North Mariana Islands Y USA, Aust Y Palau Y 83.0 USA Y 79.5 USA Papua New Guinea Y Aust Samoa Y 98.0 USA, Aust Y 86.4 Fiji Solomon Islands Y Aust Y Fiji, Aust Tonga Y 11.8 USA Y 71.6 Fiji, Aust Tuvalu Y Aust Y Fiji Wallis and Futuna Y Fiji Vanuatu Y Aust Y Fiji, Aust
nb. All US flour and rice imports are assumed to be fortified.
3.5: Influence of Australia, NZ and the USA on food availability in PICs The Pacific food supply is dominated by Pacific Rim countries: Australia, New Zealand and the USA and to a lesser extent, France and the UK. All PICs depend on the Pacific Rim
15
countries for their welfare. No PICs are self-sufficient, although some specific regions of countries such as PNG and the Solomon Islands are still subsistence based. Australia, New Zealand and the USA also dominate the regional politically. PICs depend heavily upon them for infrastructure creation, economic support, governance and aid to survive. USAID, AusAID and NZODA provide millions of dollars annually for programs in health, education and economic development (Coyne 2000; Hughes 2003; Hughes and Lawrence 2005). The dominance of the Pacific Rim countries over the Pacific food supply also provides benefits. The food standards and quality of these exporting countries apply equally to PICs and therefore offer a standard equal to or higher than most PIC could achieve unaided. The general trend in Australia, New Zealand and the USA is towards enriching foods for domestic consumption with additional nutrients, including iron. These trends have positive flow-on effects for PIC in terms of providing a proportion of the Pacific food supply that is already fortified, as described in Section 3.3 above. Table 3.5.1 shows a range of fortified foods tested and/or analysed by FSANZ. It is not up-to-date as there are estimated to be about 1000 fortified foods in the Australian marketplace but it does show the range and degree of fortification.
Table 3.5.1: FSANZ Tested and analysed iron fortified foods and values Name of the Product Iron/100g
Bread White Iron Increased 6.00 mg
Bread White Iron Increased Toasted 7.143 mg
Bread White Calcium and Iron increased Toasted 2.410 mg
Breakfast Cereal Wheat bran Pellets 10.868 mg
Breakfast Cereal Wheat bran flakes 16.950 mg
Breakfast Cereal, Corn flakes with added Vitamins Fe and Zn 9.943 mg
Breakfast Cereal, Puffed or Popped Rice with added Fe Vitamins etc. 10.127 mg
Breakfast Cereal, Whole wheat biscuits, added with vitamin and iron 9.23 mg
Breakfast Cereal, Whole wheat biscuits, added bran vitamin and iron 10.00 mg
Breakfast Cereal Whole wheat small biscuit, with fruit or fruit paste 7.500 mg
Breakfast Cereal, Puffed Whole wheat (With added Fe and B1 B2, B3) 4.10 mg
Breakfast Cereal Wheat bran flakes with Sultana's (With addedB1-B3 , Fe, folate and Zn) 8.869 mg Breakfast Cereal, Oat flakes with rice and Wheat (Added with sugar, salt, B1-B3, Vitamins D and Iron 6.80 mg Breakfast Cereal, Rice and Wheatflakes Sweetened (With added Ca, Fe, Zn, B1-B3, Folate and B6) 12.425 mg
Breakfast Cereal Mixed Grain (Wheat, Corn ,Rice ) Flakes 8.10 mg Breakfast Cereal, Mixed Grain(Wheat, Corn, Rice aand Oats) flakes with fruit and Nut (Added with Vita C, folate, B1-B3, B6 Folate and Iron 6.30 mg Breakfast Cereal,Mixed Grain (Wheat, Oat , Corn) Extruded Shapes (Added withVit C, B1-B3, B6, Folate,Ca and Iron 18.941 mg Breakfast Cereal, Puffed Rice with Cocoa Coating (With added Fe, Zn, Ca, Vit C, B1-B3 and Folate) 9.033
Breakfast Cereal Cornflakes with Nuts (Record states Added Fe but value is low) 4.3 mg Breakfast Cereal, Fruit flavoured, Mixed cereal flavours, Sweetened (Added Vit. C, B1-B3, foalte, Zn, Fe) 11.00 mg
Source: FSANZ 2006
16
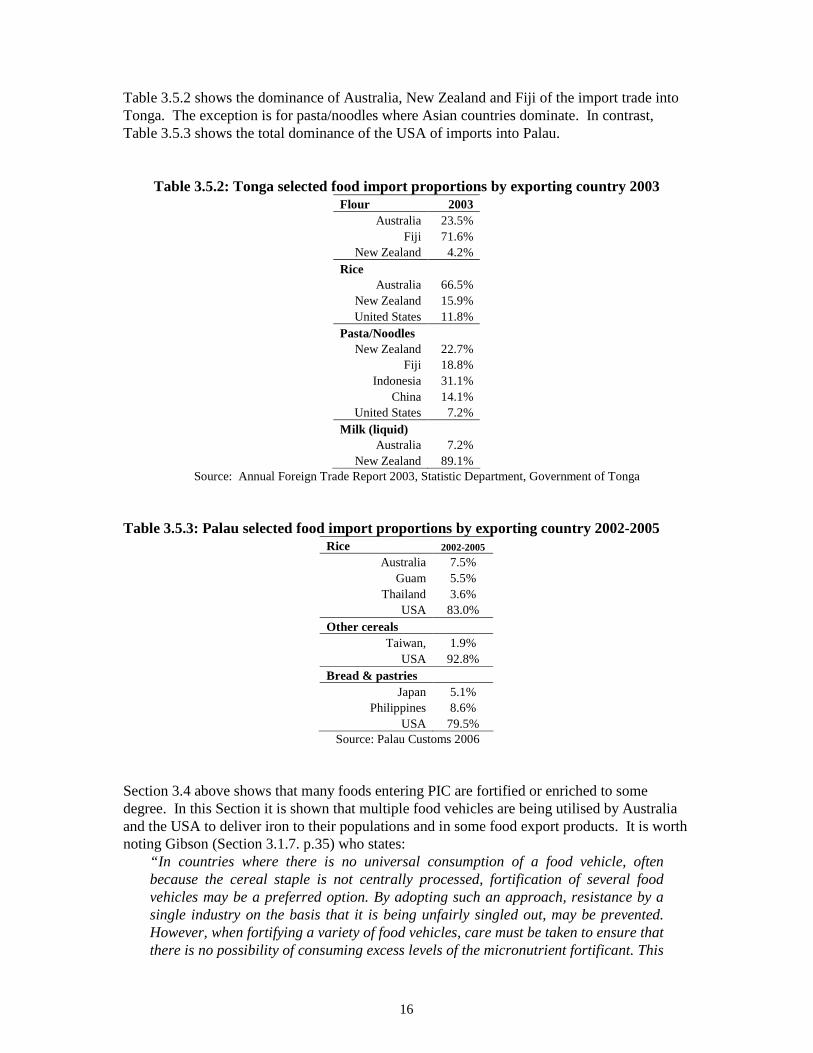
Table 3.5.2 shows the dominance of Australia, New Zealand and Fiji of the import trade into Tonga. The exception is for pasta/noodles where Asian countries dominate. In contrast, Table 3.5.3 shows the total dominance of the USA of imports into Palau.
Table 3.5.2: Tonga selected food import proportions by exporting country 2003 Flour 2003
Australia 23.5% Fiji 71.6%
New Zealand 4.2% Rice
Australia 66.5% New Zealand 15.9% United States 11.8%
Pasta/Noodles New Zealand 22.7%
Fiji 18.8% Indonesia 31.1%
China 14.1% United States 7.2%
Milk (liquid) Australia 7.2%
New Zealand 89.1% Source: Annual Foreign Trade Report 2003, Statistic Department, Government of Tonga
Table 3.5.3: Palau selected food import proportions by exporting country 2002-2005
Rice 2002-2005
Australia 7.5% Guam 5.5%
Thailand 3.6% USA 83.0%
Other cereals Taiwan, 1.9%
USA 92.8% Bread & pastries
Japan 5.1% Philippines 8.6%
USA 79.5% Source: Palau Customs 2006
Section 3.4 above shows that many foods entering PIC are fortified or enriched to some degree. In this Section it is shown that multiple food vehicles are being utilised by Australia and the USA to deliver iron to their populations and in some food export products. It is worth noting Gibson (Section 3.1.7. p.35) who states:
“In countries where there is no universal consumption of a food vehicle, often because the cereal staple is not centrally processed, fortification of several food vehicles may be a preferred option. By adopting such an approach, resistance by a single industry on the basis that it is being unfairly singled out, may be prevented. However, when fortifying a variety of food vehicles, care must be taken to ensure that there is no possibility of consuming excess levels of the micronutrient fortificant. This
17
can be achieved by fortifying each food vehicle with a proportion of the RDI. Calculations must be performed to ascertain the maximum level of each fortificant that could be consumed by each gender and life-stage group, if all the fortified food vehicles available in the country were consumed on a daily basis. These levels must then be compared against the corresponding gender and life-stage specific upper tolerable level (UL) to ensure that there is no risk of adverse health effects arising from excessive intakes of the micronutrients.” (Gibson 2003)
In Australia FSANZ Standard 1.3.2 clearly states that iron can be added to a food product to no more than 25% of RDI. The RDI applies only to the Australian population. However since there are many Pacific island people living in Australia, it must be assumed that the Australian RDI could apply to them also.
3.6 Reliability of the data Food availability data collected and analysed by FAO remains the best source of food availability in the Pacific. Unfortunately, these data only provide information for 8 PICs and at best, are only rough estimates. In many cases country import data were either inappropriate, unreliable or not available in a form that could be analysed. In some countries only the value of imports are recorded not the import volumes. In others data are collapsed over 2 or 3–year periods. In some countries volumes do not have units of measurement. Other counties supplied no data or do not collect food import information. The exceptions are the countries listed with availability information in Table 3.2.1 where import data received from country contacts matched Australian, NZ and US export data. It must be acknowledged that some counties are in the process of sending data that will not be received and analysed before this report is submitted. Table A3 in Annex 3 shows raw data received from all sources. It shows for some countries incomplete information. For other countries it shows unrealistic overestimations or underestimations. An example might be 32,299 tonnes of rice imported into Wallis and Futuna which works to 2.18 tonnes per person per year or nearly 6kg per person per day. It may be possible to rectify the anomalies and inconsistencies in these data. However, time does not permit for this consultancy. A full search of published and unpublished literature only revealed the 3 recent food consumption studies shown in Section 3.3 and Table 3.3.1. Fortunately, the studies were of sufficient quality to be confident of their accuracy. Additionally, the three countries in which the studies took place (Kosrae, French Polynesia and Vanuatu) were typical enough of their sub-regions (Micronesia, Polynesia and Melanesia) to generalise the results to their wider Pacific populations. Alone these studies may be sufficient enough on which to base a food fortification program. However, they do support the reliable food import and export data to identify flour and rice as the most likely vehicles for fortification. Data on the prevalence of anaemia is also inconsistent. Annex 2 shows that most of the data on anaemia is: 1) centred on women and children, 2) among sub-population groups 3) mostly regional or local, and 4) old. However, it is the best available and even at its worst still shows that anaemia is a serious public health problem for most of the region. For example in
18
Australia 20-40% of reproductive age women consume less than 70% of the recommended dietary intake of iron and the anaemia prevalence for female adults is 8-9%. The prevalence of helminth and parasite infection is very low among non-Indigenous Australians. However, helminth infection is high among Indigenous Australians, up to 70% of are estimated to suffer from anaemia and 80% are iron deficient. It is not known if helminth infection was eliminated among Indigenous Australians how much these anaemia rates would decline.
4.0: CONCLUSIONS AND RECOMMENDATIONS Background information provided by other authors and revisions and updates of existing data on anaemia in PICs shows that the prevalence of anaemia is high in the region and the most likely causes are diets insufficient in iron and/or parasite infections. Previous studies also concluded that the prevalence of anaemia in women and children in PICs is high enough to warrant a public health intervention and that fortifying the food supply with iron would be an effective way of increasing population iron intakes. However, this would not reduce anaemia caused by helminth and other parasitic infections. The most effective programs to reduce iron deficiency anaemia would involve the elimination of helminth and parasite infections and increasing dietary iron intakes of Pacific populations. This consultation firstly attempted to determine the total volumes and possible vehicles for fortification available for consumption in PICs by source of origin. Data were sought from individual PIC government officers, Australian, NZ, USA, FAO and industry databases. Total import volumes were determined where approximate agreement was reached between individual PIC import data and exporting country data. This was possible for 10 of the 21 PICs originally contacted. However, the information received was enough to show that sufficient quantities of wheat flour and rice were available to justify them as suitable vehicles for fortification. The principal sources of origin of flour and rice for most PICs were Fiji, Australia and the USA, although small proportions of rice were imported from Asian countries. This consultancy also determined that the vast majority of PICs are economically dependent on developed countries, especially Australia, NZ and the USA and that imported rice and flour from these countries now provide the main staple foods for most PICs. Literature searches found only three recent Pacific food consumption studies. These were reviewed in terms of proportions of the population consuming and frequency of consumption and aggregated by sex, age and level of urbanism. Distribution issues were also analysed. From these three studies it was found that the study populations ate rice and flour/bread between 3 and 7 times per week. There were no differences in consumption between males and females (except that females in general do not consume the same quantities as males) and different age groups and rural and urban populations, except in Vanuatu where there were large differences in consumption patterns of rural and urban consumers. In general, poorest health outcomes are attributed to populations living in remote rural areas. However, large urban-rural differences are characteristics of most Melanesian countries. On the basis of evidence food availability data and limited consumption studies flour and rice appear to be the most suitable vehicles for fortification in PICs. By Gibson’s standard, “... at
19
least 50% of the population at risk to the micronutrient deficiencies should consume the potential food vehicle throughout the year”. More than 50% of the study populations consumed flour and rice and it must be assumed they are “at risk”. It is not known if the consumption patterns of flour and rice identified in the studies vary within the year. However, since both flour and rice are imported, it is highly unlikely. It would be expected that there would be seasonal variations in consumption of fruits and vegetables and certain fish. The low proportion of rural populations consuming flour and rice (14.7%) in Vanuatu and possible most of Melanesia is much less than the 50% requirement. This is the proportion consuming at least once per day. These data could be reanalysed to show the mean frequency of consumption of rural populations. It may show that the majority consume flour and rice throughout the year. Therefore, these issues along with access and availability of flour and rice in remote/rural Melanesia remain unresolved and more importantly, these studies may be sufficient enough on which to base a food fortification program. It seems that many PICs import flour and rice that is already fortified. It is not possible within the scope of this consultancy to determine proportions of PIC food imports already fortified with iron and more importantly, what proportion of Pacific populations already consume iron fortified foods. Food production in Australian, NZ and the USA shows a general trend towards enriching foods for domestic consumption with additional nutrients, including iron. Because of the dominance of Australian, NZ and the USA over the Pacific food supply, these trends have positive flow-on effects for PIC in terms of providing a proportion of the Pacific food supply that is already fortified. It appears that a large proportion of flour and/or rice imports is already fortified for some PICs. The exact numbers of countries and the volumes of foods are not known. However, the issue of fortified multiple food vehicles becomes an alternative since it is the means that the Australian food industry is delivering iron to the Australian population. Food availability data collected and analysed by FAO remains the best source of food availability in the Pacific. Unfortunately, these data only provide information for 8 PICs and at best, are only rough estimates. In many cases country import data were either, unreliable, inappropriate, or not available in a form that could be analysed. This raises more issues than solely determining the nutrient quality of the food supply. It raises issues of national food security, disaster preparedness and emergency relief. Every country government should have easy access to up-to-date per capita food availability of nutrient rich foods in order to determine quantities of foods available to feed the population in times of emergency.
4.1: Conclusions The conclusions of the consultancy are listed below and are not in any order of priority. • The prevalence of anaemia is high in the region and the most likely causes are diets
insufficient in iron and/or parasite infections. • The prevalence of anaemia in women and children in PICs is high enough to warrant a
public health intervention. • Fortifying the food supply with iron would be an effective way of increasing population
iron intakes.
20
• The most effective programs to reduce iron deficiency anaemia would involve the elimination of helminth and parasite infections and increasing dietary iron intakes of Pacific populations.
• Food import volumes were determined for 10 PICs. • Sufficient quantities of wheat flour and rice were available to justify them as suitable
vehicles for fortification. • The principal sources of origin of flour and rice for most PICs were Fiji, Australia and the
USA and imported rice and flour from these countries now provide the main staple foods. • Literature searches found only three recent Pacific food consumption studies. • Low proportions of rural populations consume flour and rice (14.7%) in Vanuatu and
possibly most of rural/remote Melanesia. • On the basis of evidence food availability data and limited consumption studies, flour and
rice appear to be the most suitable vehicles for fortification. • Results of 3 food consumption studies may not be sufficient on which to base a food
fortification program. • Imported flour and rice is already enriched in many PICs. • Food production in Australian, NZ and the USA shows a general trend towards enriching
foods for domestic consumption with additional nutrients, including iron. • The issue of fortifying multiple food vehicles becomes an alternative to fortification of a
single food. • Food availability data collected and analysed by FAO remains the best source of food
availability in the Pacific. Unfortunately, these data only provide information for 8 PICs and at best, are only rough estimates.
• In many cases country import data were either, unreliable, inappropriate, or not available in a form that could be analysed, raising more issues than solely determining the nutrient quality of the food supply.
4.2: Recommendations From the results of this consultancy, it is recommended that: 1. Wheat flour and rice are the most suitable vehicles for iron fortification in PICs.
Issues such as levels and safety of iron fortificants, policing of mandatory fortification, quality control, contamination and producer compliance are beyond the scope of this consultancy.
2. Fortification and helminth elimination programs be undertaken in unison. There is enough evidence to suggest that a food fortification program should not be undertaken in isolation. Iron deficiency anaemia is an outcome of a range of influencing factors that include an iron deficient diet and helminth/parasite infections. Since fortified foods seem to be imported into many PICs, the question of whether a fortification program is necessary arises. More data should be collected to determine the exact proportions of fortified foods already entering PICs. Pacific governments should be alerted to this in order to make informed decisions about the development of national and/or regional food fortification programs. This also enables governments and regional bodies to determine whether a single or multiple food vehicle program will be the most effective.
3. Regular low-cost food and nutrition surveys be undertaken.
21
The searches undertaken during this consultancy showed that little is known about the dietary habits and food consumption patterns of Pacific populations. Very little is known about food distribution within countries and what proportion of anaemia prevalence is due to parasitic infection. Accurate information on food consumption is necessary for governments to make decisions about a range of food and health issues in order to develop policy and programs.
4. A uniform regional approach to food import and availability data collection and analysis be taken. This consultancy found it difficult to access individual PIC food availability data and of data received, many were incomplete, difficult to interpret and/or inconsistent. This raises issues of national food security, disaster preparedness and emergency relief. Every country government should have easy access to up-to-date per capita food availability of nutrient rich foods in order to determine quantities of foods available to feed populations in times of emergency.
5.0: ACKNOWLEDGEMENTS The author would like to thank Pacific country nutritionists, customs and agricultural officers for their assistance, patience and diligence. Without them no country data would have been made available.
6.0 REFERENCES Bricas, N., J. Etienne, et al. (2001). Resultats de l'enquete de consommation alimantaire realisee en
Polynesie Francaise en 1995. ACCORD CADRE No.69-94. C. M. d. l'Agriculture. Papeete, CIRAD & Ministere de l'Agriculture Service du Developpement Rural.
Carlot-Tary, M., R. Hughes, et al. (1999). 1998 Vanuatu Non-communicable diseases survey report. Noumea, New Caledonia, Secretariat of the Pacific Community.
Coyne, T. (2000). Lifestyle diseases in Pacific communities. Noumea, New Caledonia, Secretariat of the Pacific Community.
Englberger, L., G. C. Marks, et al. (2005). "Vitamin A intake and factors influencing it amongst children and caretakers in Kosrae, Micronesia." Ecology of food and nutrition 44: 307-338.
FAO (2000). FAO Food balance sheets. Rome, FAO. accessed at http://www.fao.org/ in Feb 2006. FAO (2002). FAO Food balance sheets. Rome, FAO. accessed at http://www.fao.org/ in Feb 2006. Gibson, R. (2003). Micronutrient fortification for countries of the Western Pacific Region. WHO
consultancy report. WHO. Manila, WHO WPRO. Hughes, R. (2003). A review of diet, the food supply and obesity in the Pacific. A background paper
presented at the FAO/SPC/WHO Pacific Islands food safety and quality consultation, 11-15 November 2002. Mocambo Hotel, Nadi, Fiji. Paper ref.WPR/ICP/HSE/4.4/001NUT-FOS(1)2002.11. Manila, WHO/WPRO.
Hughes, R. and M. Lawrence (2005). "Globalisation, food and health in Pacific Island countries." Asia Pacific Journal of Clinical Nutrition 14(4): 298-306.
Hughes, R., D. Sharp, et al. (2004). "Environmental influences on helminthiasis and nutritional status among Pacific schoolchildren." International Journal of Environmental Health Research 14(3): 163-177.
US Department of Agriculture (2006). US Trade Exports, USDA. accessed at http://www.fas.usda.gov/USTrade/USTExHS4.asp in March 2006.
22
ANNEX 1: FLOUR & RICE DISTRIBUTORS
Flour millers in Pics Flour Mills of Fiji Leonidas St Walu Bay, Suva Ph: 3301188 Goodman Fielder International (Fiji) Ltd 30 Karsanji Street, Bhindi Industrial Estate, Vatuwaqa, Suva, Tel: +67 93387 066 Fax: +67 93397 Punjas & Sons 63, Vitogo Parade, Lautoka, Tel: (679) 661633 FAX: (679) 663039 Email: [email protected] Rewa Rice Ltd 69 Kings Rd, Nausori Ph: 3477855
Fiji
Sudhakar S C & Sons Nawaka, Nadi Ph: 6701142 Mainland Holdings Lae Tel: (675) 472 3499 Associated Mills Limited, Speybank St, (PO Box 1906 Lae), Ph: 472 3555, Fax: 472 3424
PO Box 34, CUMMINS SA 5631 Telephone: 08 8676 2047 Fax: 08 8676 2452 Email: [email protected]
Tasmanian Flour Mills Pty Ltd
PO Box 145 LAUNCESTON TAS 7250 Telephone: 03 6331 3866 Fax: 03 6331 4794
Young Roller Flour Mill. NSW
PO Box 9, YOUNG NSW 2594 Telephone: 02 6382 1988 Fax: 02 6382 3536 Email: [email protected]
NZ Bakels 421-429 Church Street East PO Box 12-844. Penrose. Auckland 1135. Toll Free Tel: 0800 225 357. Tel: +64 9 579 6079 Email: [email protected]
Australian Flour Mills (distributors) SAFS International, PO Box R 1144 Royal Exchange Sydney NSW 1225 Telephone (612) 8220 4212 – Telefax (612) 9540 2542. E-Mail [email protected]
24
Australian rice Exporters Only one rice exporter for the whole of Australia was found. Ricegrowers' Association of Australia PO Box 706. Leeton NSW 2705 Ph: (02) 6953 0433 Fax: (02) 6953 3823 Email: [email protected]
Australian enriched rice in Samoa
25
ANNEX 2: PREVALENCE OF ANAEMIA
Best estimates of anaemia prevalence in PICs Table A2.1: Best estimates of anaemia prevalence in PICs
Country Women Children Other Pregnant Non-preg
Australia 10-15% 1989 29%(15-30y)1995 20.9% (4-12y) 2005* 33%-27% (12y-15y)
Tuvalu 23% 1983 26.3%(6-12y) 2002 77% school children 1983
Vanuatu 57% 1996 60% Lactating
10.1% 1992 17.2% iron def.
7.5%(6-12y) 2002 5.3% men 1996
Wallis & Futuna “Nutritional anaemia is rare”
Adapted from Gibson 2003. Anaemia: Men; Hb<13 g/dL, Women; Pregnant; Hb<11g/dL, Non-pregnant; Hb<12g/dL. Children: <5 y Hb < 11 g/dL, 5-11y HB < 11.5g/dL. * severe <4g/dL.
26
Iron deficiency anaemia in Australia Data provide by the Australian Iron Status Advisory Panel shows a number of large studies undertaken on iron status of Australian adults and children. From these, good estimates of prevalence can be made: Dietary inadequacy: between 20-40% of reproductive age women consume less than 70% of the recommended dietary intake of iron. In men the proportion is much lower. With most nutrients, consumption of less than 70% of the RDI would not necessarily be a problem, since most RDIs have a substantial safety margin built in. However, in the case of iron the safety margin is not so large. Anaemia: The prevalence of iron deficiency anaemia is approximately 2-5%. Biochemical deficiency: The following table shows how common biochemical deficiency is, especially in Australian women. Deficiency is defined as abnormal serum ferritin and/or transferrin saturation, with or without anaemia.
Table A2.2: Australian adults
Study %.deficient n=
Adults National Heart Foundation risk factor study f: 8% m: 2%
4,267 1,704
Teenagers National school study: f: 9% m: 2%
1,696
Elderly Various studies 8% hundreds
Vegetarians Australian general practice study f: 27% m: 5%
117
Aborigines Various studies 12-20% hundreds
Table A2.3: Other Australian population groups Age % iron deficient % anaemia n
Infants 6-12 months 20% 3% 69
12-24 months 35% 9% 122 Toddlers
9-24 months 20% depleted 3.4% deficient
4% 100
Schoolchildren 12 years Boys: 1% Girls: 2% n/a 404
Adolescents 15 years Boys: 2% Girls: 9% n/a 496
Aborigines Various 28-80% 20-70 various
Non-English speaking
background 6-24 months 28% 14% 43
Source: Iron Status Advisory Panel, http://www.ironpanel.org.au/ accessed March 2006.
27
References [1] Preliminary results from study of normal Adelaide children. Iron deficiency = serum ferritin < 16 ug/L (low transferrin sat.was also used). Note: ID does not include anaemic. Oti-Boateng P, Patrick S et al J of Paed and Child Health 1994;30:A17 [2] Preliminary report from Sydney division of general practice study . Iron depleted = ferritin < 11 ug/L, iron deficient = ferritin < 11 ug/L and MCV >70. Note: ID does not include anaemic. Proceedings of the Intern.Epidem.Assoc. conference, Sydney, September 1993 [3] Iron deficiency = serum ferritin < 10 ug/L (12 years) <12 ug/L (15 years) and TS < 16%. English R, Benett S. Iron status of Australian children. Med J Aust 1990;152:582-6 [4] Various studies, including Med.J.Austr. 1992;157:432, Gracey M et al (unpublished data) and Helman A, Beckers E (unpublished data). Higher prevalence figures from communities with widespread worm infestation. [5] Vietnamese and Cambodian children from the same study as [1 ] [6] Committee on Nutrition. American Academy of Pediatrics. (1992). The use of whole cow's milk in infancy. Pediatrics 89, 1105-1108. [7] Pollitt E, Leibel RL. (1976). Iron deficiency and behaviour. J Pediatr 88, 372-381. [8] Pearson H., Diseases of blood. Chapter 15 in: Nelson's Textbook of Pediatrics, 13th edition WB Saunders 1987. [9] Parks, Y.A. and Wharton, B.A. (1989). Iron Deficiency and the Brain. Acta Paediatr Scand Suppl 361, 71-77. [10] Hallberg, L. (1989). Search for nutritional confounding factors in the relationship between iron deficiency and brain function. American Journal of Clinical Nutrition, 50, 598-606. [11] Lozoff, B., Jimenez, E., and Wolf, A.W. (1991). Long-term developmental outcome of infants with iron deficiency. New England Journal of Medicine 325 (10), 687-694. [12] Farthing, M. (1989). Iron and immunity. Acta Paediatr. Scand. 3615, 44-52. [13] Dallman PR (1987). Iron deficiency and the immune response. Am J Clin Nutr 46, 329-334. [14] Dallman PR (1989) Iron deficiency: does it matter? J Internal Med 226, 367-372 [15] Yip R, Dallman PR (1988) The roles of inflammation and iron deficiency as causes of anaemia. Am J Clin Nutr 48, 1295-1300. [16] Roeser HP. Iron: Recommended nutrient intakes Australian papers. Truswell AS, Dreosti IE, English RM et al, eds. Sydney: Australian Professional Publications 1990: 224-56. [17] Lewis J, Holt R. NUTTAB91-92. Nutrient Data Table for Use in Australia. Australian Government Publishing Service, Canberra, 1991. [18] Sadler M, Lewis J, Buick D. Nutrient composition of Trim Lamb and Lean Beef. Supplement to Food Australia 1993; 45 (11): S3-S19.