The FERMI Large The FERMI Large Area Telescope in Area Telescope in orbit orbit Service de Physique des Service de Physique des Particules Particules March 30, 2009 March 30, 2009 Jean Ballet (CEA/DSM/IRFU/SAp) on behalf of the Fermi LAT Collaboration
Transcript
The FERMI Large The FERMI Large Area Telescope in Area Telescope in
orbitorbit
Service de Physique des Service de Physique des ParticulesParticules
March 30, 2009March 30, 2009
Jean Ballet (CEA/DSM/IRFU/SAp)on behalf of the Fermi LAT Collaboration
EGRET all-sky (galactic coordinates) E>100 MeV
diffuse extra-galactic background (flux ~ 1.5x10⁻⁵ cm-2s-1sr-1) galactic diffuse (flux ~30 times larger)high latitude (extra-galactic) point sources (typical flux from EGRET sources O(10-7 - 10-6) cm-2s-1)galactic sources (pulsars, un-ID’d)
An essential characteristic: VARIABILITY in time!Field of view important for study of transients
Features of the EGRET gammaFeatures of the EGRET gamma--ray skyray sky
> 2000 > 2000 AGNsAGNsblazars and radiogal = f(θ,z)
evolution z < 5Sgr A*
1010--5050 GRB/yearGRB/yearGeV afterglow
spectra to high energy
Cosmic rays and cloudsCosmic rays and cloudsacceleration in Supernova remnants
OB associationspropagation (Milky Way, M31, LMC, SMC)
Interstellar mass tracers in galaxies
PossibilitiesPossibilitiesstarburst galaxies
galaxy clustersmeasure EBL
unIDs
Dark MatterDark Matterneutralino linessub-halo clumps
PulsarsPulsarsemission from radio and X-ray pulsars
blind searches for new Gemingasmagnetospheric physics
pulsar wind nebulae
The ObservatoryThe Observatory
Gamma-ray Burst Monitor (GBM) NaI and BGO Detectors
8 keV - 30 MeV
Large AreaTelescope (LAT)20 MeV - >300 GeV
Spacecraft Partner: General Dynamics
KEY FEATURES• Huge field of view
–LAT: 20% of the sky at any instant; in sky survey mode, expose all parts of sky for ~30 minutes every 3 hours. GBM: whole unocculted sky at any time.
• Huge energy range, including largely unexplored band 10 GeV -100 GeV.
Total of >7 energy decades!• Large leap in all key capabilities. Great discovery potential.
Launch!Launch!
Cape Canaveral11 June 2008 at 12:05PM EDT
August 26 2008NASA renames GLAST to Fermi
Circular orbit, 565 km altitude (96 min period), 25.6 degrees inclinationDoes not operate inside South Atlantic AnomalyInclined at 35° from zenith, on alternate sides at each orbit
Fermi in orbitFermi in orbit
Year 1 Science Operations TimelineYear 1 Science Operations Timeline
LAUNCH L+60 days
week week week week month 12 m o n t h s
spacecraftturn-on checkout
LAT, GBMturn-on check out
“first light”whole sky
initial tuning/calibrations
pointed + sky survey tuning
Start Year 1 Science Ops
Start Year 2 Science Ops
in-depth instrument studies
sky survey + ~weekly GRB repoints + extraordinary TOOs
Release Flaring and Monitored Source Info
GBM and LAT GRB Alerts
continuousrelease of newphoton data
Observatoryrenaming
LAT 6-monthhigh-confidencesource release
LAT Year 1 photondata release PLUSLAT Year 1 Catalogand Diffuse Model
2ndSymposium2-5 Nov.
Distributed by Fermi Science Support Center at Goddardhttp://fermi.gsfc.nasa.gov/ssc/data/access/
LAT Collaboration LAT Collaboration –– an APan AP--HEP partnershipHEP partnership
! Japan– Hiroshima University– ISAS/JAXA– RIKEN – Tokyo Institute of Technology
! Sweden– Royal Institute of Technology (KTH)– Stockholm University
! United States– Stanford University (SLAC and HEPL/Physics)– University of California, Santa Cruz - Santa Cruz Inst. for Particle Physics– Goddard Space Flight Center– Naval Research Laboratory– Sonoma State University– The Ohio State University– University of Washington
PI: Peter MichelsonPI: Peter Michelson(Stanford)~390 Scientific Members (including 96 Affiliated Scientists, plus 68 Postdocs and 105 Students)
Cooperation between NASA and DOE, with key international contributions from France, Italy, Japan and Sweden.
Managed at SLAC.
Overview of the Large Area TelescopeOverview of the Large Area Telescope
AntiAnti--Coincidence (ACD):Coincidence (ACD):" Segmented (89 tiles)." Self-veto @ high energy limited." 0.9997 detection efficiency (overall).
Overall modular design:Overall modular design:" 4x4 array of identical towers - each one including a Tracker, a Calorimeter and
an Electronics Module" Surrounded by an Anti-Coincidence shield (not shown in the picture)" 3 ton – 650 W
γγγγ
e+ e-
Tracker DetailsTracker Details
Front Layers (2.7%X0 W converter)
Back Layers (18%X0 W converter)
Blank Layers (No W converter)
Tracker: angular resolution is determined by:multiple scattering (at low energies) => Many thin layersposition resolution (at high energies) => fine pitch detectors
! Front (thin) conversion layers to have small multiple scattering errors at low energies
! Back (thick) layers to increase conversion probability
Tracker Tower
CsI Calorimeter
See Atwood et al. 2007, Astropart.Phys.28:422-434
yyxxyyxxyyxxyyxxyyxxyyxxyyxxyyxxyyxx
Si layer
W coverter
From simulation to reconstructionFrom simulation to reconstruction
! Accurate detector model– >45k volumes
! Physical interactions modeled with Geant4! MC validation
– ground test with CR muons on the full LAT– beam test on a calibration unit
– 100M evts of γγγγ, e, p, e+, C, Xe between 50MeV and 300GeV collected at CERN and GSI in 2006
γγγγ
π π π π sneaking
dump
LAT Gamma Candidate Events LAT Gamma Candidate Events –– Flight DataFlight Data
The green crosses show the detected positions of the charged particles, the blue lines show the reconstructed track trajectories, and the yellow line shows the candidate gamma-ray estimated direction. The red crosses show the detected energy depositions in the calorimeter.
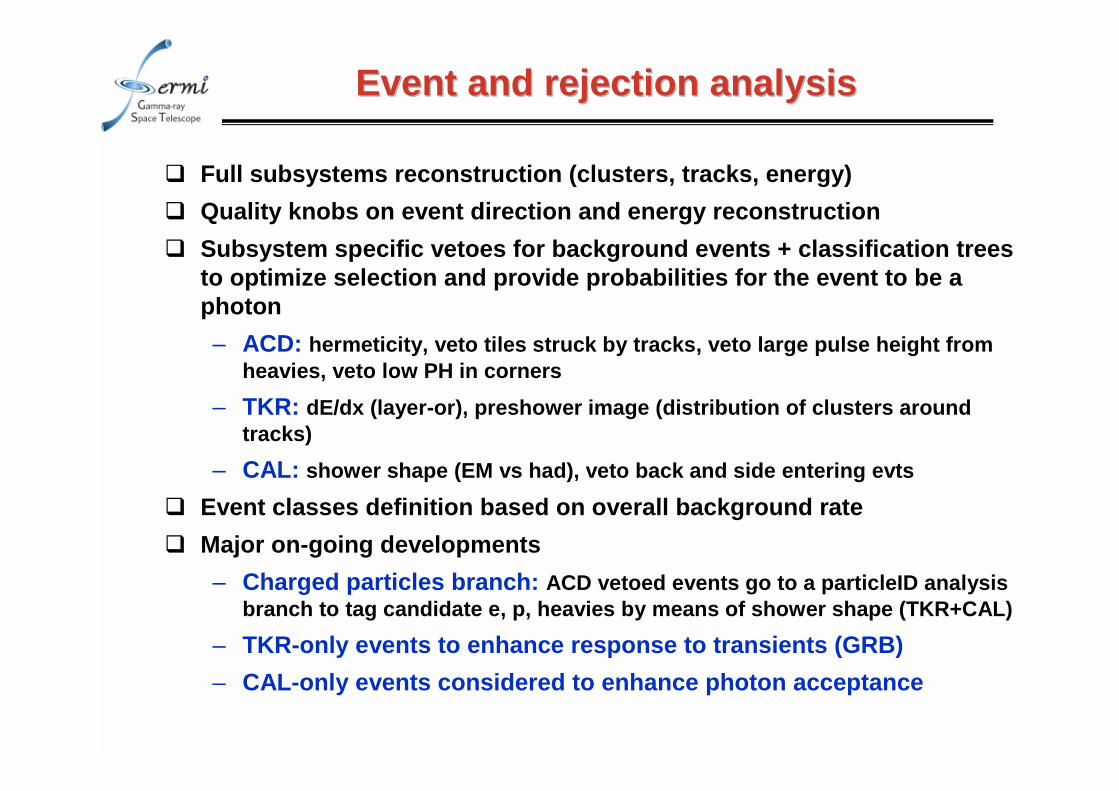
Event and rejection analysisEvent and rejection analysis
! Full subsystems reconstruction (clusters, tracks, energy)
! Quality knobs on event direction and energy reconstruction
! Subsystem specific vetoes for background events + classification trees to optimize selection and provide probabilities for the event to be a photon
– ACD: hermeticity, veto tiles struck by tracks, veto large pulse height from heavies, veto low PH in corners
– TKR: dE/dx (layer-or), preshower image (distribution of clusters around tracks)
– CAL: shower shape (EM vs had), veto back and side entering evts
! Event classes definition based on overall background rate
! Major on-going developments
– Charged particles branch: ACD vetoed events go to a particleID analysis branch to tag candidate e, p, heavies by means of shower shape (TKR+CAL)
– TKR-only events to enhance response to transients (GRB)
– CAL-only events considered to enhance photon acceptance
In flight response In flight response -- pileup eventspileup events
! CR rate is a steep function of earth magnetic field
! Fraction of off-time particles in the detector which leave ghost signal in coincidence with gammas
– Between 2% and 15% depending on magnetic latitude
! Ghost effect
– confuse/slow tracking and pattern recognition (#### CAL-seeded track recon)
– Alter event topology and fake bkg rejection topological cuts
Triggering gammaGhost track
Assessment of pileAssessment of pile--up effectsup effects
! Simulations enriched with ghosts from real periodic trigger events indicate
– Larger effect at low energies
– Maximum of 40% lower efficiency at 100MeV on-axis wrt pre-launch simulations
– Rapidly decreasing with energy - negligible above 10GeV
– Maximum effect on flux (over all spectrum) #### 30% bias
– Maximum effect on spectral parameters (for E-2 power law) #### 0.1 bias
! Very close to early papers assessment of systematics
– Much reduced systematics when corrected for!
! On-going work for corrections
– Correct IRFs for difference using simulations with ghosts
– Filter ghost events before recon
– Retrain event selection after addition of ghost in simulation + recon-filtering #### release post-launch IRFs for public data
• After 3 months LAT has surpassed EGRET and AGILE celestial γ-ray totals
• Unlike EGRET and AGILE, LAT is an effective All-Sky Monitorwhole sky every ~3 hours
CGRO EGRET
LAT as a LAT as a telescopetelescope
ExposureExposure mapmap
Equivalent on-axis observing time, Galactic coordinates, Aitoff projectionMs
! Data used are the first three months of all-sky scanning data, Aug. - Oct. 2008. Total live time is 7.53 Ms
! Scanning scheme makes exposure map very uniform (SAA creates 25% North-South asymmetry)
PRELIMINARY
The LAT Bright Source List (0FGL)The LAT Bright Source List (0FGL)
• 1.8 M events above 200 MeV with current cuts
• Wavelet analysis (peak detection) for source detection1. Front events > 200 MeV + Back events > 400 MeV2. Front events > 1 GeV + Back events > 2 GeV
• Large overlap at low energy $ Maximum likelihood analysis for locations, source significance, fluxes below and above 1 GeV, and variability information.
• Confidence level greater than 10 σσσσ over 3 months. Not uniform -sources near the Galactic plane must be brighter because of the strong diffuse background
• Associations with known sources
The Point Spread Function is key to source detection and identification
Cygnus region 1 to 100 GeVCygnus region 100 MeV to 1 GeV 3 months 0.2° pixelsCygnus region EGRET > 100 MeV95% confidence circles of 0FGL sources
Counts
205 LAT Bright Sources205 LAT Bright Sources
Front > 200 MeV, Back > 400 MeV
Galactic coordinates, Aitoff projection
PRELIMINARY
Crosses mark source locations, in Galactic coordinates. 1/3 at |b| < 10°. Only 60 clearly associated with 3EG EGRET catalog. The sky changes!
Source Source variabilityvariability
! Flag as variable for probability < 1%
! 1/3 sources flagged as variable
! Not very large fractional variability
Variable sources
PRELIMINARY
10 σ
33 σ
Rapid variabilityRapid variability
! PKS 1502+106 (aka OR 103), at z=1.84 (SDSS)
! Extremely rapid flare, possibly the highest ∆∆∆∆L/∆∆∆∆t detected to date in the GeV band (insert in the light curve)
PRELIMINARY
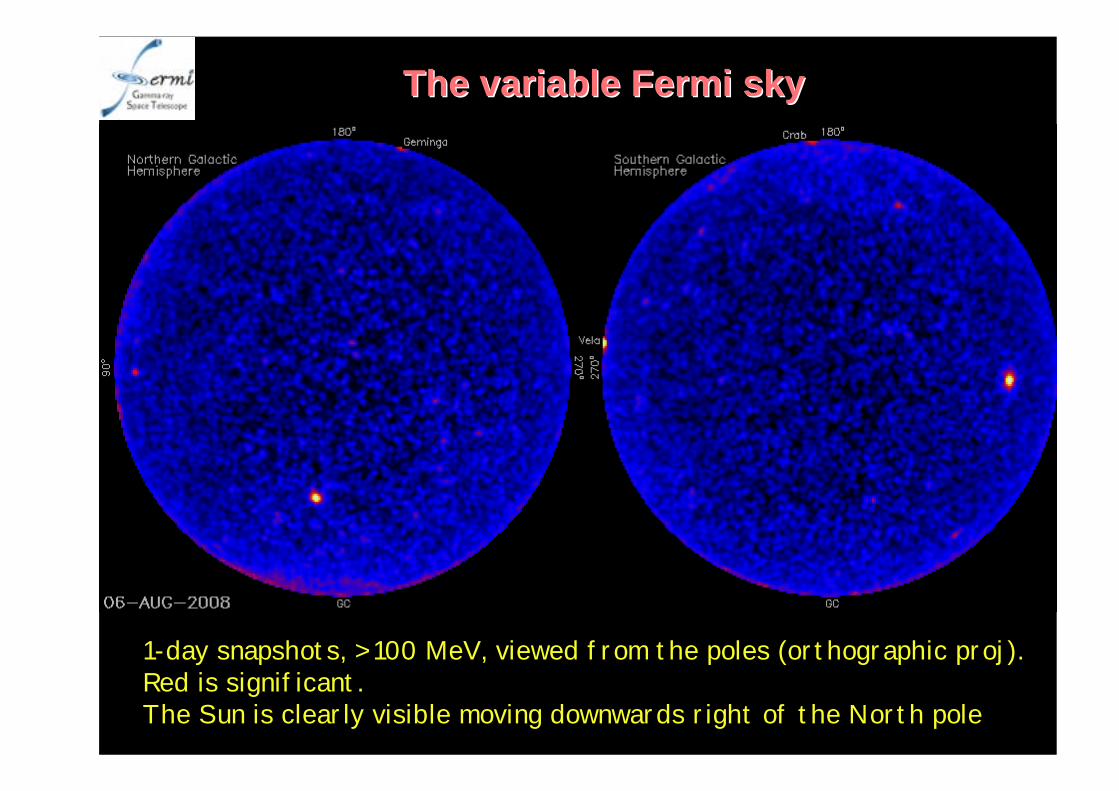
The variable Fermi The variable Fermi skysky
1-day snapshots, > 100 MeV, viewed from the poles (orthographic proj). Red is significant.The Sun is clearly visible moving downwards right of the North pole
Source associationSource association
PRELIMINARY
! 2/3 of the sources at |b|>10°, mostly AGN
! Not that many unassociated outside the plane
! Globular cluster 47 Tuc (plenty of ms pulsars), LMC / 30 Dor (diffuse)
3C454.3 (FSRQ) AO 0235+165 (Int. BL) Mkn501 (HBL)
SED SED atat LAT LAT energiesenergies
Preliminary
Significant departures from pure power-law distributions for bright blazarsNot always as nicely curved as the models
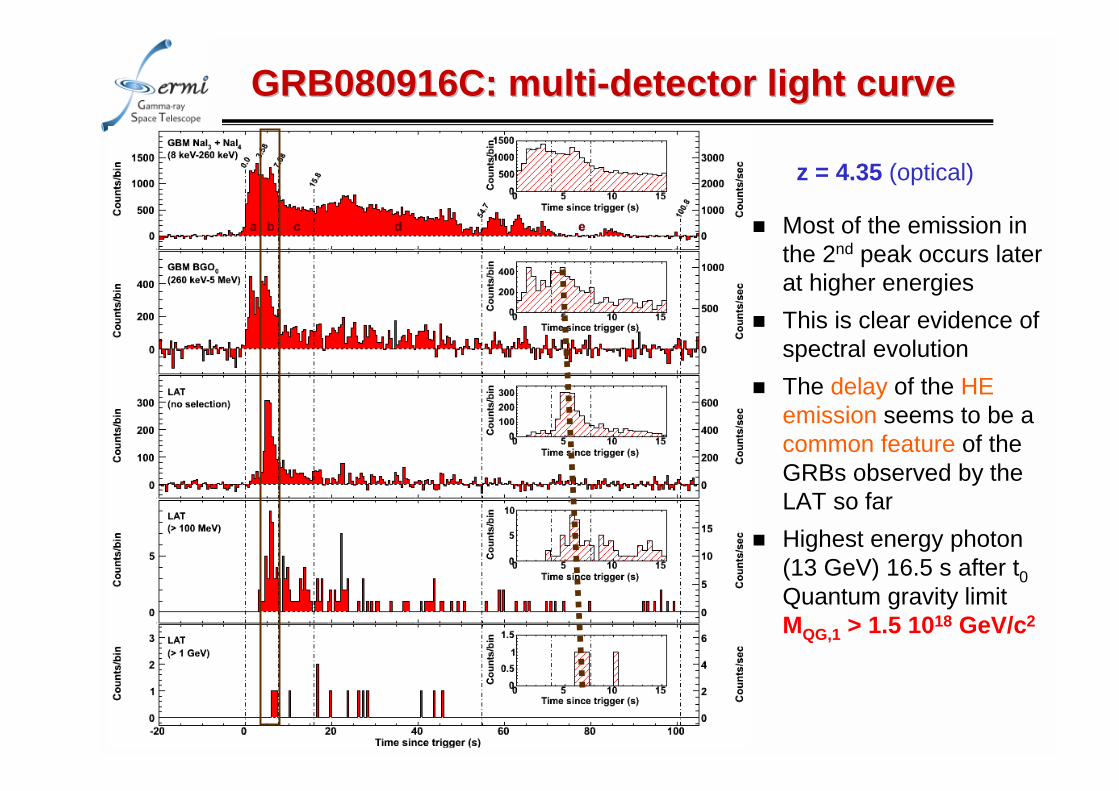
% Most of the emission in the 2nd peak occurs later at higher energies
% This is clear evidence of spectral evolution
% The delay of the HE emission seems to be a common feature of the GRBs observed by the LAT so far
% Highest energy photon (13 GeV) 16.5 s after t0Quantum gravity limit MQG,1 > 1.5 1018 GeV/c2
z = 4.35 (optical)
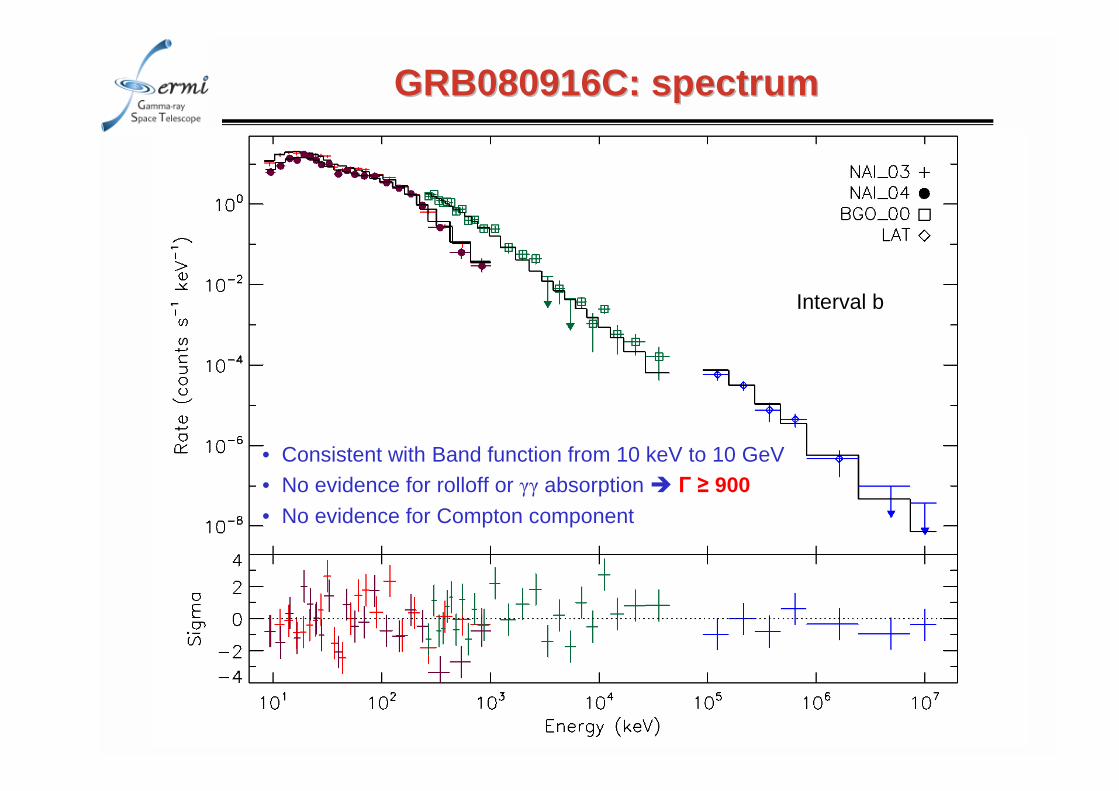
GRB080916C: spectrumGRB080916C: spectrum
• Consistent with Band function from 10 keV to 10 GeV• No evidence for rolloff or γγ absorption $ Γ ≥ 900• No evidence for Compton component
Interval b
Dark matter: Dark matter: γγ from WIMP Annihilationfrom WIMP Annihilation
Continuum spectrum with cutoff at Mχ
Spectral line at Mχ (for γγ)
"Detection of prompt annihilation into γγ(γZ0) would provide smoking gun for dark matter annihilation
"Requires best energy resolution"However, annihilation fraction in the range
10-3-10-4 (depending on the model)
Depends on DM density squared
Two different Scenarios: UED vs SUSYTwo different Scenarios: UED vs SUSY
mSUGRA parameters:
scaled to same area
Mχ=500 GeV
UEDSUSY
Consider the photon spectrum from 500 GeV WIMP annihilation in SUSY and in UED:
"UED: photons mostly from lepton bremsstrahlung
"SUSY: photons mostly from b quark hadronization and then decay, energy spread through many final states lower photon energy. p-wave dominated cross-section yields lower photon fluxes for equal masses
Spectra can look very different in these scenarios
All-sky map of DM gamma ray emission (Baltz 2006)
Search StrategiesSearch Strategies
Satellites:Low background and good source id, but low statistics, astrophysical background
Galactic center:Good Statistics but source confusion/diffuse background Milky Way halo:
Large statistics but diffuse background
Extra-galactic:Large statistics, but astrophysics, galactic diffuse background
Spectral lines:No astrophysical uncertainties, good source id, but low statistics
Uncertainties in the underlying particle physics model and DM distribution affect all analyses
Pre-launch sensitivities published in Baltz et al., 2008, JCAP 0807:013 [astro-ph/0806.2911]
Galactic CenterGalactic CenterGalactic Center
5 yrs
"Select a region of 0.5° around the galactic center, assume NFW profile and consider one WIMP annihilation channel at the time
"Remove astrophysical sources (based on spectral analysis, multiwavelengthobservations. Difficult, their behavior at these energies is not known) in the region
"Perform χ2 test to disentangle dark matter contribution from diffuse background
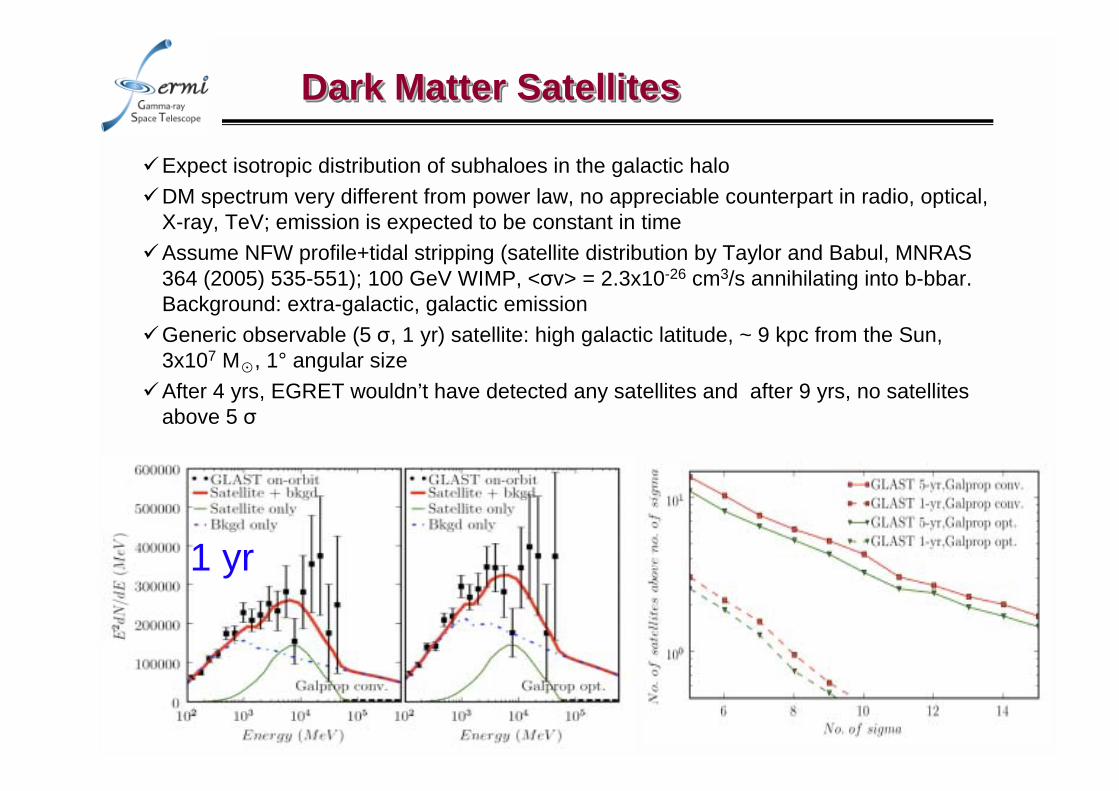
Dark Matter SatellitesDark Matter SatellitesDark Matter Satellites
1 yr
"Expect isotropic distribution of subhaloes in the galactic halo
"DM spectrum very different from power law, no appreciable counterpart in radio, optical, X-ray, TeV; emission is expected to be constant in time
"Assume NFW profile+tidal stripping (satellite distribution by Taylor and Babul, MNRAS 364 (2005) 535-551); 100 GeV WIMP, <σv> = 2.3x10⁻²⁶ cm3/s annihilating into b-bbar. Background: extra-galactic, galactic emission
"Generic observable (5 σ, 1 yr) satellite: high galactic latitude, ~ 9 kpc from the Sun, 3x10⁷ M, 1° angular size
"After 4 yrs, EGRET wouldn’t have detected any satellites and after 9 yrs, no satellites above 5 σ
EGRET GeV ExcessEGRET GeV Excess
10o < |b| < 20o
mWIMP = 60 GeVde Boer et al, A&A (2005)
EGRET observed an all sky excess in the GeV range compared to predictions from cosmic-ray propagation and γ-ray production models which could be attributed to dark matter annihilation
The data collected by the Fermi LAT during the first 5 months of operation does not confirm the excess at intermediate latitudes and strongly constrains dark matter interpretations
PRELIMINARY
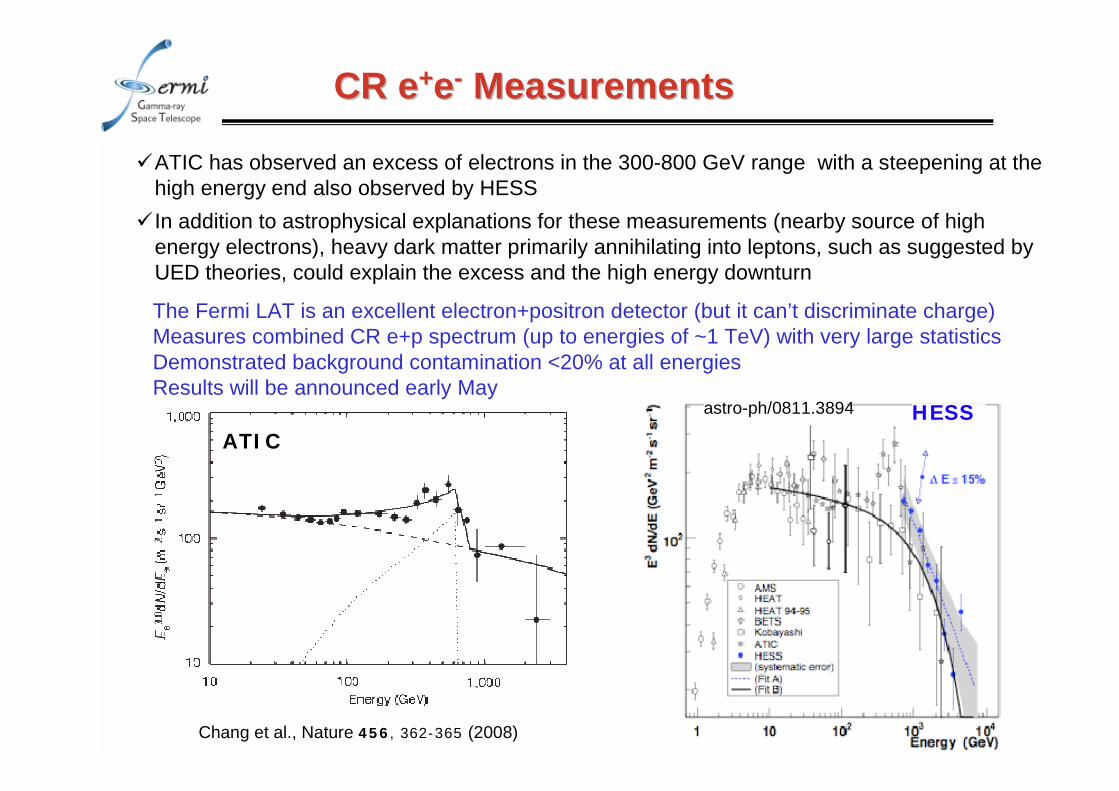
CR eCR e++ee-- Measurements Measurements
astro-ph/0811.3894 HESS
Chang et al., Nature 456, 362-365 (2008)
ATIC
"ATIC has observed an excess of electrons in the 300-800 GeV range with a steepening at the high energy end also observed by HESS
" In addition to astrophysical explanations for these measurements (nearby source of high energy electrons), heavy dark matter primarily annihilating into leptons, such as suggested by UED theories, could explain the excess and the high energy downturn
The Fermi LAT is an excellent electron+positron detector (but it can’t discriminate charge)Measures combined CR e+p spectrum (up to energies of ~1 TeV) with very large statisticsDemonstrated background contamination <20% at all energiesResults will be announced early May
1. Radio-quiet gamma-ray sources list generated pre-Launch, with very accurate source locations from other wavelengths.a. 3EG J1835+5918 (possibly the “next Geminga”)b. Compact objects of Pulsar Wind Nebulae (PWNe)c. Milagro sources (e.g. MGRO J2019+37)
2. Fermi-LAT sources – a list of gamma-ray sources generated post-Launch with a Fermi localization
Search for new Search for new γγγγγγγγ--ray pulsarsray pulsars
6 known γ-ray pulsars from EGRET
One radio quiet (Geminga)
Look for others
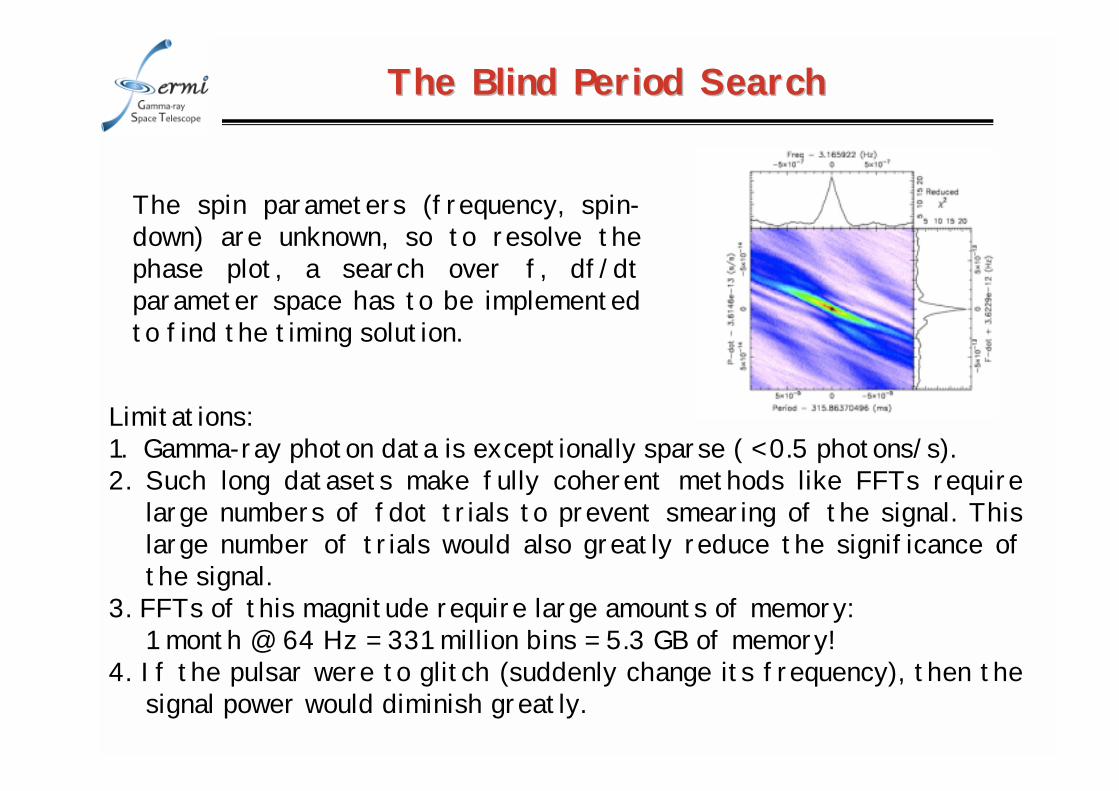
The Blind Period SearchThe Blind Period Search
The spin parameters (frequency, spin-down) are unknown, so to resolve the phase plot, a search over f, df/dtparameter space has to be implemented to find the timing solution.
Limitations: 1. Gamma-ray photon data is exceptionally sparse ( < 0.5 photons/s).2. Such long datasets make fully coherent methods like FFTs require
large numbers of fdot trials to prevent smearing of the signal. This large number of trials would also greatly reduce the significance of the signal.
3. FFTs of this magnitude require large amounts of memory:1 month @ 64 Hz = 331 million bins = 5.3 GB of memory!
4. If the pulsar were to glitch (suddenly change its frequency), then the signal power would diminish greatly.
The The ““TimeTime--DifferencingDifferencing”” TechniqueTechnique
Periodicity in photon arrival times will also show up in differences of photon arrival times. Time differences cancel out long term phase slips and glitches because differencing starts the "clock" over (and over, and over...)Despite the reduced frequency resolution (and therefore number of bins), the sensitivity is not much reduced because of a compensating reduction in the number of fdot trials
Discovery of First GammaDiscovery of First Gamma--rayray--only Pulsar only Pulsar
A radio-quiet, gamma-ray only pulsar, in Supernova Remnant CTA1
Age ~(0.5 – 1)x104 yearsDistance ~ 1.4 kpcDiameter ~ 1.5°
1420 MHz Radio Map:Pineault et al., A&A 324, 1152 (1997)
P ~ 317 msPdot ~ 3.6E-13
•Spin-down luminosity ~1036 erg s-1, sufficient to supply the PWN with magnetic fields and energetic electrons.
•The γ-ray flux from the CTA 1 pulsar corresponds to about 1-10% of Erot (depending on beam geometry)
Quick discovery enabled by• large leap in key capabilities• new analysis technique (Atwood et al)
Abdo et al., Science Express, 16 Oct. 2008
The Pulsing SkyThe Pulsing Sky
Pulses at1/10th true rate
25 radio-loud PSRs (7 ms)13 radio-quiet PSRs
ConclusionsConclusions
• CGRO/EGRET found only 31 sources above 10 σ in its lifetime, Fermi/LAT found 205 in the first 3 months
• Typical 95% error radius is less than 10 arcmin. For the brightest sources, it is less than 3 arcmin. Improvements are expected.
• About 1/3 of the sources show definite evidence of variability.
• 38 pulsars are identified by gamma-ray pulsations (up from 6).
• Over half the sources are associated positionally with blazars (85% associations outside the plane, up from 60%).
• 37 sources have no obvious associations with known gamma-ray emitting types of astrophysical objects.
• 1 very bright γ-ray burst, several fainter ones.
• 2 high-mass X-ray binaries (LSI +61 303 and LS 5039)
• Several TeV sources, including PWNe and SNR associations (W28, W41, W51, IC443)