The Financial Benefits of Enhanced College Credential and Credit Recognition in Ontario Prepared for: Colleges Ontario 655 Bay Street, Suite 1010 Toronto, ON, M5G 2K4 Prepared by: The Centre for Spatial Economics 15 Martin Street, Suite 203 Milton, ON L9T 2R1 The Centre for Spatial Economics Assessing past, present and future economic and demographic change in Canada
Transcript
The Financial Benefits of Enhanced College Credential and Credit Recognition in Ontario
Prepared for:
Colleges Ontario 655 Bay Street, Suite 1010 Toronto, ON, M5G 2K4
Prepared by:
The Centre for Spatial Economics 15 Martin Street, Suite 203 Milton, ON L9T 2R1
The Centre for Spatial Economics
Assessing past, present and future economic and demographic change in Canada
The Centre for Spatial Economics
Abstract
This study assesses the economic and financial benefits for individuals and the province of Ontario of implementing a coordinated, province-wide credential and credit recognition and transfer system for
Ontario college graduates enrolling in a university undergraduate degree program in the province. The
study demonstrates that there are solid economic and financial reasons to develop such a system. It also recognizes that the current patchwork transfer framework results in significant instances of inequity for
students and that an enhanced system will encourage more students to pursue the higher education that
matches their interests and skills. It will also reduce the number of students who feel compelled to leave
Ontario to continue their education. The study recommends a Made-in-Ontario solution to address the fundamental equity and fairness concerns of students, to simplify administration for post-secondary
institutions, and to strengthen our economy by providing educational opportunities for the workforce this
province will need to compete and prosper in the global economy.
About This Study
This study was commissioned by Colleges Ontario to provide an analysis of the economic and financial benefits of college credential and credit recognition in Ontario. Colleges Ontario is the advocacy
organization for the 24 colleges of applied arts and technology in Ontario and its mission includes
promoting the value and importance of robust post-secondary education (PSE) pathways for college students.
The study was conducted by Robin Somerville of The Centre for Spatial Economics (C4SE). The C4SE
monitors, analyzes, and forecasts economic and demographic change throughout Canada at virtually all levels of geography. It also prepares customized studies on the economic, industrial and community
impacts of various fiscal and other policy changes, and develops customized impact and projection
models for in-house client use. Our clients include government departments, industry and professional
associations, crown corporations, manufacturers, retailers and real estate developers.
The Centre for Spatial Economics
Table of Contents Executive Summary .................................................................................................................... 1
Comparison with OCAS and MTCU Projections ................................................................... 17
Enhanced Credential and Credit Recognition and CAAT Graduate Enrolment in Degree Programs ............................................................................................................................... 18
Economic and Financial Analysis Framework ........................................................................... 21
Current Practice Assumptions ................................................................................................ 21
Impact on Time Needed to Graduate...................................................................................... 22
Calculating the Direct Benefits .............................................................................................. 23
Economic and Fiscal Impact Methodology ............................................................................ 23
Financial and Economic Benefits of Enhanced Credential and Credit Recognition ..................... 25
Direct Private Benefits to Students and their Families ............................................................ 25
Direct Public Sector Benefits ................................................................................................. 26
Direct Benefit to Society ....................................................................................................... 27
Total Economic and Fiscal Benefits ....................................................................................... 27
Appendix B: C4SE Provincial Modeling System ....................................................................... 42
The Financial Benefits of Enhanced College Credential and Credit Recognition in Ontario Page 1
The Centre for Spatial Economics
Executive Summary
This report is a study of the potential economic benefits to students, government and the economy that would come from the development of a transparent and coordinated system for transferring
completed post-secondary credits in Ontario.
The movement of students between post-secondary institutions is becoming increasingly common and has created a need for greater emphasis on ensuring that post-secondary pathways are clear
and that the system supports student mobility. Currently, the system in Ontario is flawed. This is
particularly problematic when college graduates pursue degree completion at a university. In
many cases, students are forced to repeat courses that they have already completed, creating unnecessary costs for students and government, and delaying the time it will take for the students
to graduate.
This study demonstrates that there are solid economic and financial reasons to develop and implement a coordinated, province-wide credential and credit recognition and transfer system for
college graduates enrolling in an Ontario undergraduate degree program.
Based upon the available evidence, this study assumes that, on average, college graduates who enrol in an Ontario university program receive recognition for between 35 percent and 45 percent
of their college education. The study assesses the economic and financial impacts of increasing
the average amount of credit recognition to 65 percent. The 65 percent target was determined
through an examination of practices in other jurisdictions and a review of the Port Hope Accord, a previous memorandum of understanding on credit recognition between the college and university
sectors.
Under a 65 percent practice, the following benefits would be achieved:
o The private benefit to each student averages over $26,000 and could be as high as $50,000.
o The average annual benefit to Ontario‟s economy over the next decade lies between $69
and $136 million in additional GDP and rises to between $393 and $782 million a year in
the long-term.
o The average annual net fiscal benefit to the Government of Ontario over the next decade
lies between $36 and $61 million and rises to between $91 and $169 million a year in the
long-term.
Ontario‟s economic future depends on the skills and knowledge of students with a strong post-
secondary education. An enhanced, province-wide, coordinated credit transfer and credential
recognition system will encourage more students to pursue the higher education that matches their interests and skills. It will also reduce the number of students who feel compelled to leave Ontario
to continue their education.
Ontario‟s post-secondary education system is unique. A solution cannot simply be imported from
another region. However, the issues confronting students – and the potential benefits to the provincial economy – make this an issue that the government cannot ignore. A Made-in-Ontario
solution is required to address the fundamental fairness concerns of students.
Establishing a new and effective provincial credit transfer system will undoubtedly require up-front provincial investments. New investments will be balanced by mid- and long-term financial
benefits for the province. Now is the time for the government to provide the leadership necessary
to develop and implement an effective transfer framework.
The Financial Benefits of Enhanced College Credential and Credit Recognition in Ontario Page 2
The Centre for Spatial Economics
Introduction
The proportion of the population in Ontario obtaining undergraduate university degrees has risen
steadily over the last few decades. The forces driving this trend are both social and economic and
reflect the rising value individuals and society place on post-secondary education (PSE) and credentials. Most students follow the traditional pathway from high school to university but a
transition from college to university is an increasingly important pathway for many students.
Currently most college students who enrol in a university undergraduate degree program, either before completing a college program or after graduation, negotiate a credit recognition and
transfer process with each institution they apply to in order to have their previous academic
experience appropriately recognized. The absence of clear, comprehensive information on credit
recognition and transfer options and processes drives up costs for students, graduates, their families, the PSE system and the provincial government.
The number of Ontario university applicants with at least some previous Ontario College of
Applied Arts and Technology (CAAT) education has risen from 7.6% of all applicants a decade ago to 11.4% in 2007/08. The number of applicants that then go on to register at an Ontario
university has, in comparison, risen more slowly: rising from 4.8% of all registrants a decade ago
to 6.1% in 2007/08. While 8.7% of Ontario college graduates went on to attend university in
2006/07 (up from just 5.0% in 2000/01), only 7.0% attended an Ontario university degree program. The remainder attended either another type of university program in the province or a
university outside the province.1
The goal of this study is to assess the economic and financial benefits for individuals and the province of Ontario of implementing a coordinated, province-wide credential and credit
recognition and transfer system for Ontario college graduates enrolling in a university
undergraduate program in the province.2 The key objectives of the study are to:
o Estimate the direct additional costs borne by college graduates and their families as a
result of being required to duplicate learning when enrolled in an undergraduate
university degree program
o Estimate the direct additional costs to the Province of Ontario resulting from transfer payments to post secondary institutions and student financial aid
o Estimate the potential cost savings for individuals and the province of Ontario of
implementing a coordinated, province-wide credit recognition and transfer system
o Estimate the financial impacts of the delay in entering the workforce for and graduates;
and
o Estimate the implications for the province‟s economy
1 Colleges Ontario, Student Mobility Between Ontario’s Colleges and Universities, (available from www.collegesontario.org, 2009) pp. 5-6.
2 The analysis has been limited to college graduates, although college students also enrol in university
undergraduate degree programs before completing their diploma. There are no reliable data to estimate the
potential benefit to this group of students. They would, however, also benefit from an enhanced transfer
system and, therefore, raise the economic and fiscal benefits estimated in this analysis.
The Financial Benefits of Enhanced College Credential and Credit Recognition in Ontario Page 3
The Centre for Spatial Economics
The study is organized in seven sections. The next section reviews current credit transfer and
recognition practices in Ontario. The third section reviews credit transfer practices in other jurisdictions and places Ontario‟s PSE system in context. The fourth section provides a set of
estimates of the number of college graduates that will enrol in an undergraduate university
program over the next decade. This information is used in conjunction with the economic and
financial analysis framework developed in the next section to estimate the financial and economic benefits of enhanced credential and credit recognition in Ontario. Finally, the study ends with a
brief set of concluding remarks and observations arising from the analysis.
The Financial Benefits of Enhanced College Credential and Credit Recognition in Ontario Page 4
The Centre for Spatial Economics
Current Credit Transfer and Recognition Practices in Ontario
The number of college students and graduates seeking access to Ontario university undergraduate
degree programs has more than doubled in the last eight years. More students are attending
colleges to either upgrade their skills to facilitate entry into university or to obtain complementary
college and university credentials to enhance their success in the workplace.
The current transfer framework in Ontario ensures, however, that the proportion of students
transferring from Ontario‟s colleges to its universities is low in comparison to other jurisdictions
in North America. Student transfers within Ontario‟s post-secondary education system are determined by a series of Ontario college to university transfer agreements that exist for specified
programs between two or more institutions. These transfer agreements are not coordinated or
universal so a college graduate could receive different levels of credential recognition depending
on the specific university selected.3
Applied research on this issue has, however, been hindered by a lack of data on current credit
transfer and recognition practices in the province. This study attempted to generate a set of
quantitative estimates of current practices for credit recognition currently granted by universities to college graduates based on data from the Graduate Satisfaction Survey
4 for survey years
2006/07 and 2007/08.
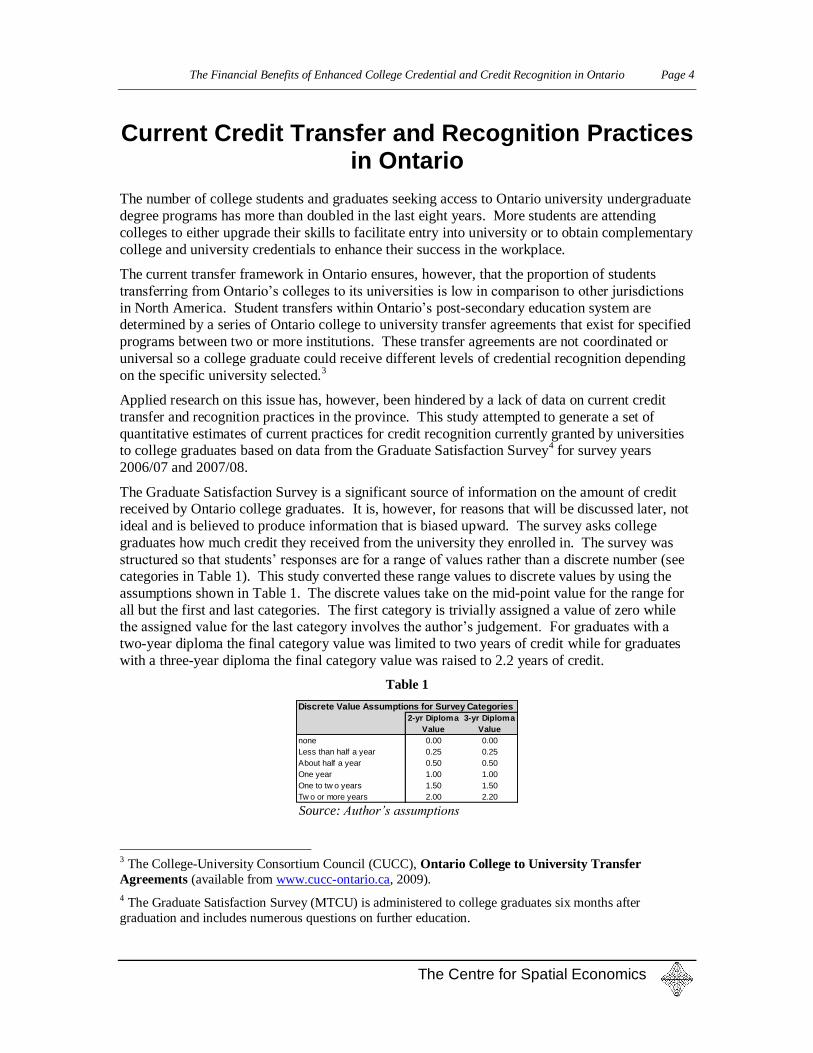
The Graduate Satisfaction Survey is a significant source of information on the amount of credit received by Ontario college graduates. It is, however, for reasons that will be discussed later, not
ideal and is believed to produce information that is biased upward. The survey asks college
graduates how much credit they received from the university they enrolled in. The survey was
structured so that students‟ responses are for a range of values rather than a discrete number (see categories in Table 1). This study converted these range values to discrete values by using the
assumptions shown in Table 1. The discrete values take on the mid-point value for the range for
all but the first and last categories. The first category is trivially assigned a value of zero while the assigned value for the last category involves the author‟s judgement. For graduates with a
two-year diploma the final category value was limited to two years of credit while for graduates
with a three-year diploma the final category value was raised to 2.2 years of credit.
Table 1
Discrete Value Assumptions for Survey Categories
2-yr Diploma
Value
3-yr Diploma
Value
none 0.00 0.00
Less than half a year 0.25 0.25
About half a year 0.50 0.50
One year 1.00 1.00
One to tw o years 1.50 1.50
Tw o or more years 2.00 2.20 Source: Author’s assumptions
3 The College-University Consortium Council (CUCC), Ontario College to University Transfer
Agreements (available from www.cucc-ontario.ca, 2009).
4 The Graduate Satisfaction Survey (MTCU) is administered to college graduates six months after
graduation and includes numerous questions on further education.
The Financial Benefits of Enhanced College Credential and Credit Recognition in Ontario Page 5
The Centre for Spatial Economics
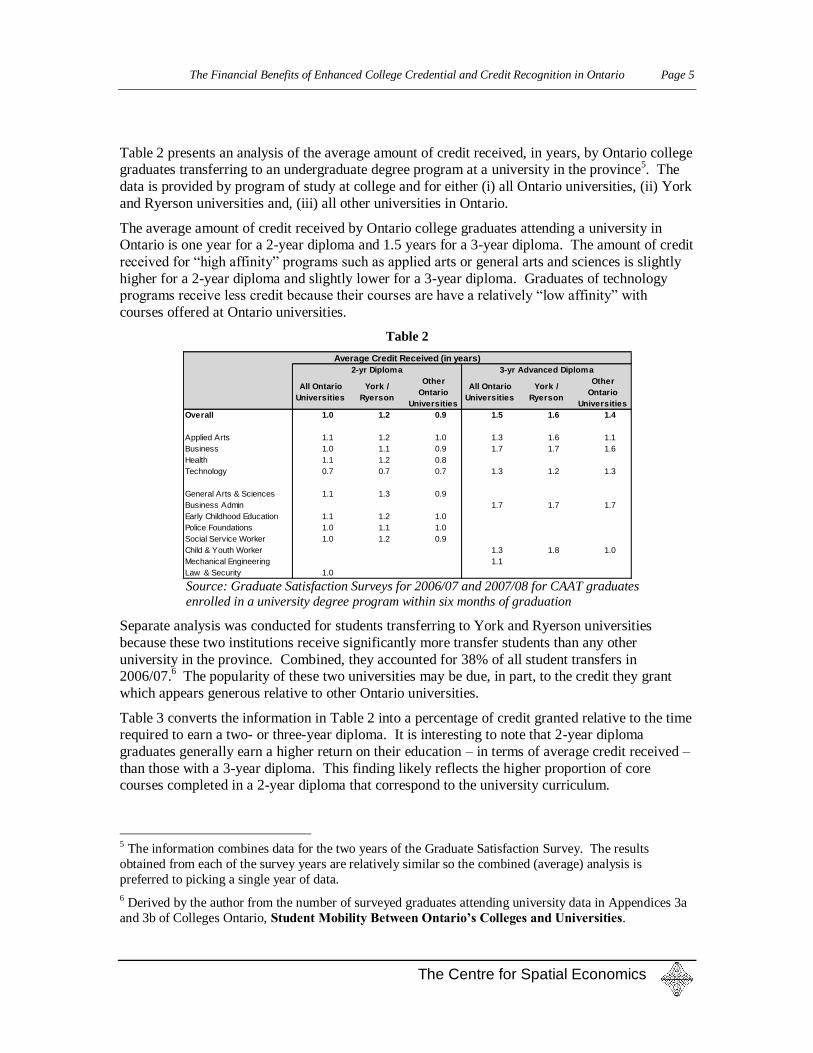
Table 2 presents an analysis of the average amount of credit received, in years, by Ontario college graduates transferring to an undergraduate degree program at a university in the province
5. The
data is provided by program of study at college and for either (i) all Ontario universities, (ii) York
and Ryerson universities and, (iii) all other universities in Ontario.
The average amount of credit received by Ontario college graduates attending a university in Ontario is one year for a 2-year diploma and 1.5 years for a 3-year diploma. The amount of credit
received for “high affinity” programs such as applied arts or general arts and sciences is slightly
higher for a 2-year diploma and slightly lower for a 3-year diploma. Graduates of technology programs receive less credit because their courses are have a relatively “low affinity” with
courses offered at Ontario universities.
Table 2
All Ontario
Universities
York /
Ryerson
Other
Ontario
Universities
All Ontario
Universities
York /
Ryerson
Other
Ontario
Universities
Overall 1.0 1.2 0.9 1.5 1.6 1.4
Applied Arts 1.1 1.2 1.0 1.3 1.6 1.1
Business 1.0 1.1 0.9 1.7 1.7 1.6
Health 1.1 1.2 0.8
Technology 0.7 0.7 0.7 1.3 1.2 1.3
General Arts & Sciences 1.1 1.3 0.9
Business Admin 1.7 1.7 1.7
Early Childhood Education 1.1 1.2 1.0
Police Foundations 1.0 1.1 1.0
Social Service Worker 1.0 1.2 0.9
Child & Youth Worker 1.3 1.8 1.0
Mechanical Engineering 1.1
Law & Security 1.0
Average Credit Received (in years)
2-yr Diploma 3-yr Advanced Diploma
Source: Graduate Satisfaction Surveys for 2006/07 and 2007/08 for CAAT graduates
enrolled in a university degree program within six months of graduation
Separate analysis was conducted for students transferring to York and Ryerson universities
because these two institutions receive significantly more transfer students than any other
university in the province. Combined, they accounted for 38% of all student transfers in 2006/07.
6 The popularity of these two universities may be due, in part, to the credit they grant
which appears generous relative to other Ontario universities.
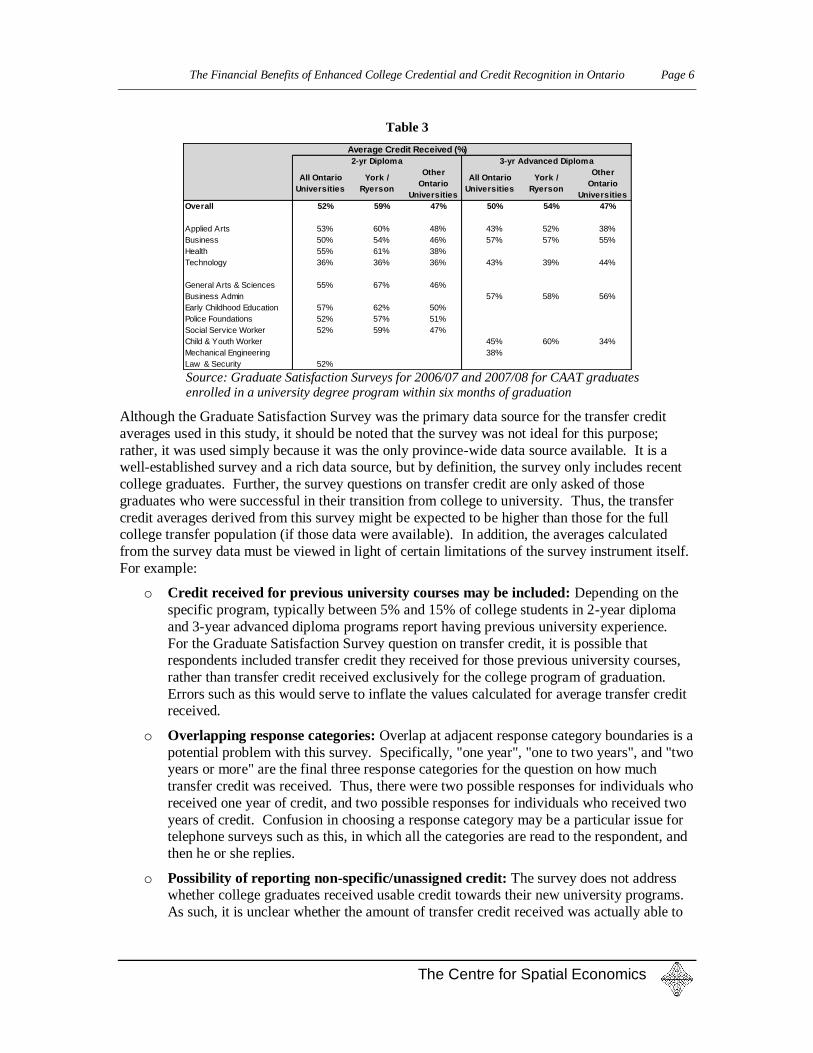
Table 3 converts the information in Table 2 into a percentage of credit granted relative to the time required to earn a two- or three-year diploma. It is interesting to note that 2-year diploma
graduates generally earn a higher return on their education – in terms of average credit received –
than those with a 3-year diploma. This finding likely reflects the higher proportion of core courses completed in a 2-year diploma that correspond to the university curriculum.
5 The information combines data for the two years of the Graduate Satisfaction Survey. The results
obtained from each of the survey years are relatively similar so the combined (average) analysis is
preferred to picking a single year of data.
6 Derived by the author from the number of surveyed graduates attending university data in Appendices 3a
and 3b of Colleges Ontario, Student Mobility Between Ontario’s Colleges and Universities.
The Financial Benefits of Enhanced College Credential and Credit Recognition in Ontario Page 6
The Centre for Spatial Economics
Table 3
All Ontario
Universities
York /
Ryerson
Other
Ontario
Universities
All Ontario
Universities
York /
Ryerson
Other
Ontario
Universities
Overall 52% 59% 47% 50% 54% 47%
Applied Arts 53% 60% 48% 43% 52% 38%
Business 50% 54% 46% 57% 57% 55%
Health 55% 61% 38%
Technology 36% 36% 36% 43% 39% 44%
General Arts & Sciences 55% 67% 46%
Business Admin 57% 58% 56%
Early Childhood Education 57% 62% 50%
Police Foundations 52% 57% 51%
Social Service Worker 52% 59% 47%
Child & Youth Worker 45% 60% 34%
Mechanical Engineering 38%
Law & Security 52%
Average Credit Received (%)
2-yr Diploma 3-yr Advanced Diploma
Source: Graduate Satisfaction Surveys for 2006/07 and 2007/08 for CAAT graduates enrolled in a university degree program within six months of graduation
Although the Graduate Satisfaction Survey was the primary data source for the transfer credit
averages used in this study, it should be noted that the survey was not ideal for this purpose;
rather, it was used simply because it was the only province-wide data source available. It is a well-established survey and a rich data source, but by definition, the survey only includes recent
college graduates. Further, the survey questions on transfer credit are only asked of those
graduates who were successful in their transition from college to university. Thus, the transfer
credit averages derived from this survey might be expected to be higher than those for the full college transfer population (if those data were available). In addition, the averages calculated
from the survey data must be viewed in light of certain limitations of the survey instrument itself.
For example:
o Credit received for previous university courses may be included: Depending on the
specific program, typically between 5% and 15% of college students in 2-year diploma
and 3-year advanced diploma programs report having previous university experience.
For the Graduate Satisfaction Survey question on transfer credit, it is possible that respondents included transfer credit they received for those previous university courses,
rather than transfer credit received exclusively for the college program of graduation.
Errors such as this would serve to inflate the values calculated for average transfer credit received.
o Overlapping response categories: Overlap at adjacent response category boundaries is a
potential problem with this survey. Specifically, "one year", "one to two years", and "two years or more" are the final three response categories for the question on how much
transfer credit was received. Thus, there were two possible responses for individuals who
received one year of credit, and two possible responses for individuals who received two
years of credit. Confusion in choosing a response category may be a particular issue for telephone surveys such as this, in which all the categories are read to the respondent, and
then he or she replies.
o Possibility of reporting non-specific/unassigned credit: The survey does not address whether college graduates received usable credit towards their new university programs.
As such, it is unclear whether the amount of transfer credit received was actually able to
The Financial Benefits of Enhanced College Credential and Credit Recognition in Ontario Page 7
The Centre for Spatial Economics
be applied to their new programs. This is a critical point, as the costs associated with not
receiving transfer credit are the same as those for receiving credit that could not be applied towards the requirements of the university degree. This issue of receiving non-
specific or unassigned transfer credit has also been identified as a potential problem in
other jurisdictions (e.g. Alberta; British Columbia).
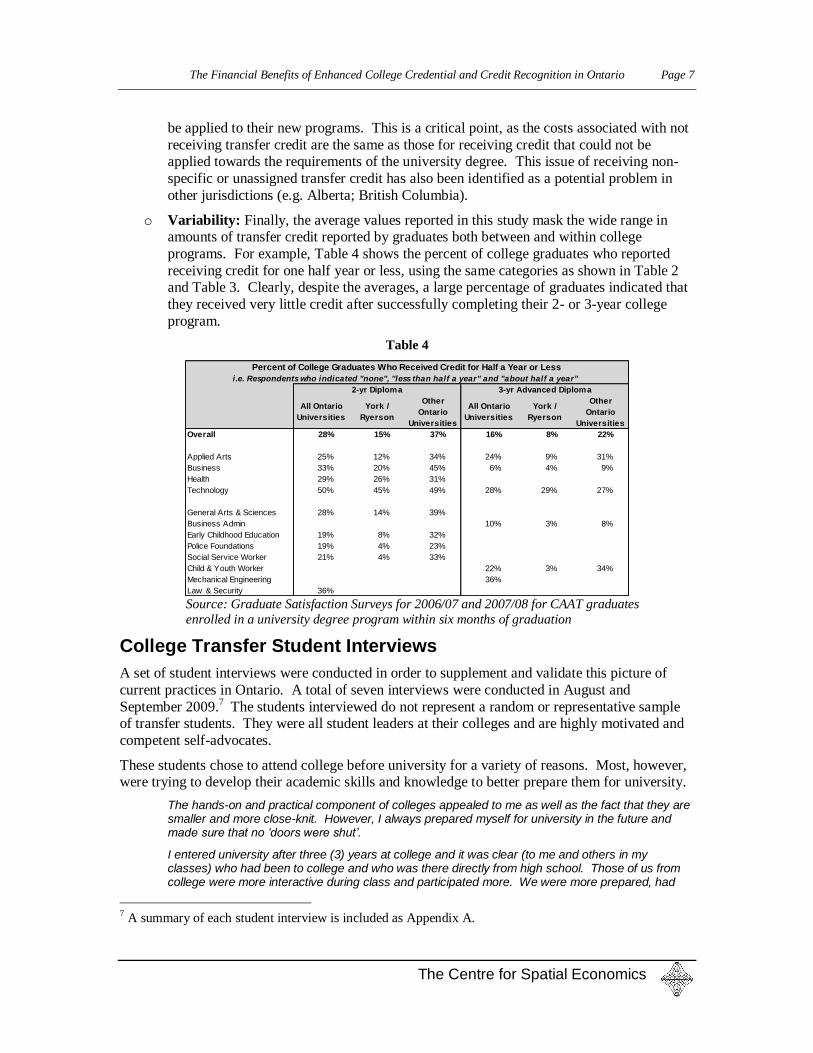
o Variability: Finally, the average values reported in this study mask the wide range in amounts of transfer credit reported by graduates both between and within college
programs. For example, Table 4 shows the percent of college graduates who reported
receiving credit for one half year or less, using the same categories as shown in Table 2 and Table 3. Clearly, despite the averages, a large percentage of graduates indicated that
they received very little credit after successfully completing their 2- or 3-year college
program.
Table 4
All Ontario
Universities
York /
Ryerson
Other
Ontario
Universities
All Ontario
Universities
York /
Ryerson
Other
Ontario
Universities
Overall 28% 15% 37% 16% 8% 22%
Applied Arts 25% 12% 34% 24% 9% 31%
Business 33% 20% 45% 6% 4% 9%
Health 29% 26% 31%
Technology 50% 45% 49% 28% 29% 27%
General Arts & Sciences 28% 14% 39%
Business Admin 10% 3% 8%
Early Childhood Education 19% 8% 32%
Police Foundations 19% 4% 23%
Social Service Worker 21% 4% 33%
Child & Youth Worker 22% 3% 34%
Mechanical Engineering 36%
Law & Security 36%
Percent of College Graduates Who Received Credit for Half a Year or Less
i .e. Respondents who indicated "none", "less than half a year" and "about half a year"
2-yr Diploma 3-yr Advanced Diploma
Source: Graduate Satisfaction Surveys for 2006/07 and 2007/08 for CAAT graduates
enrolled in a university degree program within six months of graduation
College Transfer Student Interviews
A set of student interviews were conducted in order to supplement and validate this picture of
current practices in Ontario. A total of seven interviews were conducted in August and
September 2009.7 The students interviewed do not represent a random or representative sample
of transfer students. They were all student leaders at their colleges and are highly motivated and
competent self-advocates.
These students chose to attend college before university for a variety of reasons. Most, however, were trying to develop their academic skills and knowledge to better prepare them for university.
The hands-on and practical component of colleges appealed to me as well as the fact that they are smaller and more close-knit. However, I always prepared myself for university in the future and made sure that no „doors were shut‟.
I entered university after three (3) years at college and it was clear (to me and others in my classes) who had been to college and who was there directly from high school. Those of us from college were more interactive during class and participated more. We were more prepared, had
7 A summary of each student interview is included as Appendix A.
The Financial Benefits of Enhanced College Credential and Credit Recognition in Ontario Page 8
The Centre for Spatial Economics
good study habits, understood the importance of speaking with the professors, and of “applied thinking”.
The police foundation courses I took at college made the transition so much easier because I knew what to expect, particularly in the areas of law.
College taught me: how to be “hands on”; how to write a press release; how to work computers; how to speak to people. University taught me how to “think” but not how to “do”. I very much benefited from going to college first and was able to get a lot more out of my university year than if I had gone there directly from high school.
The teachers at college were excellent and they prepared me well. The university courses picked up where the college course left off.
These students' insight and experience with Ontario‟s transfer system provides evidence that it is
not simply the amount of credit granted by Ontario universities that is the problem but rather the
process that robs the system of any sense of fairness or equity:
A particular issue is that you do not know what credits you will receive until after you accept the university offer, at which time all other offers are null and void.
I applied to three Ontario universities: Lakehead gave zero transfer credits; University of Toronto gave zero transfer credits; and Western gave zero transfer credits until I wrote a letter and only then gave a one-year credit for general degree. And it was only when the letter was copied to the University President, College President, Minister of Education, and MPP that consideration was given. Most students would ... probably give up out of frustration.
An analysis of the credit granted by Ontario universities to these students yields results that
reflect the unrepresentative nature of the student interview sample. These students received credit
for 68% of their college studies. It is perhaps not a surprise that these students significantly bettered the 50% average rate in Table 3.
8
In summary, the Graduate Satisfaction Survey indicates that the current transfer framework in
Ontario provides college graduates with credit for about one half of the time they spent obtaining their diploma. This estimate overstates current practice but there is little information available to
determine the extent of the bias. In any event, the uncertainty and variability surrounding the
amount of credit that will be provided and the lack of provincial standards mark the system as
profoundly unfair9.
8 The reader is cautioned that the student interviews do not provide a representative sample but, it is
interesting to note that the students transferring to York or Ryerson universities received credit for 57% –
close to the Table 3 rate – while those attending other universities received credit for 85% of their college
studies! This highlights the extreme variability in credit granted to college graduates by universities across the province.
9 The system could be fair if students had the opportunity to “shop” the system to find the university that
offered them the most credit. Of course, this institution may not be in a community that the student is able
to move to. Students are, however, largely prevented from taking this course of action if they only find out
what credit they are entitled to once they begin attending the institution.
The Financial Benefits of Enhanced College Credential and Credit Recognition in Ontario Page 9
The Centre for Spatial Economics
Review of Credit Transfer Practices in Other Jurisdictions
A growing proportion of Ontario college graduates are going on to attend university: 8.7% in
2006/07 up from 5.0% in 2000/01. About 9% of those students left Ontario to pursue their
education in another province or outside the country.10
While there are many reasons that
contribute to a student‟s choice of university, a significant factor for many Ontario college graduates is the amount of credit they receive for their college education.
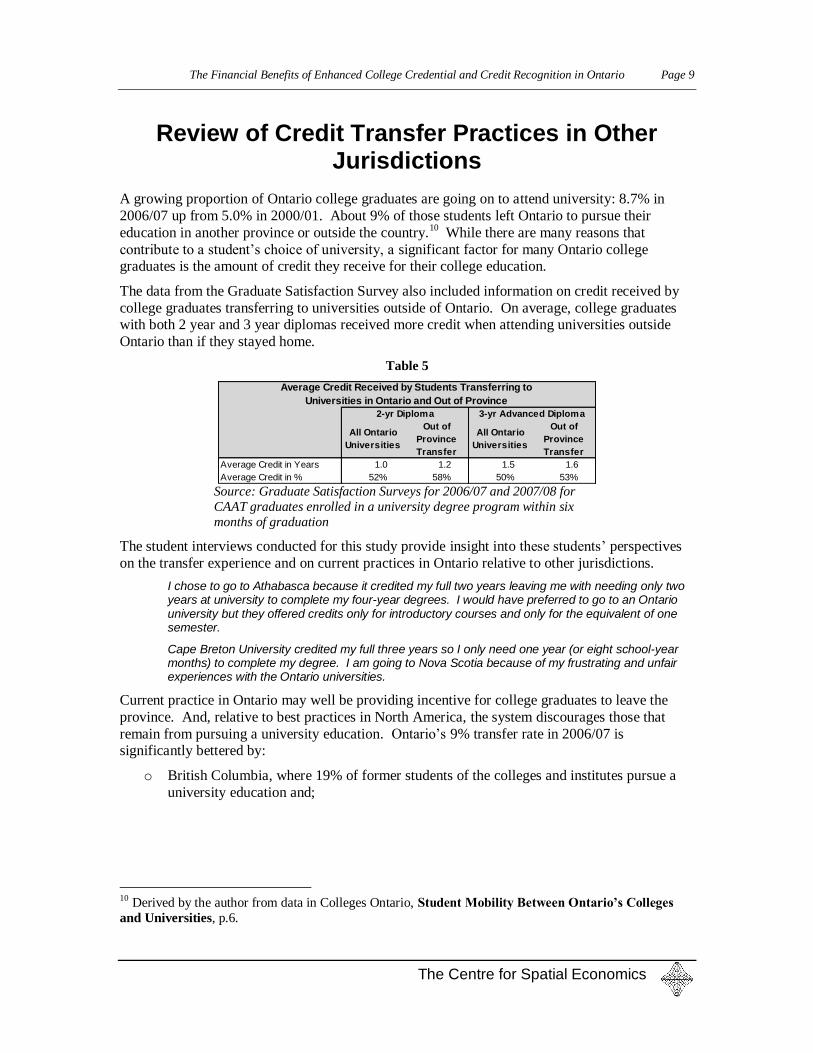
The data from the Graduate Satisfaction Survey also included information on credit received by
college graduates transferring to universities outside of Ontario. On average, college graduates with both 2 year and 3 year diplomas received more credit when attending universities outside
Ontario than if they stayed home.
Table 5
All Ontario
Universities
Out of
Province
Transfer
All Ontario
Universities
Out of
Province
Transfer
Average Credit in Years 1.0 1.2 1.5 1.6
Average Credit in % 52% 58% 50% 53%
3-yr Advanced Diploma2-yr Diploma
Average Credit Received by Students Transferring to
Universities in Ontario and Out of Province
Source: Graduate Satisfaction Surveys for 2006/07 and 2007/08 for
CAAT graduates enrolled in a university degree program within six
months of graduation
The student interviews conducted for this study provide insight into these students‟ perspectives
on the transfer experience and on current practices in Ontario relative to other jurisdictions.
I chose to go to Athabasca because it credited my full two years leaving me with needing only two years at university to complete my four-year degrees. I would have preferred to go to an Ontario university but they offered credits only for introductory courses and only for the equivalent of one semester.
Cape Breton University credited my full three years so I only need one year (or eight school-year months) to complete my degree. I am going to Nova Scotia because of my frustrating and unfair experiences with the Ontario universities.
Current practice in Ontario may well be providing incentive for college graduates to leave the
province. And, relative to best practices in North America, the system discourages those that
remain from pursuing a university education. Ontario‟s 9% transfer rate in 2006/07 is significantly bettered by:
o British Columbia, where 19% of former students of the colleges and institutes pursue a
university education and;
10 Derived by the author from data in Colleges Ontario, Student Mobility Between Ontario’s Colleges
and Universities, p.6.
The Financial Benefits of Enhanced College Credential and Credit Recognition in Ontario Page 10
The Centre for Spatial Economics
o California, where community college transfer students account for approximately two-
thirds of degree graduates from California State University and one-third of degree graduates from the University of California.
11
These jurisdictions have formal credential and credit recognition frameworks although the details
differ. Their frameworks recognize up to 100% of a student‟s college education. A study of
British Columbia‟s transfer system revealed, however, that such systems likely grant students less credit than this. The British Columbia study reviewed student transcripts and found that students
received credit for 85% of the courses on their transcripts. Almost all of the remaining 15% was,
however, accounted for by courses that had no university equivalent (i.e. vocational courses, ESL, etc.), courses that the student failed, or courses that the student repeated.
12 It seems likely that
many transfer systems would experience similar outcomes.
The purpose and design of Ontario's post-secondary education system differs in fundamental ways from that of the systems in these other jurisdictions. Both universities and colleges in
Ontario have substantially more academic autonomy than their counterparts in these other
jurisdictions. This autonomy provides Ontario‟s institutions with the flexibility required to
rapidly design and introduce new programs to meet the evolving needs of the provincial economy. As a result, each institution offers its own, unique, set of programs. This diversity of
programs can, however, make even university-to-university or college-to-college transfers
difficult while college-to-university transfers are harder yet.
In response, colleges have concluded agreements with universities, typically within the same
region, for programs that have common curricula in Arts, Business Administration or professional
undergraduate degrees such as Nursing or Criminology. These transfer or “laddering” agreements with universities have typically arisen through the initiative of the colleges. There are
now over 300 of these agreements and they can all be perused in a database that is supported by
the College-University Consortium Council.13
In other jurisdictions, more broadly based transfer frameworks are designed and administered by organizations independent of the colleges and universities. Changes in course content and
programs at both colleges and universities must, therefore, be carefully controlled in order to
preserve the integrity of the transfer framework.
The systems developed in these other jurisdictions have, in many cases, existed for decades and
are as tightly woven into their PSE mandate as is Ontario‟s history of independence. The
longevity of these systems, however, has made it difficult for them to consider evaluating the
benefits of their systems in a manner similar to that undertaken in this study because they have no hypothetical alternative system against which to compare their current practice. As a result, cost-
benefit studies have concentrated on the savings realized by the state in providing first and second
year university education to students at a “junior college” relative to a four-year university.
11 Colleges Ontario, Student Mobility Between Ontario Colleges and Universities, (available from www.collegesontario.org, 2009) pp. 10-12.
12 British Columbia Council on Admissions & Transfer, Accountability of the BC Transfer System,
(available from www.bccat.bc.ca, 2005) p. 8.
13 The College-University Consortium Council (CUCC), Ontario College to University Transfer
Agreements (available from www.cucc-ontario.ca, 2009).
The Financial Benefits of Enhanced College Credential and Credit Recognition in Ontario Page 11
The Centre for Spatial Economics
CAATs in Ontario do not have a mandate to serve as “junior colleges”. The historical role of the
colleges to provide technical and vocational education remains at the core of their mission. However, education pathways are growing in complexity. Students – and employers – are
looking for a broader set of knowledge than can be offered from a single program and, in
response, growing numbers of students want to pursue multiple credentials.
Ontario‟s transfer rate is low relative to other Canadian provinces and U.S. states and is inhibiting the development of the knowledge-based workers called for by the Martin Prosperity Institute.
14
The search for an enhanced credential and credit recognition system that is consistent with
Ontario‟s post-secondary systems historical mandate and design is, however, challenging.
The College-University Consortium Council (CUCC) has catalogued the PSE transfer systems in
at least sixty three jurisdictions around the world.15
A review of this catalogue leads one to the
conclusion that a system cannot be simply imported and used in Ontario. This conclusion is shared by Constantineau in which he concludes that “it would appear to be wiser and more
economical to support the best practices of the universities [in Ontario] that have been responding
to student requests for prior leaning assessment and recognition”.16
In summary, Ontario‟s credential and credit recognition system needs reform. The current system discourages students from achieving their potential, encourages them to leave the province, and
perpetuates a system of unequal access and opportunity.
The purpose and design of Ontario‟s post-secondary system, however, differs significantly from that in other jurisdictions. A transfer system cannot simply be imported from elsewhere. A
“Made-in-Ontario” solution is required. A solution that (i) addresses the fundamental equity and
fairness concerns of students, (ii) simplifies administration for post-secondary institutions, and (iii) strengthens our economy by providing the educational opportunities for the workforce this
province will need to compete and prosper in the global economy.
14 Martin Prosperity Institute, Ontario in the Creative Age, (available from www.martinprosperity.org, 2009) p. 2.
15 College-University Consortium Council, Jurisdictional Transfer Frameworks (unpublished
manuscript, 2009).
16 Philippe Constantineau, The Ontario Transfer Credit System – A Situation Report, (Council of
Ontario Universities Academic Colleagues Working Paper, available at www.cou.on.ca, 2009) p.6.
The Financial Benefits of Enhanced College Credential and Credit Recognition in Ontario Page 12
The Centre for Spatial Economics
Projection of College to University Transfers
Any estimate of the overall potential benefit to the provincial economy of enhanced credential
and credit recognition is, naturally, dependent on the number of college graduates that can be
expected to transfer to an Ontario university over the next decade.
This study uses a range of projections generated from three independent sources to estimate the
number of college graduates who enrol in an Ontario university undergraduate degree program.
The use of this range of projections allows us to gauge the minimum and maximum potential benefit associated with enhanced credential and credit recognition. The three sources are:
o Ontario Colleges Application Service (OCAS) – high and low college enrolment
projections
o Ministry of Training, Colleges and Universities (MTCU) – high and low college and university enrolment projections
o Centre for Spatial Economics (C4SE)
The C4SE constructed a model to estimate college enrolment, graduates, and transfers to Ontario universities over the next decade. The design and results of this model are discussed in the
following section. This will be followed by a comparison with the OCAS and MTCU projections
and, finally, by a discussion on the likely impact on college graduate and student transfers of an
enhanced credential and credit recognition system.
C4SE Ontario CAAT Enrolment Projection
The number of CAAT graduates and students transferring to a university in Ontario has risen
significantly in the last few years. The C4SE Ontario CAAT Student Projection Model has been
designed to predict the number of students enrolled in Ontario colleges, the number of new entrants, the number of graduates, and the number that will apply to and attend a university in
Ontario over the next ten years.17
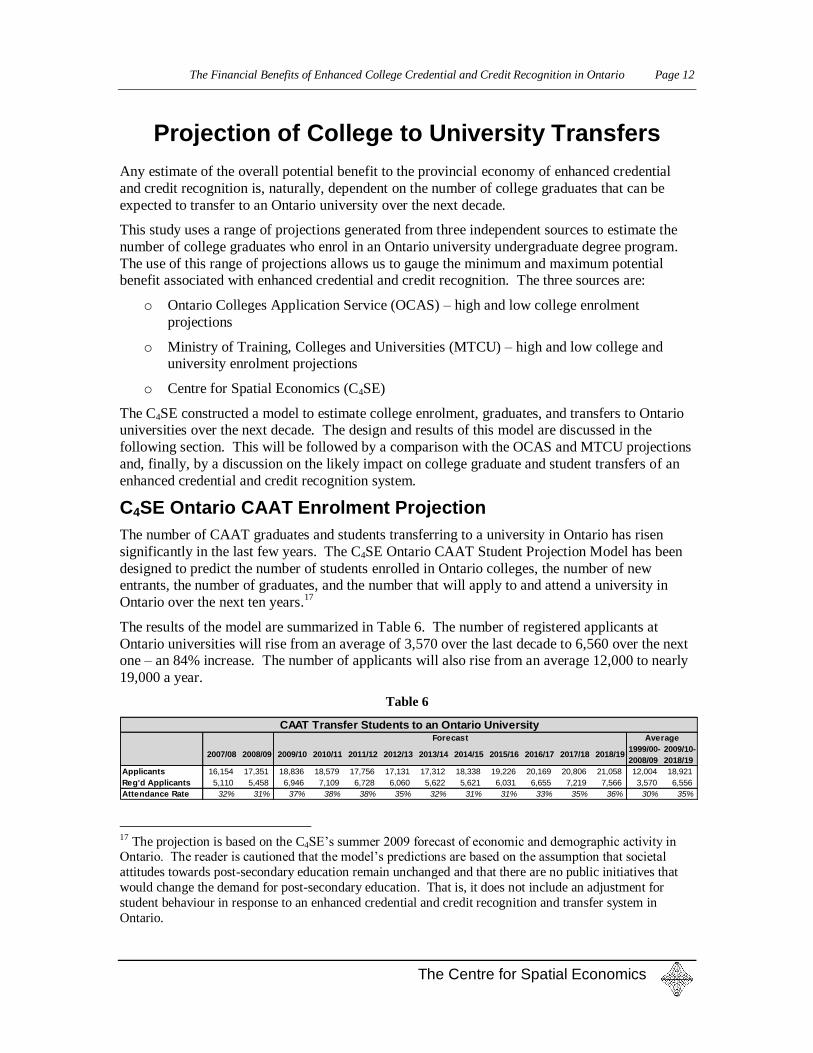
The results of the model are summarized in Table 6. The number of registered applicants at
Ontario universities will rise from an average of 3,570 over the last decade to 6,560 over the next one – an 84% increase. The number of applicants will also rise from an average 12,000 to nearly
CAAT Transfer Students to an Ontario UniversityForecast
17 The projection is based on the C4SE‟s summer 2009 forecast of economic and demographic activity in Ontario. The reader is cautioned that the model‟s predictions are based on the assumption that societal
attitudes towards post-secondary education remain unchanged and that there are no public initiatives that
would change the demand for post-secondary education. That is, it does not include an adjustment for
student behaviour in response to an enhanced credential and credit recognition and transfer system in
Ontario.
The Financial Benefits of Enhanced College Credential and Credit Recognition in Ontario Page 13
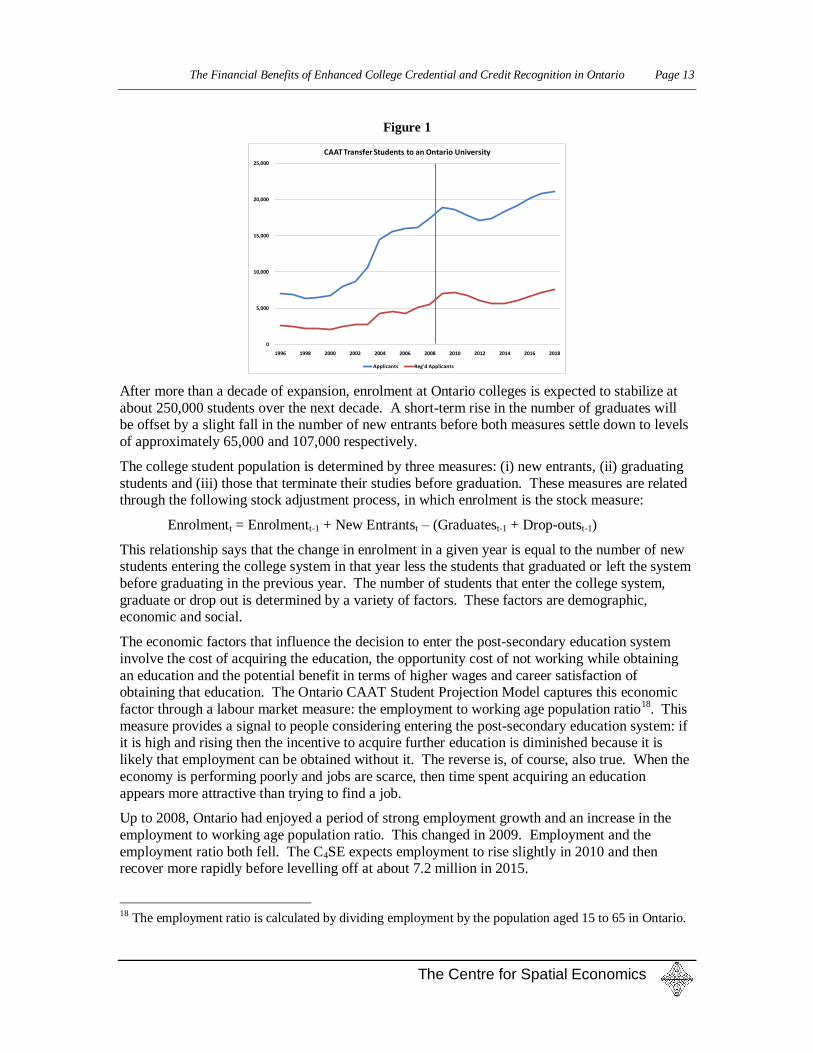
After more than a decade of expansion, enrolment at Ontario colleges is expected to stabilize at
about 250,000 students over the next decade. A short-term rise in the number of graduates will be offset by a slight fall in the number of new entrants before both measures settle down to levels
of approximately 65,000 and 107,000 respectively.
The college student population is determined by three measures: (i) new entrants, (ii) graduating
students and (iii) those that terminate their studies before graduation. These measures are related through the following stock adjustment process, in which enrolment is the stock measure:
Enrolmentt = Enrolmentt-1 + New Entrantst – (Graduatest-1 + Drop-outst-1)
This relationship says that the change in enrolment in a given year is equal to the number of new students entering the college system in that year less the students that graduated or left the system
before graduating in the previous year. The number of students that enter the college system,
graduate or drop out is determined by a variety of factors. These factors are demographic, economic and social.
The economic factors that influence the decision to enter the post-secondary education system
involve the cost of acquiring the education, the opportunity cost of not working while obtaining
an education and the potential benefit in terms of higher wages and career satisfaction of obtaining that education. The Ontario CAAT Student Projection Model captures this economic
factor through a labour market measure: the employment to working age population ratio18
. This
measure provides a signal to people considering entering the post-secondary education system: if it is high and rising then the incentive to acquire further education is diminished because it is
likely that employment can be obtained without it. The reverse is, of course, also true. When the
economy is performing poorly and jobs are scarce, then time spent acquiring an education
appears more attractive than trying to find a job.
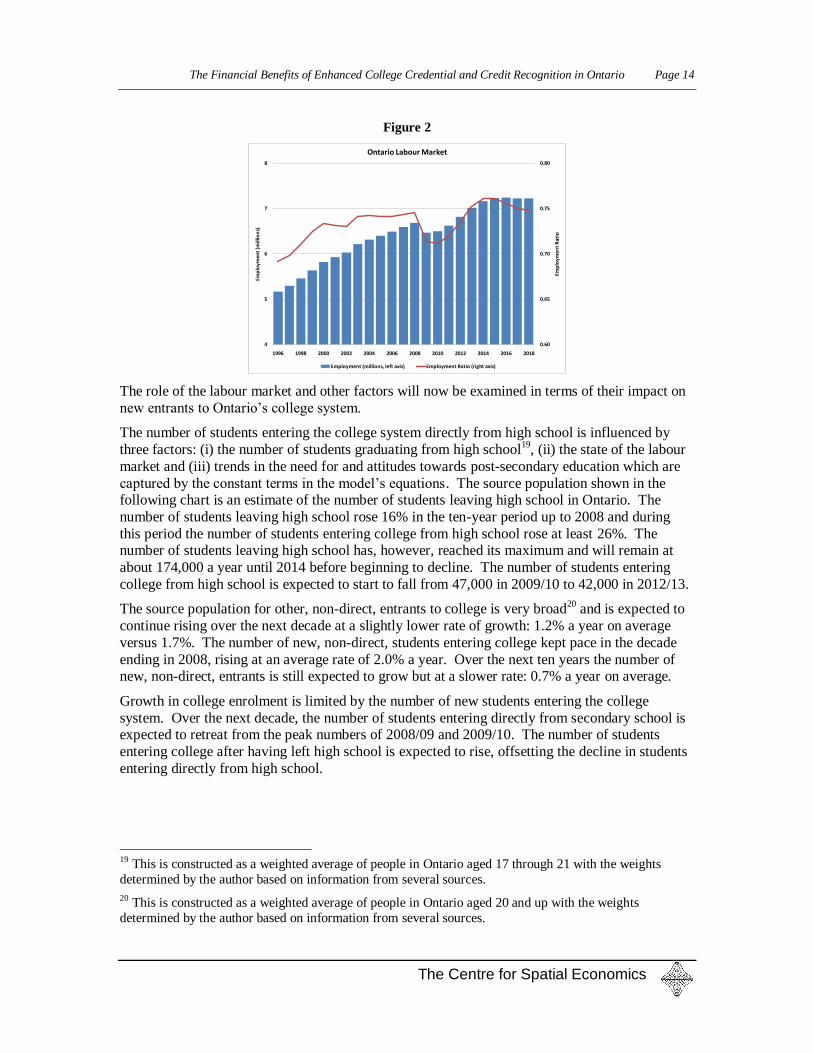
Up to 2008, Ontario had enjoyed a period of strong employment growth and an increase in the
employment to working age population ratio. This changed in 2009. Employment and the
employment ratio both fell. The C4SE expects employment to rise slightly in 2010 and then recover more rapidly before levelling off at about 7.2 million in 2015.
18 The employment ratio is calculated by dividing employment by the population aged 15 to 65 in Ontario.
The Financial Benefits of Enhanced College Credential and Credit Recognition in Ontario Page 14
Employment (millions, left axis) Employment Ratio (right axis)
The role of the labour market and other factors will now be examined in terms of their impact on
new entrants to Ontario‟s college system.
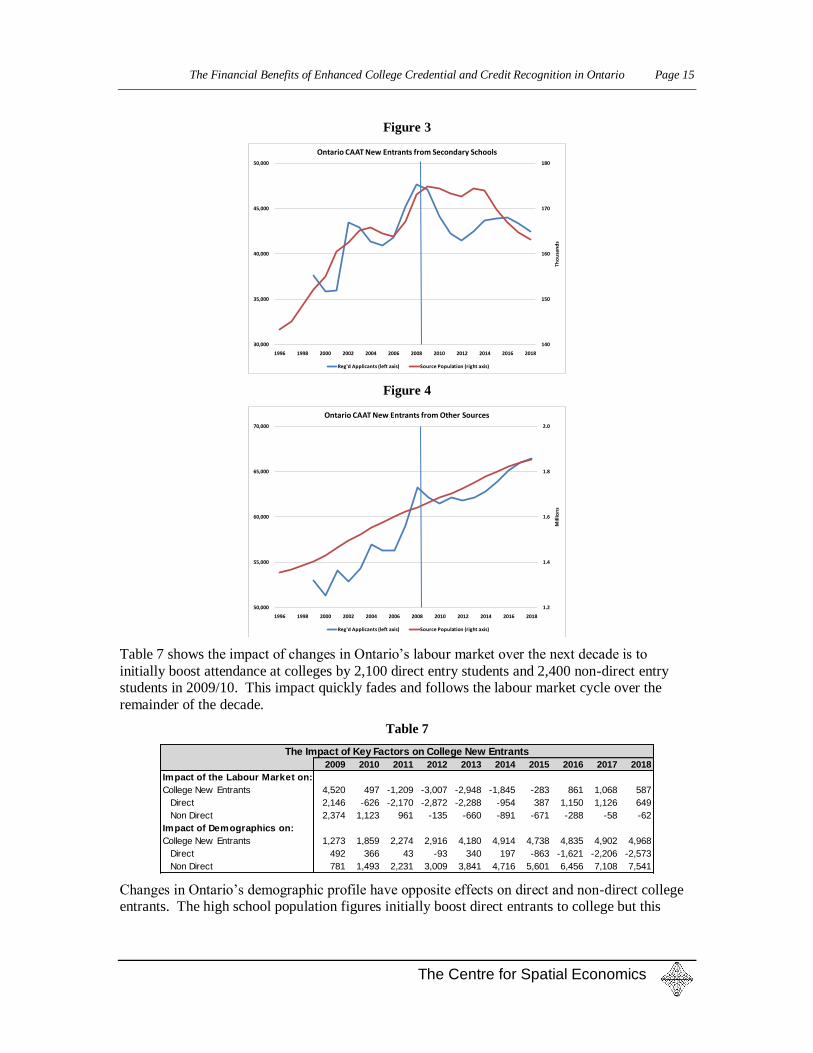
The number of students entering the college system directly from high school is influenced by
three factors: (i) the number of students graduating from high school19
, (ii) the state of the labour
market and (iii) trends in the need for and attitudes towards post-secondary education which are
captured by the constant terms in the model‟s equations. The source population shown in the following chart is an estimate of the number of students leaving high school in Ontario. The
number of students leaving high school rose 16% in the ten-year period up to 2008 and during
this period the number of students entering college from high school rose at least 26%. The number of students leaving high school has, however, reached its maximum and will remain at
about 174,000 a year until 2014 before beginning to decline. The number of students entering
college from high school is expected to start to fall from 47,000 in 2009/10 to 42,000 in 2012/13.
The source population for other, non-direct, entrants to college is very broad20
and is expected to
continue rising over the next decade at a slightly lower rate of growth: 1.2% a year on average
versus 1.7%. The number of new, non-direct, students entering college kept pace in the decade
ending in 2008, rising at an average rate of 2.0% a year. Over the next ten years the number of new, non-direct, entrants is still expected to grow but at a slower rate: 0.7% a year on average.
Growth in college enrolment is limited by the number of new students entering the college
system. Over the next decade, the number of students entering directly from secondary school is expected to retreat from the peak numbers of 2008/09 and 2009/10. The number of students
entering college after having left high school is expected to rise, offsetting the decline in students
entering directly from high school.
19 This is constructed as a weighted average of people in Ontario aged 17 through 21 with the weights
determined by the author based on information from several sources.
20 This is constructed as a weighted average of people in Ontario aged 20 and up with the weights
determined by the author based on information from several sources.
The Financial Benefits of Enhanced College Credential and Credit Recognition in Ontario Page 15
Reg'd Applicants (left axis) Source Population (right axis)
Table 7 shows the impact of changes in Ontario‟s labour market over the next decade is to
initially boost attendance at colleges by 2,100 direct entry students and 2,400 non-direct entry students in 2009/10. This impact quickly fades and follows the labour market cycle over the
remainder of the decade.
Table 7
2009 2010 2011 2012 2013 2014 2015 2016 2017 2018
Impact of the Labour Market on:
College New Entrants 4,520 497 -1,209 -3,007 -2,948 -1,845 -283 861 1,068 587
Non Direct 781 1,493 2,231 3,009 3,841 4,716 5,601 6,456 7,108 7,541
The Impact of Key Factors on College New Entrants
Changes in Ontario‟s demographic profile have opposite effects on direct and non-direct college entrants. The high school population figures initially boost direct entrants to college but this
The Financial Benefits of Enhanced College Credential and Credit Recognition in Ontario Page 16
The Centre for Spatial Economics
effect fades and turns negative in 2012/13. Growth in the broader population provides an ever
increasing boost to non-direct entrants over the coming decade.
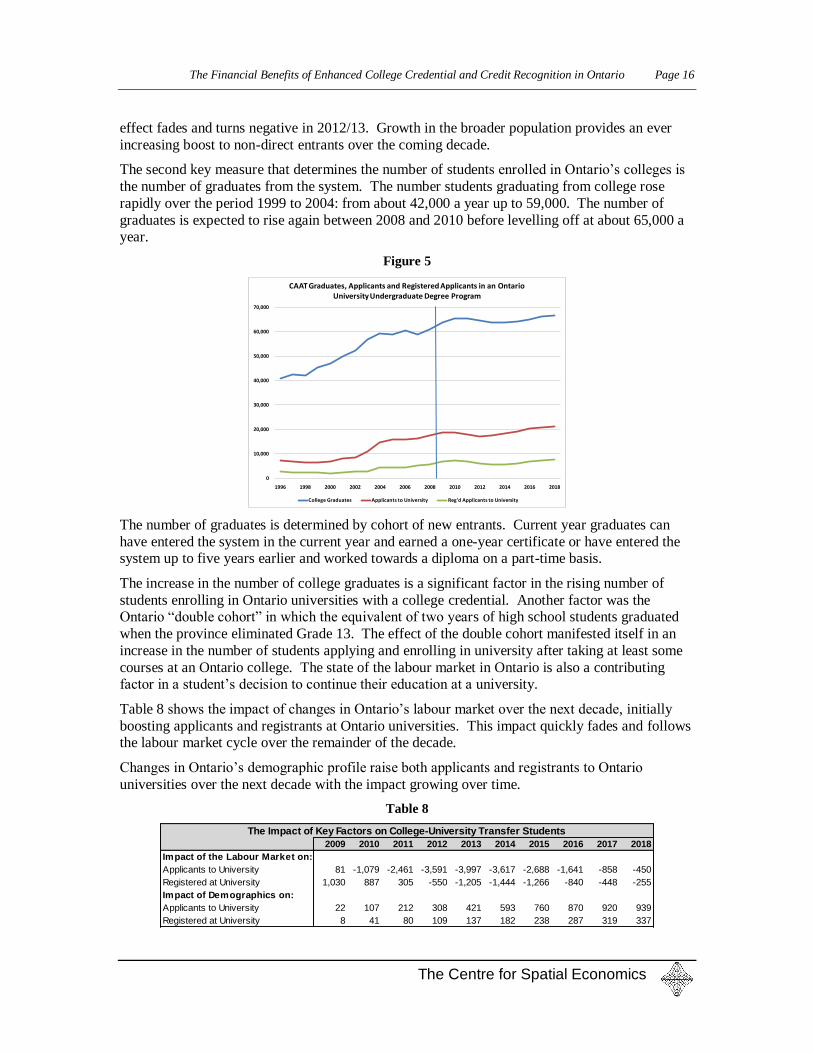
The second key measure that determines the number of students enrolled in Ontario‟s colleges is
the number of graduates from the system. The number students graduating from college rose
rapidly over the period 1999 to 2004: from about 42,000 a year up to 59,000. The number of
graduates is expected to rise again between 2008 and 2010 before levelling off at about 65,000 a year.
CAAT Graduates, Applicants and Registered Applicants in an Ontario University Undergraduate Degree Program
College Graduates Applicants to University Reg'd Applicants to University
The number of graduates is determined by cohort of new entrants. Current year graduates can
have entered the system in the current year and earned a one-year certificate or have entered the system up to five years earlier and worked towards a diploma on a part-time basis.
The increase in the number of college graduates is a significant factor in the rising number of
students enrolling in Ontario universities with a college credential. Another factor was the Ontario “double cohort” in which the equivalent of two years of high school students graduated
when the province eliminated Grade 13. The effect of the double cohort manifested itself in an
increase in the number of students applying and enrolling in university after taking at least some
courses at an Ontario college. The state of the labour market in Ontario is also a contributing factor in a student‟s decision to continue their education at a university.
Table 8 shows the impact of changes in Ontario‟s labour market over the next decade, initially
boosting applicants and registrants at Ontario universities. This impact quickly fades and follows the labour market cycle over the remainder of the decade.
Changes in Ontario‟s demographic profile raise both applicants and registrants to Ontario
universities over the next decade with the impact growing over time.
Table 8
2009 2010 2011 2012 2013 2014 2015 2016 2017 2018
Impact of the Labour Market on:
Applicants to University 81 -1,079 -2,461 -3,591 -3,997 -3,617 -2,688 -1,641 -858 -450
Registered at University 1,030 887 305 -550 -1,205 -1,444 -1,266 -840 -448 -255
Impact of Demographics on:
Applicants to University 22 107 212 308 421 593 760 870 920 939
Registered at University 8 41 80 109 137 182 238 287 319 337
The Impact of Key Factors on College-University Transfer Students
The Financial Benefits of Enhanced College Credential and Credit Recognition in Ontario Page 17
The Centre for Spatial Economics
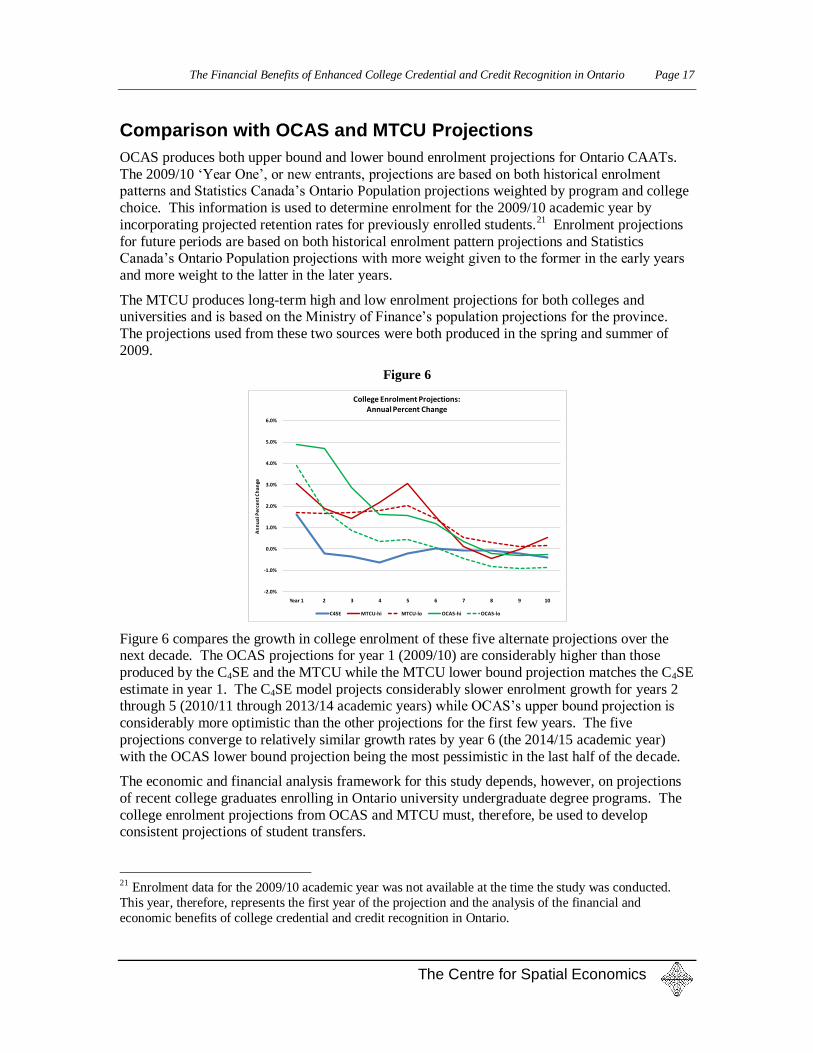
Comparison with OCAS and MTCU Projections
OCAS produces both upper bound and lower bound enrolment projections for Ontario CAATs.
The 2009/10 „Year One‟, or new entrants, projections are based on both historical enrolment patterns and Statistics Canada‟s Ontario Population projections weighted by program and college
choice. This information is used to determine enrolment for the 2009/10 academic year by
incorporating projected retention rates for previously enrolled students.21
Enrolment projections
for future periods are based on both historical enrolment pattern projections and Statistics Canada‟s Ontario Population projections with more weight given to the former in the early years
and more weight to the latter in the later years.
The MTCU produces long-term high and low enrolment projections for both colleges and universities and is based on the Ministry of Finance‟s population projections for the province.
The projections used from these two sources were both produced in the spring and summer of
2009.
Figure 6
-2.0%
-1.0%
0.0%
1.0%
2.0%
3.0%
4.0%
5.0%
6.0%
Year 1 2 3 4 5 6 7 8 9 10
An
nu
al P
erc
en
t C
ha
nge
College Enrolment Projections:Annual Percent Change
C4SE MTCU-hi MTCU-lo OCAS-hi OCAS-lo
Figure 6 compares the growth in college enrolment of these five alternate projections over the next decade. The OCAS projections for year 1 (2009/10) are considerably higher than those
produced by the C4SE and the MTCU while the MTCU lower bound projection matches the C4SE
estimate in year 1. The C4SE model projects considerably slower enrolment growth for years 2 through 5 (2010/11 through 2013/14 academic years) while OCAS‟s upper bound projection is
considerably more optimistic than the other projections for the first few years. The five
projections converge to relatively similar growth rates by year 6 (the 2014/15 academic year)
with the OCAS lower bound projection being the most pessimistic in the last half of the decade.
The economic and financial analysis framework for this study depends, however, on projections
of recent college graduates enrolling in Ontario university undergraduate degree programs. The
college enrolment projections from OCAS and MTCU must, therefore, be used to develop consistent projections of student transfers.
21 Enrolment data for the 2009/10 academic year was not available at the time the study was conducted.
This year, therefore, represents the first year of the projection and the analysis of the financial and
economic benefits of college credential and credit recognition in Ontario.
The Financial Benefits of Enhanced College Credential and Credit Recognition in Ontario Page 18
The Centre for Spatial Economics
This is accomplished using the C4SE Ontario CAAT Student Projection Model. As discussed,
that model estimates transfers from Ontario colleges as a function of college graduates. The C4SE model was inverted so that both the OCAS and MTCU enrolment projections can be used
to drive projections of college graduates and college transfer students over the next decade.
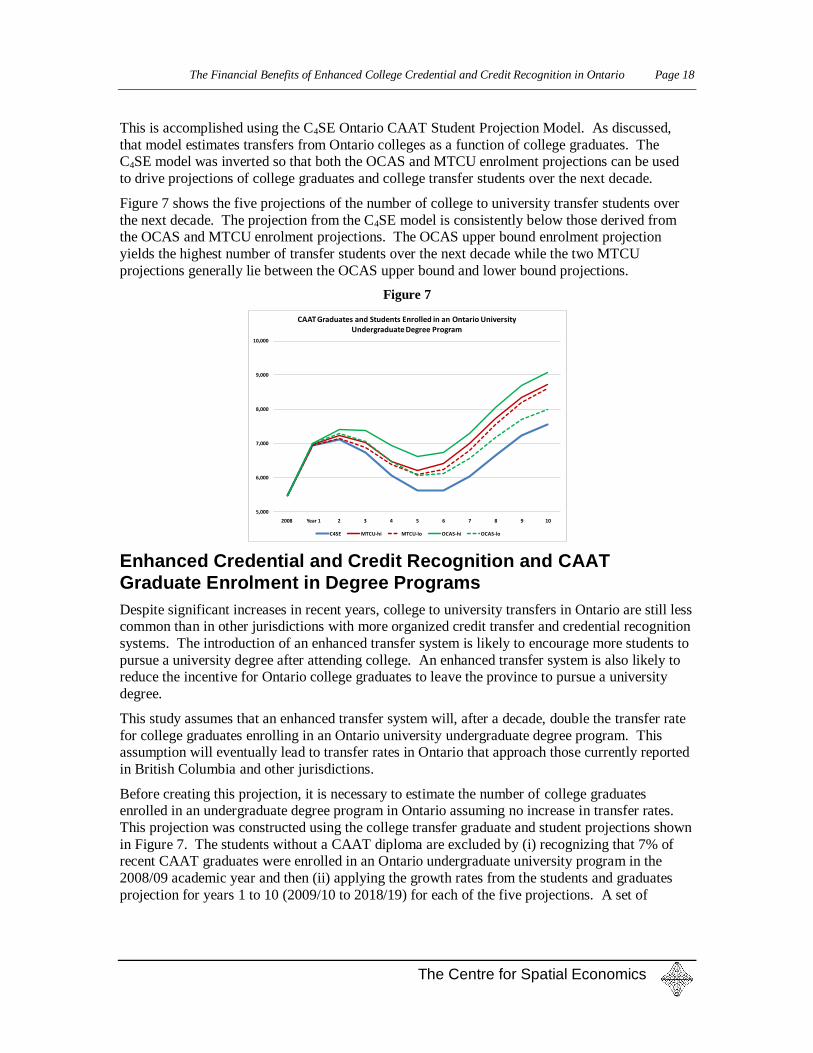
Figure 7 shows the five projections of the number of college to university transfer students over
the next decade. The projection from the C4SE model is consistently below those derived from the OCAS and MTCU enrolment projections. The OCAS upper bound enrolment projection
yields the highest number of transfer students over the next decade while the two MTCU
projections generally lie between the OCAS upper bound and lower bound projections.
Figure 7
5,000
6,000
7,000
8,000
9,000
10,000
2008 Year 1 2 3 4 5 6 7 8 9 10
CAAT Graduates and Students Enrolled in an Ontario University Undergraduate Degree Program
C4SE MTCU-hi MTCU-lo OCAS-hi OCAS-lo
Enhanced Credential and Credit Recognition and CAAT
Graduate Enrolment in Degree Programs
Despite significant increases in recent years, college to university transfers in Ontario are still less common than in other jurisdictions with more organized credit transfer and credential recognition
systems. The introduction of an enhanced transfer system is likely to encourage more students to
pursue a university degree after attending college. An enhanced transfer system is also likely to reduce the incentive for Ontario college graduates to leave the province to pursue a university
degree.
This study assumes that an enhanced transfer system will, after a decade, double the transfer rate
for college graduates enrolling in an Ontario university undergraduate degree program. This assumption will eventually lead to transfer rates in Ontario that approach those currently reported
in British Columbia and other jurisdictions.
Before creating this projection, it is necessary to estimate the number of college graduates enrolled in an undergraduate degree program in Ontario assuming no increase in transfer rates.
This projection was constructed using the college transfer graduate and student projections shown
in Figure 7. The students without a CAAT diploma are excluded by (i) recognizing that 7% of recent CAAT graduates were enrolled in an Ontario undergraduate university program in the
2008/09 academic year and then (ii) applying the growth rates from the students and graduates
projection for years 1 to 10 (2009/10 to 2018/19) for each of the five projections. A set of
The Financial Benefits of Enhanced College Credential and Credit Recognition in Ontario Page 19
The Centre for Spatial Economics
minimum, maximum and average projections were then obtained from these five projections to
help determine the sensitivity of the results to changes in enrolment.
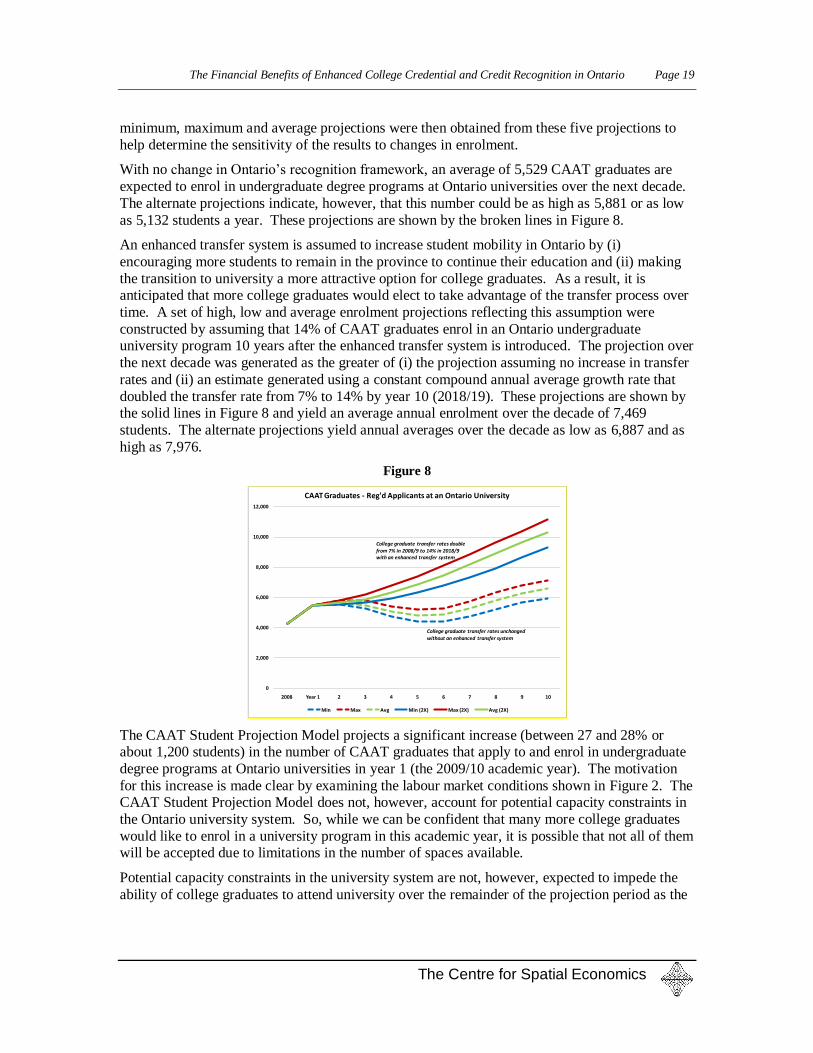
With no change in Ontario‟s recognition framework, an average of 5,529 CAAT graduates are
expected to enrol in undergraduate degree programs at Ontario universities over the next decade.
The alternate projections indicate, however, that this number could be as high as 5,881 or as low
as 5,132 students a year. These projections are shown by the broken lines in Figure 8.
An enhanced transfer system is assumed to increase student mobility in Ontario by (i)
encouraging more students to remain in the province to continue their education and (ii) making
the transition to university a more attractive option for college graduates. As a result, it is anticipated that more college graduates would elect to take advantage of the transfer process over
time. A set of high, low and average enrolment projections reflecting this assumption were
constructed by assuming that 14% of CAAT graduates enrol in an Ontario undergraduate university program 10 years after the enhanced transfer system is introduced. The projection over
the next decade was generated as the greater of (i) the projection assuming no increase in transfer
rates and (ii) an estimate generated using a constant compound annual average growth rate that
doubled the transfer rate from 7% to 14% by year 10 (2018/19). These projections are shown by the solid lines in Figure 8 and yield an average annual enrolment over the decade of 7,469
students. The alternate projections yield annual averages over the decade as low as 6,887 and as
high as 7,976.
Figure 8
0
2,000
4,000
6,000
8,000
10,000
12,000
2008 Year 1 2 3 4 5 6 7 8 9 10
CAAT Graduates - Reg'd Applicants at an Ontario University
Min Max Avg Min (2X) Max (2X) Avg (2X)
College graduate transfer rates double
from 7% in 2008/9 to 14% in 2018/9with an enhanced transfer system
College graduate transfer rates unchangedwithout an enhanced transfer system
The CAAT Student Projection Model projects a significant increase (between 27 and 28% or about 1,200 students) in the number of CAAT graduates that apply to and enrol in undergraduate
degree programs at Ontario universities in year 1 (the 2009/10 academic year). The motivation
for this increase is made clear by examining the labour market conditions shown in Figure 2. The CAAT Student Projection Model does not, however, account for potential capacity constraints in
the Ontario university system. So, while we can be confident that many more college graduates
would like to enrol in a university program in this academic year, it is possible that not all of them will be accepted due to limitations in the number of spaces available.
Potential capacity constraints in the university system are not, however, expected to impede the
ability of college graduates to attend university over the remainder of the projection period as the
The Financial Benefits of Enhanced College Credential and Credit Recognition in Ontario Page 20
The Centre for Spatial Economics
reduction in the number of high school graduates expected over the next decade (see Figure 3)
will also affect university enrolment.
The Financial Benefits of Enhanced College Credential and Credit Recognition in Ontario Page 21
The Centre for Spatial Economics
Economic and Financial Analysis Framework
The economic and financial analysis framework is based on a comparison of three current
practice assumptions relative to a 65% credit recognition benchmark. Achievement of this goal
would mean that, on average, college graduates would receive recognition of 65% of the credits earned in college diploma programs. In some programs, such as those programs designed
primarily for the purpose of university transfer, the goal would be to achieve recognition of at
least 75% of the credits earned in college.
In the absence of fully comparable international data regarding the amount of credit awarded to
diploma graduates pursuing degree programs, several factors were considered in determining the
65% benchmark value:
o The value is consistent with the terms of the 1999 agreement between Ontario's colleges and universities, known as the Port Hope Accord. The accord set out a framework for
undergraduate degree completion agreements between colleges and universities for
college graduates of two- and three-year diploma programs. According to the terms, college graduates would receive credit for approximately 65% of their overall program of
studies when transferring into undergraduate programs in a related field. While the Port
Hope Accord provisions have not been implemented throughout Ontario, the accord was
signed by both sectors.
o Several colleges offer degree programs and have developed academic policy to govern
the recognition of credit for graduates of college diploma programs. While there are
variations by college and by program, 3-year diploma holders transferring to college degree programs generally receive recognition for 65% of their program. It should be
noted that, for those programs with diploma to degree pathways included in their design,
the percentage is higher.
o Direct comparison with other jurisdictions is challenging due to the differing designs of
PSE systems, but practices in other jurisdictions were considered in developing a
benchmark for this study. In British Columbia, for example, “transfer ready” students
receive recognition for 85% of their earned credits. While Ontario has a limited number of comparable programs, the British Columbia experience demonstrates that a high
recognition rate for diploma studies is achievable. In Australia, two universities that
account for over 55% of Canadian citizens enrolling in undergraduate programs in that country report that, on average, three-year diploma graduates are required to undergo an
additional 1 to 2 years of study to complete a four-year undergraduate degree in a related
field, therefore receiving credit for at least 66% of their diploma studies.
Current Practice Assumptions
The 65% credit recognition benchmark is compared with three current practice assumptions. As noted earlier, the current practice estimates derived from the Graduate Satisfaction Survey
overstate the amount of credit that CAAT graduates currently receive when they enrol in an
undergraduate degree program at an Ontario university.
While the Graduate Satisfaction Survey data credit granted estimates derived in Table 3 are too
high, there is considerable uncertainty surrounding the actual amount of credit granted to college
graduates enrolling in an Ontario university undergraduate degree program. Colleges Ontario, therefore, determined a range of assumptions for current practice credit that (i) cover the likely
The Financial Benefits of Enhanced College Credential and Credit Recognition in Ontario Page 22
The Centre for Spatial Economics
“true” average credit granted in Ontario at present and (ii) demonstrate the sensitivity of the
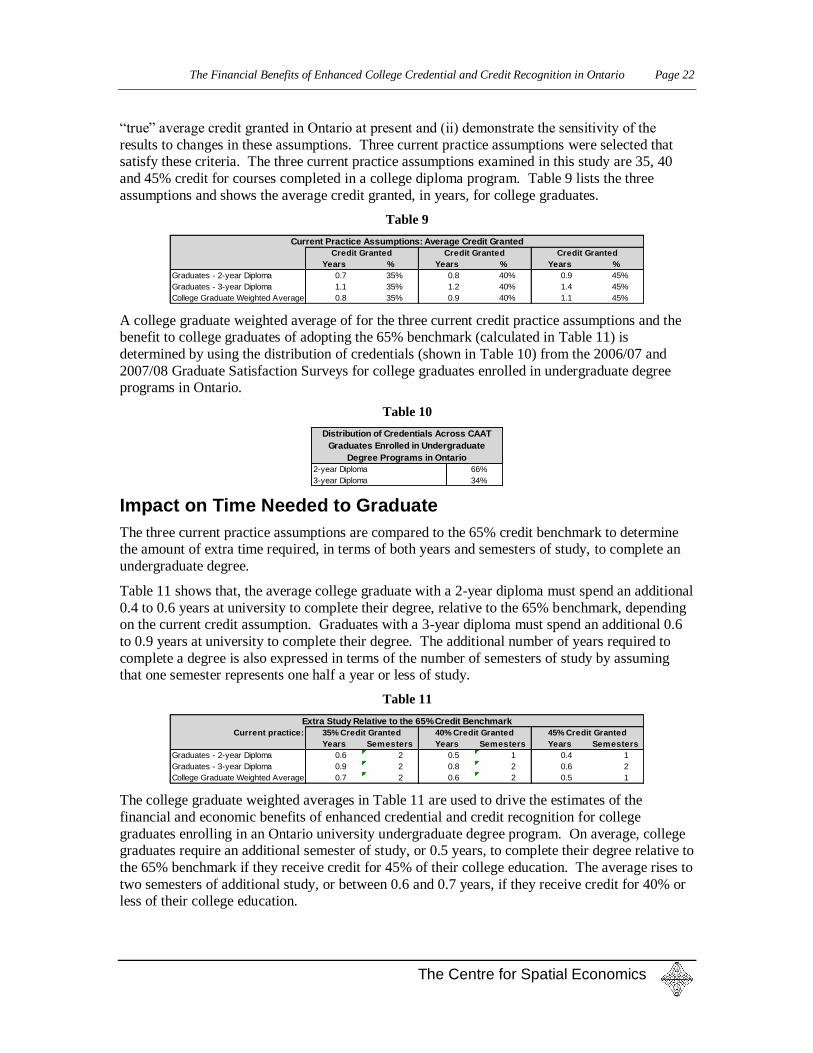
results to changes in these assumptions. Three current practice assumptions were selected that satisfy these criteria. The three current practice assumptions examined in this study are 35, 40
and 45% credit for courses completed in a college diploma program. Table 9 lists the three
assumptions and shows the average credit granted, in years, for college graduates.
College Graduate Weighted Average 0.8 35% 0.9 40% 1.1 45%
Current Practice Assumptions: Average Credit Granted
Credit Granted Credit Granted Credit Granted
A college graduate weighted average of for the three current credit practice assumptions and the benefit to college graduates of adopting the 65% benchmark (calculated in Table 11) is
determined by using the distribution of credentials (shown in Table 10) from the 2006/07 and
2007/08 Graduate Satisfaction Surveys for college graduates enrolled in undergraduate degree programs in Ontario.
Table 10
2-year Diploma 66%
3-year Diploma 34%
Distribution of Credentials Across CAAT
Graduates Enrolled in Undergraduate
Degree Programs in Ontario
Impact on Time Needed to Graduate
The three current practice assumptions are compared to the 65% credit benchmark to determine the amount of extra time required, in terms of both years and semesters of study, to complete an
undergraduate degree.
Table 11 shows that, the average college graduate with a 2-year diploma must spend an additional
0.4 to 0.6 years at university to complete their degree, relative to the 65% benchmark, depending on the current credit assumption. Graduates with a 3-year diploma must spend an additional 0.6
to 0.9 years at university to complete their degree. The additional number of years required to
complete a degree is also expressed in terms of the number of semesters of study by assuming that one semester represents one half a year or less of study.
Table 11
Current practice:
Years Semesters Years Semesters Years Semesters
Graduates - 2-year Diploma 0.6 2 0.5 1 0.4 1
Graduates - 3-year Diploma 0.9 2 0.8 2 0.6 2
College Graduate Weighted Average 0.7 2 0.6 2 0.5 1
The college graduate weighted averages in Table 11 are used to drive the estimates of the
financial and economic benefits of enhanced credential and credit recognition for college
graduates enrolling in an Ontario university undergraduate degree program. On average, college graduates require an additional semester of study, or 0.5 years, to complete their degree relative to
the 65% benchmark if they receive credit for 45% of their college education. The average rises to
two semesters of additional study, or between 0.6 and 0.7 years, if they receive credit for 40% or less of their college education.
The Financial Benefits of Enhanced College Credential and Credit Recognition in Ontario Page 23
The Centre for Spatial Economics
Calculating the Direct Benefits
The estimated reduction in the number of courses studied and time spent earning a degree is used
to determine the direct benefit to students and their families. The framework considers tuition and other fees, other education costs and living expenses. It also includes the benefit of starting a
career earlier by assessing the likelihood that the individual would be employed for the period of
study saved as a result of enhanced credit recognition at the average expected wage
commensurate with their education.
The benefit for students living both at home and away from home is combined with the number
of affected students to determine overall average direct costs. The per student benefits are
multiplied by the number of college graduates enrolling in an undergraduate degree program at an Ontario university over the next decade to derive a total private benefit of enhanced credential
and credit recognition.
The direct additional costs borne by the post-secondary education system and the Province of
Ontario of having students and graduates duplicate their learning are estimated based on average institutional operating grants and costs for student financial assistance programs times the number
of students affected over the ten-year period.
Establishing a new and effective provincial credit transfer system will undoubtedly require up-front provincial investments. These costs have not been estimated or included in this study. Any
costs will, however, be considerably smaller than the benefits to the province from reducing the
unnecessary costs arising from students having to repeat courses that they have already completed.
Economic and Fiscal Impact Methodology
The benefits from accelerated entry into the workforce are assessed from both a private and a
societal perspective. The private perspective approach was discussed in the previous section.
While these private benefits accrue to society as well, the increase in the labour force will also have an impact on wages rates in general. The C4SE‟s macroeconomic model of Ontario was
used to determine the implications of improving credential and credit recognition for the
provincial economy in terms of output and provincial government revenues and spending.
The economic impact of enhanced credential and credit recognition was estimated using the
Ontario model within the C4SE‟s Provincial Economic Modeling System. The C4SE‟s Provincial
Modeling System is a dynamic multi-sector regional economic model of the country. It includes
a bottom-up set of macroeconomic models for the provinces, the territories and the rest of the world. The national model links economic activity in one region with activity in the other regions
through trade. The provincial models include detailed income and expenditure categories and
demographic and labour market information. The purpose of the modeling system is to produce medium- to long-term projections of the provincial economies and conduct simulation studies that
require industry and demographic detail.22
The modeling system was adjusted to reflect the increase in labour force arising from the high, medium and low student transfer projections for both of the recognition benchmarks. The
resulting forecast values for provincial GDP, Ontario government revenues and spending were
then compared to the original – or baseline – forecast values for these measures in which the
22 More information on the C4SE‟s Provincial Economic Modeling System can be found in Appendix B.
The Financial Benefits of Enhanced College Credential and Credit Recognition in Ontario Page 24
The Centre for Spatial Economics
labour force was not altered. The result of this comparison was then averaged over a period of
years to determine the average, medium-term and long-run benefits to the economy of enhanced credential and credit recognition for each of the three current practice credit assumptions and for
the three student transfer projections.
In summary, the economic and financial analysis framework is designed to estimate the potential
benefits to individuals and the province of Ontario of implementing a coordinated, province-wide credit recognition and transfer program for CAAT graduates.
The Financial Benefits of Enhanced College Credential and Credit Recognition in Ontario Page 25
The Centre for Spatial Economics
Financial and Economic Benefits of Enhanced Credential and Credit Recognition
The financial and economic benefits of enhanced credential and credit recognition for CAAT
graduates enrolling in an undergraduate program at an Ontario university can be expressed in
terms of (i) the direct private benefits to each transfer student, (ii) the direct benefits to the public
sector and (iii) the overall benefits to Ontario‟s economy.
Direct Private Benefits to Students and their Families
Students and their families clearly benefit from completing their education in less time. Less
money is spent on tuition and other expenses associated with post-secondary education and more
time is spent starting their career.
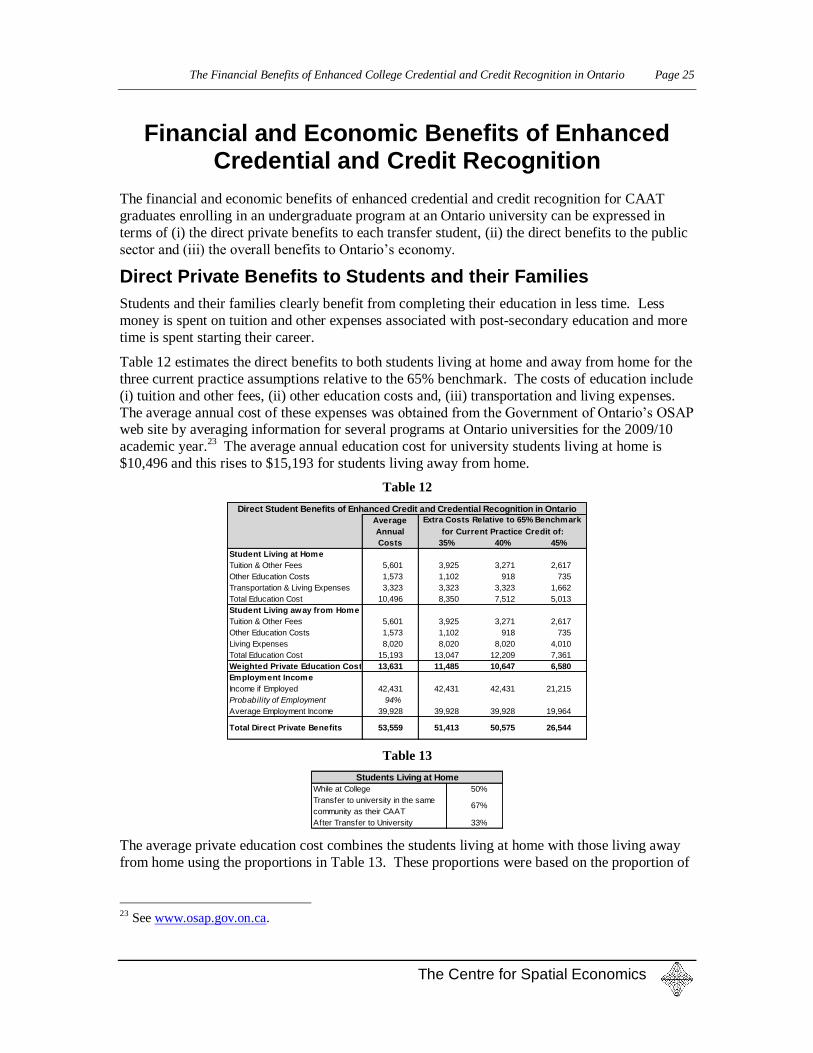
Table 12 estimates the direct benefits to both students living at home and away from home for the
three current practice assumptions relative to the 65% benchmark. The costs of education include
(i) tuition and other fees, (ii) other education costs and, (iii) transportation and living expenses.
The average annual cost of these expenses was obtained from the Government of Ontario‟s OSAP web site by averaging information for several programs at Ontario universities for the 2009/10
academic year.23
The average annual education cost for university students living at home is
$10,496 and this rises to $15,193 for students living away from home.
Table 12
35% 40% 45%
Student Living at Home
Tuition & Other Fees 5,601 3,925 3,271 2,617
Other Education Costs 1,573 1,102 918 735
Transportation & Living Expenses 3,323 3,323 3,323 1,662
The Financial Benefits of Enhanced College Credential and Credit Recognition in Ontario Page 26
The Centre for Spatial Economics
students living at home while attending college24
and the proportion of students that transfer to a
university in the same community as their college.25
Combining these two proportions leads to the estimate that 33% of students live at home after transferring to a university after attending
college.
The cost in terms of foregone employment income is based on the average annual income, if
employed, of a new university graduate with an undergraduate degree times the probability of finding employment.
26
The total direct benefit to a student, on average, is $50,575 based on the 40% current credit
assumption. This benefit rises to $51,413 for the 35% current credit assumption and falls to $26,544 for the 45% assumption. Over three-quarters of the benefit arises from the opportunity
to begin a career and earn income from employment.
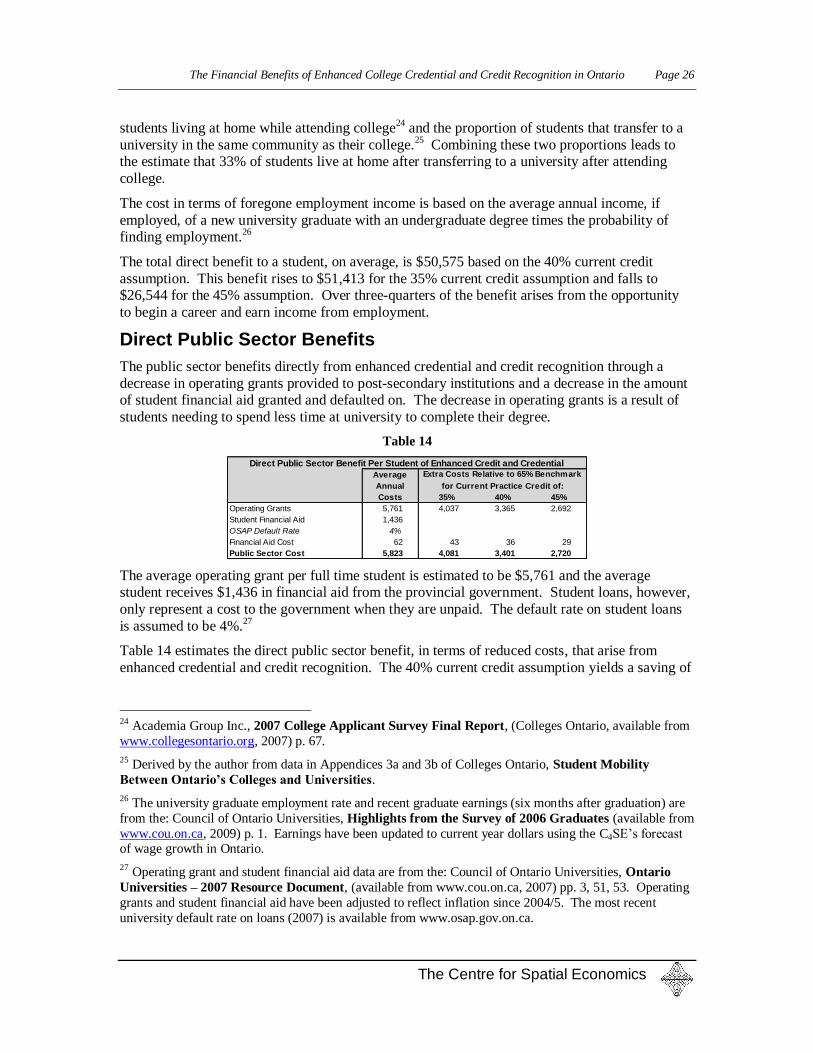
Direct Public Sector Benefits
The public sector benefits directly from enhanced credential and credit recognition through a
decrease in operating grants provided to post-secondary institutions and a decrease in the amount of student financial aid granted and defaulted on. The decrease in operating grants is a result of
students needing to spend less time at university to complete their degree.
Table 14
35% 40% 45%
Operating Grants 5,761 4,037 3,365 2,692
Student Financial Aid 1,436
OSAP Default Rate 4%
Financial Aid Cost 62 43 36 29
Public Sector Cost 5,823 4,081 3,401 2,720
Average
Annual
Costs
for Current Practice Credit of:
Extra Costs Relative to 65% Benchmark
Direct Public Sector Benefit Per Student of Enhanced Credit and Credential
The average operating grant per full time student is estimated to be $5,761 and the average student receives $1,436 in financial aid from the provincial government. Student loans, however,
only represent a cost to the government when they are unpaid. The default rate on student loans
is assumed to be 4%.27
Table 14 estimates the direct public sector benefit, in terms of reduced costs, that arise from
enhanced credential and credit recognition. The 40% current credit assumption yields a saving of
24 Academia Group Inc., 2007 College Applicant Survey Final Report, (Colleges Ontario, available from
www.collegesontario.org, 2007) p. 67.
25 Derived by the author from data in Appendices 3a and 3b of Colleges Ontario, Student Mobility
Between Ontario’s Colleges and Universities.
26 The university graduate employment rate and recent graduate earnings (six months after graduation) are
from the: Council of Ontario Universities, Highlights from the Survey of 2006 Graduates (available from
www.cou.on.ca, 2009) p. 1. Earnings have been updated to current year dollars using the C4SE‟s forecast of wage growth in Ontario.
27 Operating grant and student financial aid data are from the: Council of Ontario Universities, Ontario
Universities – 2007 Resource Document, (available from www.cou.on.ca, 2007) pp. 3, 51, 53. Operating
grants and student financial aid have been adjusted to reflect inflation since 2004/5. The most recent
university default rate on loans (2007) is available from www.osap.gov.on.ca.
The Financial Benefits of Enhanced College Credential and Credit Recognition in Ontario Page 27
The Centre for Spatial Economics
$3,401 per student to the provincial government with over 98% of the savings coming from
reduced operating grants.
Direct Benefit to Society
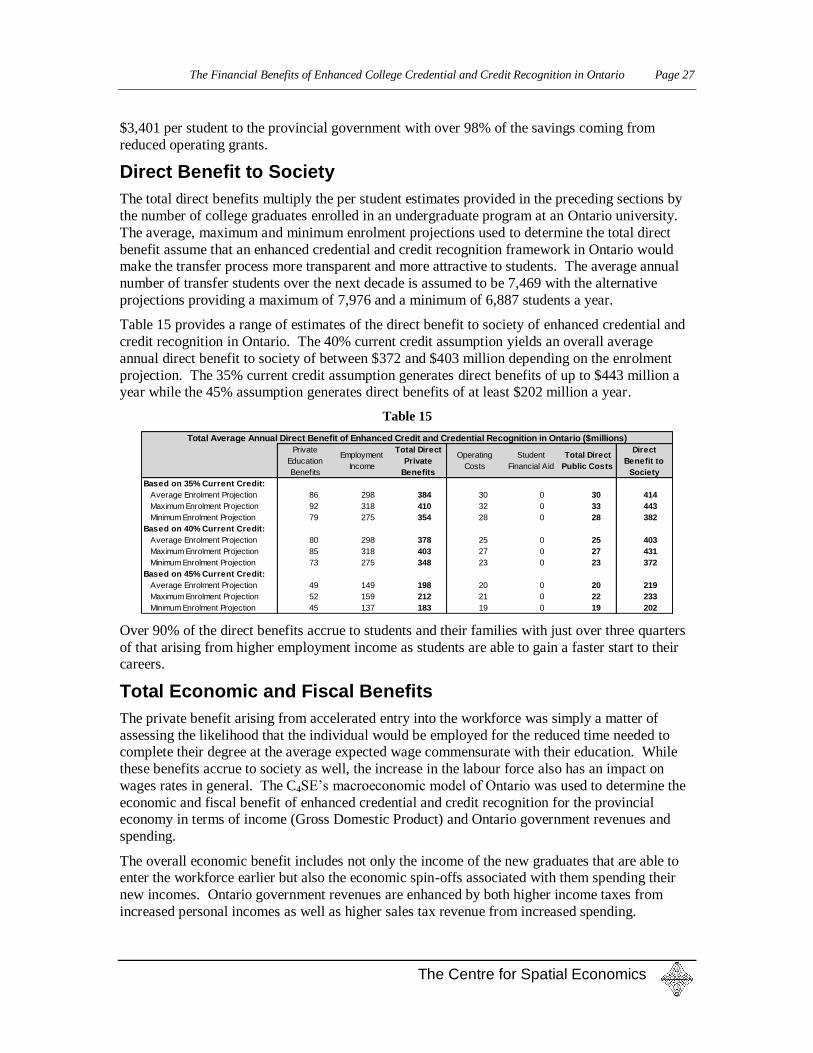
The total direct benefits multiply the per student estimates provided in the preceding sections by
the number of college graduates enrolled in an undergraduate program at an Ontario university.
The average, maximum and minimum enrolment projections used to determine the total direct
benefit assume that an enhanced credential and credit recognition framework in Ontario would make the transfer process more transparent and more attractive to students. The average annual
number of transfer students over the next decade is assumed to be 7,469 with the alternative
projections providing a maximum of 7,976 and a minimum of 6,887 students a year.
Table 15 provides a range of estimates of the direct benefit to society of enhanced credential and
credit recognition in Ontario. The 40% current credit assumption yields an overall average
annual direct benefit to society of between $372 and $403 million depending on the enrolment
projection. The 35% current credit assumption generates direct benefits of up to $443 million a year while the 45% assumption generates direct benefits of at least $202 million a year.
Table 15
Private
Education
Benefits
Employment
Income
Total Direct
Private
Benefits
Operating
Costs
Student
Financial Aid
Total Direct
Public Costs
Direct
Benefit to
Society
Based on 35% Current Credit:
Average Enrolment Projection 86 298 384 30 0 30 414
Maximum Enrolment Projection 92 318 410 32 0 33 443
Total Average Annual Direct Benefit of Enhanced Credit and Credential Recognition in Ontario ($millions)
Over 90% of the direct benefits accrue to students and their families with just over three quarters
of that arising from higher employment income as students are able to gain a faster start to their careers.
Total Economic and Fiscal Benefits
The private benefit arising from accelerated entry into the workforce was simply a matter of
assessing the likelihood that the individual would be employed for the reduced time needed to complete their degree at the average expected wage commensurate with their education. While
these benefits accrue to society as well, the increase in the labour force also has an impact on
wages rates in general. The C4SE‟s macroeconomic model of Ontario was used to determine the
economic and fiscal benefit of enhanced credential and credit recognition for the provincial economy in terms of income (Gross Domestic Product) and Ontario government revenues and
spending.
The overall economic benefit includes not only the income of the new graduates that are able to enter the workforce earlier but also the economic spin-offs associated with them spending their
new incomes. Ontario government revenues are enhanced by both higher income taxes from
increased personal incomes as well as higher sales tax revenue from increased spending.
The Financial Benefits of Enhanced College Credential and Credit Recognition in Ontario Page 28
The Centre for Spatial Economics
It is important to recognize that the societal benefits described are not just the typical Keynesian
multiplier effects generated in many studies, but represent an increase in total output because the amount of labour available to the economy has risen. Despite the ravages of the recent recession,
relentless demographic trends will still lead to labour and skills shortages in Ontario over the next
few decades which will limit the ability of the economy to grow.
The doubling of the transfer rate over the first decade (the medium-term) contributes to a continuous increase in the labour force participation rate and a gradual increase in the economic
and fiscal benefits over this period. Over the long-term (the fifteen year period following the first
decade), the transfer rate remains at its new, elevated level and the labour force participation rate is also assumed to remain at its new, higher level.
The GDP and Ontario government revenue impacts are the same for both the 35 and 40% current
credit assumptions because they are based on the average reduction in the number of semesters required to complete a degree. While students with a light course load have the opportunity to
work part time, this study is concerned with the time when a student is able to embark on a career
in their chosen field. A career can begin once a student graduates with a degree. Both the 35 and
40% current credit assumptions reduce the time needed to obtain a degree by two semesters while the time needed to obtain a degree is reduced by just one semester for the 45% current credit
assumption.
The reduction in Ontario government spending is defined as the direct reduction in spending arising from reduced post-secondary education system operating grants and reduced losses from
student financial aid. The net fiscal benefit to the government of Ontario is defined as the
difference between the change in government revenues arising from the increase in labour market participation rates and the direct reduction in government spending.
Table 16
Year 1 Year 2 Year 3
First 10 Year
Average
Annual
Long-term
Average
Annual
Based on 35% Current Credit
Gross Domestic Product -70 -40 2 136 782
Net Government of Ontario Fiscal Impact 17 26 35 61 169
Ontario Government Revenue -5 3 11 31 127
Ontario Government Spending -22 -23 -24 -30 -42
Based on 40% Current Credit
Gross Domestic Product -70 -40 2 136 782
Net Government of Ontario Fiscal Impact 14 22 31 56 162
Ontario Government Revenue -5 3 11 31 127
Ontario Government Spending -19 -19 -20 -25 -35
Based on 45% Current Credit
Gross Domestic Product -35 -20 1 69 393
Net Government of Ontario Fiscal Impact 12 17 21 36 91
Ontario Government Revenue -2 1 5 15 63
Ontario Government Spending -15 -15 -16 -20 -28
Economic Benefit of Enhanced Credit and Credential Recognition in Ontario (millions of 2009 dollars)
65% Credit Benchmark - Average Enrolment Scenario
The economic and fiscal benefits over the short-, medium- and long-term are shown in Table 16
for the average enrolment scenario. The short-term (year 1 through year 2) impact on GDP is slightly negative as wages rates and the economy adjust to an expanded labour force. The short-
The Financial Benefits of Enhanced College Credential and Credit Recognition in Ontario Page 29
The Centre for Spatial Economics
term fiscal impact is, however, positive as provincial government spending is reduced by more
than the decline in government spending.28
The average annual impact over the first decade (the medium-term) has GDP rise by $136 million
based on the 35 and 40% current credit assumptions and by $69 million for the 45% assumption.
The average annual net fiscal benefit over the medium-term is between $36 and $61 million with
the gains split almost evenly between higher government revenues and lower spending.
Over the long-term, defined as the annual average impact for the fifteen year period following the
first decade, GDP rises $393 million based on the 45% current credit assumption and $782
million based on 35 or 40% current credit assumptions. The net fiscal benefit to the Ontario government over the long-term is between $91 million and $169 million with the gains in
government revenue dominating the reduction in spending.
The economic and fiscal benefits are also dependent on the number of college graduates that benefit from an enhanced transfer system. Table 17 provides a sensitivity analysis of the
medium- and long-term impacts to the minimum, maximum and average enrolment scenarios for
each of the three current credit assumptions. The long-term average annual increase in GDP falls
between a low of $377 million for the low enrolment scenario and 45% current credit assumption and a high of $813 million for the high enrolment scenario for either the 35 or 40% current credit
assumption. Over the long-term, provincial government revenue rises between $62 and $129
million a year while spending falls between $26 and $46 million. The net fiscal benefit is, therefore between $87 and $175 million a year. The economic and fiscal benefits are, therefore,
significantly more sensitive to assumptions about the amount of credit currently provided to
college graduates than to the range of enrolment projections considered in this study. It is also worth recognizing that any enhancement to the transfer system that provides college graduates
with more credit than they receive at present will reduce the number of semesters of study
required to complete a degree. The economic benefits based on the 45% current credit
assumption represent, therefore, a minimum benefit that could be recognized by the province.
Table 17
Enrolment Projection: Minimum Maximum Average Minimum Maximum Average
Based on 35% Current Credit
Gross Domestic Product 133 138 136 747 813 782
Net Government of Ontario Fiscal Impact 59 64 61 161 175 169
Ontario Government Revenue 31 31 31 123 129 127
Ontario Government Spending -28 -33 -30 -38 -46 -42
Based on 40% Current Credit
Gross Domestic Product 133 138 136 747 813 782
Net Government of Ontario Fiscal Impact 54 58 56 155 167 162
Ontario Government Revenue 31 31 31 123 129 127
Ontario Government Spending -23 -27 -25 -32 -38 -35
Based on 45% Current Credit
Gross Domestic Product 67 70 69 377 409 393
Net Government of Ontario Fiscal Impact 34 37 36 87 95 91
Ontario Government Revenue 15 16 15 62 65 63
Ontario Government Spending -19 -22 -20 -25 -30 -28
Economic Benefit of Enhanced Credit and Credential Recognition in Ontario (millions of 2009 dollars)
65% Credit Benchmark - Impacts by Enrolment Scenario
First 10 Year Average Annual Impact Long-term Average Annual Impact
28 A reduced level of enrolment by college graduates in Ontario university undergraduate degree programs
in year 1 (the 2009/10 academic year) would reduce the fiscal benefit. If, for example, the number of
college graduates were restricted to the same level as the 2008/09 academic year then the fiscal benefit
would be reduced by $5 million based on 35% current credit to $12 million, by $4 million for 40% current
credit to $10 million, and by $3 million to $9 million for 45% current credit.
The Financial Benefits of Enhanced College Credential and Credit Recognition in Ontario Page 30
The Centre for Spatial Economics
Conclusion
This study has demonstrated that there are solid economic and financial reasons to develop and
implement a coordinated, province-wide credential and credit recognition and transfer system for
college graduates enrolling in an Ontario undergraduate degree program.
Based on a 65% credit recognition benchmark:
o The private benefit to each student averages over $26,000 if current practice provides
45% credit and over $50,000 if current practice provides 40% or less credit.
o The average annual benefit to Ontario‟s economy over the next decade lies between $69
and $136 million in additional GDP and rises to between $393 and $782 million a year in
the long-term.
o The first year net fiscal benefit to the Government of Ontario is between $12 and $17 million.
o The average annual net fiscal benefit to the Government of Ontario over the next decade
lies between $36 and $61 million and rises to between $91 and $169 million a year in the long-term.
The overall economic benefit includes not only the income of the new graduates that are able to
enter the workforce earlier but also the economic spin-offs associated with them spending their
new incomes. It is important to recognize, however, that the societal benefits described are not just the typical Keynesian multiplier effects generated in many studies, but represent an increase
in total output because the amount of labour available to the economy has risen. Despite the
ravages of the recent recession, relentless demographic trends will still lead to labour and skills shortages in Ontario over the next few decades which will limit the ability of the economy to
grow.
The project team believes the economic benefits generated in this report to be conservative. The analysis was limited to college graduates, although college students also enrol in university
undergraduate degree programs before completing their diploma. These students would also
benefit from an enhanced transfer system and, therefore, raise the total economic and fiscal
benefits estimated in this analysis. The potential cost to the provincial economy arising from students leaving Ontario to complete their degree and not returning has been ignored. Finally, it
is also worth recognizing that any enhancement to the transfer system that provides college
graduates with more credit than they receive at present will reduce the number of semesters of study required to complete a degree. The economic benefits based on the 45% current credit
assumption represent, therefore, a minimum benefit that could be recognized by the province.
While the economic benefits are significant; they are perhaps less compelling reasons for action than the equity and fairness issues confronting students in the current patchwork transfer
framework.
o The current transfer framework provides students with too little information about the
credit they can receive for their college education.
o The current system provides unequal credit for equal work across universities.
o The current system also encourages college graduates to leave Ontario to pursue their
university education out of province.
The Financial Benefits of Enhanced College Credential and Credit Recognition in Ontario Page 31
The Centre for Spatial Economics
Ontario‟s economic future depends on the skills and knowledge of students with a strong post-
secondary education. An enhanced, province-wide, coordinated credential and credit recognition and transfer system will encourage more students to pursue the higher education that matches
their interests and skills. It will also reduce the number of students who feel compelled to leave
Ontario to continue their education.
Ontario‟s post-secondary education system is unique. A solution cannot simply be imported from another region. However, the issues confronting students – and the potential benefits to the
provincial economy – make this an issue that the government cannot ignore. A Made-in-Ontario
solution is required to address the fundamental equity and fairness concerns of students, to simplify administration for post-secondary institutions, and to strengthen our economy.
Establishing a new and effective provincial credit transfer system will undoubtedly require up-
front provincial investments. New investments will be balanced by mid- and long-term financial benefits for the province. Now is the time for the government to provide the leadership necessary
to develop and implement an effective transfer framework to provide opportunity for the
workforce this province will need to compete and prosper in the global economy.
The Financial Benefits of Enhanced College Credential and Credit Recognition in Ontario Page 32
The Centre for Spatial Economics
Acknowledgments
The Centre for Spatial Economics would like to acknowledge and thank the numerous individuals
and organizations that assisted in the preparation of this study. In particular, staff at the Ontario
Ministry of Training, Colleges and Universities, the Ontario Colleges Application Service, and Suzanne Dwyer, Research Officer at Colleges Ontario generously provided data and analysis
used in this study. Tyler Charlebois, Director of Advocacy of the College Student Alliance
suggested college graduates to interview for this study. Finally, the guidance of the project steering committee and the insight of all interviewed for this study was invaluable. Any errors
and inconsistencies remain the fault of the author.
Project Steering Committee
Linda Franklin, President & CEO Colleges Ontario
Monica Reilly, Senior Research & Policy Advisor Colleges Ontario
Bill Summers, VP Research & Policy Colleges Ontario
Suzanne Dwyer, Research Officer Colleges Ontario
Michael Cooke, Vice President Academic George Brown College
Interviews
Maureen Callahan, Interim Executive Director College-University Consortium Council
Henry Decock, Associate VP Academic Seneca College
Franklin Gelin, Executive Director & Co-Chair BC Council on Admissions and Transfer
Karen Humphrey, Executive Director California Post-secondary Education Commission
Kevin Woolfork "
Janice Park, Director Alberta Council on Admissions and Transfer - Secretariat
Eric Dohei "
Harald Zinner "
Rob Acker "
Heather Sherry, Director, Office of Articulation Florida Department of Education, Office of Articulation
Matthew Bouck, Deputy Director "
Philip Steenkamp, Former Deputy Minister Ontario Ministry of Colleges, Training and Universities
Tony Tilly, President Fleming College
College Graduate Student Interviews
Imran Badshah
Jenn Howarth
Ryan Kennery
Zach Luft
Andrew Mercier
Danielle Pender
Aynsley Weatherall
The Financial Benefits of Enhanced College Credential and Credit Recognition in Ontario Page 33
The Centre for Spatial Economics
References
Academia Group Inc., (2007) “2007 College Applicant Survey Final Report”, Colleges Ontario
www.collegesontario.org.
Alberta Council on Admissions and Transfer, (2009) “Transfer Patterns Report 2008”, www.transferalberta.ca.
Association of Universities and Colleges of Canada, (2007) “Trends in Higher Education Volume
1. Enrolment” www.aucc.ca.
Association of Universities and Colleges of Canada, (2008) “Trends in Higher Education Volume
3. Finance” www.aucc.ca.
Bayard, Justin and Edith Greenlee (2009) “Graduating in Canada: Profile, Labour Market
Outcomes and Student Debt of the Class of 2005”, Statistics Canada Culture, Tourism and the Centre for Education Statistics Catalogue no. 81-595-M No. 074 www.statcan.gc.ca.
BC Stats, (2009) “2008 Admissions and Transfer Experiences of Students Continuing the Post-
Secondary Studies in British Columbia”, British Columbia Council on Admissions & Transfer www.bccat.bc.ca.
Bekhradnia, Bahram (2004) “Credit Accumulation and Transfer and the Bologna Process: an
Overview”, Higher Education Policy Institute www.bccat.bc.ca.
British Columbia Council on Admissions & Transfer (2005) “Accountability of the BC Transfer System”, www.bccat.bc.ca.
California Post-secondary Education Commisison, (2005) “Student Transfer in California Post-
secondary Education”, www.cpec.ca.gov.
Canadian Education Statistics Council, (2007) “Education Indicators in Canada: Report of the
Pan-Canadian Education Indicators Program 2007” Statistics Canada Catalogue No. 81-582-XPE
www.statca.gc.ca.
Colleges Ontario, (2009) “Student Mobility Between Ontario‟s Colleges and Universities”,
The Financial Benefits of Enhanced College Credential and Credit Recognition in Ontario Page 34
The Centre for Spatial Economics
Constantineau, Philippe (2009) “The Ontario Transfer Credit System: A Situation Report”,
Council of Ontario Universities www.cou.on.ca.
Council of Ontario Universities, (2006) “Facts and Figures: A Compendium of Statistics on
Ontario Universities”, www.cou.on.ca.
Council of Ontario Universities, (2007) “Ontario Universities – 2007 Resource Document”,
www.cou.on.ca.
Council of Ontario Universities, (2008) “Application Statistics 2007”, www.cou.on.ca.
Council of Ontario Universities, (2009) “Highlights from the Survey of 2006 Graduates of
Ontario University Undergraduate Programs”, www.cou.on.ca.
Dennison, John D. (2000) “Student Access and Mobility Within the British Columbia Post-
Secondary System”, British Columbia Council on Admissions & Transfer www.bccat.bc.ca.
Florida Legislature, Office of Program Policy Analysis & Government Accountability, (2009) “State Universities are Generally Following the Statewide Course Numbering System in
Awarding Appropriate Transfer Credit”, www.oppaga.state.fl.us.
Goldhaber, Dan, Bethany Gross and Scott DeBurgomaster (2008) “Community Colleges and
Higher Education: How do State Transfer and Articulation Policies Impact Student Pathways?”, University of Washington Center on Reinventing Public Education www.crpe.org.
Heslop, Joanne (2001) “Profile of BC College Transfer Students Admitted to BC Universities
1994/95 to 1998/99”, British Columbia Council on Admissions & Transfer www.bccat.bc.ca.
Insightrix Research Inc., (2008) “Alberta Post-secondary Graduate Outcomes Survey: 2005-06
Transfer Graduates”, Alberta Advanced Education and Technology www.transferalberta.ca.
Moore, Colleen, Nancy Shulock and Cristy Jensen (2009) “Crafting a Student-Centred Transfer Process in California: Lessons from Other States”, California State University Sacramento
Institute for Higher Education Leadership & Policy www.csus.edu/ihe.
Munro, John (2005) “Assessing the Benefits of the Transfer Credit System in British Columbia:
A Feasibility Study”, British Columbia Council on Admissions & Transfer www.bccat.bc.ca.
Preston, Gordon, T. (2005) “Best Practices in Transfer Review”, Alberta Council on Admissions
and Transfer www.acat.gov.ab.ca.
The Research & Planning Group for California Community Colleges, (2008) “Transfer Issues and Effective Practices: A Review of the Literature”, www.rpgroup.org.
York University, (2007) “An Analysis of Undergraduate Students Admitted to York University
from an Ontario College of Applied Arts and Technology (CAAT) between 1996 and 2006”,
College-University Consortium Council www.cucc-ontario.ca.
The Financial Benefits of Enhanced College Credential and Credit Recognition in Ontario Page 35
The Centre for Spatial Economics
Appendix A: Student Interviews
Student Transfer: Fleming College to Lethbridge College (Athabasca University)
1. Why did you want to transfer to a university?
I have always wanted to be a police officer. I learned that if I had more schooling (including a degree) it would help in the hiring process and during my career.
2. Why did you attend college rather than going directly to university?
Whilst at high school I saw presentations from various colleges and universities. The hands-on and practical component of colleges appealed to me as well as the fact that they are smaller and more close-knit. However, I always prepared myself for university in the future and made sure that no „doors were shut‟.
3. How useful was your college education / experience in preparing you for your university courses?
Amazing! The police foundation courses I took at college made the transition so much easier because I knew what to expect, particularly in the areas of law.
4. What certificate or diploma did you receive?
Two (2) year Diploma in Police Foundations
5. How much advanced standing did the university grant you?
I chose to go to Athabasca because it credited my full two years leaving me with needing only two years at university to complete my four-year degrees. I would have preferred to go to an Ontario university but they offered credits only for introductory courses and only for the equivalent of one semester.
6. Who helped you transfer institutions and was their help valuable?
Initially I was helped by Academic Counselling at Fleming College; they gave me information about Athabasca. Afterwards I was my only resource (i.e. there was no other assistance available) and I had to do my own research directly with the universities and on websites.
The Financial Benefits of Enhanced College Credential and Credit Recognition in Ontario Page 36
The Centre for Spatial Economics
Student Transfer: Sheridan College to Ryerson University
1. Why did you want to transfer to a university?
I have always wanted a degree. I went to college initially as the next step from high school, but even during my first year I was inquiring about options for university. University was a personal goal and for my career I believed it helped having both a diploma and a degree.
2. Why did you attend college rather than going directly to university?
I graduated early from high school. I did not have all the course requirements for a business degree at university and college was part of my preparation for university.
3. How useful was your college education / experience in preparing you for your university courses?
Looking back now, and even during my university days, I do not regret doing the Diploma. It made me so much better prepared at university. I entered university after three (3) years at college and it was clear (to me and others in my classes) who had been to college and who was there directly from high school. Those of us from college were more interactive during class and participated more. We were more prepared, had good study habits, understood the importance of speaking with the professors, and of “applied thinking”
4. What certificate or diploma did you receive?
Three (3) year Diploma in Business Management and Human Resource Management.
5. How much advanced standing did the university grant you?
Two (2) full years; I went into the third year of a four-year degree. I did have to do a couple of make-up courses. I think I was credited the two full years because my college courses were so robust and specific.
6. Who helped you transfer institutions and was their help valuable?
I heard about transferring at the Career Centre at Sheridan College. I met with them and they had summarised information about the number of credits that would usually be given at which schools. This helped me select the best three (3) options for transferring (to make the best use of my college investment). However, the information was general and I to do a lot of work and inquiries independently. The information available is definitely very confusing and not consistent and is very much a disincentive for transferring/continuing with education.
It was tough. A particular issue is that you do not know what credits you will receive until after you accept the university offer, at which time all other offers are null and void. (In this student‟s case he received acceptance from York and a scholarship but did not know what credits would be given and he eventually accepted Ryerson‟s offer.) This becomes a risk game!
The Financial Benefits of Enhanced College Credential and Credit Recognition in Ontario Page 37
The Centre for Spatial Economics
Student Transfer: Cambrian College to Cape Breton University
1. Why did you want to transfer to a university?
I graduated from Cambrian College in 2007 and have worked for two years, during which time I realised I needed a diploma and a degree in my field (business communications).
2. Why did you attend college rather than going directly to university?
In high school I did not know what I wanted to do and took a year off. Everyone was pushing me to go to university – to Queens or Western – to be a teacher. I knew that I didn‟t want to teach and I thought that the universities were too large and impersonal. I love to write and plan events and I liked the idea of “hands-on learning”. Cambrian could meet these needs; it was five (5) hours from home; and I really liked the programme.
3. How useful was your college education / experience in preparing you for your university courses?
I think it will be very useful: at college I studied public relations which honed my writing skills; I am older now (24) and much more ready to „buckle down‟ than I was when I left high school at 18.
4. What certificate or diploma did you receive?
A three (3) year Advanced Diploma in Public Relations.
5. How much advanced standing did the university grant you?
Cape Breton University credited my full three years so I only need one year (or eight school-year months) to complete my degree. I am going to Nova Scotia because of my frustrating and unfair experiences with the Ontario universities.
I applied to three Ontario universities: Lakehead gave zero transfer credits; University of Toronto gave zero transfer credits; and Western gave zero transfer credits until I wrote a letter and only then gave a one-year credit for general degree. And it was only when the letter was copied to the University President, College President, Minister of Education, and MPP that consideration was given.
My not having Grade 12 maths was problematic for the Ontario universities despite the fact that I had College maths courses. The Ontario universities would make no allowances for college courses (of any description) nor work experience.
I think that money may be a factor. When students go to university from high school, they will be at the university for three or four years (with the attendant funding); from college the students will be attending for fewer years.
6. Who helped you transfer institutions and was their help valuable?
The staff at Cambrian College were amazing and really helped me through the process. Cape Breton University was also a great institution to work with and called me back within 24 hours of my contacting them. The Ontario universities did not call back at all and it was only when the President of Cambrian wrote emails to the university presidents that I received any replies.
I was fortunate to have an excellent working relationship with Cambrian College staff because of my work with various organisations there. Most students would not have the same relationship and would probably give up out of frustration.
The Financial Benefits of Enhanced College Credential and Credit Recognition in Ontario Page 38
The Centre for Spatial Economics
Student Transfer: Sheridan College to University of Ottawa
1. Why did you want to transfer to a university?
To continue my education. I was 19 when I finished my degree from Sheridan and while I felt equipped to enter the workforce I did not feel ready for a career.
2. Why did you attend college rather than going directly to university?
The “hands-on” component „spoke‟ to me. I was interested in journalism and developing hands-on skills to use in the workplace – at least, that is the way it was presented to me in high school.
3. How useful was your college education / experience in preparing you for your university courses?
Very. Partially because I entered university at the age of 20 and partly because I was not „fresh‟ out of school. More specifically, I understood about taking ownership of my post secondary education and about workload.
4. What certificate or diploma did you receive?
I took a Full Time course load for a two (2) year degree.
5. How much advanced standing did the university grant you?
On admission, the university credited one class (or course). However, after negotiating with the faculty and providing course descriptions and a copy of my diploma, I was granted 21 credits (or 7 courses). The majority of these credits were electives, which caused me to change my degree (from a double honours --- which did not have many electives) to facilitate using all the credits.
When I applied, I was asked to do an essay-writing course even though I had a degree in journalism; I was able to negotiate with the faculty to eliminate this requirement.
I “negotiated” with the Faculty after meeting a number of CEGEP (Quebec) students. The CEGEP students were granted second-year status. I thought that as I had been a student in Ontario and had paid for this education, the original one class accreditation was not reasonable.
6. Who helped you transfer institutions and was their help valuable?
I did not “transfer” but applied as a new applicant (this was three years ago) through UAP. [Applied as a 105 applicant; 101 are directly from high school.] I applied on January 2 but was not admitted until April 20. The high school applicants were processed first because it is much easier to compare their marks.
The “system‟ did not help me, it was my own initiative. As a 105 applicant I think I was at a disadvantage because the university did not really know how to judge my marks (87%) from a College vs those from a high school. And, by not being processed until after the high school students I was unable to obtain my choice of residency.
The Financial Benefits of Enhanced College Credential and Credit Recognition in Ontario Page 39
The Centre for Spatial Economics
Student Transfer: Conestoga College to Ryerson University
1. Why did you want to transfer to a university?
To further my education. College prepared me only so far and a degree would help with my career. I find that most employers value a degree rather than a diploma.
2. Why did you attend college rather than going directly to university?
At the point of leaving high school I didn‟t really like school and I didn‟t want to spend another four (4) years studying, so I decided to go to college and then get a job. However, after college I realised I liked business and that university was my best next step.
3. How useful was your college education / experience in preparing you for your university courses?
It was very beneficial. Before going to college I knew very little about business. The teachers at college were excellent and they prepared me well. The university courses picked up where the college course left off.
4. What certificate or diploma did you receive?
A three (3) year diploma in Business Management.
5. How much advanced standing did the university grant you?
Not as much as I wanted! Technically Ryerson gave me two (2) years but I had to take six (6) reach-back courses in finance, so really it was only one-and-a-half years. Their initial information was misleading as they failed to mention the reach-back requirement.
6. Who helped you transfer institutions and was their help valuable?
The teachers at college were enthusiastic about my transferring to university and they provided me with information and were particularly knowledgeable about Ryerson. However, I had no assistance with actual application process etc. and did that alone.
The Financial Benefits of Enhanced College Credential and Credit Recognition in Ontario Page 40
The Centre for Spatial Economics
Student Transfer: Conestoga College to York University
1. Why did you want to transfer to a university?
A bachelor‟s degree allows more opportunities in a career than a diploma.
2. Why did you attend college rather than going directly to university?
I was not accepted at university; college was best for me when I left high school.
3. How useful was your college education / experience in preparing you for your university courses?
Quite useful. It prepared me in understanding my courses at university much better than if I had entered university directly from high school. I had straight As at university!
4. What certificate or diploma did you receive?
Two (2) year Diploma in Police Foundations.
5. How much advanced standing did the university grant you?
One year.
6. Who helped you transfer institutions and was their help valuable?
Nobody helped. At Conestoga I was the Vice President for Students so I generally knew what I was doing.
The Financial Benefits of Enhanced College Credential and Credit Recognition in Ontario Page 41
The Centre for Spatial Economics
Student Transfer: Cambrian College to Laurentian University
1. Why did you want to transfer to a university?
There is an Articulation Agreement between Cambrian and Laurentian that enabled me to take a three (3) year college diploma at Cambrian and then apply to Laurentian and go into fourth year and get my degree (after only one year of study).
2. Why did you attend college rather than going directly to university?
I did not do my OAC and therefore could not go directly to university from high school (OAC was a pre-requisite for acceptance at university). Also, there was no programme at university that interested me. College was more “hands on” and the Public Relations program interested me.
3. How useful was your college education / experience in preparing you for your university courses?
College taught me: how to be “hands on”; how to write a press release; how to work computers; how to speak to people. University taught me how to “think” but not how to “do”. I very much benefited from going to college first and was able to get a lot more out of my university year than if I had gone there directly from high school.
4. What certificate or diploma did you receive?
A three (3) year Diploma in Public Relations.
5. How much advanced standing did the university grant you?
Because of the Articulation Agreement I received full credit for my three years at college and went straight into fourth year at university. (The Articulation Agreement enables students to reverse the process i.e. go to University and then College.) Also, I did not have to decide about whether to apply to University until I was ready --- about six months prior to start of university.
6. Who helped you transfer institutions and was their help valuable?
I talked a lot to the Director of Public Relations at Cambrian who explained what is involved and we had a number of visits from Laurentian University personnel. In particular xxxxxxxx, who is in charge of communications at Laurentian, was very helpful (we could even call her at home) and she helped us pick our courses.
The Financial Benefits of Enhanced College Credential and Credit Recognition in Ontario Page 42
The Centre for Spatial Economics
Appendix B: C4SE Provincial Modeling System
The C4SE‟s Provincial Modeling System is a dynamic multi-sector regional economic model of
the country. This system includes a set of bottom up macroeconomic models for the provinces
plus a combined territories and rest of world model. A national model then links economic
activity in one region with activity in the other regions. This model includes detailed income and expenditure categories and demographic and labour market information. The purpose of the
model is to produce medium to long-term projections of the provincial economies and conduct
simulation studies that require industry and demographic detail.
The modeling system is used to produce the C4SE‟s Provincial Economic Service semi-annual
forecasts and was used in preparing the following recent reports:
o The Centre for Spatial Economics, Made in Ontario: The Case for Sales Tax
Harmonization. Toronto, ON: Ontario Chamber of Commerce; 2009.
o The Centre for Spatial Economics, The Economic Impact of the Detroit Three Auto
Manufacturers in Canada. Toronto, ON: Ontario Manufacturing Council; 2008.
o The Centre for Spatial Economics, The Economic Cost of Wait Times in Canada. Ottawa, ON: Canadian Medical Association; 2008.
This modelling system consists of a set of provincial and territorial macroeconomic models that
are linked through trade, financial markets and inter-provincial migration. The impact on the supply chain – in terms of output and employment – is fully captured by the multi-sector model,
which incorporates the purchasing patterns from the current input-output tables. But, in contrast
to an input-output model, a dynamic macroeconomic model also considers the impact on
supplier‟s investment decisions that occur as a result of the change in economic activity.
The model produces impacts on employment, labour income, value added output, productivity,
investment and exports for at least fourteen industry sectors (see list below). It also produces the
impacts on government revenue by level of government and source of revenue. The dynamic nature of the model, however, makes it more challenging to develop a single summary measure
that provides a “rule-of-thumb” result. The need for such a measure is satisfied by generating an
average over a multi-year period thus capturing the long-run impact on the economy.
C4SE Model – Industry Sectors
Agriculture Other Primary (detail varies by province) Manufacturing (detail varies by province) Construction Utilities Transportation & Warehousing Trade
Finance, Insurance & Real Estate Professional, Scientific & Management Services Accommodation & Food Health Services Other Services Education Services Government Services
The following sections provide the reader with more information on the structure of the individual provincial models and the national model that unites the provincial and territorial
models.
The Financial Benefits of Enhanced College Credential and Credit Recognition in Ontario Page 43
The Centre for Spatial Economics
Provincial Models
The provincial and territorial models are very similar in structure – the parameters in each model
differ to reflect differences in the economic experience of each region.
The provincial models are similar in nature to a general equilibrium model, but full product and
factor substitution is not implemented. At present, substitution is restricted to the energy products and value-added. For purposes of manageability the model does not consider the impacts of
changes in relative labour and capital costs across industry categories. There is only one wage
rate and one set of cost of capital measures – construction and equipment – in the model. Changes in these measures of labour and capital costs cause labour and capital intensities to
change across all sectors of the economy.
The model's economy is organized into four broad sectors. Firms employ capital and labour to
produce a profit-maximizing output under a Cobb-Douglas constant-returns-to-scale technology. Households consume the domestic and foreign products and supply labour under the assumption
of utility maximization. Governments purchase the domestic and foreign products and produce
output. Foreigners purchase the domestic product and supply the foreign product.
There are two main markets in the model. These markets correspond to the domestic and foreign
products and the labour market. Each of these markets is concerned with the determination of
demands, supplies, and prices. Like most sub-national models, the Ontario model assumes that most prices are set in national markets. The presence of the National model in the system means
that interest rates, exchange rates and the price of some goods and services are affected by
changes in economic activity in Ontario and the rest of the country.
In sub-national economies, the movement of labour is a key factor in the adjustment of the local economy to changes in economic conditions. The C4SE‟s model allows net migration – and
therefore the total population – to adjust over time to reflect changes in economic conditions. If
the economy and employment is growing, then the demand for labour rises and net migration rises. This feature is an important consideration when examining economic impacts over one or
more decades.
National Model
The presence of the national model is what makes the C4SE‟s system unique. The national block
adds up the economic activity across the country and uses this information to help determine
prices, interest rates, exchange rates and the rest-of-country external demand for goods and services – all factors that are exogenous to other provincial modelling systems.
To see why this is important, consider an increase in one province‟s economy. This raises that
province‟s demand for imports. In this system each of the other provinces sees an increase in
demand for their exports to that province which, in turn, raises their own economies. The increase in economic activity will put upward pressure prices, interest rates and the exchange rate.
The entire national economy, therefore, adjusts over time to the initial shock.