51
The Fire Weather Forecast Accuracy Assessment and Lightning Ignition Probability System User Guide Prepared for Joint Fire Science Program (JFSP) Boise, Idaho September 2015
The Fire Weather Forecast Accuracy Assessment and Lightning Ignition
Probability System
User Guide Prepared for
Joint Fire Science Program (JFSP)
Boise, Idaho
September 2015

This document contains blank pages to accommodate two-sided printing.

Cover graphic shows the Fire Weather website.
The Fire Weather Forecast Accuracy Assessment and Lightning Ignition Probability
System
User Guide STI-915053-6359-UG
Prepared by
Stacy A. Drury
Sonoma Technology, Inc. 1455 N. McDowell Blvd., Suite D
Petaluma, CA 94954-6503 Ph 707.665.9900 | F 707.665.9800
sonomatech.com
Prepared for
Joint Fire Science Program (JFSP)
September 30, 2015


Fire Weather System User Guide Table of Contents
iii
Table of Contents
Section Page
List of Figures ............................................................................................................................ iv List of Tables ............................................................................................................................. vi
1. The Fire Weather System .............................................................................................. 1-1
2. Overview of the Fire Weather System ............................................................................ 2-1 2.1 Fire Weather Accuracy Assessment ..................................................................... 2-1 2.2 Digital Map Displays ............................................................................................. 2-6
3. Navigating the Site Info Page ......................................................................................... 3-1
4. Navigating the Time Series Graph Page ........................................................................ 4-1
5. Navigating the Data Map Page ...................................................................................... 5-1
6. Reference ...................................................................................................................... 6-1
Fire Weather System User Guide Lists of Figures and Tables
iv
List of Figures
Figure Page
1-1. Flow diagram of the real-time fire weather data acquisition and forecast evaluation system. .........................................................................................................................1-2
1-2. Spatial maps of lightning probability (likelihood of lightning strike) and dry lightning probability (likelihood that a lightning strike will happen plus the likelihood that the lightning strike will not be accompanied by significant rainfall). .....................................1-3
2-1. Opening view of the Site Info page. ..............................................................................2-2
2-2. Zoomed-in aerial view of a selected weather station. ....................................................2-3
2-3. View of the rollover functionality to show the hour when the observed weather data were gathered ..............................................................................................................2-3
2-4. Example showing a graphical assessment of air temperature observations versus GFS forecasts. .............................................................................................................2-4
2-5. The Time Series Graph page allows users to graphically view all weather station observations collected in the Fire Weather System since 2011. ...................................2-5
2-6. Observed weather data compared diurnally with model forecast data ..........................2-5
2-7. The Data Map page, which shows digital maps of weather forecasts, fire danger indices, fuel loading, and lightning and ignition probability. ...........................................2-6
2-8. Street map zoomed in to show finer-scale details of Sleepy Hollow Open Space Preserve in Marin County, California. ...........................................................................2-7
2-9. Map of the Sleepy Hollow Open Space Preserve in Marin County, California, overlain with forecasted temperature from the NDFD meteorological forecasting system. .........................................................................................................................2-8
2-10. Information shown when an individual pixel is selected in the Fire Weather System: the pixel’s latitude and longitude, the three closest weather stations to the pixel location, and the forecasted information for temperature, relative humidity, wind speed, and wind direction. ....................................................................................2-8
2-11. Fuel loading information is available on the Data Map page using three fuel loading mapping systems: the FCCS, the Standard 40 fire behavior fuel models, and the NFDRS fuel models .........................................................................................2-9
2-12. Zoomed-in satellite view of east Marin County near San Pablo Bay. ............................2-9
2-13. NFDRS fuel models mapped to 30 meter pixels for the area of interest shown in Figure 2-12. ................................................................................................................ 2-10
2-14. Fuel loading information in the NFDRS fuel model layer for the blue area in Figure 2-13. ................................................................................................................ 2-10

Fire Weather System User Guide Lists of Figures and Tables
v
Figure Page
2-15. FCCS fuel bed information for FCCS fuel bed #46. .................................................... 2-11
2-16. Fuel loading information for the Standard 40 fuel models. .......................................... 2-11
2-17. Digital map of NFDRS energy release component (ERC). .......................................... 2-12
2-18. Lightning probability grid showing the likelihood in percent that a lightning strike will occur. ................................................................................................................... 2-13
2-19. Dry lightning probability grid showing the likelihood that lightning will occur without appreciable moisture in the form of precipitation. ........................................................ 2-13
2-20. Ignition probability map created using a combination of NFDRS forecasted 1-hr fuel moisture and ERC values to estimate the likelihood that an ignition would occur provided an ignition source ............................................................................... 2-14
2-21. Lightning ignition probability map ................................................................................ 2-14
2-22. Dry lightning ignition map ........................................................................................... 2-15
3-1. Opening view on the Site Info page ..............................................................................3-1
3-2. The white cross has been selected and the user has selected the street view to help zoom in to the area of interest. ..............................................................................3-2
3-3. Satellite imagery view of area near the San Carlos Apache Reservation. .....................3-3
3-4. Information for San Carlos Airport ASOS station, MADIS ID QSCA3. ...........................3-3
3-5. Observation and forecast time display rollover functionality ..........................................3-4
3-6. Dropdown selection for selecting a weather parameter to use in forecast versus observation comparisons. .............................................................................................3-5
3-7. Comparison graph identifying model accuracy and forecast corrections using a bias estimate. ...............................................................................................................3-6
4-1. Opening view of the Time Series Graph page showing temperature observations compared to model forecasts. ......................................................................................4-1
4-2. Single line graph showing diurnal pattern of temperature at the Santa Rosa RAWS station RSAC1 ..............................................................................................................4-2
4-3. GFS modeled observations compared with weather station observations. ...................4-3
4-4. RSAC1 weather observations compared with the NAM air temperature forecasts. .......4-4
4-5. RSAC1 weather observations compared directly with the NFDS temperature forecasts. ......................................................................................................................4-4
Fire Weather System User Guide Lists of Figures and Tables
vi
Figure Page
5-1. Opening view of the Data Map page. ............................................................................5-1
5-2. Surface air temperature forecasts (2 meter) from the NDFD for the western United States ...........................................................................................................................5-2
5-3. Zoomed-in view of the San Carlos Apache Reservation Area. ......................................5-2
5-4. Temperature forecast for the zoomed in area shown in Figure 5-3 ...............................5-3
5-5. Area selected within the San Carlos Reservation to review the site-specific weather forecast. ..........................................................................................................5-3
5-6. Weather information for the three forecast systems that cover the San Carlos Apache Reservation .....................................................................................................5-4
5-7. 24-hour lightning potential map. ...................................................................................5-5
5-8. 48-hour lightning potential map ....................................................................................5-6
5-9. 72-hour lightning potential map ....................................................................................5-7
5-10. 24-hour dry lightning occurrence probability map. ........................................................5-8
5-11. 48-hour dry lightning occurrence probability map. ........................................................5-9
5-12. 72-hour dry lightning occurrence probability map ....................................................... 5-10
5-13. San Carlos Apache Reservation area of interest. ....................................................... 5-11
5-14. 24-hour lightning probability forecast for the San Carlos area ..................................... 5-11
5-15. 24-hour dry lightning probability forecast for the San Carlos area ............................... 5-12
5-16. Forecasted rainfall for the San Carlos Apache Reservation on Tuesday, September 22, 2015, indicating a high likelihood of significant rainfall. ....................... 5-12
List of Tables
Table Page
2-1. Fire weather system contents. ..........................................................................................2-1

Fire Weather System User Guide Fire Weather System
1-1
1. The Fire Weather System
The fire weather forecast accuracy and lightning ignition probability system (Fire
Weather System) is an online system that collects and compares meteorological observations
with forecasted meteorological parameters in near-real time to support fire management
decisions. Fire weather forecasts, and the underlying meteorological data, are important
components of fire ignition potentials, fire danger rating systems, fire behavior predictions, and
smoke dispersion modeling. Fire managers can use the Fire Weather System to determine
which forecasting system provides the most accurate fire weather forecast. Fire weather
forecasts commonly support fire suppression activities and “go, no go” decisions for prescribed
burning. The Fire Weather System also provides fuel moisture, fire danger rating indices,
ignition probabilities, and lightning potential probabilities to help determine the flammability
status of the fuels across landscapes and the potential that these fuels may be ignited by
lightning.
The Fire Weather System acquires modeled and observed surface meteorological
information in near real-time (daily for model predictions, hourly for observations) from various
sources, ingests data into a model data management system (MDMS), statistically tests the
information to identify potential differences and biases, and outputs the information via a web-
based online mapping system. The system gathers meteorological data from 2,200 automated
weather stations (RAWS and ASOS1) and gathers forecasted meteorological data from four
forecasting systems: the Global Forecasting System (GFS), the North American Mesoscale
Model (NAM), and the National Digital Forecast Database (NDFD), and the Weather Research
and Forecasting model (WRF). Observed and modeled weather parameters are compared
statistically in near-real time to evaluate model performance and support decisions on how
much users can trust the accuracy of model forecasts (Figure 1-1).
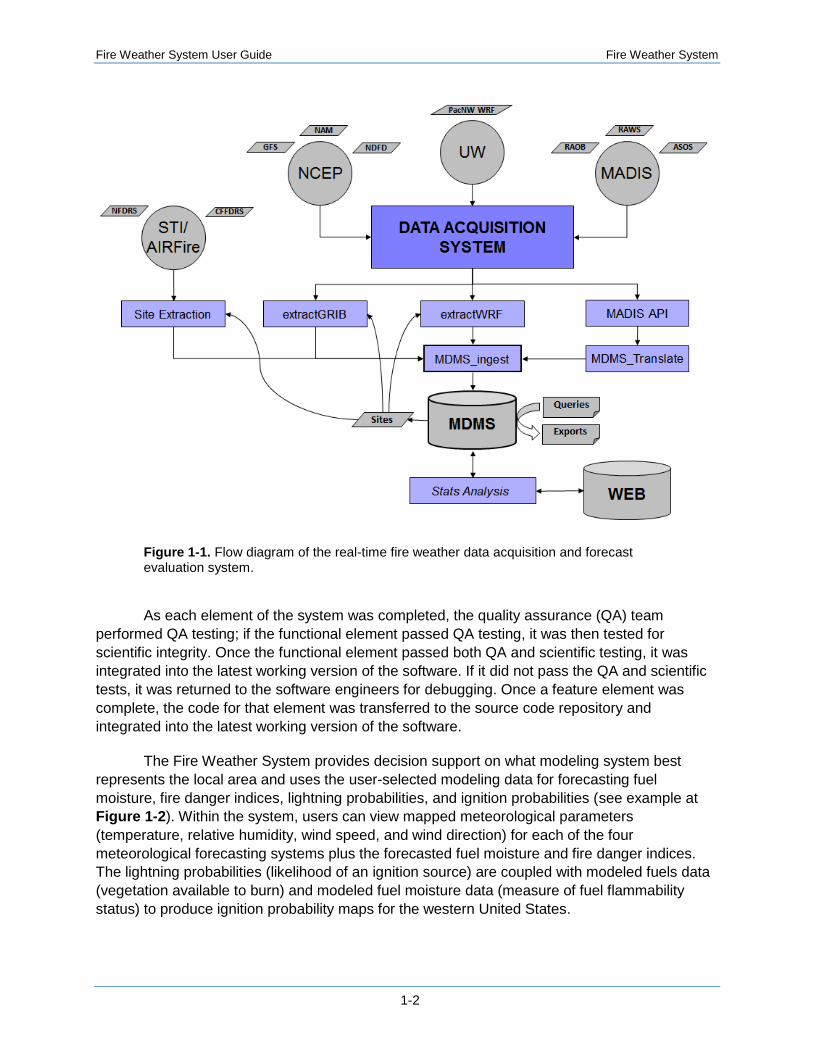
The data acquisition system is currently configured to acquire the observed and modeled
meteorological data sets from three sources: (1) the National Oceanic and Atmospheric
Administration’s (NOAA) Earth Systems Research Laboratory (ESRL) Global Systems Division
(GSD) Meteorological Assimilation Data Ingest System (MADIS) (http://madis.noaa.gov);
(2) National Centers for Environmental Prediction (NCEP); and (3) the University of Washington
(UW) Department of Atmospheric Sciences. Surface and upper-air observations are acquired
from the MADIS platform. MADIS provides a single point of access to quality-controlled
meteorological observations from hundreds of networks and agencies around the world. Fire
danger indices and fuel moisture estimates are produced by STI and the AirFire team. We
produce daily, spatially resolved, forecasted National Fire Danger Rating System (NFDRS) and
Canadian Forest Fire Danger Rating System (CFFDRS) fire danger and fuel moisture products
using inputs from the GFS, NAM, and WRF model forecasts.
1 Remote Automatic Weather Stations (RAWS); Automated Surface Observing Systems (ASOS).
Fire Weather System User Guide Fire Weather System
1-2
Figure 1-1. Flow diagram of the real-time fire weather data acquisition and forecast evaluation system.
As each element of the system was completed, the quality assurance (QA) team
performed QA testing; if the functional element passed QA testing, it was then tested for
scientific integrity. Once the functional element passed both QA and scientific testing, it was
integrated into the latest working version of the software. If it did not pass the QA and scientific
tests, it was returned to the software engineers for debugging. Once a feature element was
complete, the code for that element was transferred to the source code repository and
integrated into the latest working version of the software.
The Fire Weather System provides decision support on what modeling system best
represents the local area and uses the user-selected modeling data for forecasting fuel
moisture, fire danger indices, lightning probabilities, and ignition probabilities (see example at
Figure 1-2). Within the system, users can view mapped meteorological parameters
(temperature, relative humidity, wind speed, and wind direction) for each of the four
meteorological forecasting systems plus the forecasted fuel moisture and fire danger indices.
The lightning probabilities (likelihood of an ignition source) are coupled with modeled fuels data
(vegetation available to burn) and modeled fuel moisture data (measure of fuel flammability
status) to produce ignition probability maps for the western United States.

Fire Weather System User Guide Fire Weather System
1-3
Figure 1-2. Spatial maps of lightning probability (likelihood of lightning strike) and dry lightning probability (likelihood that a lightning strike will happen plus the likelihood that the lightning strike will not be accompanied by significant rainfall).
This user guide introduces users to the system, provides an overview of what can be
done in the system, and describes how to navigate through the system. Section 2 provides an
overview of the functionality in the system, Section 3 illustrates how to navigate the Site Info
page, Section 4 illustrates how to navigate the Time Series Graph page, and Section 5
illustrates how to navigate the Data Map page.


Fire Weather System User Guide Overview
2-1
2. Overview of the Fire Weather System
From the user perspective, the Fire Weather System website is divided into two
functions: (1) a fire weather accuracy assessment that can compare weather parameter
forecasts—including temperature, relative humidity, wind speed, and wind direction—with direct
meteorological measurements, and (2) a set of ignition probabilities that can forecast the
likelihood of lightning that will ignite fuels and the likelihood that lightning will encounter
receptive fuels. The system covers the western half of the contiguous United States. The
website is organized around three pages: Site Info, Time Series Graph, and Data Map.
Information provided in each page is listed in Table 2-1.
Table 2-1. Fire weather system contents.
Data Type/Source Parameters
Site Info Page
Observations and forecasts WS, WD, T, RH
Models GFS, NAM, WRF, NDFD
Time Series Graph Page
Observations and forecasts WS, WD, T, RH
Data Map Page
Base layers World street map, imagery map, topo map
NDFD WS, WD, T, RH, rainfall
GFS WS, WD, T, RH, P
NAM WS, WD, T, RH, P
WRF WS, WD, T, P, Short-wave radiative flux
NFDRS (using GFS, NAM, or WRF)
Burning index; ERC; 1-hr, 10-hr, 100-hr, 1000-hr, 10,000-hr fuel moisture; ignition component; Keech-Byram drought index; spread component
CFFDR (using GFS, NAM, or WRF)
Duff moisture code, drought code, initial spread index, buildup index, weather index, severity rating
Fuel loading FCCS, NFDRS, FB40
Lightning probability NDFD lightning 24-hr, 48-hr, 72-hr; dry lightning 24-hr, 48-hr, 72-hr
Parameters: WS = wind speed, WD = wind direction, T = air temperature, RH = relative humidity,
P = barometric pressure, ERC = energy release component.
Models: NDFD = National Digital Forecast Database; GFS = Global Forecast System; NAM = North
American Model; UW WRF = University of Washington’s Pacific NW Weather Research and Forecasting
modelFuel Models: FCCS = Fuel Characteristic Classification System, NFDRS = National Fire Danger
Rating System, FB40 = standard 40 fire behavior fuel models
2.1 Fire Weather Accuracy Assessment
The fire weather accuracy assessment section consists of two web pages: (1) the Site
Info page (http://w356:8080/FireWeatherWeb/siteInfo/) and (2) the Time Series Graph page

Fire Weather System User Guide Overview
2-2
(http://w356:8080/FireWeatherWeb/timeSeriesGraph). On the Site Info page, users are able to
view observational data for a series of 2,200 weather stations including both RAWS and ASOS
stations. Users can locate weather stations in their area using a mapping system that includes
topographic maps, street maps, and satellite imagery (Figure 2-1). The user can search and
pan to a general location on these maps. Once in the general area, the user can zoom in to
locate the specific weather station of interest (see Section 3). Alternatively, if the user enters a
station’s alphanumeric designation (such as RSAC1 or KBDU), the system will zoom to the
specific site location.
Figure 2-1. Opening view of the Site Info page. Each of 2,200 weather stations tracked in the system are designated by green triangles.
Once users have identified the weather station they want to investigate (by entering the
numeric site code or clicking on the green triangle), the website zooms to the site location and
displays an aerial view of the site (Figure 2-2). The aerial view contains site information (site
code, latitude, longitude, and elevation) and the most recent hour’s weather information. Users
can compare the observations for temperature, relative humidity, wind speed, and wind direction
with the forecasts from the National Digital Forecast Database (NDFD), the North American
Mesoscale Model (NAM), the Global Forecasting System (GFS), and the Weather Research
and Forecasting model (WRF). NDFD, NAM, and GFS provide forecasts for the entire western
United States, and WRF forecasts are restricted to the Pacific Northwest states. The system
shows the weather parameter forecasts that are closest to the hourly observations, as these
forecasts are produced every three to six hours. Observation time and forecast time can be
determined by rolling the mouse over the observation or forecast (blue text, Figure 2-3).

Fire Weather System User Guide Overview
2-3
Figure 2-2. Zoomed-in aerial view of a selected weather station.
Figure 2-3. View of the rollover functionality to show the hour when the observed weather data were gathered. In this example, the mouse was rolled over the temperature, which indicated the observation was collected at 0800 LT on September 6, 2015.

Fire Weather System User Guide Overview
2-4
On the Site Info page, users can also determine how accurate forecasts were over the
past seven days. The Fire Weather System produces graphs of temperature, relative humidity,
wind speed, and wind direction observations collected at 1300 local time (LT) on a daily basis.
The 1300 LT observations are compared with the nearest forecast from each of the four
forecasted systems (Figure 2-4). The 1300 LT measurements are used for the seven-day
comparisons because the National Fire Danger Rating System (NFDRS) uses the 1300 LT (or
in some cases, 1400 LT) observations to calculate fire danger rating indices. The comparison
graph allows users to view the observations (green columns); the current day observation (red
column2); and the forecasted values for the past seven days (dark gray line), the current date,
and the next three to seven days (light gray line), depending on the model being compared.
(The GFS modeling system provides forecasts for seven days while the NDFD, NAM, and WRF
provide forecasts for three days.) The fire weather assessment forecast adjustment, based on
model bias over the past seven days, is represented by the blue line. By adjusting the raw
model forecast output, the bias correction provides more confidence in model forecast output.
Figure 2-4. Example showing a graphical assessment of air temperature observations versus GFS forecasts.
On the Time Series Graph page (Figure 2-5), users can assess forecast observations
diurnally over the past seven days (blue line). Users can compare forecasts for each of the four
forecasting systems (NDFD, NAM, GFS, WRF; Figure 2-6), either separately or all at once.
Users select a weather parameter and date (default data are based on the current day). The
system displays all weather station observations available in the system for a 15-day window
(seven days prior to current date, current date, and seven days after current date). The Time
Series Graph page allows the user to visually investigate model accuracy for any time frame for
which data exists, from the time the database was started in 2011 to the current date.
2 For the current day, a single red column is shown if the local time is 1300 LT or later; the red column does not
appear until the 1300 LT observation has been collected.

Fire Weather System User Guide Overview
2-5
Figure 2-5. The Time Series Graph page allows users to graphically view all weather station observations (temperature shown here) collected in the Fire Weather System since 2011.
Figure 2-6. Observed weather data (temperature shown here, blue line) compared diurnally with model forecast data. Also shown are the temperature forecasts for the GFS (black line), the NDFD (red line), and the NAM (green line).

Fire Weather System User Guide Overview
2-6
2.2 Digital Map Displays
The second section of the Fire Weather System is a Data Map display (Figure 2-7,
http://w356:8080/FireWeatherWeb/map), which shows digital maps for the forecasting systems,
the calculated NFDRS and Canadian Forest Fire Danger Rating System (CFFDRS), the three
fuel loading maps, and the forecasted lightning probability maps. The forecasted weather
parameters are displayed at increasingly finer spatial resolution. Map resolutions are as follows:
GFS is displayed at roughly 55 km, NAM at 12 km, and WRF at 4 km. NDFD is displayed at
2.5 km resolution for dates since August 19, 2014, or at 5 km resolution for earlier dates. The
forecasted fire danger rating indices are displayed at the resolution of the meteorological
models used to calculate the indices (GFS, NAM, WRF). Each fuel loading map (NFDRS,
FCCS, FB403) is shown at 1 km resolution, with the lightning and ignition probability maps
displayed at 2.5 km resolution.
Figure 2-7. The Data Map page, which shows digital maps of weather forecasts, fire danger indices, fuel loading, and lightning and ignition probability.
3 Standard 40 fire behavior fuel models.

Fire Weather System User Guide Overview
2-7
On the Data Map page, users can view the digital maps at multiple scales. Using the
Fire Weather System’s mapping tools, users can zoom and pan to the area of interest to view
finer-scaled details, such as the calculated ignition probability, for their local area. Users can
select which base layer they wish to use and then zoom in to get more information about a
specific location (Figure 2-8). In this example, the user has zoomed to a specific location in
Marin County, California, using the street map base layer. Figure 2-9 shows the same area
overlain with the forecasted temperature information for 12:00 p.m. on Tuesday, September 9,
2015.
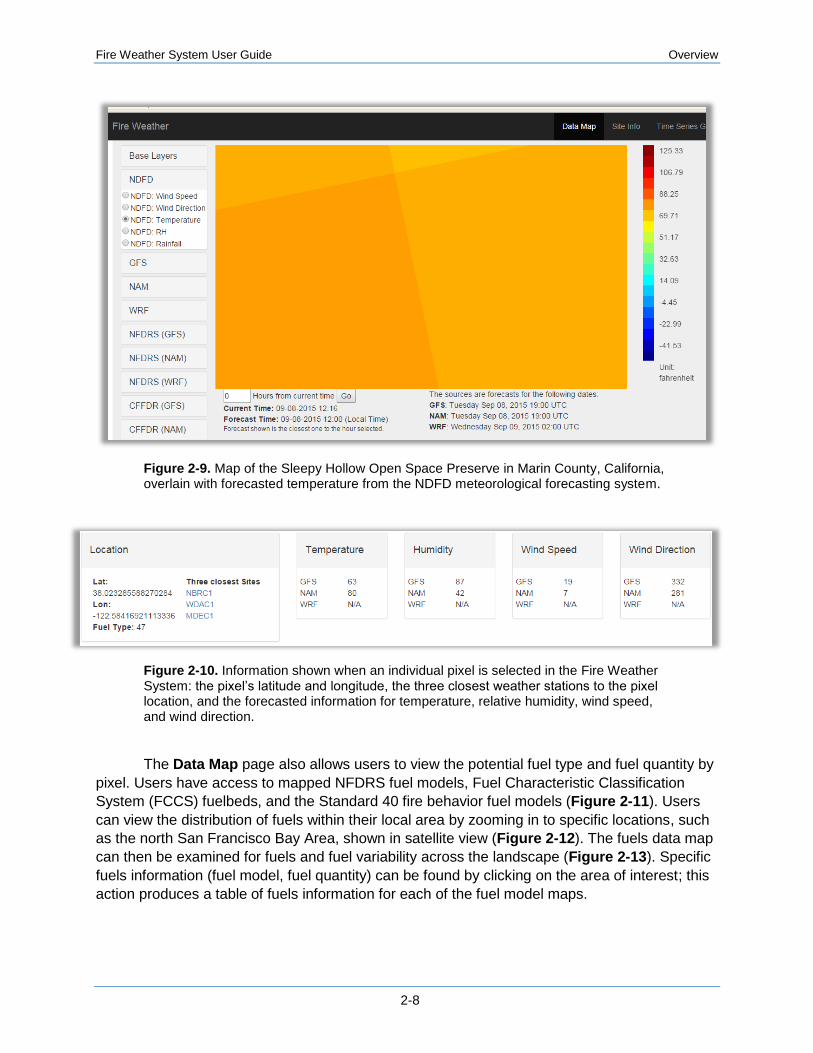
With these maps, users can view temperature variation across the landscapes, for
example. The legend in Figure 2-9 indicates forecasted temperatures between 70° and 85°F.
Specific weather information for an individual pixel can be determined by clicking the pixel. Site
information for the three closest weather stations is provided, as well as forecasted information
from each of the weather parameter forecasting systems (see Figure 2-10). The user can then
use the functionality on the Site Info and Time Series Graph pages (described in Section 2.1)
to investigate the weather models’ performance at the weather stations.
Figure 2-8. Street map zoomed in to show finer-scale details of Sleepy Hollow Open Space Preserve in Marin County, California.
Fire Weather System User Guide Overview
2-8
Figure 2-9. Map of the Sleepy Hollow Open Space Preserve in Marin County, California, overlain with forecasted temperature from the NDFD meteorological forecasting system.
Figure 2-10. Information shown when an individual pixel is selected in the Fire Weather System: the pixel’s latitude and longitude, the three closest weather stations to the pixel location, and the forecasted information for temperature, relative humidity, wind speed, and wind direction.
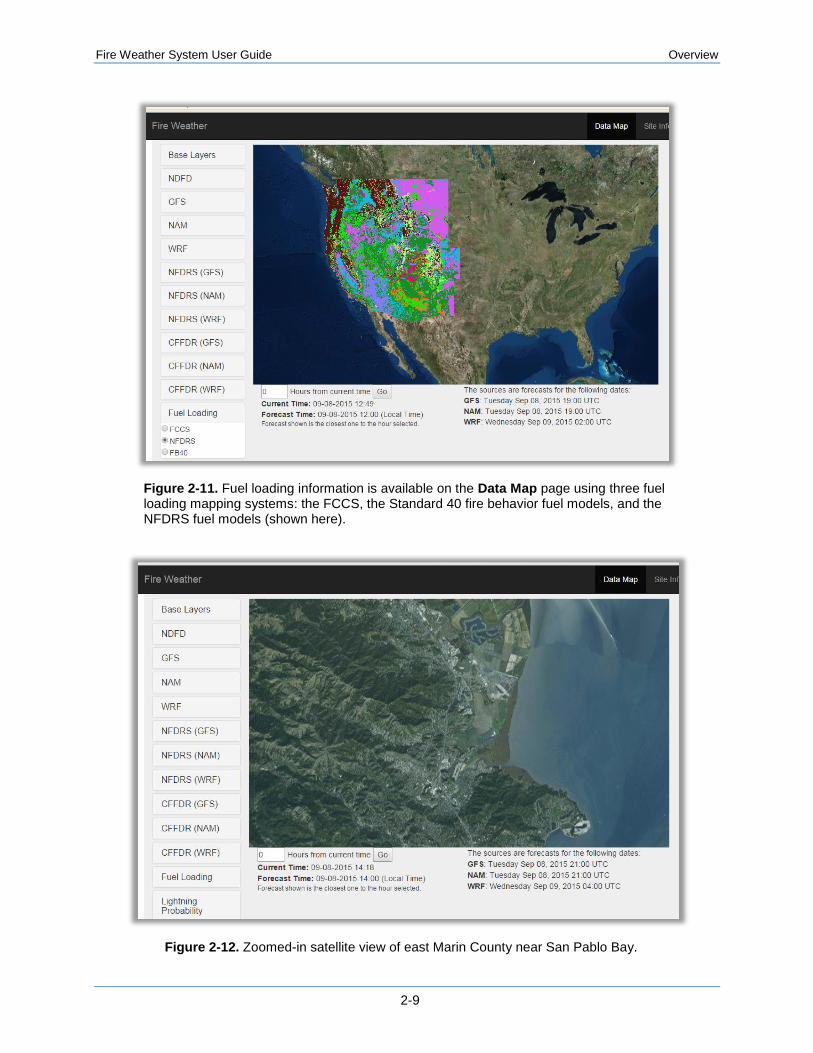
The Data Map page also allows users to view the potential fuel type and fuel quantity by
pixel. Users have access to mapped NFDRS fuel models, Fuel Characteristic Classification
System (FCCS) fuelbeds, and the Standard 40 fire behavior fuel models (Figure 2-11). Users
can view the distribution of fuels within their local area by zooming in to specific locations, such
as the north San Francisco Bay Area, shown in satellite view (Figure 2-12). The fuels data map
can then be examined for fuels and fuel variability across the landscape (Figure 2-13). Specific
fuels information (fuel model, fuel quantity) can be found by clicking on the area of interest; this
action produces a table of fuels information for each of the fuel model maps.
Fire Weather System User Guide Overview
2-9
Figure 2-11. Fuel loading information is available on the Data Map page using three fuel loading mapping systems: the FCCS, the Standard 40 fire behavior fuel models, and the NFDRS fuel models (shown here).
Figure 2-12. Zoomed-in satellite view of east Marin County near San Pablo Bay.

Fire Weather System User Guide Overview
2-10
Figure 2-13. NFDRS fuel models mapped to 30 meter pixels for the area of interest shown in Figure 2-12. Each color represents a different type of vegetation that is characterized by an NFDRS fuel model.
When the blue pixelated area in the lower central portion of Figure 2-13 is selected,
three data tables with mapped fuels information are produced. Figure 2-14 shows the fuel
model information for the NFDRS. NFDRS fuel model information is usually linked with fuel
moisture and fire danger rating indices to indicate the likelihood of a fire starting and then
moving across the landscape. NFDRS Fuel Model 2 (or Fuel Model B) indicates that the fuels in
this area are very dense brush fuels.
Figure 2-14. Fuel loading information in the NFDRS fuel model layer for the blue area in Figure 2-13.
Figure 2-15 shows the FCCS fuel bed information that the Fire Weather System
provides for the same location shown in Figures 2-13 and 2-14 (NFDRS Fuel Model 2). The
FCCS also indicates that the area is covered by shrub or brush fuels, but it provides more
specific information. The FCCS fuel bed information indicates that the fuel type is likely Chamise
or dense Chaparral fuels, with high fuel loading in the standing shrub layer and the highly

Fire Weather System User Guide Overview
2-11
ignitable 1-, 10-, and 100-hour fuels strata. FCCS fuel bed information is commonly used with
the fire effects fuel models Consume and FOFEM to estimate potential fuel consumption and
subsequent smoke emissions.
Figure 2-15. FCCS fuel bed information for FCCS fuel bed #46. FCCS fuel bed information correlates with the NFDRS fuel model but provides more specific information as to vegetation type and shows more fuels information.
Figure 2-16 shows the information for the Standard 40 fuel models (Scott and Burgan,
2005) provided by the Fire Weather System for the same example. This information can be
used to provide input into the Behave family of fire behavior modeling tools (BehavePlus,
FlamMap, Farsite, FSimm, FSPro, Randig, Interagency Fuels Treatment Decision Support
System [IFTDSS]). An interesting distinction here, and one of the uses of the Fire Weather
System mapping, is that the fire behavior fuel models indicate that this area is non-burnable
because it is mapped as agricultural land. Fire weather system users can use the satellite
imagery to decide if they should view this area as non-burnable or model fire behavior in this
area using shrub models from the Standard 40 fire behavior fuel models.
Figure 2-16. Fuel loading information for the Standard 40 fuel models (Scott and Burgan 2005).

Fire Weather System User Guide Overview
2-12
The Data Map page also includes calculated fuel moisture and fire danger rating indices
from the NFDRS and the CFFDRS (Figure 2-17); one of these indices is the energy release
component (ERC). Calculated in this example using the NAM weather forecasts, ERC values
provide a measure of fuel moisture and the availability of fuels to burn throughout the fuel
complex. Higher ERC indices indicate that more fuel is available to burn. Users can view
calculated moistures and indices for the GFS, NAM, and WRF modeling systems. Forecasted
for three to seven days, these fuel moisture estimates and fire danger rating indices can provide
useful information as to the current and future state of the fuels or serve as the backbone for
estimating ignition probability.
Figure 2-17. Digital map of NFDRS energy release component (ERC).
Lightning and ignition probability maps are a key component of the Fire Weather
System. The Fire Weather System contains
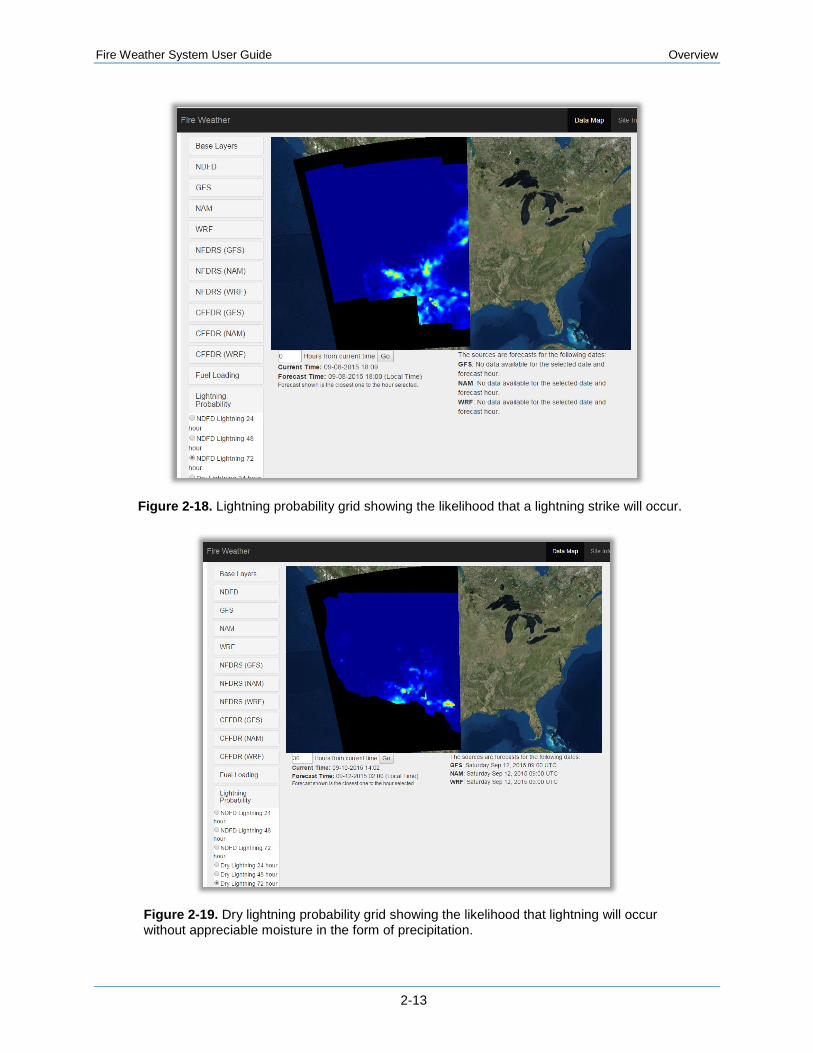
Lightning probability grid – estimates the likelihood that a lightning strike will occur
(Figure 2-18)
Dry lightning probability grid – shows the likelihood that a lightning strike will occur
and the likelihood that lightning will not be accompanied by precipitation (Figure 2-19)
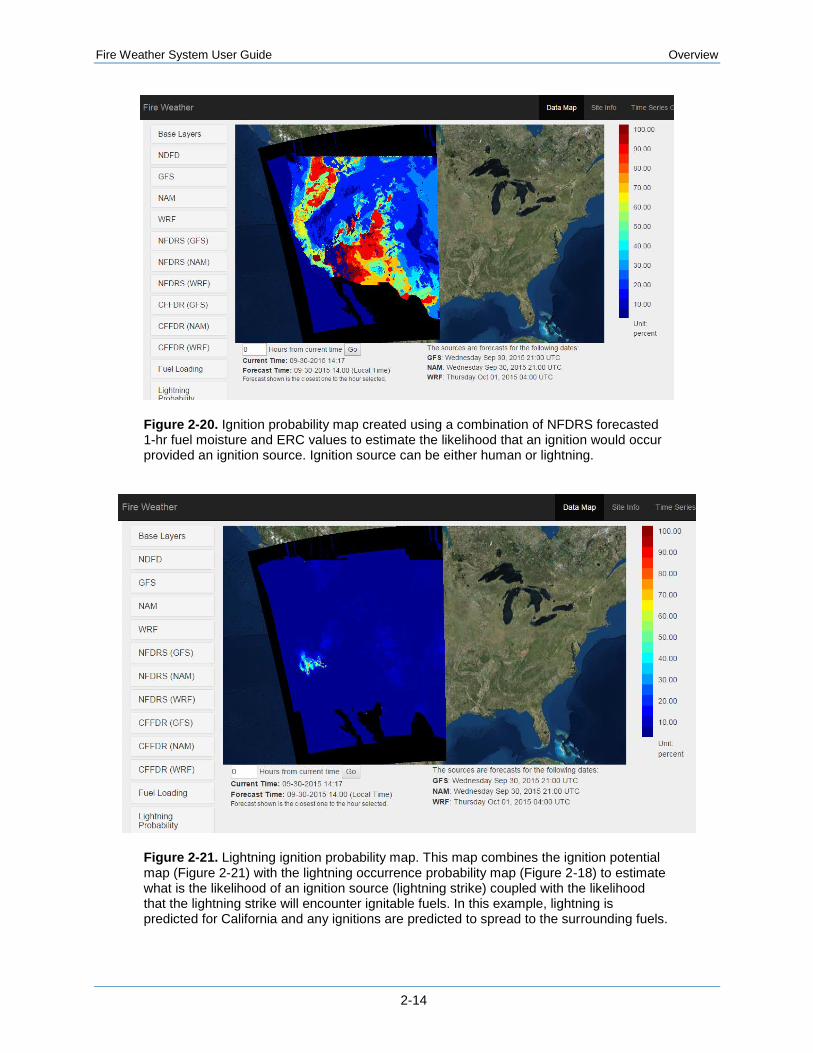
Ignition probability map – shows the likelihood that an ignition may occur given an
ignition source from humans or lightning (Figure 2-20)
Lightning ignition probability map – shows the likelihood that a lightning strike will
encounter ignitable fuels (Figure 2-21)
Dry lightning ignition probability map – shows the likelihood that a dry lightning strike
will encounter ignitable fuels (Figure 2-22)
Fire Weather System User Guide Overview
2-13
Figure 2-18. Lightning probability grid showing the likelihood that a lightning strike will occur.
Figure 2-19. Dry lightning probability grid showing the likelihood that lightning will occur without appreciable moisture in the form of precipitation.
Fire Weather System User Guide Overview
2-14
Figure 2-20. Ignition probability map created using a combination of NFDRS forecasted 1-hr fuel moisture and ERC values to estimate the likelihood that an ignition would occur provided an ignition source. Ignition source can be either human or lightning.
Figure 2-21. Lightning ignition probability map. This map combines the ignition potential map (Figure 2-21) with the lightning occurrence probability map (Figure 2-18) to estimate what is the likelihood of an ignition source (lightning strike) coupled with the likelihood that the lightning strike will encounter ignitable fuels. In this example, lightning is predicted for California and any ignitions are predicted to spread to the surrounding fuels.

Fire Weather System User Guide Overview
2-15
Figure 2-22. Dry lightning ignition map. This map builds on the lighting ignition map by coupling the likelihood that an lightning strike will occur, with the likelihood that more than 0.1 inches of rainfall will occur, with the likelihood that the lightning strike will encounter burnable fuels. Note for California, rainfall is not predicted to accompany the lightning that was predicted in Figure 2-21 and the lightning ignition potential does not change.


Fire Weather System User Guide Site Info Page
3-1
3. Navigating the Site Info Page
The Site Info page enables Fire Weather System users to track current weather and
forecasted weather patterns and to assess fire weather forecasts to provide confidence level
information in fire weather forecasts. These data help users make more informed decisions
about which forecasting system provides the most accurate forecasts for the local area for land
and fire management activities.
The opening view of the Site Info page (http://w356:8080/FireWeatherWeb/siteInfo/),
shows the range of weather stations available within the system (Figure 3-1). Weather station
observational data are available in near-real time from all RAWS and ASOS stations maintained
in MADIS, which is run by the National Weather Service (NWS). The Fire Weather System
contains all current and historic weather stations maintained by MADIS in their database in the
continental United States west of 100° W longitude.
Figure 3-1. Opening view on the Site Info page. Green triangles represent individual weather stations.
Users can select the satellite view shown in Figure 3-1 or can select a different view
using the white cross in the upper right hand side of the map view (Figure 3-2). Clicking on the
white cross causes it to expand and link to the three map viewers in the Fire Weather System:
Imagery (satellite view), Topo Map, and Street Map. To collapse the base map options, click
on the white dash (blue circle). Base map imagery is produced by ESRI and is periodically
updated to provide the most current satellite and map data available.
Fire Weather System User Guide Site Info Page
3-2
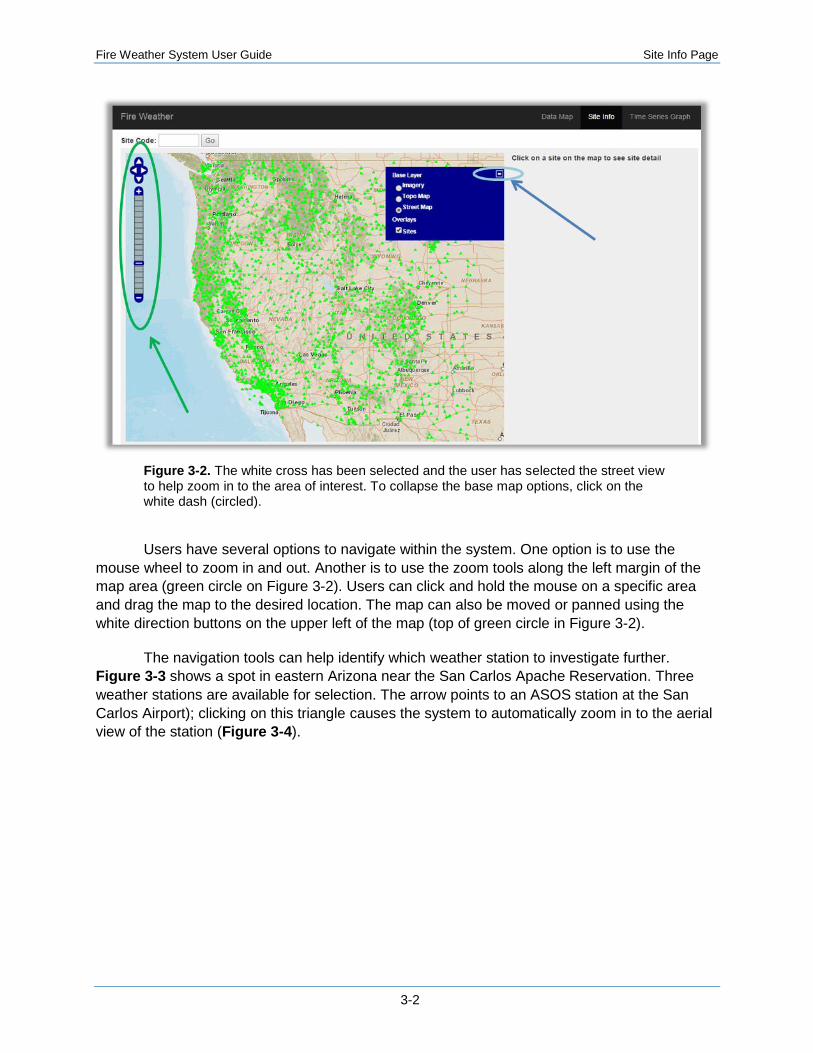
Figure 3-2. The white cross has been selected and the user has selected the street view to help zoom in to the area of interest. To collapse the base map options, click on the white dash (circled).
Users have several options to navigate within the system. One option is to use the
mouse wheel to zoom in and out. Another is to use the zoom tools along the left margin of the
map area (green circle on Figure 3-2). Users can click and hold the mouse on a specific area
and drag the map to the desired location. The map can also be moved or panned using the
white direction buttons on the upper left of the map (top of green circle in Figure 3-2).
The navigation tools can help identify which weather station to investigate further.
Figure 3-3 shows a spot in eastern Arizona near the San Carlos Apache Reservation. Three
weather stations are available for selection. The arrow points to an ASOS station at the San
Carlos Airport); clicking on this triangle causes the system to automatically zoom in to the aerial
view of the station (Figure 3-4).

Fire Weather System User Guide Site Info Page
3-3
Figure 3-3. Satellite imagery view of area near the San Carlos Apache Reservation. Three weather stations are available for selection.
Figure 3-4. Information for San Carlos Airport ASOS station, MADIS ID QSCA3.
Fire Weather System User Guide Site Info Page
3-4
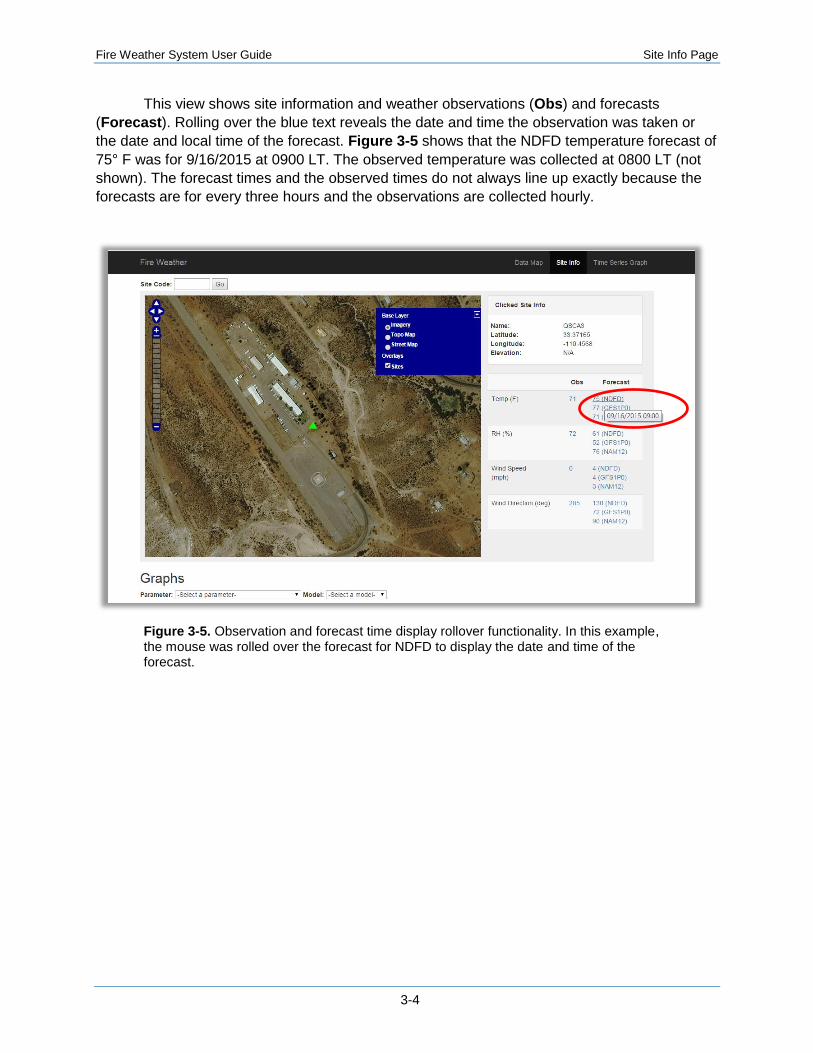
This view shows site information and weather observations (Obs) and forecasts
(Forecast). Rolling over the blue text reveals the date and time the observation was taken or
the date and local time of the forecast. Figure 3-5 shows that the NDFD temperature forecast of
75° F was for 9/16/2015 at 0900 LT. The observed temperature was collected at 0800 LT (not
shown). The forecast times and the observed times do not always line up exactly because the
forecasts are for every three hours and the observations are collected hourly.
Figure 3-5. Observation and forecast time display rollover functionality. In this example, the mouse was rolled over the forecast for NDFD to display the date and time of the forecast.

Fire Weather System User Guide Site Info Page
3-5
Users can use the Graphs functionality to evaluate forecast accuracy and produce bias
correction factors. Users select a weather parameter in the Select a parameter dropdown
(Figure 3-6).
Figure 3-6. Dropdown selection for selecting a weather parameter to use in forecast versus observation comparisons.

Fire Weather System User Guide Site Info Page
3-6
In Figure 3-7, the user has selected relative humidity as the weather parameter and the
GFS model as the forecast system to compare with direct observations. Users can identify how
well the forecasting system has been tracking observations over the past seven days and view
potential adjustments to the forecast outputs to provide a more accurate forecast. In this
example, green bars show 1300 LT relative humidity observations over the past seven days at
the San Carlos Airport. The red bar shows relative humidity for the current date. The dark gray
line shows the GFS forecast for the past seven days. The light gray line shows the GFS forecast
for the next seven days. The blue line show the bias-corrected forecast for the current date and
the next seven days. In this example, the relative humidity forecast had been fairly accurate
over the past seven days, only requiring a slight downward (drier conditions) adjustment in the
forecast.
By clicking on the small cross at the lower left of the Graphs output, users can add
multiple graphs to investigate the same weather parameter across all model choices or
investigate how each model is tracking all the weather parameters.
Figure 3-7. Comparison graph identifying model accuracy and forecast corrections using a bias estimate.

Fire Weather System User Guide Time Series Graph Page
4-1
4. Navigating the Time Series Graph Page
On the Time Series Graph page (http://w356:8080/FireWeatherWeb/timeSeriesGraph),
users can compare observations with model forecasts diurnally over a 15-day range. If the
current day is chosen (Figure 4-1), users can visually compare modeled forecast weather
parameter data for temperature, relative humidity, wind speed, and wind direction with direct
observations across the range of RAWS and ASOS weather stations, as described in Section 3.
The initial view displays the weather observations for a specific site (blue lines) and the forecast
output for each weather forecasting system for that site. This example shows the RSAC1 RAWS
station in Santa Rosa, California, and the modeled forecast outputs for temperature using the
GFS, NAM, and NDFD forecasting systems.
Figure 4-1. Opening view of the Time Series Graph page showing temperature observations (blue) compared to model forecasts (NDFD in red, NAM in green, and GFS in black).

Fire Weather System User Guide Time Series Graph Page
4-2
In addition, users can compare observations with forecasts for any 15-day time period
for which data exist in the fire weather database (Figure 4-2). Users can view the observations
separately by turning off the model observations. The modeled forecast data and the weather
station observations can be turned off and on by clicking on the text to the right of the line
symbol (Figure 4-2).
Figure 4-2. Single line graph showing diurnal pattern of temperature at the Santa Rosa RAWS station RSAC1. Modeled forecast data and weather station observations can be viewed or hidden by clicking on the text to the right of the line symbol (circled area). In this view, the GFS, NAM, and NDFD temperature forecasts have been turned off to provide a clear view of the observations.

Fire Weather System User Guide Time Series Graph Page
4-3
Figure 4-3 shows a comparison of the GFS model with the observations at RSAC1.
Note that the model does not forecast temperature very well for this site. The large area for
which the model is forecasting (55 km pixel size) tends to diminish the effects of fine-scale
topographic and micro-climate variation. For this location, it is likely that the close proximity to
the Pacific Ocean is mitigating the highs and lows in the model forecast.
Figure 4-3. GFS modeled observations (black line) compared with weather station observations (blue line).
Figures 4-4 and 4-5 illustrate how the system can be used to select which model is
most likely to provide a more accurate forecast of the area represented by an individual RAWS
station. Figure 4-4 shows a comparison of the weather station observations with NAM model
forecasts, while Figure 4-5 compares the weather station observations with the NDFD model
forecasts. Note that the NDFD is a hybrid computer/human-assisted forecasting system in which
the model forecasts from the NAM model are manually adjusted according to local forecaster
knowledge of model performance.

Fire Weather System User Guide Time Series Graph Page
4-4
Figure 4-4. RSAC1 weather observations compared with the NAM air temperature forecasts.
Figure 4-5. RSAC1 weather observations compared directly with the NFDS temperature forecasts.

Fire Weather System User Guide Data Map Page
5-1
5. Navigating the Data Map Page
The Data Map page provides access to the full suite of mapped forecasted weather
data; NFDRS and CFFDRS fire danger rating indices; forecasted fuel moistures using the GFS,
NAM, and WRF weather forecasts; lightning occurrence probabilities; and ignition potential
probabilities (Figure 5-1). The tabs on the left side of the page give access to different map
views (forecasts, fuel loadings, lightning, and ignition probabilities). The current time and the
time the user selected to see a forecast are shown below the map, on the left. The actual time
of the forecast in UTC time is shown below the map, on the right.
Figure 5-1. Opening view of the Data Map page.
Users can view a forecast spatially for any hour in the future within the next three to
seven days (depending on the forecast model selected). The default forecast is for the forecast
nearest to the current hour. But if users want to know what the weather is likely to be tomorrow
at 8:00 a.m. when a prescribed burn is scheduled, for example, they can select that hour
(Figure 5-2). Figure 5-2 shows that on September 23, most of the western states temperatures
were forecasted to be between approximately 60° and 95°F at 8:00 a.m. However, this view
does not provide site-specific information. In this example, users are viewing the San Carlos
Apache Reservation (SCAR) and would like more specific information for that area. Zooming in
to specific areas in the SCAR (Figures 5-3 through 5-6) allows users to identify temperature
variability across the local area.

Fire Weather System User Guide Data Map Page
5-2
Figure 5-2. Surface air temperature forecasts (2 meter) from the NDFD for the western United States. User was reviewing weather forecasts at 10:30 LT on Tuesday, September 22, 2015. Hypothetically, the land manager was interested in viewing burn potentials for September 23 at 0800 LT to make a “go – no go” decision for prescribed burning.
Figure 5-3. Zoomed-in view of the San Carlos Apache Reservation Area. Base map is the street map.

Fire Weather System User Guide Data Map Page
5-3
Figure 5-4. Temperature forecast for the zoomed in area shown in Figure 5-3. NDFD temperature forecasts indicate 0800 LT temperature will be between 70° and 80°F across the San Carlos Reservation.
Figure 5-5. Area selected within the San Carlos Reservation to review the site-specific weather forecast.

Fire Weather System User Guide Data Map Page
5-4
Figure 5-6. Weather information for the three forecast systems that cover the San Carlos Apache Reservation. Also shown are the three closest RAWS stations to the area.
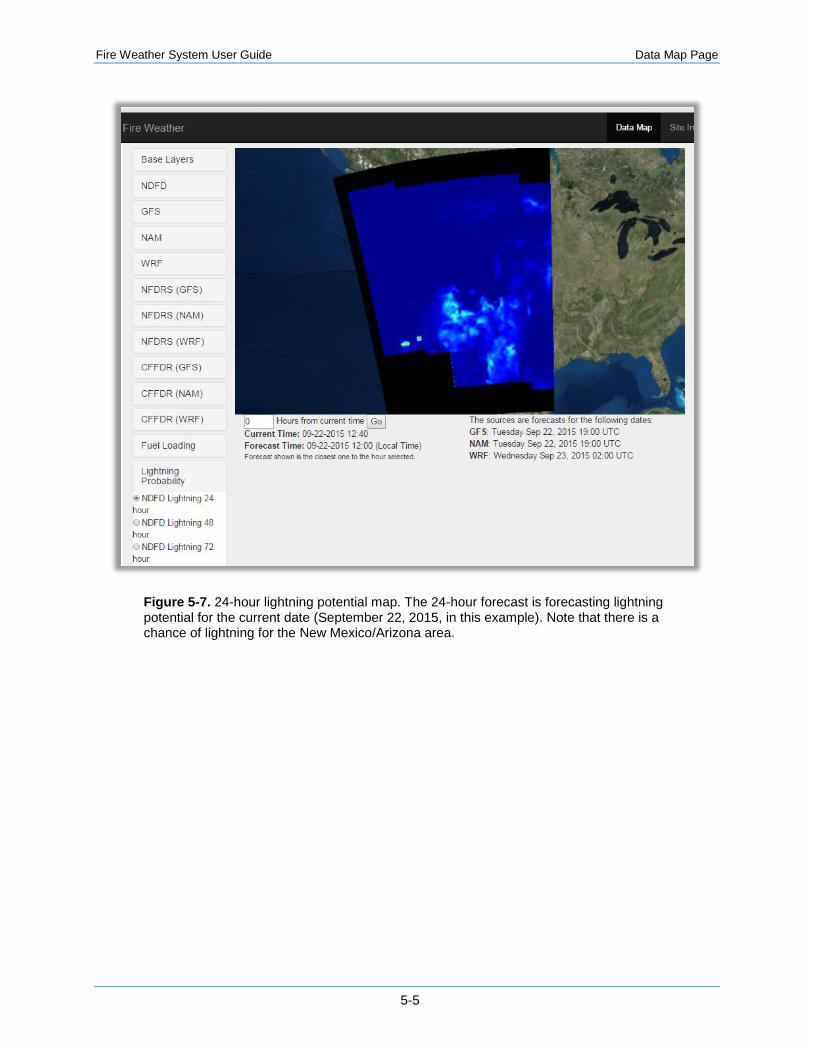
In another scenario, the Data Map page can provide information regarding the likelihood
of having lightning-caused ignitions. Users can view the likelihood of lightning within the local
area for 24-hour, 48-hour, and 72-hour forecasts. The 24-hour forecast is for the current day,
the 48-hour forecast is for current day plus 1, and the 72-hour forecast is for the current day
plus 2. The highest potential for an ignition due to lightning strike happens when lightning strikes
without appreciable rainfall, i.e., dry lightning. In the Fire Weather System, dry lightning is also
forecast in 24-hour, 48-hour, and 72-hour intervals following the lightning probability mapping.
Dry lightning is defined as lightning that occurs with less than 0.1 inches of rainfall. In the
following examples (Figures 5-7, 5-8, and 5-9), the user has identified a chance of lightning in
the New Mexico/Arizona area in the next 24 hours. For the 48-hour forecast, there is still
potential for lightning in Arizona and New Mexico, but the higher lightning potential has now
moved more northerly into Colorado, Wyoming, and the Dakotas. For the 72-hour forecast, the
potential for lightning in Arizona and New Mexico has diminished, but the lightning potential has
stayed relatively high for Colorado, Wyoming, and the Dakotas. Figures 5-10 through 5-12
show the dry lightning potentials for the same dates.
Fire Weather System User Guide Data Map Page
5-5
Figure 5-7. 24-hour lightning potential map. The 24-hour forecast is forecasting lightning potential for the current date (September 22, 2015, in this example). Note that there is a chance of lightning for the New Mexico/Arizona area.
Fire Weather System User Guide Data Map Page
5-6
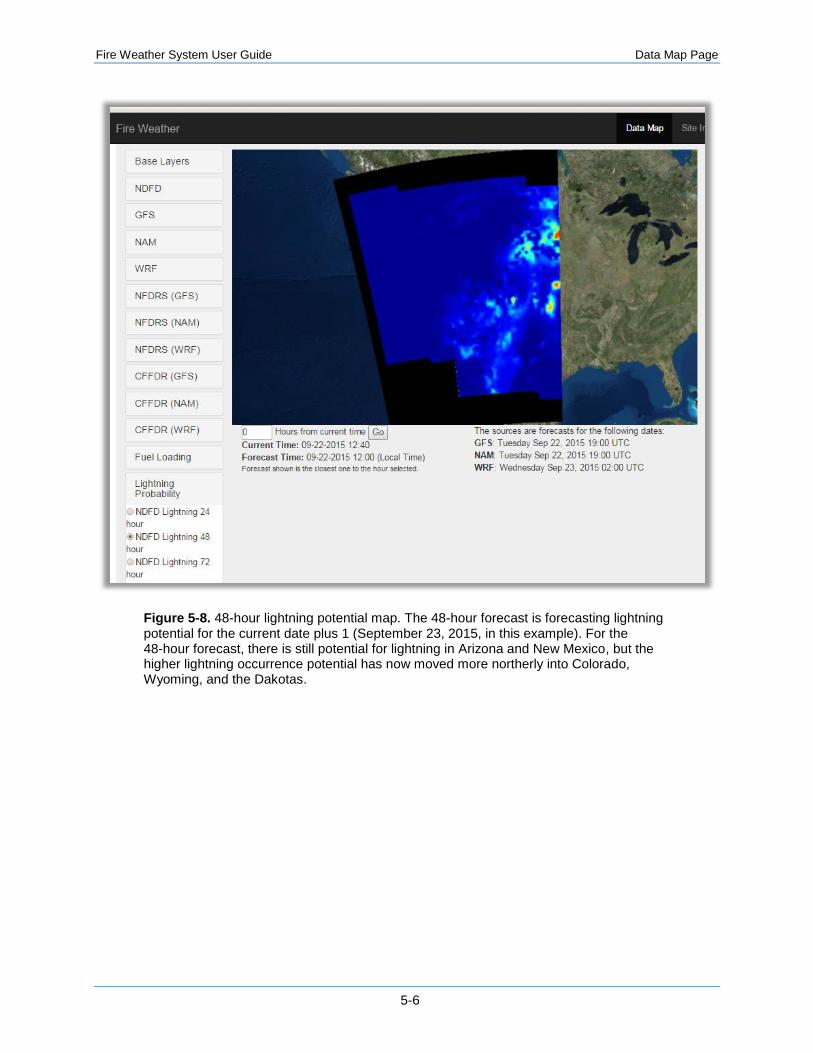
Figure 5-8. 48-hour lightning potential map. The 48-hour forecast is forecasting lightning potential for the current date plus 1 (September 23, 2015, in this example). For the 48-hour forecast, there is still potential for lightning in Arizona and New Mexico, but the higher lightning occurrence potential has now moved more northerly into Colorado, Wyoming, and the Dakotas.

Fire Weather System User Guide Data Map Page
5-7
Figure 5-9. 72-hour lightning potential map. The 72-hour forecast is forecasting lightning potential for the current date plus 2 (September 24, 2015, in this example). For the 72-hour forecast, the potential for lightning in Arizona and New Mexico has diminished but the lightning occurrence potential has stayed relatively high for Colorado, Wyoming, and the Dakotas.
Fire Weather System User Guide Data Map Page
5-8
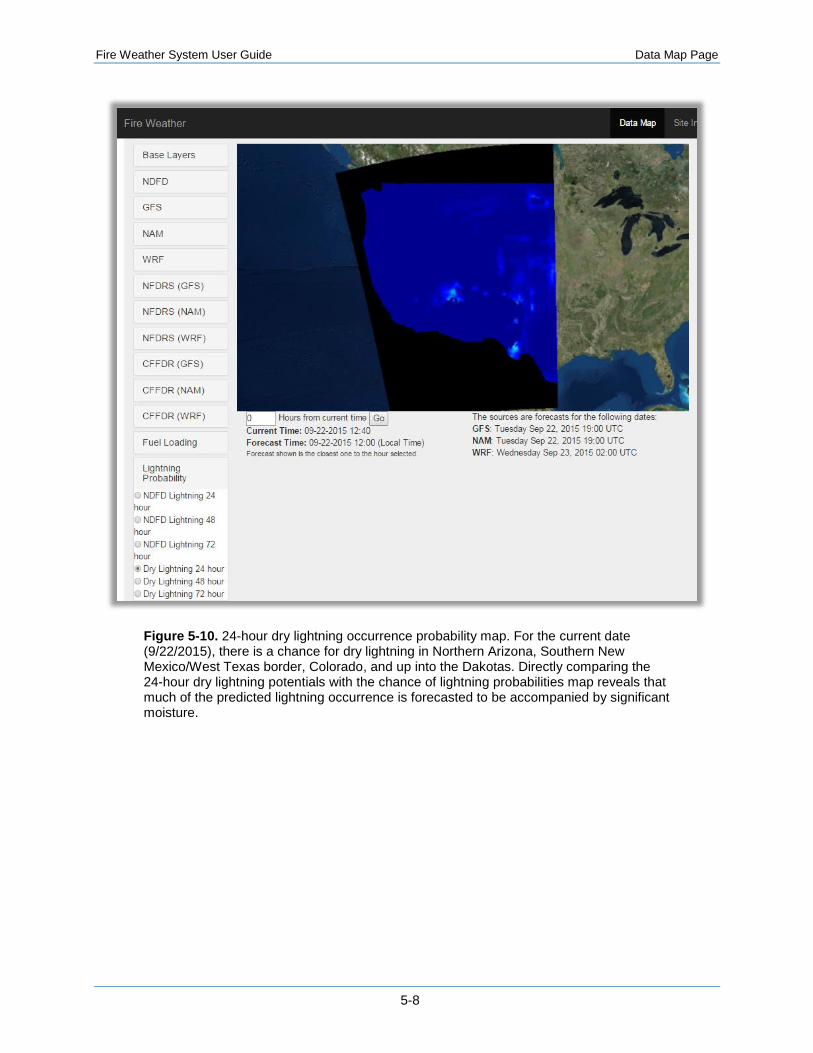
Figure 5-10. 24-hour dry lightning occurrence probability map. For the current date (9/22/2015), there is a chance for dry lightning in Northern Arizona, Southern New Mexico/West Texas border, Colorado, and up into the Dakotas. Directly comparing the 24-hour dry lightning potentials with the chance of lightning probabilities map reveals that much of the predicted lightning occurrence is forecasted to be accompanied by significant moisture.

Fire Weather System User Guide Data Map Page
5-9
Figure 5-11. 48-hour dry lightning occurrence probability map. For the current date plus 1 (9/23/2015), there is still a chance for dry lightning to occur in Arizona and New Mexico; following the lightning occurrence patterns seen in Figure 5-8, the chance for dry lightning is higher in Colorado and up into the Dakotas, particularly in the northern Rockies and east of the Colorado Front Range.
Fire Weather System User Guide Data Map Page
5-10
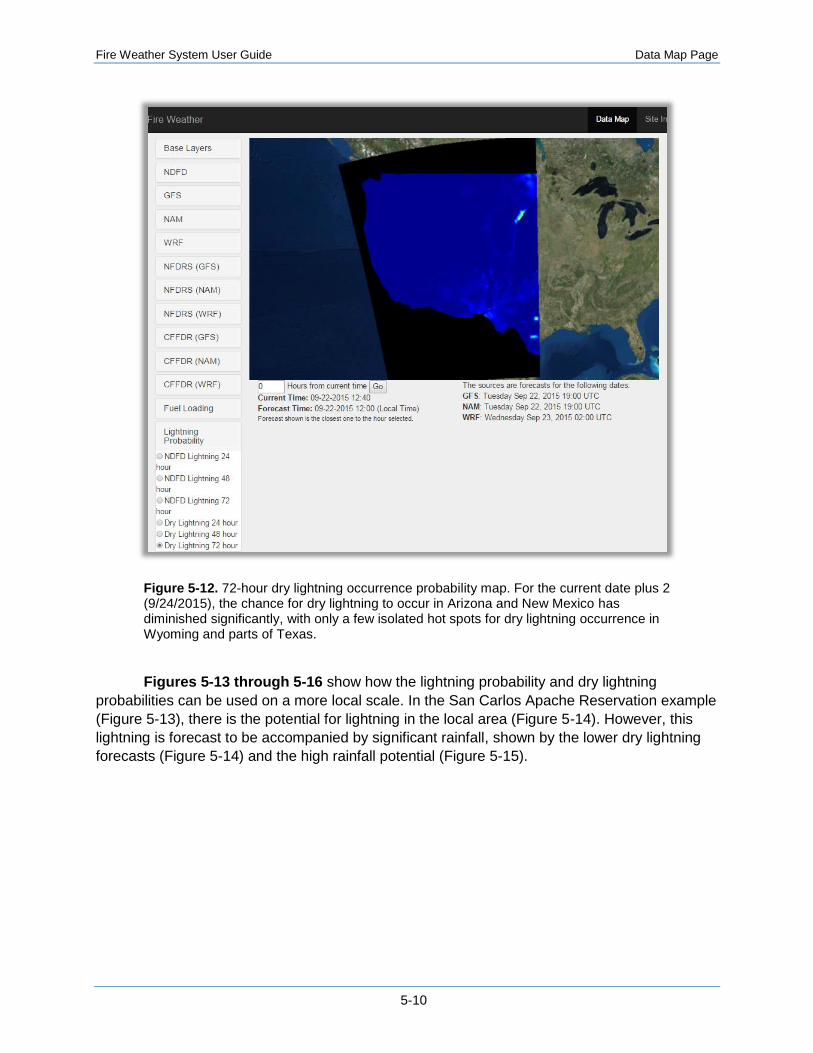
Figure 5-12. 72-hour dry lightning occurrence probability map. For the current date plus 2 (9/24/2015), the chance for dry lightning to occur in Arizona and New Mexico has diminished significantly, with only a few isolated hot spots for dry lightning occurrence in Wyoming and parts of Texas.
Figures 5-13 through 5-16 show how the lightning probability and dry lightning
probabilities can be used on a more local scale. In the San Carlos Apache Reservation example
(Figure 5-13), there is the potential for lightning in the local area (Figure 5-14). However, this
lightning is forecast to be accompanied by significant rainfall, shown by the lower dry lightning
forecasts (Figure 5-14) and the high rainfall potential (Figure 5-15).
Fire Weather System User Guide Data Map Page
5-11
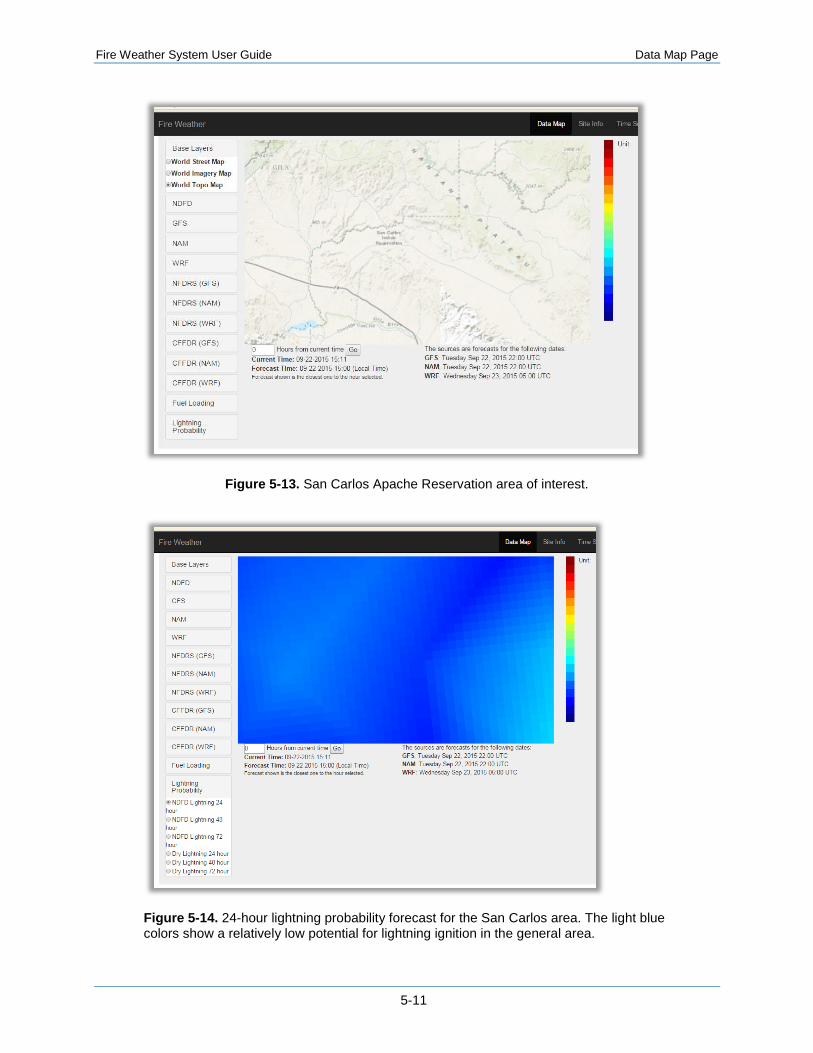
Figure 5-13. San Carlos Apache Reservation area of interest.
Figure 5-14. 24-hour lightning probability forecast for the San Carlos area. The light blue colors show a relatively low potential for lightning ignition in the general area.

Fire Weather System User Guide Data Map Page
5-12
Figure 5-15. 24-hour dry lightning probability forecast for the San Carlos area. The dark blue colors show a very low potential for dry lightning ignition to occur.
Figure 5-16. Forecasted rainfall for the San Carlos Apache Reservation on Tuesday, September 22, 2015, indicating a high likelihood of significant rainfall.

Fire Weather System User Guide Reference
6-1
6. Reference
Scott J.H. and Burgan R.E. (2005) Standard fire behavior fuel models: a comprehensive set for use with Rothermel’s surface fire spread model. General Technical Report by the USDA Forest Service, Rocky Mountain Research Station, Fort Collins, CO, RMRS-GTR-153, June. Available at http://www.fs.fed.us/rm/pubs/rmrs_gtr153.pdf.


