author is given attribution. Please send your corrections, comments and suggestions for improvement.
The First Casualty of a Non-Existent War Evaluating Claims of Unjustified Restrictions on Automobile Use, and
a Critique of “Washington’s War On Cars And The Suburbs”
11 March 2011
By Todd Litman Victoria Transport Policy Institute
Summary This report evaluates claims of a “war on cars,” that is, a coordinated effort to unjustifiably restrict automobile use. Objective analysis indicates that no such war exists. Evidence of a war consists of exaggerated objections to policies such as traffic calming (which increases traffic safety), busways and bike lanes (justified to improve transport options, which helps reduce traffic and parking congestion), and more efficient road and parking pricing (justified to reduce traffic and parking problems, and finance facilities). These policies benefit motorists as well as non-drivers. Truth is often the first victim of war. Policy reform opponents use inaccurate information to exaggerate the costs and underestimate the benefits of these changes, and create unnecessary conflict. An example, critiqued in detail in this report, is Wendell Cox’s Washington’s War on Cars and the Suburbs, published by the Heritage Foundation, which contains numerous inaccuracies and misrepresentations.
The First Casualty of a Non-Existent War Victoria Transport Policy Institute
2
"The first casualty when war comes is truth." - Hiram W. Johnson, Republican US Senator, 1917
Introduction Is there a “war on cars,” that is, a coordinated effort to unjustifiably restrict automobile use? Some critics (called auto advocates in this report) claim there is. They cite various policy reforms intended to encourage use of alternative modes. Critics claim these are coordinated and unfair attacks on motorists’ rights and freedoms. According to this narrative, motorists are victims entitled to defend themselves from a devious enemy. A common victim of war, real or perceived, is truth. Auto advocates tend to misrepresent key issues to make their case. Most of the policies that critics call “anti-car” are justified to help solve various transport problems. Motorists benefit too. Traffic calming and speed reductions increase traffic safety. Improving alternative modes (walking, cycling, public transit, telecommuting, etc.) can help reduce traffic problems, improve transport options for non-drivers, and reduce motorists’ chauffeuring burdens. More efficient pricing is often the most effective way to reduce congestion problems and the most equitable way to finance road and parking facilities. These are no more “anti-car” than a healthy diet is “anti-food.” There is plenty of room for legitimate debate. Different groups differ in their objectives and priorities so there are likely to be conflicts over specific transport policy and planning decisions. But claiming there is a war against cars changes the nature of this debate. It makes the issues ideological and absolute, and implies that motorists are justified in defending their interests however possible, including tactics that are destructive and harmful. Such rhetoric is wrong. Most people recognize that automobile travel provides significant benefits, but cannot meet everybody’s needs and imposes significant costs. They therefore support policy reforms that increase transport system diversity and efficiency, such as investments in alternative modes and more efficient pricing. Similar controversies erupted when public smoking regulations were first proposed. Critics argued that such restrictions are intrusive, unfair and harm the economy. But the freedom to smoke deprives other people of the freedom to breathe clean air. These regulations have proven effective, popular and beneficial. It turns out that many smokers want to stop or reduce their tobacco consumption but require support, so such regulations actually respond to consumer demands. These regulations have contributed to large reductions in smoking rates, illnesses and deaths, providing large financial savings and creating more pleasant public spaces. People can still smoke if they want in appropriate locations, but can no longer impose discomfort and harm on others. Now that people have experienced the results there is little support to change back. This issue affects me personally because my research has been caught in the crossfire. It was attacked, inaccurately I believe, by Wendell Cox of the Heritage Foundation, in his paper, Washington’s War on Cars and the Suburbs: Secretary LaHood’s False Claims on Roads and Transit, in his efforts to demonstrate that there is an unjustified war on cars. This report investigates these issues. It evaluates evidence of a war on cars, discusses the merits of the policy reforms criticized by auto advocates, and critiques Cox’s attack on my research. It begins by investigating major trends that may justify policies that increase transport system diversity.
The First Casualty of a Non-Existent War Victoria Transport Policy Institute
3
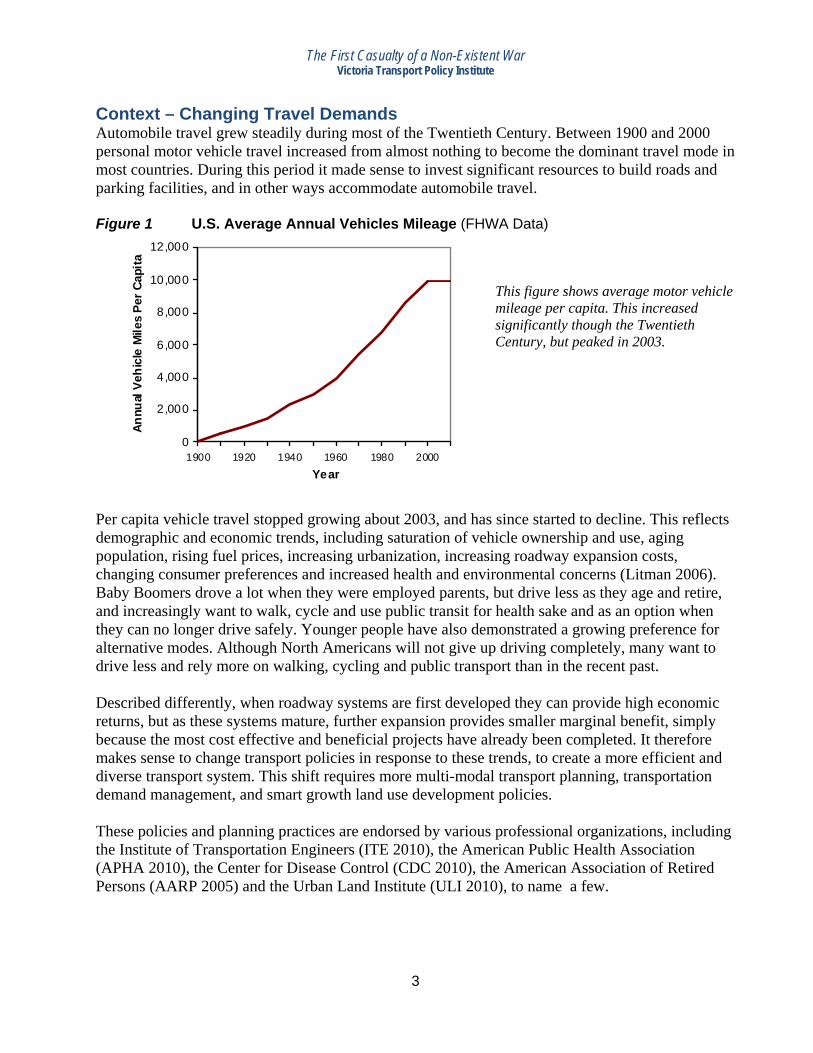
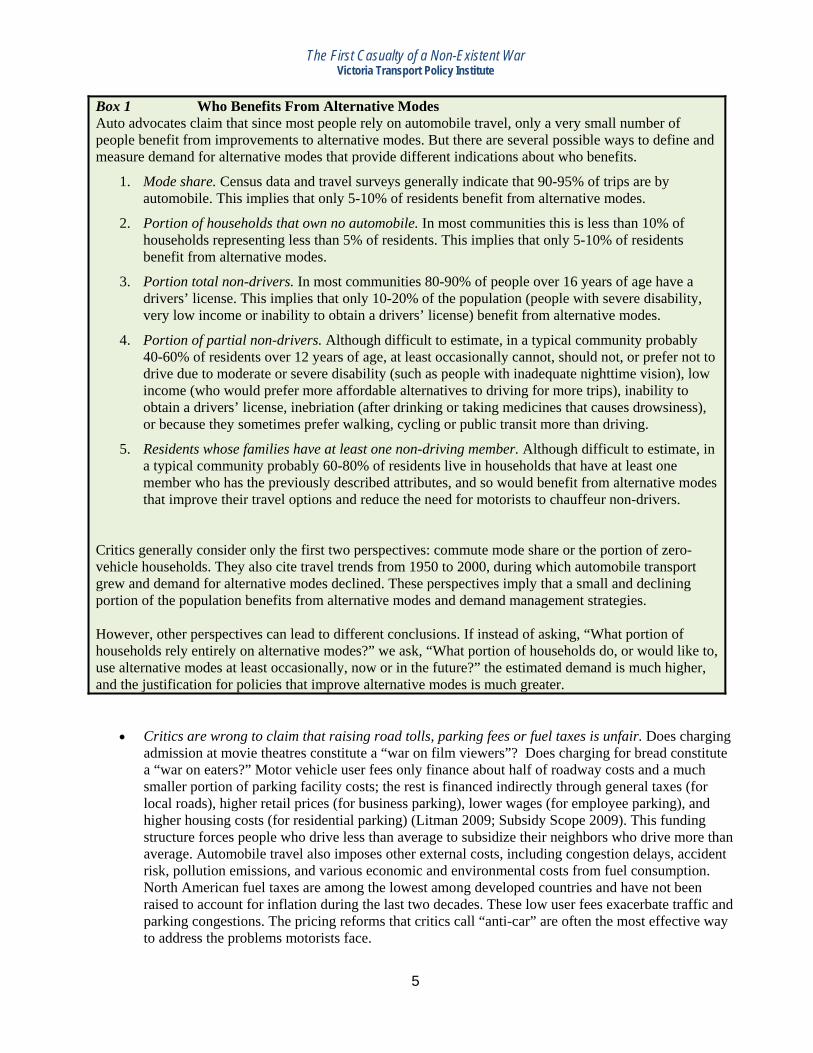
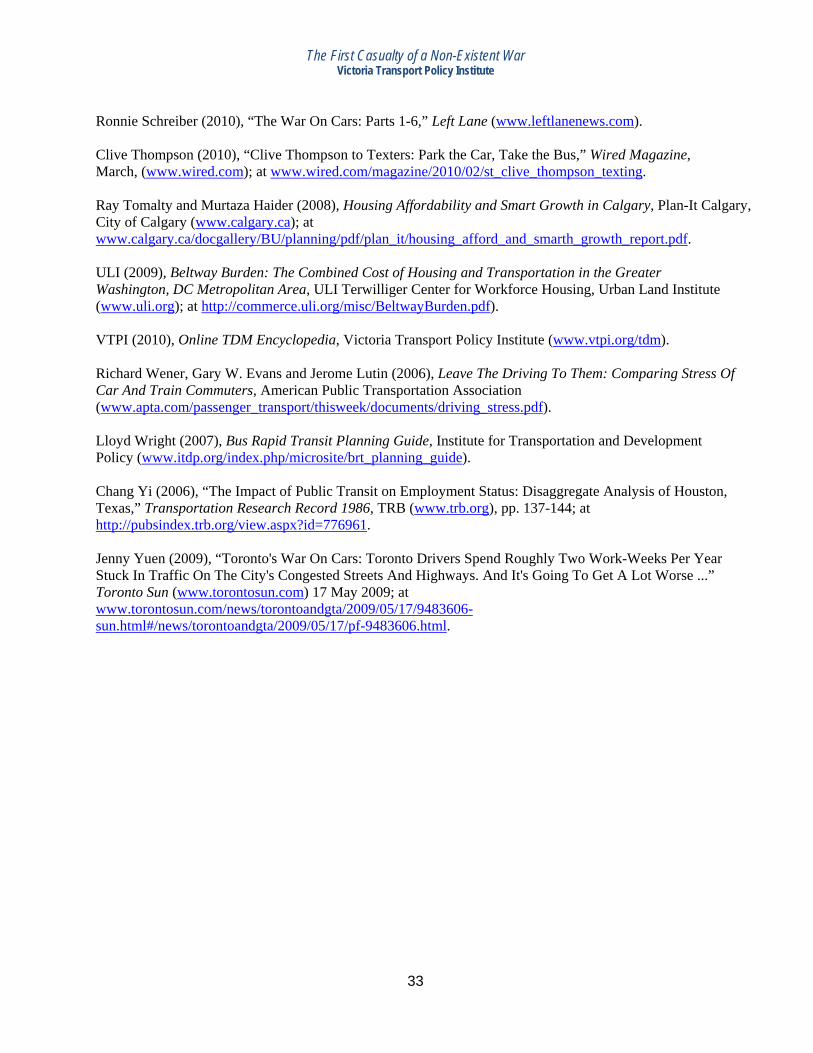
Context – Changing Travel Demands Automobile travel grew steadily during most of the Twentieth Century. Between 1900 and 2000 personal motor vehicle travel increased from almost nothing to become the dominant travel mode in most countries. During this period it made sense to invest significant resources to build roads and parking facilities, and in other ways accommodate automobile travel. Figure 1 U.S. Average Annual Vehicles Mileage (FHWA Data)
0
2,000
4,000
6,000
8,000
10,000
12,000
1900 1920 1940 1960 1980 2000Year
Annu
al V
ehic
le M
iles
Per C
apita
This figure shows average motor vehicle mileage per capita. This increased significantly though the Twentieth Century, but peaked in 2003.
Per capita vehicle travel stopped growing about 2003, and has since started to decline. This reflects demographic and economic trends, including saturation of vehicle ownership and use, aging population, rising fuel prices, increasing urbanization, increasing roadway expansion costs, changing consumer preferences and increased health and environmental concerns (Litman 2006). Baby Boomers drove a lot when they were employed parents, but drive less as they age and retire, and increasingly want to walk, cycle and use public transit for health sake and as an option when they can no longer drive safely. Younger people have also demonstrated a growing preference for alternative modes. Although North Americans will not give up driving completely, many want to drive less and rely more on walking, cycling and public transport than in the recent past. Described differently, when roadway systems are first developed they can provide high economic returns, but as these systems mature, further expansion provides smaller marginal benefit, simply because the most cost effective and beneficial projects have already been completed. It therefore makes sense to change transport policies in response to these trends, to create a more efficient and diverse transport system. This shift requires more multi-modal transport planning, transportation demand management, and smart growth land use development policies. These policies and planning practices are endorsed by various professional organizations, including the Institute of Transportation Engineers (ITE 2010), the American Public Health Association (APHA 2010), the Center for Disease Control (CDC 2010), the American Association of Retired Persons (AARP 2005) and the Urban Land Institute (ULI 2010), to name a few.
The First Casualty of a Non-Existent War Victoria Transport Policy Institute
4
Evidence of a War On Cars People who claim that a war exists cite the following evidence (De Place 2011; Schreiber 2010):
• In 2009, US Transportation Secretary Ray LaHood said that increased investment in alternative modes “is a way to coerce people out of their cars.” (Newspaper 2010)
• Some road user fees revenues are spent on facilities for alternative modes, including walking, cycling and public transit.
• Traffic calming, road diets and streetscaping projects reduce automobile traffic speeds and shift space to alternative modes (sidewalks, bike and bus lanes) on some roads.
• Some jurisdictions are considering, and a few are implementing, new road tolls, parking fees, fuel tax increases and other vehicle fees.
• A Toronto newspaper article cited the following policies as evidence of a war on cars (Yuen 2009): o Transit expansion o Bike lanes o High Occupancy Vehicle (HOV) lanes o Speed bumps o Prohibitions on left or right turns o Right-of-Way transit lights o Congestion
o Highway tolls o TTC charging for parking in their lots o Pedestrian Sundays and Car Free days o Lack of parking o Tearing down the Gardiner Expressway o The city’s Personal Vehicle Tax o Provincial Cash For Cars
Do these really indicate unjustified constraints on automobile use? Not at all.
• Critics are wrong to assume that “coercing people out of their cars” is a threat to motorists. It is simply a blunt description of transportation demand management (TDM, also called mobility management or transport systems operations) which refers to strategies that encourage people to change their travel behavior to increase transport system efficiency (FHWA 2008; VTPI 2010).
• Critics are wrong in assuming that such policies necessarily harm motorists. Some benefit motorists directly (such as Cash For Cars, which helps owners sell otherwise worthless vehicles), or indirectly (such as more efficient road and parking pricing, which reduce traffic congestion, parking problems and accident risk, and avoids the need to raise other taxes or fees to finance roads and parking facilities). Traffic calming can significantly reduce accident risk, and in many circumstances (such as modern roundabouts and four- to two-lane conversions with center turn lanes) it smoothes traffic flow so average speeds stay constant or even increase.
• Critics underestimate demand for alternative modes. Critics assume that consumers always prefer automobile travel over other modes, and so underestimate demand for walking, cycling and public transit. They ignore latent demand for alternative modes, and therefore the direct consumer benefits that would result from improvements. Critics overlook the many important roles that alternative modes can play in an efficient transport system, including basic mobility for non-drivers, consumer cost savings, recreation and exercise.
• Critics exaggerate the threat that bike and bus lanes represent to motorists. These lanes use a small portion of road space, tiny compared with the road lanes devoted to automobile parking. Most bicycle lanes are built without reducing the number of general traffic or automobile parking lanes. To the degree that they shift travel from automobile to alternative modes they directly benefit motorists through reduced traffic and parking congestion.
The First Casualty of a Non-Existent War Victoria Transport Policy Institute
5
Box 1 Who Benefits From Alternative Modes Auto advocates claim that since most people rely on automobile travel, only a very small number of people benefit from improvements to alternative modes. But there are several possible ways to define and measure demand for alternative modes that provide different indications about who benefits.
1. Mode share. Census data and travel surveys generally indicate that 90-95% of trips are by automobile. This implies that only 5-10% of residents benefit from alternative modes.
2. Portion of households that own no automobile. In most communities this is less than 10% of households representing less than 5% of residents. This implies that only 5-10% of residents benefit from alternative modes.
3. Portion total non-drivers. In most communities 80-90% of people over 16 years of age have a drivers’ license. This implies that only 10-20% of the population (people with severe disability, very low income or inability to obtain a drivers’ license) benefit from alternative modes.
4. Portion of partial non-drivers. Although difficult to estimate, in a typical community probably 40-60% of residents over 12 years of age, at least occasionally cannot, should not, or prefer not to drive due to moderate or severe disability (such as people with inadequate nighttime vision), low income (who would prefer more affordable alternatives to driving for more trips), inability to obtain a drivers’ license, inebriation (after drinking or taking medicines that causes drowsiness), or because they sometimes prefer walking, cycling or public transit more than driving.
5. Residents whose families have at least one non-driving member. Although difficult to estimate, in a typical community probably 60-80% of residents live in households that have at least one member who has the previously described attributes, and so would benefit from alternative modes that improve their travel options and reduce the need for motorists to chauffeur non-drivers.
Critics generally consider only the first two perspectives: commute mode share or the portion of zero-vehicle households. They also cite travel trends from 1950 to 2000, during which automobile transport grew and demand for alternative modes declined. These perspectives imply that a small and declining portion of the population benefits from alternative modes and demand management strategies. However, other perspectives can lead to different conclusions. If instead of asking, “What portion of households rely entirely on alternative modes?” we ask, “What portion of households do, or would like to, use alternative modes at least occasionally, now or in the future?” the estimated demand is much higher, and the justification for policies that improve alternative modes is much greater.
• Critics are wrong to claim that raising road tolls, parking fees or fuel taxes is unfair. Does charging admission at movie theatres constitute a “war on film viewers”? Does charging for bread constitute a “war on eaters?” Motor vehicle user fees only finance about half of roadway costs and a much smaller portion of parking facility costs; the rest is financed indirectly through general taxes (for local roads), higher retail prices (for business parking), lower wages (for employee parking), and higher housing costs (for residential parking) (Litman 2009; Subsidy Scope 2009). This funding structure forces people who drive less than average to subsidize their neighbors who drive more than average. Automobile travel also imposes other external costs, including congestion delays, accident risk, pollution emissions, and various economic and environmental costs from fuel consumption. North American fuel taxes are among the lowest among developed countries and have not been raised to account for inflation during the last two decades. These low user fees exacerbate traffic and parking congestions. The pricing reforms that critics call “anti-car” are often the most effective way to address the problems motorists face.
The First Casualty of a Non-Existent War Victoria Transport Policy Institute
6
• Critics are wrong to claim that alternative modes receive an excessive share of funding. Walking, cycling and public transport represent about 15% of total personal trips, and about twice that in cities.1 Considering all levels of government, less than 5% of surface transportation expenditures are devoted to non-motorized facilities, and only 1-2% including the costs of government-mandated parking facilities (ABW 2010; Litman 2009), indicating that non-motorized modes receive far less than their fair share of funding. Public transit receives proportionately more (about 20% of government expenditures or about 8% if parking subsidies are included) but transit has attributes that justify a higher proportion of funding as described in the box below.
Box 2 Are Public Transport Subsidies Excessive and Unfair?2 Auto advocates often argue that public transit, particularly urban rail, is excessively subsidized and that diversions of funds from highway to transit accounts is unfair. They estimate that transit, particularly urban rail, requires far higher subsidies than driving. However, such analysis overlooks important factors.
• Public transit operates on major urban corridors where road and parking facility expansion is costly. Transit subsidies should be compared with costs of accommodating additional automobile trips on the same corridors, rather than overall average costs and subsidies.
• Rail transit costs include tracks stations and vehicles. Transit costs should therefore be compared with the total costs of providing roads, parking facilities, automobiles and fuel.
• Auto advocates only consider roadway costs. They overlook additional external costs of driving including government-mandated parking facilities, congestion delays, accident risk, fuel subsidies, and pollution emissions imposed on other people.
• Public transit incurs additional costs to provide basic mobility for non-drives, and so operates at times and locations with low demands, and incorporates additional costs such as wheelchair ramps and demand response services. Such service cannot be cost efficient, and should not be included when calculating transit service cost efficiency. Described differently, such service should be compared with the costs of wheelchair equipped taxi services rather than the average costs of driving an automobile, since the clients served could not drive a car even it were given to them.
• Transit provides multiple benefits including traffic and parking congestion reductions, consumer savings, improved mobility for non-drivers, accident reductions, energy conservation and emission reductions. All of these benefits should be considered when evaluating transit cost efficiency.
• Non-motorists tend to travel by public transit much less (typically 10-15% as many annual miles) than motorists drive, so even if per mile subsidies are higher for transit than for driving, motorists tend to receive far greater subsidies per year.
• Public transit provides “option value,” the benefit of having an option available in case of emergencies or changing needs, just as ship passengers value having lifeboats available.
When all benefits and costs are considered, public transit service improvements are often more cost effective and beneficial than the full costs of accommodating more urban automobile travel.
• Critics apply a double standard when they criticize highway account expenditures on alternative modes. They argue that it is unfair for motorists to subsidize other modes but ignore the larger subsidies that motorists receive. Less than half of roadway funding, and a much smaller portion of parking facility costs, is funded by user fees. If auto advocates demand that all road user revenues be spent on roadways they should also demand that user fees fully finance roadways.
• Critics are wrong to claim that transportation demand management programs are ineffective. Where appropriately applied, they are often quite effective and beneficial (VTPI 2010).
The First Casualty of a Non-Existent War Victoria Transport Policy Institute
7
This indicates that the policies cited as evidence of a “war on cars” are not arbitrary restrictions on motorists’ freedoms: they are rational solutions to various transport problems. Even with these reforms, motorists can still drive unconstrained to most destinations, automobiles continue to receive the greatest share of road space and financial resources, and automobile travel is still underpriced since user fees do not fully finance road and parking facilities or compensate for other external costs of vehicle traffic such as congestion, accident risk and pollution damages. By any objective analysis there is no war on cars. The following section examines this issue from a different perspective. It compares grievances. It asks, “Do both motorists and non-motorists have legitimate reasons to feel victimized?” Motorists’ Grievances For most people, driving is a normal form of transport, and necessary for an independent and responsible life. Many communities have dispersed destinations and inferior, stigmatized alternative modes, so many residents cannot imagine reducing their driving without a significant loss of convenience, comfort and prestige. Many motorists have worked hard and made significant personal sacrifices in order to own a car and live in a suburban homes. Most motorists make efforts to minimize the harm they impose on others: they pay for pollution emission control systems, usually obey traffic laws, and try to be considerate to vulnerable road users. Many motorists are already financially stressed by their vehicle costs and cannot afford to pay more. Criticism of driving can be insulting, especially when motorists are described as irresponsible. It is therefore understandable that motorists consider efforts to reduce their vehicle travel to be harmful and unfair, and feel offended when somebody questions the morality of their lifestyle. Non-Motorists’ Grievances People who rely on alternative modes often feel that current policies (dedicated roadway funding, generous minimum parking requirements, etc.) unfairly favor automobile travel, reducing their travel options and causing them inconvenience, discomfort and humiliation. Automobile travel imposes risk, noise and air pollution on non-motorized travelers (and therefore to transit users, since most transit trips include walking links). Wide roads and increased vehicle traffic volumes and speeds reduce walking and cycling access (called the barrier effect). Because they are large and fast, motor vehicles require far more road and parking space, and so receive a much greater share of public resources than people who rely on alternative modes. In addition, because motor vehicles are prestige goods, they can reduce the social status of non-drivers. It is therefore understandable that non-motorists consider motorists’ denial of their negative impacts, unwillingness to support alternatives, and resistance to increased user fees harmful and unfair. Policies that favor automobile travel, such as urban highway construction, generous parking requirements and low fuel prices cause land use development changes that further harm non-drivers. For example, there are fewer neighborhood services (stores, banks, hairdressers, etc.) reducing the ease of accessing these services by alternative modes.
The First Casualty of a Non-Existent War Victoria Transport Policy Institute
8
What Would Peace Look Like From their own perspectives, each side has legitimate grievances. Such conflicts could be resolved with compromise, for example, by implementing policy reforms that help address both groups’ problems. A peaceful resolution would include the following:3
• Motorists admit that automobile use imposes negative impacts on people who rely on alternative modes, including direct delay, risk, noise and air pollution, and indirect costs where automobile dependency reduces travel options, and land use sprawl results in dispersed destinations.
• Non-motorists admit that automobile transport provides significant benefits to users and society, and that many people rely on and enjoy driving, so automobile travel cannot be eliminated.
• Both sides agree to avoid insulting and inflammatory language, and unreasonable demands.
• Motorists are willing to support improvements to alternative modes (walking, cycling and public transit) and more accessible, multi-modal land use development where justified based on consumer demands (i.e., where people want to use alternative modes and live in smart growth communities) and cost effectiveness (i.e., where improvements to alternative modes are cost effective compared with automobile transport improvements, considering all benefits and costs).
• Motorists accept higher user fees where they are cost effective solutions to transport problems (congestion, accidents and pollution emissions) and to finance road and parking facilities.
However, by framing the conflict as a “war against cars” and opposing specific policy reforms, auto advocates preclude such compromises. This may sound harsh. Auto advocates might argue that automobile critics are equally negative and inflexible, but the two sides are unequal in their influence and demands. Many powerful interest groups support automobile transport, including vehicle and petroleum producers, highway builders, suburban businesses, most planning agencies, and various other groups that value roadway expansion and inexpensive vehicle use. Although various professional organizations and interest groups do support some transportation demand management and smart growth strategies, as descried earlier in this report, their demands are modest: small shifts in the allocation of road space and transport funding, and more user fees. None really demand widespread restrictions on automobile use. Even the most radical, such as “carfree cities” proponents, only expect restrictions to be applied in a few times and locations;4 they do not envision eliminating automobile travel altogether.
The First Casualty of a Non-Existent War Victoria Transport Policy Institute
9
Justified Defense Against Anti-Car Forces? Car advocates may argue that they are simply defending their legitimate interests against anti-car forces. Do such forces exist? Are they a legitimate threat to automobile transport? Yes and no. There certainly are people and organizations that criticize current transport policies for being excessively automobile-oriented. Ronnie Schreiber’s column, “The War On Cars” discusses this issue (2010, Part 3). It cites publications by Australian professors Peter Newman and Jeffrey Kenworthy which argue that current policies create automobile-dependent communities which cause various problems, and so should be corrected. He discusses examples of policy reforms cited by Newman and Kenworthy, and argues, “It seems that all the transportation solutions proposed by alternative transport enthusiasts necessarily involve punishing drivers. Giving buses right of way at lights means that private car and truck drivers must constantly be on the alert for a bus, regardless of having a green light or not. Not only is that stressful, it’s bound to create more congestion since buses hold up drivers with green lights. That seems like a recipe for making driving more inconvenient and it appears that was exactly the plan. Newman and Kenworthy say that following the expansion of the tram and bus system, pedestrian malls followed that deliberately took up road space and parking lots. The authors quote activist Willi Husler that it was part of a strategy to “point out other, better possibilities of use. That way we can fight a guerrilla war against the car and win.” Here is the full quote from Newman and Kenworthy’s paper (Prichard 2007):
In the 1970s Zurich had to make decisions about its trams. Instead of bowing to the car lobby it expanded its old tram system and upgraded the services so that its citizens never had to wait more than 6 minutes and trams and buses were given right of way at traffic lights. ‘Suddenly trams became popular in Zurich. We found it impossible to attack the use of the tram... People simply won't accept it,’ says consultant Willi Husler. As trams became fashionable, public attention was directed to other amenities—pedestrian malls, and outdoor cafés, which were allowed to take up road space and parking lots. The strategy, says Husler, was ‘to point out other, better possibilities of use. That way we can fight a guerrilla war against the car and win.’ People began to respond to the attractions of the public realm and made private sacrifices to be part of it.
This quote can be cited as a declaration of war against the car, but is such rhetoric a serious threat to automobile travel? There is actually little action to significantly constrain automobile travel. With the exception of Venice, but including Zurich, most cities accommodate automobile traffic and few restrict it except in central areas. In other words, what pro-automobile advocates fear is not really the elimination of automobile travel, since nobody seriously proposes that, but rather, restrictions on automobile travel which result in more multi-modal cities. They fear that trams will take up road space and pedestrian malls will displace parking lots in urban centers. There is also more emotional criticism of automobile-oriented planning and automobile use, such as Car Free and bicycle advocacy organizations. Although sometimes large in media profile, their impact on policy is actually small in most communities, overwhelmed by more influential and well-financed automobile advocacy organizations, including vehicle, fuel and roadway industries, and businesses that demand subsidized public parking. However, such critics do represent a threat by challenging the superior social status often given to motorists.
The First Casualty of a Non-Existent War Victoria Transport Policy Institute
10
My Research A few years ago I performed a study that evaluated the transport system performance of U.S. metropolitan regions categorized according to their transit system quality. The results, first published in the report, Rail Transit In American: Comprehensive Evaluation of Benefits (Litman 2004) 5 indicate that compared with other regions, the seven metropolitan areas with high quality transit systems (which I labeled Large Rail Cities, in reference to their most notable feature, their extensive rail networks) on average have:
• 400% higher per capita transit ridership (589 versus 118 annual passenger-miles).
• 887% higher transit commute mode split (13.4% versus 2.7%).
• 36% lower per capita traffic fatalities (7.5 versus 11.7 annual deaths per 100,000 residents).
• 14% lower per capita consumer expenditures on transport ($448 average annual savings).
• 19% smaller portion of household budgets devoted to transport (12.0% versus 14.9%).
• 21% lower per capita motor vehicle mileage (1,958 fewer annual miles).
• 33% lower transit operating costs per passenger-mile (42¢ versus 63¢).
• 58% higher transit service cost recovery (38% versus 24%).
• Improved fitness and health (since most transit trips have walking or cycling links, so transit travelers are much more likely to achieve physical activity targets than motorists).
• Increased money circulating in local economies (since transit travelers spend significantly less on vehicles and fuel, and more on other goods which tend to have increased local input).
Other academic studies found similar results. Kenworthy (2008) found similar impacts using international data. Aftabuzzaman, Currie and Sarvi (2011) confirmed the congestion reduction impacts. CTS (2010) found substantial consumer savings and improved economic opportunity. Lachapelle, et al. (2011) found substantial health benefits. People sometimes misunderstand this research, assuming that it measures differences between rail and bus transit, but it actually indicates differences between low- and high-quality transit service, considering attributes such as vehicle and station comfort, service frequency and speed, user convenience, and community integration. In most cities, rail offers better service quality than bus transit, but it is possible that Bus Rapid Transit (BRT) could also provide high service quality. I am a strong supporter of BRT and integration of bus and rail transit. In 2010, Secretary of Transportation Ray LaHood cited my research in support of the USDOT’s livable community initiative (LaHood 2010). In response, Wendell Cox of the Heritage Foundation attacked the Secretary and my research. The following section evaluates these attacks.
The First Casualty of a Non-Existent War Victoria Transport Policy Institute
11
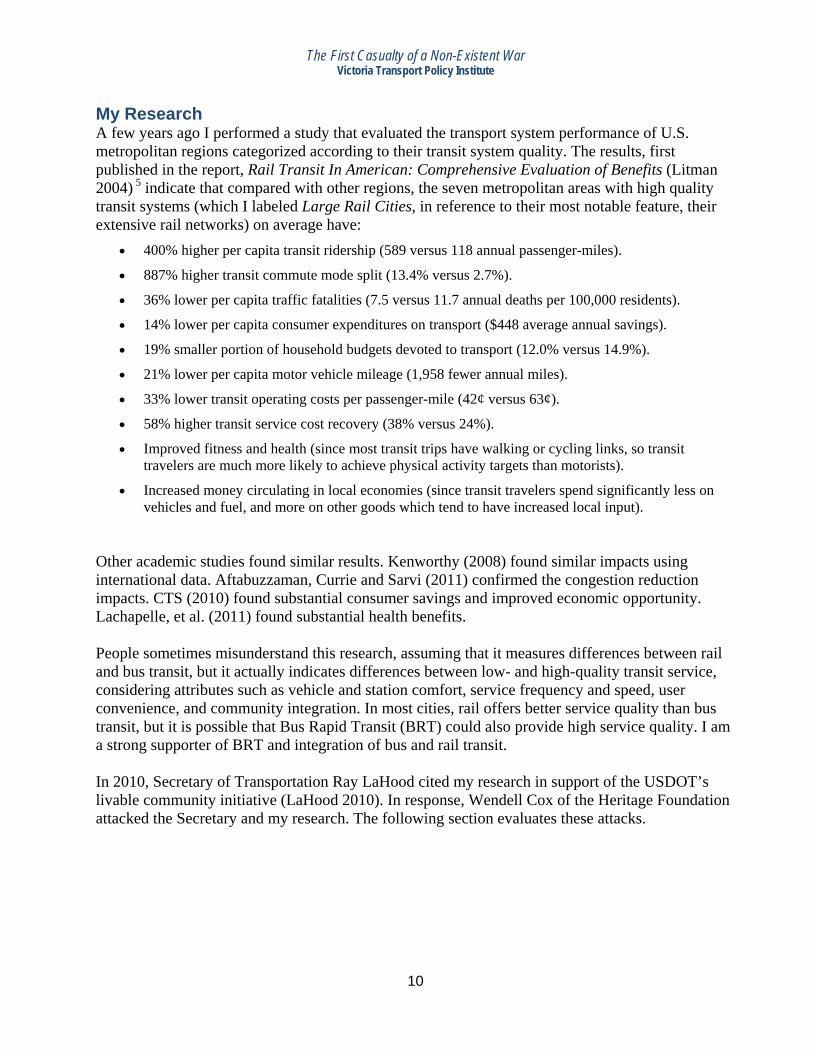
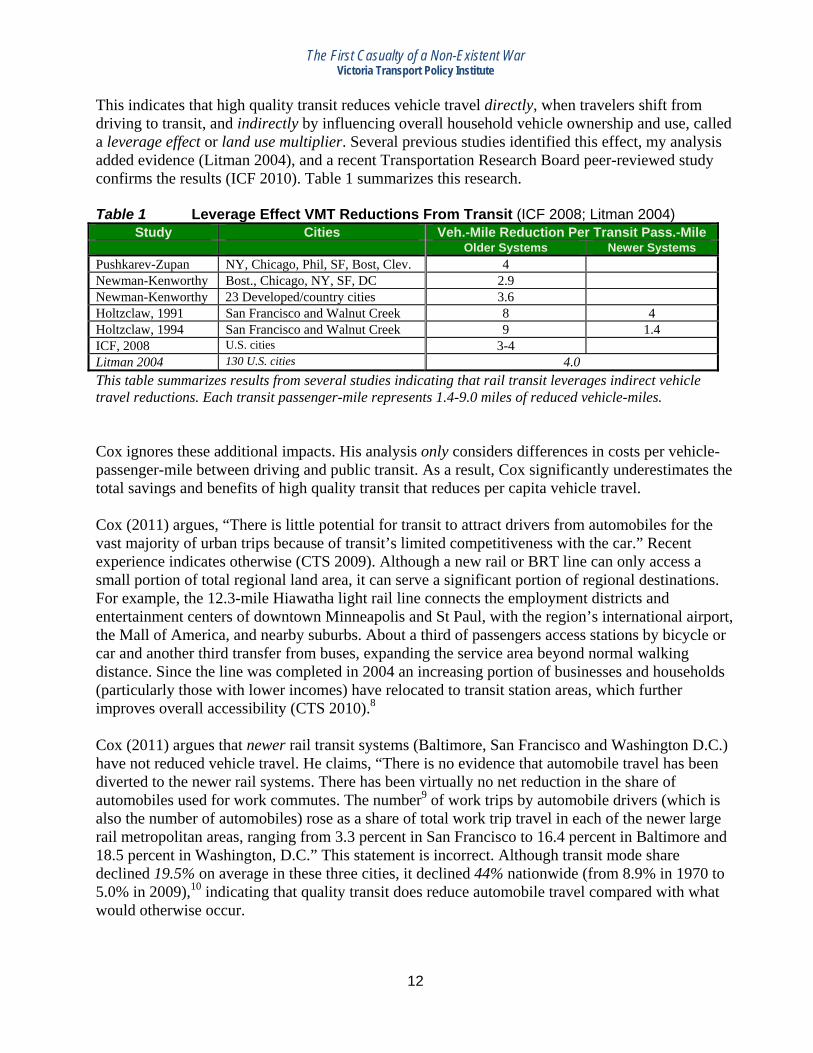
Critique of “Washington’s War On Cars…” Washington’s War on Cars and the Suburbs: Secretary LaHood’s False Claims on Roads and Transit (Cox 2010) criticizes the U.S. Department of Transportation’s livability agenda and my report, Rail Transit in America: Comprehensive Evaluation of Benefits (Litman 2004), the source of many of the USDOT’s analysis. I subsequently sent Cox a letter challenging and requesting clarification on several of his claims. The Heritage Foundation posted his repose, Urban Transportation Policy Requires Factual Foundations (Cox 2011). They represent good examples of the evidence of a “war on cars.” The following is my detailed critique of these documents. This can be a little confusing, due to the back-and-forth debate, so I provide a summary table of arguments and counter-arguments at the end of this section. Travel Impacts My research indicates that residents of urban regions with high quality public transit6 use transit five times more, and drive about 20% less than residents of other communities, as indicated in the following graphs. These differences are even greater when evaluated at a finer geographic scale, such as comparing transit-oriented and automobile-dependent neighborhoods. Figure 2 Transit Ridership And Vehicle Travel Comparisons (Litman 2004)
0%200%400%600%
Per Capita Ridership Commute Mode Split
Rel
ativ
e to
"B
us O
nly"
Citi
es Large RailSmall RailBus Only
0
2,000
4,000
6,000
8,000
10,000
Large Rail Small Rail Bus Only
Ann
ual V
ehic
le-M
iles
Transit ridership and commute mode share are much higher in “Large Rail” cities.
Large Rail region residents drive about 20% less per year than residents of cities that lack rail transit
These travel reductions occur because high quality public transit is a catalyst for transit-oriented development (TOD), which refers to neighborhoods with a train or bus station, feeder bus services, compact and mixed-use development, and good walking and cycling conditions. Such areas provide good travel options for both local and regional travel. This affects countless individual decisions. For example, in Houston and Los Angeles adults generally rent or borrow a car, but in Washington DC and San Francisco they are more likely to rely on public transit and walking. Similarly, teenagers and seniors are more likely to own a car and drive high miles in automobile-dependent regions than in areas with high quality public transit. As a result, TOD residents typically own 10-30% fewer vehicles and drive 20-60% fewer miles than in conventional, automobile-dependent communities (Cervero and Arrington 2008). These differences may partly reflect self-selection, the tendency of people who cannot drive to choose TOD locations, but this usually reflects a minor portion (less than 40%) of differences in per capita vehicle travel.7
The First Casualty of a Non-Existent War Victoria Transport Policy Institute
12
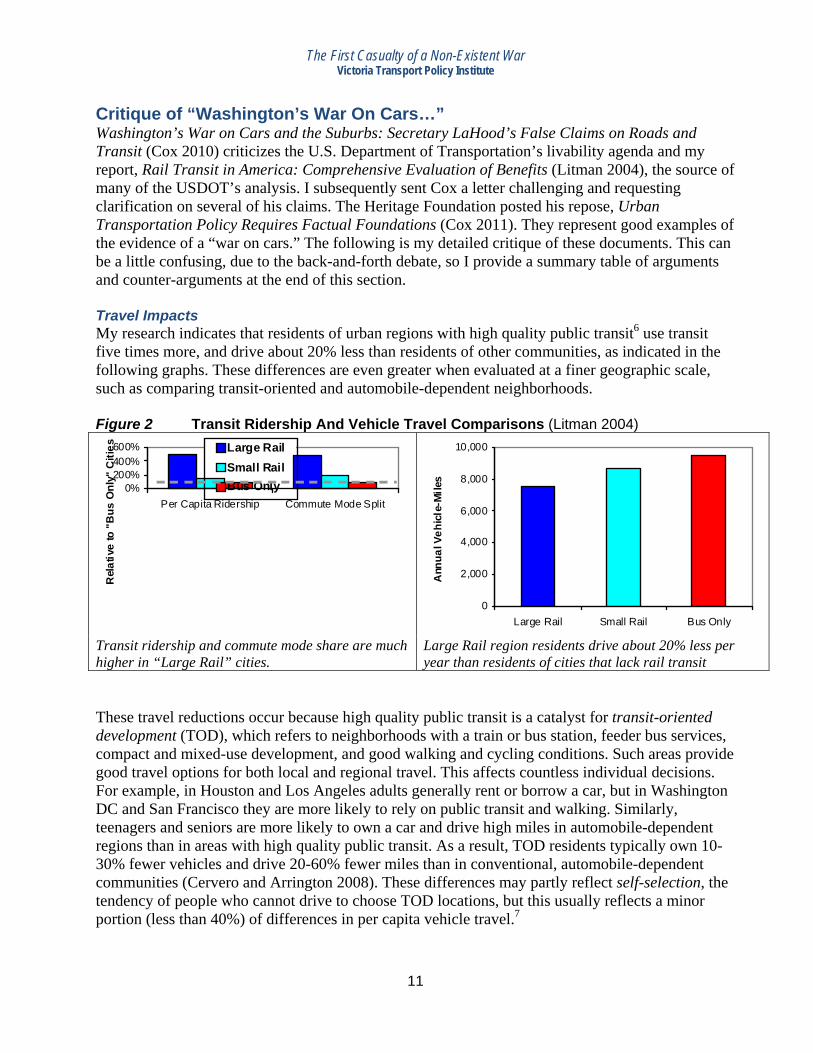
This indicates that high quality transit reduces vehicle travel directly, when travelers shift from driving to transit, and indirectly by influencing overall household vehicle ownership and use, called a leverage effect or land use multiplier. Several previous studies identified this effect, my analysis added evidence (Litman 2004), and a recent Transportation Research Board peer-reviewed study confirms the results (ICF 2010). Table 1 summarizes this research. Table 1 Leverage Effect VMT Reductions From Transit (ICF 2008; Litman 2004)
Study Cities Veh.-Mile Reduction Per Transit Pass.-Mile Older Systems Newer SystemsPushkarev-Zupan NY, Chicago, Phil, SF, Bost, Clev. 4 Newman-Kenworthy Bost., Chicago, NY, SF, DC 2.9 Newman-Kenworthy 23 Developed/country cities 3.6 Holtzclaw, 1991 San Francisco and Walnut Creek 8 4 Holtzclaw, 1994 San Francisco and Walnut Creek 9 1.4 ICF, 2008 U.S. cities 3-4 Litman 2004 130 U.S. cities 4.0 This table summarizes results from several studies indicating that rail transit leverages indirect vehicle travel reductions. Each transit passenger-mile represents 1.4-9.0 miles of reduced vehicle-miles. Cox ignores these additional impacts. His analysis only considers differences in costs per vehicle-passenger-mile between driving and public transit. As a result, Cox significantly underestimates the total savings and benefits of high quality transit that reduces per capita vehicle travel. Cox (2011) argues, “There is little potential for transit to attract drivers from automobiles for the vast majority of urban trips because of transit’s limited competitiveness with the car.” Recent experience indicates otherwise (CTS 2009). Although a new rail or BRT line can only access a small portion of total regional land area, it can serve a significant portion of regional destinations. For example, the 12.3-mile Hiawatha light rail line connects the employment districts and entertainment centers of downtown Minneapolis and St Paul, with the region’s international airport, the Mall of America, and nearby suburbs. About a third of passengers access stations by bicycle or car and another third transfer from buses, expanding the service area beyond normal walking distance. Since the line was completed in 2004 an increasing portion of businesses and households (particularly those with lower incomes) have relocated to transit station areas, which further improves overall accessibility (CTS 2010).8 Cox (2011) argues that newer rail transit systems (Baltimore, San Francisco and Washington D.C.) have not reduced vehicle travel. He claims, “There is no evidence that automobile travel has been diverted to the newer rail systems. There has been virtually no net reduction in the share of automobiles used for work commutes. The number9 of work trips by automobile drivers (which is also the number of automobiles) rose as a share of total work trip travel in each of the newer large rail metropolitan areas, ranging from 3.3 percent in San Francisco to 16.4 percent in Baltimore and 18.5 percent in Washington, D.C.” This statement is incorrect. Although transit mode share declined 19.5% on average in these three cities, it declined 44% nationwide (from 8.9% in 1970 to 5.0% in 2009),10 indicating that quality transit does reduce automobile travel compared with what would otherwise occur.
The First Casualty of a Non-Existent War Victoria Transport Policy Institute
13
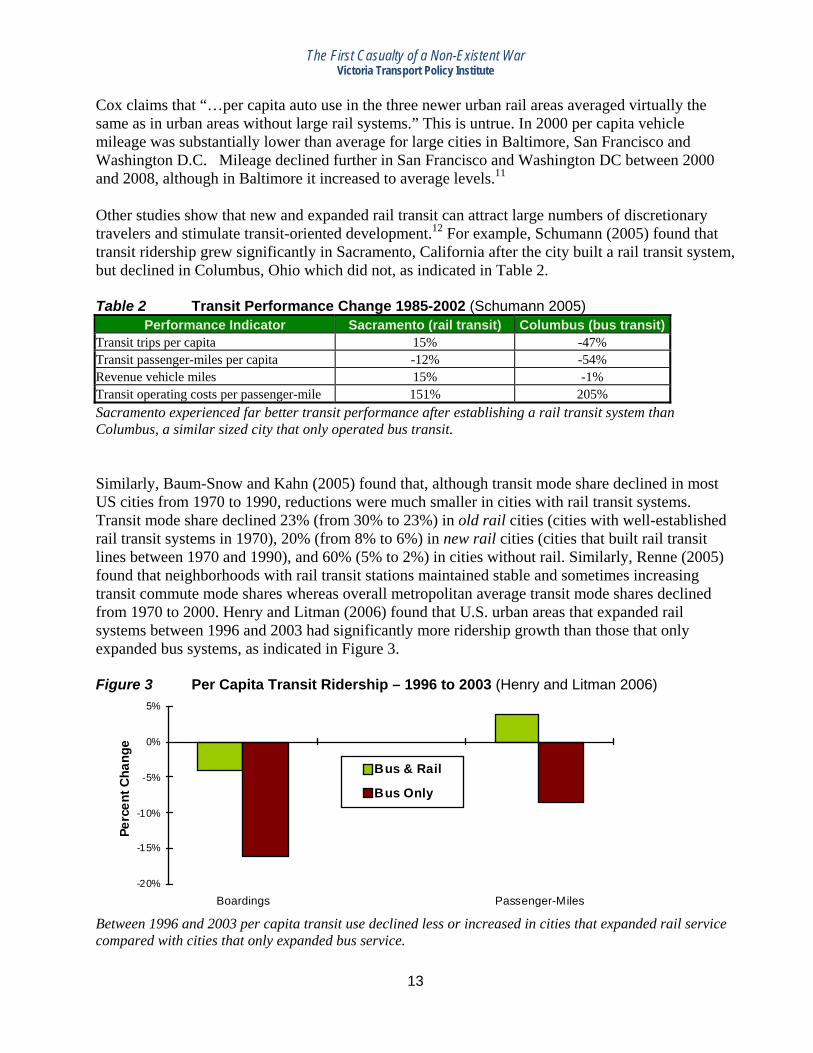
Cox claims that “…per capita auto use in the three newer urban rail areas averaged virtually the same as in urban areas without large rail systems.” This is untrue. In 2000 per capita vehicle mileage was substantially lower than average for large cities in Baltimore, San Francisco and Washington D.C. Mileage declined further in San Francisco and Washington DC between 2000 and 2008, although in Baltimore it increased to average levels.11 Other studies show that new and expanded rail transit can attract large numbers of discretionary travelers and stimulate transit-oriented development.12 For example, Schumann (2005) found that transit ridership grew significantly in Sacramento, California after the city built a rail transit system, but declined in Columbus, Ohio which did not, as indicated in Table 2. Table 2 Transit Performance Change 1985-2002 (Schumann 2005)
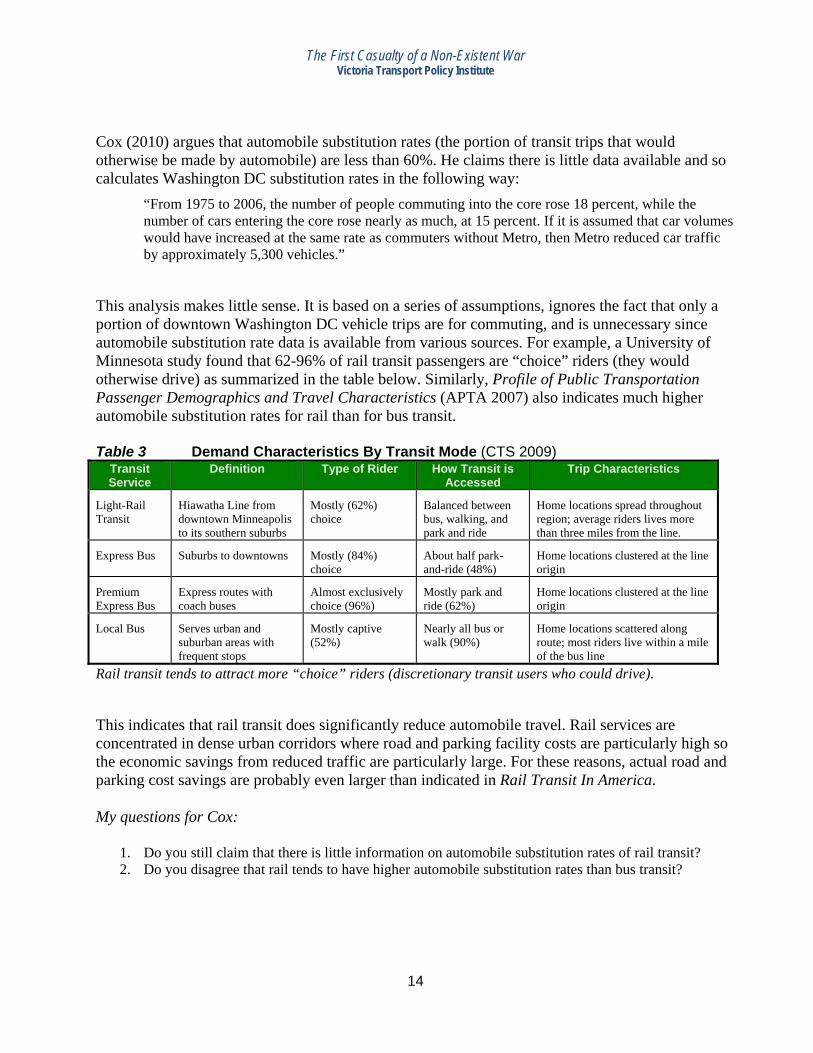
Performance Indicator Sacramento (rail transit) Columbus (bus transit)Transit trips per capita 15% -47% Transit passenger-miles per capita -12% -54% Revenue vehicle miles 15% -1% Transit operating costs per passenger-mile 151% 205% Sacramento experienced far better transit performance after establishing a rail transit system than Columbus, a similar sized city that only operated bus transit. Similarly, Baum-Snow and Kahn (2005) found that, although transit mode share declined in most US cities from 1970 to 1990, reductions were much smaller in cities with rail transit systems. Transit mode share declined 23% (from 30% to 23%) in old rail cities (cities with well-established rail transit systems in 1970), 20% (from 8% to 6%) in new rail cities (cities that built rail transit lines between 1970 and 1990), and 60% (5% to 2%) in cities without rail. Similarly, Renne (2005) found that neighborhoods with rail transit stations maintained stable and sometimes increasing transit commute mode shares whereas overall metropolitan average transit mode shares declined from 1970 to 2000. Henry and Litman (2006) found that U.S. urban areas that expanded rail systems between 1996 and 2003 had significantly more ridership growth than those that only expanded bus systems, as indicated in Figure 3. Figure 3 Per Capita Transit Ridership – 1996 to 2003 (Henry and Litman 2006)
-20%
-15%
-10%
-5%
0%
5%
Boardings Passenger-Miles
Perc
ent C
hang
e
Bus & Rail
Bus Only
Between 1996 and 2003 per capita transit use declined less or increased in cities that expanded rail service compared with cities that only expanded bus service.
The First Casualty of a Non-Existent War Victoria Transport Policy Institute
14
Cox (2010) argues that automobile substitution rates (the portion of transit trips that would otherwise be made by automobile) are less than 60%. He claims there is little data available and so calculates Washington DC substitution rates in the following way:
“From 1975 to 2006, the number of people commuting into the core rose 18 percent, while the number of cars entering the core rose nearly as much, at 15 percent. If it is assumed that car volumes would have increased at the same rate as commuters without Metro, then Metro reduced car traffic by approximately 5,300 vehicles.”
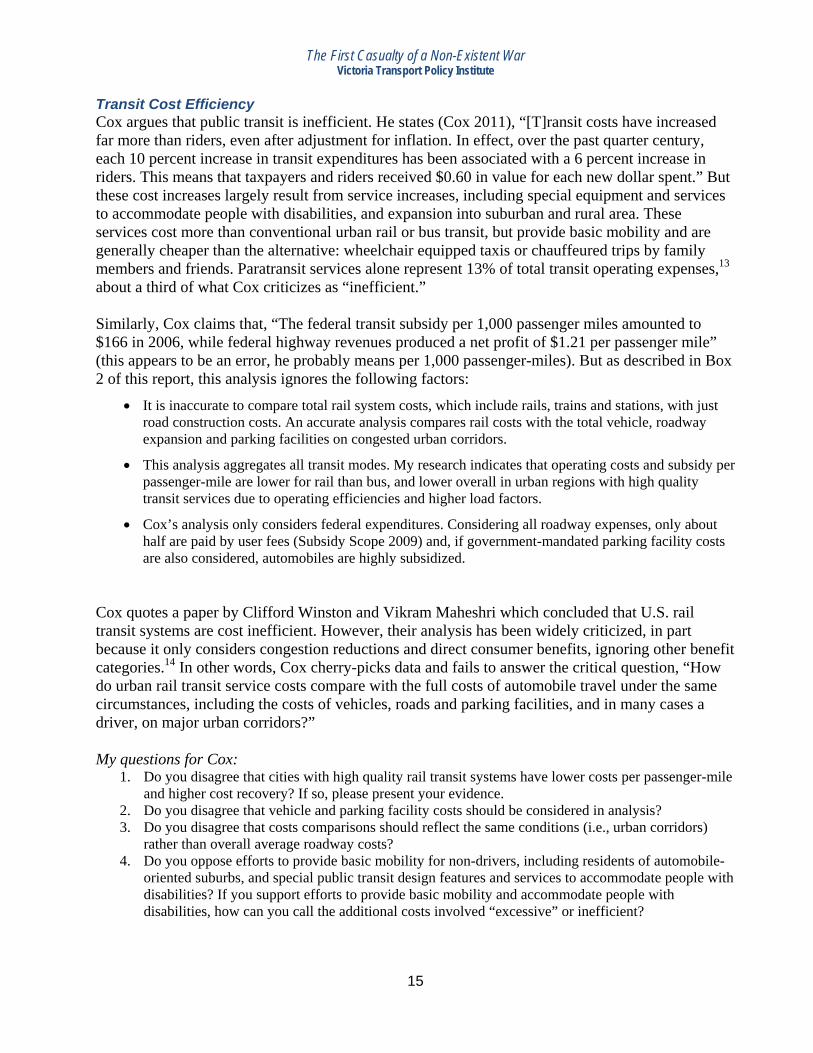
This analysis makes little sense. It is based on a series of assumptions, ignores the fact that only a portion of downtown Washington DC vehicle trips are for commuting, and is unnecessary since automobile substitution rate data is available from various sources. For example, a University of Minnesota study found that 62-96% of rail transit passengers are “choice” riders (they would otherwise drive) as summarized in the table below. Similarly, Profile of Public Transportation Passenger Demographics and Travel Characteristics (APTA 2007) also indicates much higher automobile substitution rates for rail than for bus transit. Table 3 Demand Characteristics By Transit Mode (CTS 2009)
Transit Service
Definition Type of Rider How Transit is Accessed
Trip Characteristics
Light-Rail Transit
Hiawatha Line from downtown Minneapolis to its southern suburbs
Mostly (62%) choice
Balanced between bus, walking, and park and ride
Home locations spread throughout region; average riders lives more than three miles from the line.
Express Bus Suburbs to downtowns Mostly (84%) choice
About half park-and-ride (48%)
Home locations clustered at the line origin
Premium Express Bus
Express routes with coach buses
Almost exclusively choice (96%)
Mostly park and ride (62%)
Home locations clustered at the line origin
Local Bus Serves urban and suburban areas with frequent stops
Mostly captive (52%)
Nearly all bus or walk (90%)
Home locations scattered along route; most riders live within a mile of the bus line
Rail transit tends to attract more “choice” riders (discretionary transit users who could drive). This indicates that rail transit does significantly reduce automobile travel. Rail services are concentrated in dense urban corridors where road and parking facility costs are particularly high so the economic savings from reduced traffic are particularly large. For these reasons, actual road and parking cost savings are probably even larger than indicated in Rail Transit In America. My questions for Cox:
1. Do you still claim that there is little information on automobile substitution rates of rail transit? 2. Do you disagree that rail tends to have higher automobile substitution rates than bus transit?
The First Casualty of a Non-Existent War Victoria Transport Policy Institute
15
Transit Cost Efficiency Cox argues that public transit is inefficient. He states (Cox 2011), “[T]ransit costs have increased far more than riders, even after adjustment for inflation. In effect, over the past quarter century, each 10 percent increase in transit expenditures has been associated with a 6 percent increase in riders. This means that taxpayers and riders received $0.60 in value for each new dollar spent.” But these cost increases largely result from service increases, including special equipment and services to accommodate people with disabilities, and expansion into suburban and rural area. These services cost more than conventional urban rail or bus transit, but provide basic mobility and are generally cheaper than the alternative: wheelchair equipped taxis or chauffeured trips by family members and friends. Paratransit services alone represent 13% of total transit operating expenses,13 about a third of what Cox criticizes as “inefficient.” Similarly, Cox claims that, “The federal transit subsidy per 1,000 passenger miles amounted to $166 in 2006, while federal highway revenues produced a net profit of $1.21 per passenger mile” (this appears to be an error, he probably means per 1,000 passenger-miles). But as described in Box 2 of this report, this analysis ignores the following factors:
• It is inaccurate to compare total rail system costs, which include rails, trains and stations, with just road construction costs. An accurate analysis compares rail costs with the total vehicle, roadway expansion and parking facilities on congested urban corridors.
• This analysis aggregates all transit modes. My research indicates that operating costs and subsidy per passenger-mile are lower for rail than bus, and lower overall in urban regions with high quality transit services due to operating efficiencies and higher load factors.
• Cox’s analysis only considers federal expenditures. Considering all roadway expenses, only about half are paid by user fees (Subsidy Scope 2009) and, if government-mandated parking facility costs are also considered, automobiles are highly subsidized.
Cox quotes a paper by Clifford Winston and Vikram Maheshri which concluded that U.S. rail transit systems are cost inefficient. However, their analysis has been widely criticized, in part because it only considers congestion reductions and direct consumer benefits, ignoring other benefit categories.14 In other words, Cox cherry-picks data and fails to answer the critical question, “How do urban rail transit service costs compare with the full costs of automobile travel under the same circumstances, including the costs of vehicles, roads and parking facilities, and in many cases a driver, on major urban corridors?” My questions for Cox:
1. Do you disagree that cities with high quality rail transit systems have lower costs per passenger-mile and higher cost recovery? If so, please present your evidence.
2. Do you disagree that vehicle and parking facility costs should be considered in analysis? 3. Do you disagree that costs comparisons should reflect the same conditions (i.e., urban corridors)
rather than overall average roadway costs? 4. Do you oppose efforts to provide basic mobility for non-drivers, including residents of automobile-
oriented suburbs, and special public transit design features and services to accommodate people with disabilities? If you support efforts to provide basic mobility and accommodate people with disabilities, how can you call the additional costs involved “excessive” or inefficient?
The First Casualty of a Non-Existent War Victoria Transport Policy Institute
16
Consumer Benefits Washington’s War on Cars also ignores the value to consumers of having high quality alternatives to automobile travel. Cox (2010, p. 13) makes the following statement “People are free to choose cars or transit for their travel, and the car tends to be preferred by those who can afford it, whether in the United States or elsewhere.” This is not always true. In most North American communities transit service offers limited geographic coverage, frequency, speed and comfort, and is poorly integrated into communities. As a result, people are not free to choose transit for most trips: they are forced to drive. It is also untrue that everybody can choose to travel by car: in any community a significant portion of residents (typically 10-30% of adolescents and adults) cannot drive due to disability, poverty or other constraints. Cox’s analysis ignores these issues. As described previously, urban regions with high quality public transit have about five times as much public transit ridership as comparable regions that have more basic quality transit. This indicates that many travelers actually prefer traveling by transit, provided it is convenient, and comfortable. Demand for better transit systems is growing due to demographic and economic trends including aging population, rising fuel prices, and changing consumer preferences (Litman 2006; Reconnecting America 2004). Much of Cox’s criticism is based on the assumptions that transit travel is always slower and less desirable than driving. He presents aggregate data comparing overall average transit and automobile commute durations. Although public transit travel tends to be slower on average, particularly buses in mixed traffic, grade separated rail and bus are faster than driving for certain trips, for example, between Brooklyn and Manhattan or Oakland and San Francisco. Transit travel often does take longer than driving due to the additional walking and waiting time involved, but speed is only one of many factors people consider when making travel decisions; a slower mode is often preferable because it is cheaper, less stressful, more enjoyable, or provides health benefits.15 Travelers often prefer transit, provided it is convenient and comfortable, because they can use their travel time more productively (Lyons, Jain and Holley 2007; Thompson 2010) and experience less stress than when driving (Wener, Evans and Lutin 2006). Where high quality transit exists, travelers can choose the best mode for each trip, considering speed, affordability and preferences. Cox’s criticism ignores the following factors:
• Although there is good evidence that improved employment access increases productivity, this applies to transit as well as automobile commuting. Prud’homme and Lee’s 1998 report, which Cox cites, concludes that urban areas with better public transit and less sprawl are more economically productive overall due to improved employment access.
• Many disadvantaged people physically or legally cannot drive, and those who can drive often choose high quality public transit, if available, to save money.
• Although economically disadvantaged workers can benefit from access to a car, they also benefit from access to high quality public transit (CTS 2010; Sanchez 1999; Yi 2006).
• Cities with high quality public transit tend to have higher per capita economic productivity, as described later in this report.
In other words, an efficient transport system allows travelers to choose the best option for each trip, including diverse modes and service quality. This benefits consumers overall, and is particularly beneficial to people who cannot drive, who have lower incomes (and so value the opportunity to
The First Casualty of a Non-Existent War Victoria Transport Policy Institute
17
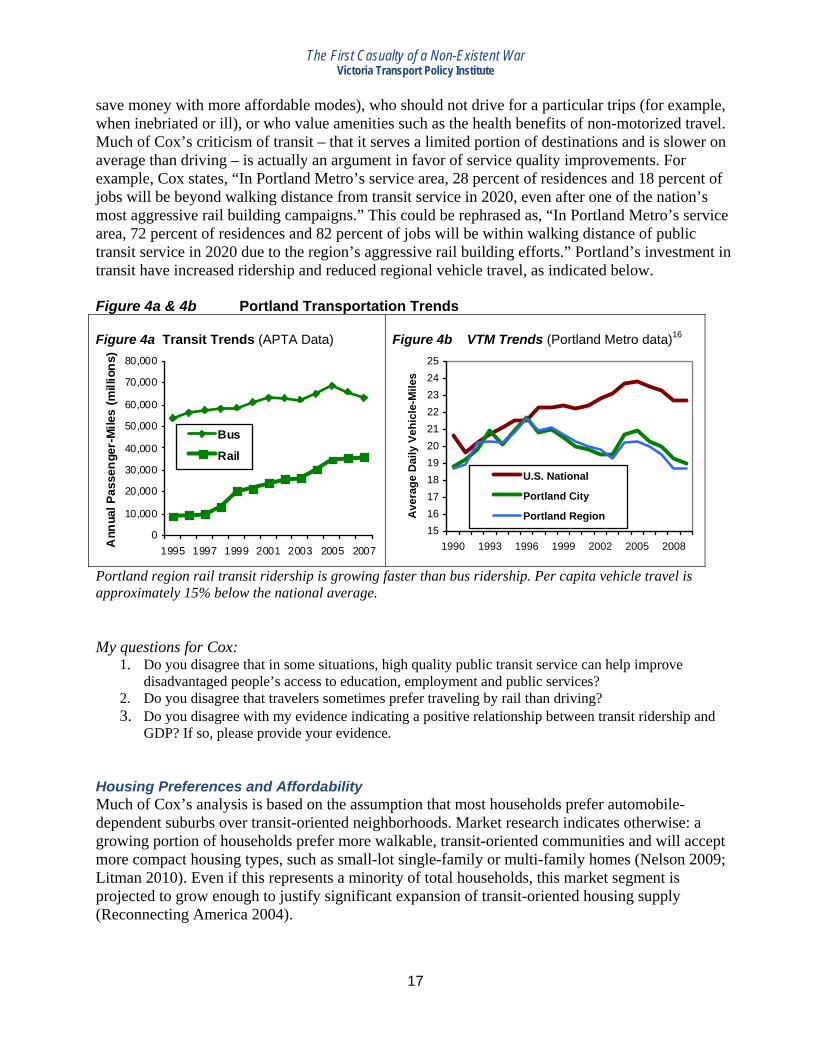
save money with more affordable modes), who should not drive for a particular trips (for example, when inebriated or ill), or who value amenities such as the health benefits of non-motorized travel. Much of Cox’s criticism of transit – that it serves a limited portion of destinations and is slower on average than driving – is actually an argument in favor of service quality improvements. For example, Cox states, “In Portland Metro’s service area, 28 percent of residences and 18 percent of jobs will be beyond walking distance from transit service in 2020, even after one of the nation’s most aggressive rail building campaigns.” This could be rephrased as, “In Portland Metro’s service area, 72 percent of residences and 82 percent of jobs will be within walking distance of public transit service in 2020 due to the region’s aggressive rail building efforts.” Portland’s investment in transit have increased ridership and reduced regional vehicle travel, as indicated below. Figure 4a & 4b Portland Transportation Trends Figure 4a Transit Trends (APTA Data)
0
10,000
20,000
30,000
40,000
50,000
60,000
70,000
80,000
1995 1997 1999 2001 2003 2005 2007Ann
ual P
asse
nger
-Mile
s (m
illio
ns)
Bus
Rail
Figure 4b VTM Trends (Portland Metro data)16
1516171819202122232425
1990 1993 1996 1999 2002 2005 2008
Ave
rage
Dai
ly V
ehic
le-M
iles
U.S. National
Portland City
Portland Region
Portland region rail transit ridership is growing faster than bus ridership. Per capita vehicle travel is approximately 15% below the national average. My questions for Cox:
1. Do you disagree that in some situations, high quality public transit service can help improve disadvantaged people’s access to education, employment and public services?
2. Do you disagree that travelers sometimes prefer traveling by rail than driving? 3. Do you disagree with my evidence indicating a positive relationship between transit ridership and
GDP? If so, please provide your evidence. Housing Preferences and Affordability Much of Cox’s analysis is based on the assumption that most households prefer automobile-dependent suburbs over transit-oriented neighborhoods. Market research indicates otherwise: a growing portion of households prefer more walkable, transit-oriented communities and will accept more compact housing types, such as small-lot single-family or multi-family homes (Nelson 2009; Litman 2010). Even if this represents a minority of total households, this market segment is projected to grow enough to justify significant expansion of transit-oriented housing supply (Reconnecting America 2004).
The First Casualty of a Non-Existent War Victoria Transport Policy Institute
18
Cox (2011) challenges my claim that “many people are moving back into cities,” pointing out that the “Large Rail” urban areas lost population during the last decade. However, the trends are complex: for the last century there have been overall population shifts from the Northeast to South and West, and from cities to suburbs. These migration trends have slowed17 and many suburbs are evolving from bedroom communities into cities that will require more diverse transport systems. In “Washington’s War on Cars and the Suburbs” (p. 11) and other publications, Cox criticizes smart growth policies for increasing housing costs. His analysis, based primarily on his own, not-peer-reviewed papers, overlooks important factors (Litman 2008b; Nelson, et al. 2002; ULI 2009):
• It assume that smart growth policies primarily consist of land use regulations, such as urban growth boundaries which reduce developable land supply. This is untrue. Although some regulations, such as urban growth boundaries, can increase housing development costs, other smart growth policies reduce regulations, such as reduced parking requirements and increased allowable density. For example, if urban growth boundaries cause land values to rise from $200,000 to $300,000 per acre, this will be offset if developers can increase density from four to six units per acre.
• Cox ignores transportation costs. Housing is not truly affordable if it has high transportation and utility costs. A detailed study comparing housing and transportation costs in a typical Midwest urban area (CTOD and CNT 2006), found that transportation costs range from about 10% in multi-modal communities up to about 25% in automobile dependent communities. More compact development can also reduce the costs of providing services such as water, sewage and garbage.
• Recent experience indicates that residents of more accessible, multi-modal communities have lower foreclosure rates than otherwise similar households in more sprawled, automobile dependent locations (NRDC 2010). This appears to reflect the lower transportation costs and increased economic residence that results from living in a community with better transport options.
Cox (2011) reiterates his claim that transit-oriented development necessarily increases housing costs. He dismisses the idea that smart growth policies, such as higher allowable density and reduced parking requirements, can reduce development costs, or that affordability should be evaluated based on combined housing and transport costs, although both are widely accepted concepts (Tomalty and Haider 2008). To support this argument he cites one of his own blogs, in which he claims that “methodological problems render the CNT Housing and Transportation Index unreliable for measuring transportation and housing costs.”18 Cox always assumes that higher housing prices in smart growth communities only reflect land supply constraints: he never investigates the alternative hypothesis that growing consumer demand is driving up prices, in which case the best solution is to increase transit-oriented development supply (Reconnecting America 2004). The academic literature indicates that it is possible to create more affordable smart growth communities, which can maximize overall affordability by reducing both housing and transportation costs (FTA 2008; Rauterkus, Thrall and Hangen 2010). My questions for Cox:
1. Do you disagree that affordability should account for both housing and transportation costs? 2. Do you deny that smart growth policies such as more flexible parking requirements and increased
allowable density can reduce housing costs? 3. Can you respond to research showing lower foreclosure rates in smart growth communities?
The First Casualty of a Non-Existent War Victoria Transport Policy Institute
19
Consumer Savings and Affordability My research indicates that high quality transit can provide significant consumer cost savings by allowing households to reduce their vehicle ownership and use. Using the Bureau of Labor Statistic’s Consumer Expenditures Survey I found that, on average, residents of Large Rail city residents devote just 12.0% of their income to transport (vehicle, fuel and transit fares), compared with 15.8% in Small Rail cities, and 14.9% in Bus Only cities. These savings total hundreds of dollars annually and far offset the additional public funding (i.e. taxes) needed to finance high quality transit. Other studies using different geographic scales find similar results (CTOD 2006). Cox criticizes this analysis, claiming that the ACCRA (American Chamber of Commerce Research Association) Cost of Living Index is more accurate. That index is intended to help employers adjust executive wages to reflect local living costs. It compares unit prices (e.g., dollars per gallon of gasoline) of a standard basket of consumer goods typically purchased by wealthy (highest 20% income) households. This is inappropriate for evaluating household affordability for two reasons. First, it fails to account for savings provided by reduced vehicle ownership and fuel consumption. Second, affordability is primarily a concern for low- and middle-income households, so it is inappropriate to evaluate it using high-income household expenditure data. Cox (2010 and 2011) ignores these critical factors, which is either a major error or significantly misrepresents the data. My questions for Cox:
1. Do you deny that reducing vehicle ownership and mileage provides financial savings? 2. Do you think it is appropriate to evaluate affordability using only high income household data? 3. Do you disagree that it is important to inform people reading such analysis that it only applies to
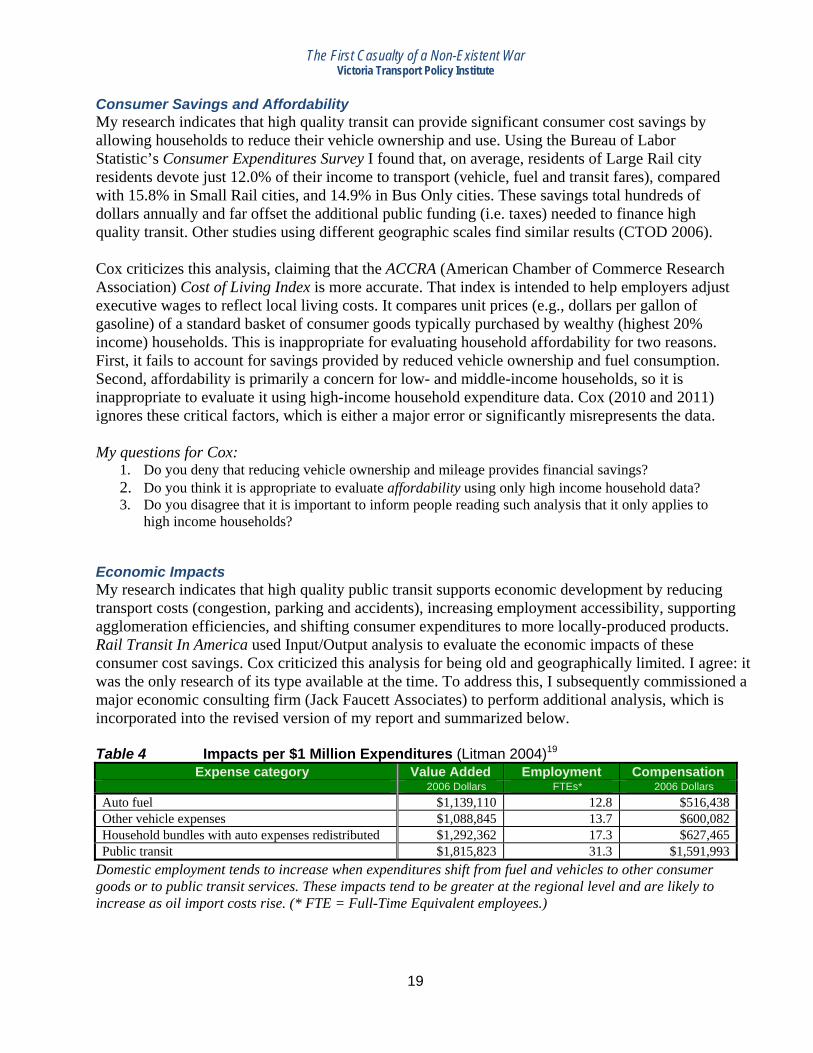
high income households? Economic Impacts My research indicates that high quality public transit supports economic development by reducing transport costs (congestion, parking and accidents), increasing employment accessibility, supporting agglomeration efficiencies, and shifting consumer expenditures to more locally-produced products. Rail Transit In America used Input/Output analysis to evaluate the economic impacts of these consumer cost savings. Cox criticized this analysis for being old and geographically limited. I agree: it was the only research of its type available at the time. To address this, I subsequently commissioned a major economic consulting firm (Jack Faucett Associates) to perform additional analysis, which is incorporated into the revised version of my report and summarized below. Table 4 Impacts per $1 Million Expenditures (Litman 2004)19
Auto fuel $1,139,110 12.8 $516,438Other vehicle expenses $1,088,845 13.7 $600,082Household bundles with auto expenses redistributed $1,292,362 17.3 $627,465Public transit $1,815,823 31.3 $1,591,993
Domestic employment tends to increase when expenditures shift from fuel and vehicles to other consumer goods or to public transit services. These impacts tend to be greater at the regional level and are likely to increase as oil import costs rise. (* FTE = Full-Time Equivalent employees.)
The First Casualty of a Non-Existent War Victoria Transport Policy Institute
20
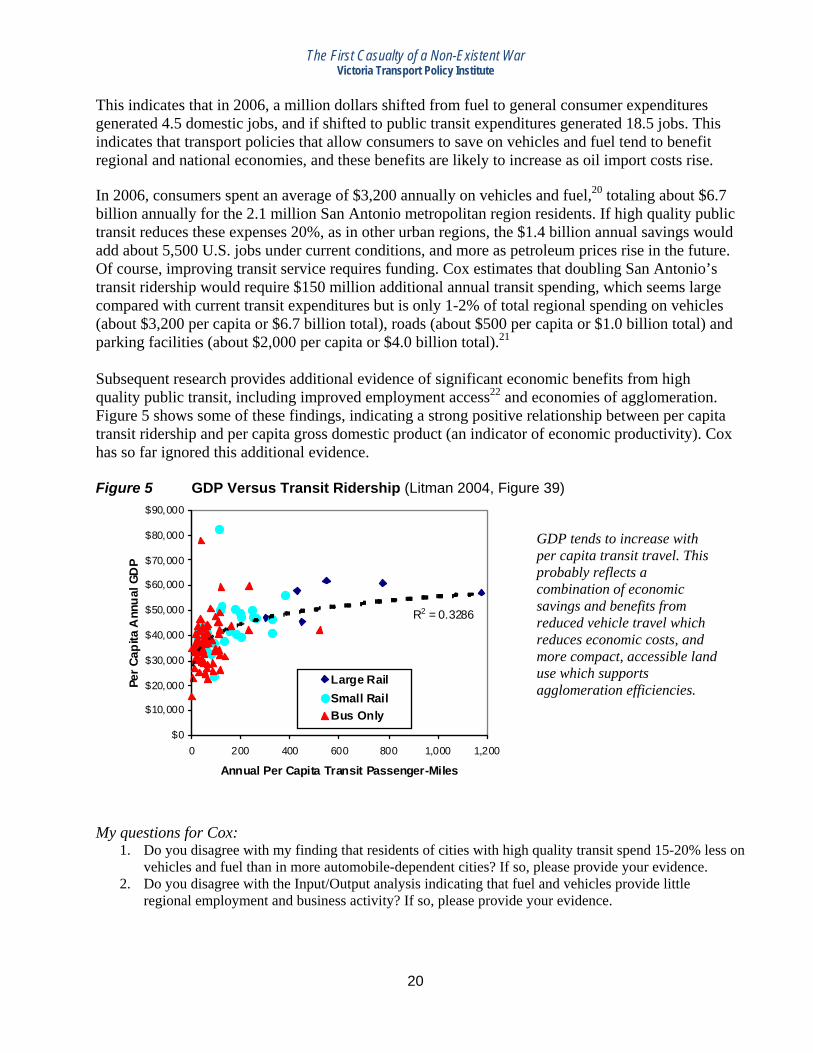
This indicates that in 2006, a million dollars shifted from fuel to general consumer expenditures generated 4.5 domestic jobs, and if shifted to public transit expenditures generated 18.5 jobs. This indicates that transport policies that allow consumers to save on vehicles and fuel tend to benefit regional and national economies, and these benefits are likely to increase as oil import costs rise. In 2006, consumers spent an average of $3,200 annually on vehicles and fuel,20 totaling about $6.7 billion annually for the 2.1 million San Antonio metropolitan region residents. If high quality public transit reduces these expenses 20%, as in other urban regions, the $1.4 billion annual savings would add about 5,500 U.S. jobs under current conditions, and more as petroleum prices rise in the future. Of course, improving transit service requires funding. Cox estimates that doubling San Antonio’s transit ridership would require $150 million additional annual transit spending, which seems large compared with current transit expenditures but is only 1-2% of total regional spending on vehicles (about $3,200 per capita or $6.7 billion total), roads (about $500 per capita or $1.0 billion total) and parking facilities (about $2,000 per capita or $4.0 billion total).21 Subsequent research provides additional evidence of significant economic benefits from high quality public transit, including improved employment access22 and economies of agglomeration. Figure 5 shows some of these findings, indicating a strong positive relationship between per capita transit ridership and per capita gross domestic product (an indicator of economic productivity). Cox has so far ignored this additional evidence. Figure 5 GDP Versus Transit Ridership (Litman 2004, Figure 39)
R2 = 0.3286
$0
$10,000
$20,000
$30,000
$40,000
$50,000
$60,000
$70,000
$80,000
$90,000
0 200 400 600 800 1,000 1,200
Annual Per Capita Transit Passenger-Miles
Per C
apita
Ann
ual G
DP
Large RailSmall RailBus Only
GDP tends to increase with per capita transit travel. This probably reflects a combination of economic savings and benefits from reduced vehicle travel which reduces economic costs, and more compact, accessible land use which supports agglomeration efficiencies.
My questions for Cox:
1. Do you disagree with my finding that residents of cities with high quality transit spend 15-20% less on vehicles and fuel than in more automobile-dependent cities? If so, please provide your evidence.
2. Do you disagree with the Input/Output analysis indicating that fuel and vehicles provide little regional employment and business activity? If so, please provide your evidence.
The First Casualty of a Non-Existent War Victoria Transport Policy Institute
21
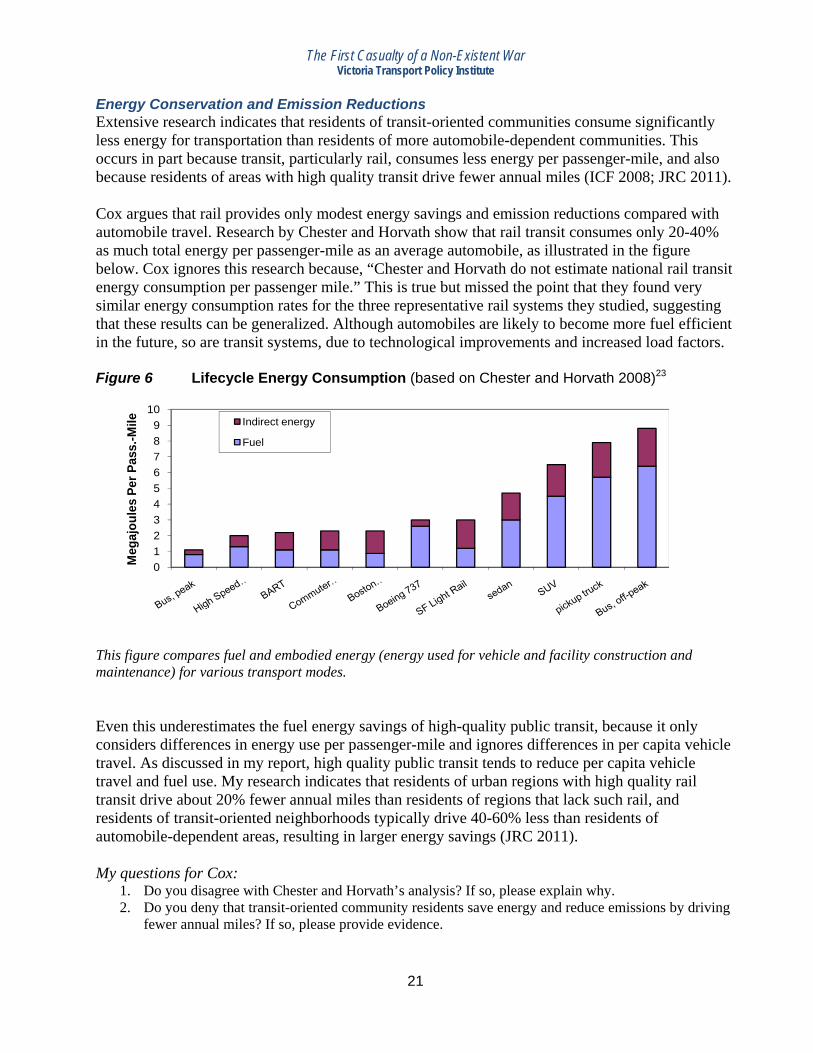
Energy Conservation and Emission Reductions Extensive research indicates that residents of transit-oriented communities consume significantly less energy for transportation than residents of more automobile-dependent communities. This occurs in part because transit, particularly rail, consumes less energy per passenger-mile, and also because residents of areas with high quality transit drive fewer annual miles (ICF 2008; JRC 2011). Cox argues that rail provides only modest energy savings and emission reductions compared with automobile travel. Research by Chester and Horvath show that rail transit consumes only 20-40% as much total energy per passenger-mile as an average automobile, as illustrated in the figure below. Cox ignores this research because, “Chester and Horvath do not estimate national rail transit energy consumption per passenger mile.” This is true but missed the point that they found very similar energy consumption rates for the three representative rail systems they studied, suggesting that these results can be generalized. Although automobiles are likely to become more fuel efficient in the future, so are transit systems, due to technological improvements and increased load factors. Figure 6 Lifecycle Energy Consumption (based on Chester and Horvath 2008)23
0123456789
10
Meg
ajou
les
Per P
ass.
-Mile Indirect energy
Fuel
This figure compares fuel and embodied energy (energy used for vehicle and facility construction and maintenance) for various transport modes. Even this underestimates the fuel energy savings of high-quality public transit, because it only considers differences in energy use per passenger-mile and ignores differences in per capita vehicle travel. As discussed in my report, high quality public transit tends to reduce per capita vehicle travel and fuel use. My research indicates that residents of urban regions with high quality rail transit drive about 20% fewer annual miles than residents of regions that lack such rail, and residents of transit-oriented neighborhoods typically drive 40-60% less than residents of automobile-dependent areas, resulting in larger energy savings (JRC 2011). My questions for Cox:
1. Do you disagree with Chester and Horvath’s analysis? If so, please explain why. 2. Do you deny that transit-oriented community residents save energy and reduce emissions by driving
fewer annual miles? If so, please provide evidence.
The First Casualty of a Non-Existent War Victoria Transport Policy Institute
22
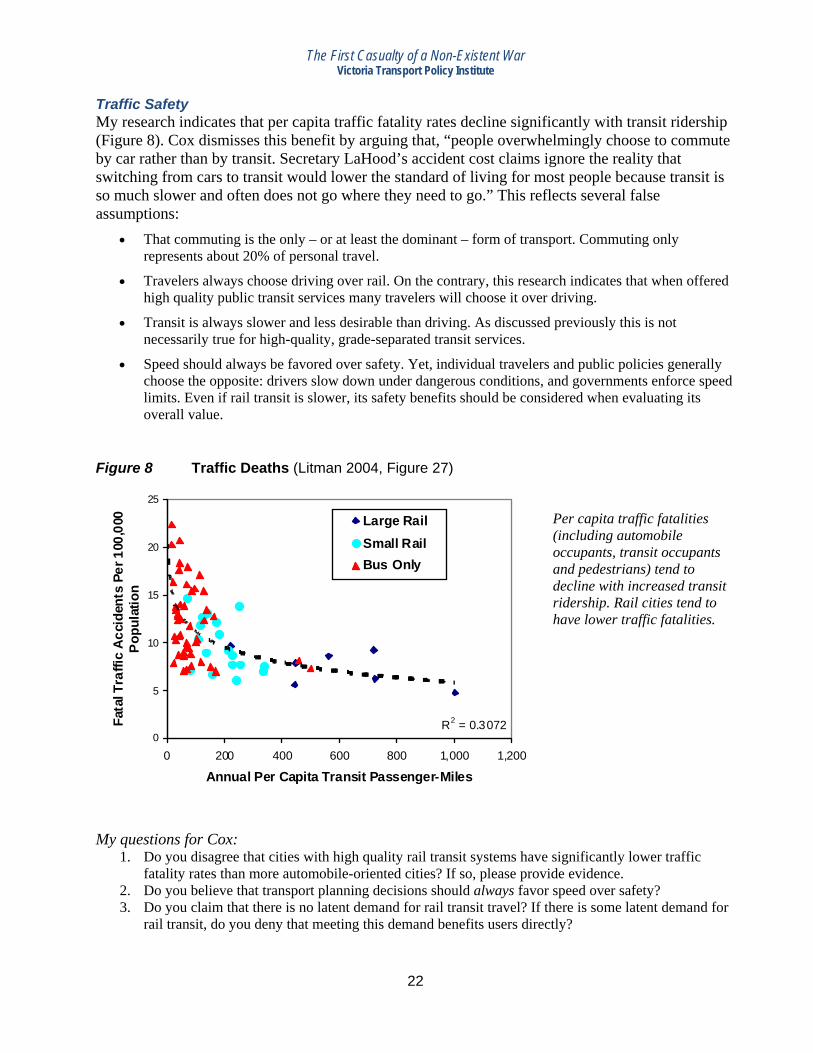
Traffic Safety My research indicates that per capita traffic fatality rates decline significantly with transit ridership (Figure 8). Cox dismisses this benefit by arguing that, “people overwhelmingly choose to commute by car rather than by transit. Secretary LaHood’s accident cost claims ignore the reality that switching from cars to transit would lower the standard of living for most people because transit is so much slower and often does not go where they need to go.” This reflects several false assumptions:
• That commuting is the only – or at least the dominant – form of transport. Commuting only represents about 20% of personal travel.
• Travelers always choose driving over rail. On the contrary, this research indicates that when offered high quality public transit services many travelers will choose it over driving.
• Transit is always slower and less desirable than driving. As discussed previously this is not necessarily true for high-quality, grade-separated transit services.
• Speed should always be favored over safety. Yet, individual travelers and public policies generally choose the opposite: drivers slow down under dangerous conditions, and governments enforce speed limits. Even if rail transit is slower, its safety benefits should be considered when evaluating its overall value.
Figure 8 Traffic Deaths (Litman 2004, Figure 27)
R2 = 0.30720
5
10
15
20
25
0 200 400 600 800 1,000 1,200
Annual Per Capita Transit Passenger-Miles
Fata
l Tra
ffic
Acc
iden
ts P
er 1
00,0
00P
opul
atio
n
Large RailSmall RailBus Only
Per capita traffic fatalities (including automobile occupants, transit occupants and pedestrians) tend to decline with increased transit ridership. Rail cities tend to have lower traffic fatalities.
My questions for Cox:
1. Do you disagree that cities with high quality rail transit systems have significantly lower traffic fatality rates than more automobile-oriented cities? If so, please provide evidence.
2. Do you believe that transport planning decisions should always favor speed over safety? 3. Do you claim that there is no latent demand for rail transit travel? If there is some latent demand for
rail transit, do you deny that meeting this demand benefits users directly?
The First Casualty of a Non-Existent War Victoria Transport Policy Institute
23
Congestion Reduction, Accessibility and Economic Development Several recent peer-reviewed studies indicate that high quality, grade separated public transit tends to reduce traffic congestion on parallel highways (Aftabuzzaman, Currie and Sarvi 2011; Litman 2007). Baum-Snow and Kahn (2005) found significantly lower average commute travel times in areas near rail transit than in otherwise comparable locations that lack rail. Nelson, et al (2006) found significant congestion reductions for motorists from Washington DC’s rail transit systems. Kim, Park and Sang (2008) found that traffic volumes declined on a parallel highway after the Hiawatha LRT line was completed in Minneapolis. Box 3 How High Quality Public Transit Reduces Traffic Congestion When a road is congested, even small reductions in traffic volume can significantly increase travel speeds. For example, on a highway lane with 2,000 vehicles per hour, a 5% reduction in traffic volumes will typically increase travel speed by about 20 miles per hour and eliminate stop-and-go conditions. Similar benefits occur from traffic volume reductions on congested surface streets. Urban traffic congestion tends to maintain equilibrium. If congestion increases, people change routes, destinations, travel times and modes to avoid delay, and if it declines they take additional peak-period vehicle trips. Reducing the point of equilibrium is the only way to reduce long-term congestion. The quality of travel options available affects the level of congestion equilibrium: If alternatives are inferior, motorists will resist shifting mode until congestion becomes severe. If alternatives are attractive, motorists will more readily shift mode, reducing the level of congestion equilibrium. Improving travel options can therefore reduce delay both for travelers who shift modes and those who continue to drive. To attract discretionary riders (travelers who could drive), transit must be fast, comfortable, convenient and affordable. In particular, grade-separated transit provides a speed advantage that tends to attract motorists. When transit is faster than driving, a portion of motorists shift until the highway reaches a new equilibrium (until congestion declines so transit’s time advantage attracts no more motorists). The number of motorists who shift may be small, but is enough to reduce delays. Congestion does not disappear but is never as bad as without the parallel grade-separated transit service. Cox (2010) claims, based on his own not-peer-reviewed research, that public transit provides little congestion reduction benefit. His analysis makes the following errors:24
• It measures congestion using a travel time index and the INRIX traffic congestion scorecard which measure the intensity of congestion for motorists, but fails to account for the congestion costs avoided by travelers who use public transit rather than driving, or if more compact development reduces average trip lengths. Per capita congestion costs is therefore a more appropriate indicator.
• It uses overall average regional transit travel speeds rather than actual rail transit travel speeds. Because it is grade separated, rail transit is often faster than driving under urban-peak conditions.
• It assumes that transit costs, service and congestion reductions all increase proportionately. But shifting a small portion of total regional trips from automobile to transit can provide large congestion reductions if this occurs on major congested corridors.
My questions for Cox:
1. Do you disagree that grade-separated transit travel is sometimes faster than driving? 2. Do you disagree with my conclusion that annual per capita delay is a better indicator of congestion
costs than the travel time index? If so, please explain why.
The First Casualty of a Non-Existent War Victoria Transport Policy Institute
24
Insufficiently Vetted and Outdated Cox (2011) criticizes Rail Transit In America for being “insufficiently vetted and dated.” In fact, my report was initially peer reviewed, and summary articles based on this research were published in two major peer-review journals (Litman 2005 and 2007), the Transportation Research Record, which is the official journal of the Transportation Research Board, a division of the National Academy of Sciences, and Transport Policy, which is the official journal of the World Conference on Transport Research (WCTR), a leading international research organization. Since 2006 my report has included the following statement on the front page:
A condensed version of this report was published as, “Impacts of Rail Transit on the Performance of a Transportation System,” Transportation Research Record 1930, 2005, pp. 23-29.
This criticism is particularly ironic because Mr. Cox seldom or never publishes peer reviewed documents, while in a typical year I publish about a dozen. After I pointed this out, Cox (2011) reversed his position. Instead of demanding peer review, he now questions its value, stating, “Peer review is not without error and peer-reviewed papers are not anointed with ex cathedra status.” My questions for Mr. Cox:
1. Were you aware that summaries of Rail Transit In America were published in professional journals when you concluded that it was insufficiently vetted?
2. Now that you are aware of that fact, do you still believe the report is insufficiently vetted? 3. What level of peer review do you demand for such research? Can you meet that standard yourself?
It is true that the report is now six years old and much of the data is older, but that is the nature of such research: I used the most recent available data sets. There is no reason to think that the basic relationships between public transit service quality, residents’ motor vehicle ownership and travel, and impacts such as per capita traffic fatalities and transport expenditures would change significantly. Many studies cited in Washington’s War On Cars are older. For example, footnote 42 cites a 1998 report, and footnote 49 cites a 1999 report. My questions for Cox:
1. At what age do you consider a data set or study outdated? 2. Are you willing to apply that standard to your own research?
Straw Man Cox (2010) argues that, “The APTA report sets up a ‘straw man’ to suggest how costs would differ in urban areas if rail transit service did not exist.” This is wrong. Rail Transit In America compares actual transport system performance (congestion costs, accident rates, consumer spending, transit cost recovery, etc.) between cities. The methodology is virtually identical to many of Cox’s studies. No speculation is applied. Cox (2011) subsequently defends his “straw man” statement, although I cannot understand why, since it adds nothing to this debate. My questions for Cox:
1. How does my analysis differ from the city-to-city comparisons in your own reports?
The First Casualty of a Non-Existent War Victoria Transport Policy Institute
25
Geographic Definitions Cox argues, “APTA is imprecise and inconsistent about what it means by ‘city,’ which, depending on the element of analysis, may be ‘metropolitan area,’ ‘urban area’ (urbanized area), or a core municipality, each of which has a distinct meaning. Valid research requires appropriate labeling.” It is true that the statistics used for analysis in Rail Transit In America vary geographically. For example, FHWA Urban Areas differ from U.S. Census Metropolitan Statistical Areas, which differ from FTA Transit Service Areas. However, these differences are indicated in the report and its references, and do not affect the analysis. Although the data sets use different geographic units, each comparison uses the same unit. Cox is correct that sometimes it would be more accurate to use the term metropolitan region or urban region rather than city, so I revised the report for greater clarity. Cox tries to make this a major issue, even including a detailed comparison of wording between earlier and revised report versions, but this argument is irrelevant, it has no bearing on the analysis or conclusions. Anti-Bus Footnote 4 states, “Oddly, it appears that a principal objective of the APTA report is to demonstrate the ineffectiveness of buses as a mode of transport. The report routinely places cities that rely heavily on bus transit in an unfavorable light compared to rail urban areas.” This is untrue. Although my research indicates that rail transit tends to attract a relatively large portion of discretionary riders (people who would otherwise travel by automobile) and tends to have large impacts on land use development (i.e., rail transit stations often provide a catalyst for more compact, mixed, pedestrian-oriented neighborhoods), it is not anti-bus. Rather, it indicates the value of high quality public transit, reflecting attributes such as vehicle and station comfort, service frequency and speed, user information, and integration into a community (such as good walkability around stations). My research shows that urban regions with high quality rail transit also tend to have more total bus transit, indicating that these modes are complements rather than competitors. My report includes a section titled “Rail Versus Bus Transit” which clearly discusses the relative merits of bus and rail, and the situations in which each is most appropriate. It states,
“This is not to degrade bus transit. Rail and bus are complementary; rail is only appropriate on major corridors and relies on bus transit as feeder service. Bus systems can be designed with many of the attributes that attract discretionary travelers (grade separation, attractive vehicles, attractive stations that provide a catalyst for transit oriented development), and so can provide congestion, accident and emission reduction benefits. Many of the transit encouragement strategies encourage bus as well as rail ridership.”
In fact, I am a strong supporter of both bus and rail transit systems. I am a coauthor of the Bus Rapid Transit Planning Guide (Wright 2007) and am honored to have helped establish BRT systems in South African cities in preparation for the 2010 World Cup.25 My questions for Cox:
1. Do you consider all research concerning rail transit benefits to be inherently anti-bus? 2. What exactly in my study is anti-bus?
The First Casualty of a Non-Existent War Victoria Transport Policy Institute
26
New York City’s Influence On page 2 Cox states, “APTA’s large-rail urban-area classification is principally a measure of rail’s impact in New York City (not the New York urban or metropolitan areas) rather than in large-rail urban areas outside New York.” This statement is untrue. Because other critics have made this claim, a few years ago I reanalyzed the data excluding New York and published the results in subsequent versions of Rail Transit In America, as summarized in the following Figure. This analysis indicates that the inclusion of New York does not significantly affect results. With and without New York, the “Large Rail” cities have substantially higher transit ridership and cost recovery, and much lower consumer costs and traffic fatalities. Figure 7 New York Impacts on Analysis Results (Litman 2004, Figure 38 and Table 16)
Critics claim that rail transit benefit analysis is distorted by including New York City, but excluding New York (light red versus dark red) has little effect on results. Cox (2011) subsequently defends this claim, pointing out that despite the City of New York having only 3% of national employment, the city has more than 60% of the nation’s rail commutes. But this is irrelevant. My research shows that regardless of whether or not New York is included in analysis, urban regions with high quality public transport have far better transport system performance than more automobile-dependent cities. My questions for Cox:
1. Did you analyze any of the data from my report before reaching your conclusion that New York dominates the differences between Large Rail and other city categories?
2. How do you reconcile your statement with the evidence above?
The First Casualty of a Non-Existent War Victoria Transport Policy Institute
27
Summary My report, Rail Transit In America, and other peer-reviewed research indicate that urban regions with high quality public transit systems have lower per capita vehicle mileage, congestion costs, traffic fatalities, consumer costs, energy consumption and pollution emissions, plus improved accessibility for non-drivers, higher transit cost recovery, more local economic activity, and more walking and cycling activity, compared with more automobile dependent areas. Cox attacks this research but his criticisms violate basic principles of analysis and debate. He misrepresents issues and data, and relies largely on his own and colleagues’ not-peer-reviewed studies. The table below summarizes his criticisms, and my critiques. Table 5 Critique of Cox’s Criticisms
Issue Cox’s Criticism My Critique
Vehicle travel impacts
Public transit, particularly new rail systems, cannot attract motorists
Numerous studies indicate that high quality transit does attract discretionary travelers, and with supportive land use policies will leverage additional VMT reductions. Cox’s evidence is weak and ignores leverage effects.
Cost efficiency
Public transit has excessive costs and declining cost efficiency (increasing cents per passenger-mile).
High quality transit has high construction but lower operating costs than basic transit, and provides many benefits which offset any additional costs. Cox exaggerates transit costs and ignores many benefits.
Consumer preferences
Most people prefer automobile travel and automobile-dependent communities.
Many people cannot drive and current demographic and economic trends are increasing demand for alternative modes and transit-oriented development. Providing high quality public transit responds to this demand.
Economic benefits
Purported benefits are minuscule and unachievable, and offset by additional transit service costs.
Cox only considers a small portion of transit economic benefits. Subsequent analysis indicates even greater benefits than originally estimated.
Energy savings
USDOE data indicate small differences between auto and transit energy use. Future cars will be even more efficient.
Cox ignores new research on lifecycle energy consumption and the energy savings provided by vehicle travel reductions. He ignores future transit energy efficiency improvements.
Congestion cost savings
Work trip travel times are longer in large-rail metropolitan areas.
Many studies indicate that high quality, grade separated transit reduces congestion costs.
Consumer transportation cost savings
Transportation (and housing) costs are higher, not lower, in large rail metropolitan areas.
Many studies indicate that high quality transit provides large consumer savings, particularly for lower-income households. Cox uses data that ignore these impacts.
Road and parking savings
The estimates are invalid because they are based upon automobile driver attraction rates far beyond the levels indicated by experience.
Multiple data sources indicate that 50-80% of rail trips substitute for driving, and transit-oriented development reduces per capita vehicle ownership and use, providing road and parking facility cost savings.
Accident cost savings
Purported savings are insufficient to deter households from using cars to achieve important economic and other benefits.
This is a non-sequitur. Only if high quality transit service is available can people choose it, and experience indicates they will. Safety benefits are large and provide another justification for high quality transit.
The two left columns are from Cox’s paper. The right column is my critique. Cox misrepresents issues and data, ignores impact categories, and relies largely on his own studies that lack peer review.
The First Casualty of a Non-Existent War Victoria Transport Policy Institute
28
Conclusions Automobile transportation can provide significant benefits to users and society, but it cannot serve all users, and imposes significant economic, social and environmental costs. Current demographic and economic trends are increasing demand for alternative modes. It therefore makes sense in some situations to shift resources (money and road space) previously dedicated to automobile travel to other modes, and in other ways to develop a more diverse and efficient transport system. These changes are widely supported by organizations representing diverse interests, ranging from transportation engineers to public health officials and retired people. Some Americans fear these changes. Many lead automobile-dependent lifestyles. They associate automobile ownership and use with economic success, convenience and comfort. They have never experienced an efficient, multi-modal transport system. As a result, they assume that such changes will harm them overall. Some people and groups exploit this fear by claiming that a “war against cars” will impose unjustified restrictions on automobile travel. No such war exists. Evidence of a war consists of exaggerated objections to policies such as traffic calming (which increases traffic safety), busways and bike lanes (justified to improve transport options, which helps reduce traffic and parking congestion), and more efficient road and parking pricing (justified to reduce traffic and parking problems, and finance facilities). These policies benefit motorists. Critics apply a double standard: They claim it is unfair to spend motor vehicle user fee revenues on other modes, but ignore the much larger subsidies motorists receive in the form of roads and parking facilities financed by general taxes and building rents. There is plenty of legitimate debate over particular transport policies and projects, but it is inaccurate and harmful to call such disagreements a war. Declaring war justifies destructive and dishonest actions, and forces people to choose sides, yet most people are neither pro- nor anti-car. They recognize that automobiles provide significant benefits but cannot meet everybody’s needs, and impose significant costs. Although few motorists want to stop driving altogether, many would prefer to drive less and rely more on walking, cycling and public transport, provided those alternatives are convenient, comfortable, safe and affordable. As a result, rational people should support a sensible compromise, which includes accommodation of automobile travel with reasonable restrictions to minimize external costs, and improvements to alternative modes to create a more diverse and efficient transport systems. A good example of the distortions promulgated by advocates of war is Wendell Cox’s paper, Washington’s War on Cars and the Suburbs: Secretary LaHoods False Claims on Roads and Transit. This paper attacks the USDOT’s livability initiative and my research because they support alternative modes and transit-oriented development. Cox’s criticism violates basic principles of analysis and debate, misrepresents issues and data, and relies largely on his own and colleagues’ not-peer-reviewed studies. This report provides a detailed critique of these criticisms. I will leave it to readers to reach their own conclusions about the merits of these arguments.
The First Casualty of a Non-Existent War Victoria Transport Policy Institute
29
References AARP (2005), Livable Communities: An Evaluation Guide, AARP Public Policy Institute (http://assets.aarp.org); at http://assets.aarp.org/rgcenter/il/d18311_communities.pdf. ABW (2010), Bicycling and Walking in the U.S.: 2010 Benchmarking Report, Alliance for Biking & Walking (www.peoplepoweredmovement.org); at www.peoplepoweredmovement.org/site/index.php/site/memberservices/C529. Md Aftabuzzaman, Graham Currie and Majid Sarvi (2011), “Exploring The Underlying Dimensions Of Elements Affecting Traffic Congestion Relief Impact Of Transit,” Cities, Vol. 28, Is. 1 (www.sciencedirect.com/science/journal/02642751), February, Pages 36-44. APHA (2010), The Hidden Health Costs of Transportation: Backgrounder, American Public Health Association (www.apha.org); at www.apha.org/advocacy/reports/reports. APTA (2007), A Profile of Public Transportation Passenger Demographics and Travel Characteristics Reported in On-Board Surveys, American Public Transportation Association (www.apta.com); at www.apta.com/resources/statistics/Documents/transit_passenger_characteristics_text_5_29_2007.pdf. G.B. Arrington and Kimi Iboshi Sloop (2010), “New Transit Cooperative Research Program Research Confirms Transit-Oriented Developments Produce Fewer Auto Trips,” ITE Journal (www.ite.org), Vol. 79, No. 6, June, pp. 26-29. Nathaniel Baum-Snow and Matthew E. Kahn (2005), The Effects of Urban Rail Transit Expansions: Evidence from Sixteen Cities, 1970 to 2000, Brookings Papers on Urban Affairs (www.econ.brown.edu/fac/Nathaniel_Baum-Snow/brook_final.pdf). CDC (2010), CDC Transportation Recommendations, Center for Disease Control and Prevention (www.cdc.gov/transportation/default.htm). Mikhail Chester and Arpad Horvath (2008), Environmental Life-cycle Assessment of Passenger Transportation, UC Berkeley Center for Future Urban Transport, (www.its.berkeley.edu/volvocenter/), Paper vwp-2008-2; at www.sustainable-transportation.com. Wendell Cox (2010), Washington’s War on Cars and the Suburbs: Secretary LaHoods False Claims on Roads and Transit, Heritage Foundation (www.heritage.org); at http://thf_media.s3.amazonaws.com/2010/pdf/SR0079.pdf. Wendell Cox (2011) Urban Transportation Policy Requires Factual Foundations, Heritage Foundation (www.heritage.org); at http://heritage.org/Research/Reports/2011/02/Urban-Transportation-Policy-Requires-Factual-Foundations. CTOD (2006), Preserving and Promoting Diverse Transit-Oriented Neighborhoods, Center for Transit-Oriented Development, funded by the Ford Foundation (www.reconnectingamerica.org); at www.cnt.org/repository/diverseTOD_FullReport.pdf. CTOD and CNT (2006), The Affordability Index: A New Tool for Measuring the True Affordability of a Housing Choice, Center for Transit-Oriented Development and the Center for Neighborhood Technology, Brookings Institute (www.brookings.edu/metro/umi/20060127_affindex.pdf).
The First Casualty of a Non-Existent War Victoria Transport Policy Institute
30
CTS (2009), Understanding the Impacts of Transitways: Demographic and Behavioral Differences between Hiawatha Light-Rail and Other Transit Riders, Center for Transportation Studies, University of Minnesota (www.cts.umn.edu/Research/Featured/Transitways). CTS (2010), How Light-Rail Transit Improves Job Access for Low-Wage Workers, Transitway Impacts Research Program (TIRP), Center for Transportation Studies, University of Minnesota (www.cts.umn.edu/Research/Featured/Transitways). Eric De Place (2011), “War On Cars”: A History, Sightline Institute (www.sightline.org); at http://daily.sightline.org/daily_score/archive/2011/01/03/war-on-cars-a-history. FHWA (2008), Travel Demand Management Toolbox, Office of Operations, Federal Highway Administration (http://ops.fhwa.dot.gov); at http://ops.fhwa.dot.gov/tdm/toolbox.htm. FTA (2008), Better Coordination of Transportation and Housing Programs to Promote Affordable Housing Near Transit, Federal Transit Administration, USDOT and Department of Housing and Urban Development; at www.huduser.org/Publications/pdf/better_coordination.pdf. Yonah Freemark (2010), Transit Mode Share Trends Looking Steady; Rail Appears to Encourage Non-Automobile Commutes, The Transport Politic (www.thetransportpolitic.com); at www.thetransportpolitic.com/2010/10/13/transit-mode-share-trends-looking-steady-rail-appears-to-encourage-non-automobile-commutes. John Gard (2007), “Innovative Intermodal Solutions for Urban Transportation Paper Award: Quantifying Transit-Oriented Development’s Ability To Change Travel Behavior,” ITE Journal (www.ite.org), Vol. 77, No. 11, November, pp. 42-46. Lyndon Henry and Todd Litman (2006), Evaluating New Start Transit Program Performance: Comparing Rail And Bus, Victoria Transport Policy Institute (www.vtpi.org); at www.vtpi.org/bus_rail.pdf. ICF (2008), The Broader Connection between Public Transportation, Energy Conservation and Greenhouse Gas Reduction, American Public Transportation Association (www.apta.com). ICF (2010), Current Practices in Greenhouse Gas Emissions Savings from Transit: A Synthesis of Transit Practice, TCRP 84, TRB (www.trb.org); at http://onlinepubs.trb.org/onlinepubs/tcrp/tcrp_syn_84.pdf. ITE (2010), Smart Growth Transportation Guidelines, Recommended Practice, Institute of Transportation Engineers (www.ite.org); at www.ite.org/emodules/scriptcontent/Orders/ProductDetail.cfm?pc=RP-032A. JRC (2011), Location Efficiency and Housing Type—Boiling it Down to BTUs, Jonathan Rose Companies for the U.S. Environmental Protection Agency (www.epa.gov); at www.epa.gov/smartgrowth/pdf/location_efficiency_BTU.pdf. Jeff Kenworthy (2008), “An International Review of The Significance of Rail in Developing More Sustainable Urban Transport Systems in Higher Income Cities,” World Transport Policy & Practice, Vol. 14, No. 2 (www.eco-logica.co.uk); at www.eco-logica.co.uk/pdf/wtpp14.2.pdf. Changchoo Kim, Yong-Seuk Park and Sunhee Sang (2008), Spatial and Temporal Analysis of Urban Traffic Volume, 2008 ESRI International User Conference; at http://gis.esri.com/library/userconf/proc08/papers/papers/pap_1613.pdf.
The First Casualty of a Non-Existent War Victoria Transport Policy Institute
31
Ugo Lachapelle, et al. (2011), “Commuting by Public Transit and Physical Activity: Where You Live, Where You Work, and How You Get There,” Journal of Physical Activity and Health (http://journals.humankinetics.com/jpah), Vol. 8, Supplement 1, pp. S72-S82; at http://journals.humankinetics.com/JPAH-supplements-special-issues/jpah-volume-8-supplement-january. Ray LaHood (2010), “Public Transportation Delivers Public Benefits,” Welcome to the Fast Lane: The Official Blog of the U.S. Secretary of Transportation, U.S. Department Of Transportation; at http://fastlane.dot.gov/2009/06/public-transportation-delivers-public-benefits.html. Bradley W. Lane (2008), “Significant Characteristics Of The Urban Rail Renaissance In The United States: A Discriminant Analysis,” Transportation Research A, Vol. 42, Issue 2 (www.elsevier.com/locate/tra), pp. 279-295. Todd Litman (2003), Evaluating Research Quality, VTPI (www.vtpi.org); at www.vtpi.org/resqual.pdf. Todd Litman (2004), Rail Transit In America: Comprehensive Evaluation of Benefits, VTPI (www.vtpi.org); at www.vtpi.org/railben.pdf. Todd Litman (2005), “Impacts of Rail Transit on the Performance of a Transportation System,” Transportation Research Record 1930, Transportation Research Board (www.trb.org), pp. 23-29. Todd Litman (2006), The Future Isn’t What It Used To Be, VTPI (www.vtpi.org); at www.vtpi.org/future.pdf; published as “Changing Travel Demand: Implications for Transport Planning,” ITE Journal, Vol. 76, No. 9, (www.ite.org), September 2005, pp. 27-33. Todd Litman (2007), “Evaluating Rail Transit Benefits: A Comment,” Transport Policy, Vol. 14, No. 1 (www.elsevier.com/locate/tranpol), January, pp. 94-97; updated version at www.vtpi.org/cong_reliefII.pdf. Todd Litman (2008a), Evaluating Rail Transit Criticism, Victoria Transport Policy Institute (www.vtpi.org); at www.vtpi.org/railcrit.pdf. Todd Litman (2008b), Evaluating Criticism of Smart Growth, VTPI (www.vtpi.org); at www.vtpi.org/sgcritics.pdf. Todd Litman (2009), Transportation Cost and Benefit Analysis, Victoria Transport Policy Institute (www.vtpi.org/tca). Todd Litman (2010), Where We Want To Be: Home Location Preferences And Their Implications For Smart Growth, Victoria Transport Policy Institute (www.vtpi.org); at www.vtpi.org/sgcp.pdf. Catherine Lutz and Anne Lutz Fernandez (2010), Carjacked: The Culture Of The Automobile And Its Effects On Our Lives, Palgrave Macmillan (http://us.macmillan.com/carjacked). Glenn Lyons, Juliet Jain and David Holley (2007), “The Use Of Travel Time By Rail Passengers In Great Britain,” Transportation Research A, Vol. 41, No. 1, Jan. 2007, pp. 107-120. Arthur C. Nelson, Rolf Pendall, Casy Dawkins and Gerrit Knaap (2002), The Link Between Growth Management and Housing Affordability: The Academic Evidence, Brookings Institution Center on Urban
The First Casualty of a Non-Existent War Victoria Transport Policy Institute
32
and Metropolitan Policy (www.brook.edu); at www.brookings.edu/es/urban/publications/growthmanagexsum.htm. Peter Nelson, Andrew Baglino, Winston Harrington, Elena Safirova and Abram Lipman (2006), Transit in Washington, D.C.: Current Benefits and Optimal Level of Provision, Resources for the Future (www.rff.org); at www.rff.org/rff/Documents/RFF-DP-06-21.pdf. Arthur C. Nelson (2009), The New Urbanity: The Rise of a New America, University of Utah Metropolitan Research Center; summary at www.froogalizer.com/news/research-on-homeownership-rate-through-2030.html; and The Next $40 Trillion: Texas Trends (www.texasarchitect.org/texastrends.ppt). Newspaper (2010), “Transportation Secretary Endorses Anti-Car Agenda,” The Newspaper: A Journal of the Politics of Driving (www.thenewspaper.com/news/27/2789.asp). Edward Niedermeyer (2010), Review of “Carjacked: The Culture Of The Automobile And Its Effects On Our Lives” for the car enthusiasts’ website The Truth About Cars (www.thetruthaboutcars.com); at www.thetruthaboutcars.com/2010/02/book-review-carjacked-the-culture-of-automobiles-and-its-effects-on-our-lives. NRDC (2010), Reducing Foreclosures and Environmental Impacts through Location-Efficient Neighborhood Design, Natural Resources Defense Council (www.nrdc.org); at www.nrdc.org/energy/files/LocationEfficiency4pgr.pdf. David Prichard (2007), Notes on Newman and Kenworthy, The Land Use-Transport Connection, http://davidpritchard.org/sustrans/NewKen96. Rémy Prud’homme and Chang-Woon Lee (1998), “Size, Sprawl, Speed and the Efficiency of Cities,” Observatoire de l’Économic et des Institutions Locals; at www.rprudhomme.com/resources/Prud$27homme+$26+Lee+1999.pdf. Stephanie Y. Rauterkus, Grant I. Thrall and Eric Hangen (2010), “Location Efficiency and Mortgage Default,” Journal of Sustainable Real Estate (www.costar.com/josre/default.htm), Vol. 2, No. 1, pp. 117-141; at www.costar.com/uploadedFiles/JOSRE/JournalPdfs/06.117_142.pdf. Reconnecting America (2004), Hidden In Plain Sight: Capturing The Demand For Housing Near Transit, Center for Transit-Oriented Development; Reconnecting America (www.reconnectingamerica.org) for the Federal Transit Administration (www.fta.dot.gov); at www.reconnectingamerica.org/pdfs/Ctod_report.pdf. John L. Renne (2005), Transit-Oriented Development: Measuring Benefits, Analyzing Trends, And Evaluating Policy, Dissertation, Rutgers State University; at http://gradworks.umi.com/31/95/3195744.html. Thomas W. Sanchez (1999), “The Connection Between Public Transit and Employment,” Journal of the American Planning Association, Vol. 65, No. 3, Summer, pp. 284-296. John Schumann (2005), “Assessing Transit Changes in Columbus, Ohio, and Sacramento, California: Progress and Survival in Two State Capitals, 1995-2002,” Transportation Research Record 1930, TRB (www.trb.org), pp. 62-67. Subsidy Scope (2009), Analysis Finds Shifting Trends in Highway Funding: User Fees Make Up Decreasing Share Subsidy Scope (www.subsidyscope.com); at www.subsidyscope.com/transportation/highways/funding.
The First Casualty of a Non-Existent War Victoria Transport Policy Institute
33
Ronnie Schreiber (2010), “The War On Cars: Parts 1-6,” Left Lane (www.leftlanenews.com). Clive Thompson (2010), “Clive Thompson to Texters: Park the Car, Take the Bus,” Wired Magazine, March, (www.wired.com); at www.wired.com/magazine/2010/02/st_clive_thompson_texting. Ray Tomalty and Murtaza Haider (2008), Housing Affordability and Smart Growth in Calgary, Plan-It Calgary, City of Calgary (www.calgary.ca); at www.calgary.ca/docgallery/BU/planning/pdf/plan_it/housing_afford_and_smarth_growth_report.pdf. ULI (2009), Beltway Burden: The Combined Cost of Housing and Transportation in the Greater Washington, DC Metropolitan Area, ULI Terwilliger Center for Workforce Housing, Urban Land Institute (www.uli.org); at http://commerce.uli.org/misc/BeltwayBurden.pdf). VTPI (2010), Online TDM Encyclopedia, Victoria Transport Policy Institute (www.vtpi.org/tdm). Richard Wener, Gary W. Evans and Jerome Lutin (2006), Leave The Driving To Them: Comparing Stress Of Car And Train Commuters, American Public Transportation Association (www.apta.com/passenger_transport/thisweek/documents/driving_stress.pdf). Lloyd Wright (2007), Bus Rapid Transit Planning Guide, Institute for Transportation and Development Policy (www.itdp.org/index.php/microsite/brt_planning_guide). Chang Yi (2006), “The Impact of Public Transit on Employment Status: Disaggregate Analysis of Houston, Texas,” Transportation Research Record 1986, TRB (www.trb.org), pp. 137-144; at http://pubsindex.trb.org/view.aspx?id=776961. Jenny Yuen (2009), “Toronto's War On Cars: Toronto Drivers Spend Roughly Two Work-Weeks Per Year Stuck In Traffic On The City's Congested Streets And Highways. And It's Going To Get A Lot Worse ...” Toronto Sun (www.torontosun.com) 17 May 2009; at www.torontosun.com/news/torontoandgta/2009/05/17/9483606-sun.html#/news/torontoandgta/2009/05/17/pf-9483606.html.
The First Casualty of a Non-Existent War Victoria Transport Policy Institute
34
Endnotes 1 Short and Sweet: Analysis of Shorter Trips Using National Personal Travel Survey Data (www.vtpi.org/short_sweet.pdf) 2 For more discussion of these issues see, Evaluating Rail Transit Criticism (www.vtpi.org/railcrit.pdf). 3 Reasonable automobile advocates can support such policies. See, for example, Edward Niedermeyer’s review of “Carjacked: The Culture Of The Automobile And Its Effects On Our Lives” for the car enthusiasts’ website The Truth About Cars (www.thetruthaboutcars.com); at www.thetruthaboutcars.com/2010/02/book-review-carjacked-the-culture-of-automobiles-and-its-effects-on-our-lives. 4 See Carfree Cities website (www.carfree.com). 5 I continually update this report as new information becomes available, so the current version is no longer “2004”. However, I will continue to use that designation in this paper, since that is the reference used in Cox and my correspondence. 6 My original study, Rail Transit In America, used the term “Large Rail Cities” in referenced to urban regions with public transit systems that have the following features: serve a major portion of destinations, particularly worksites; provide frequent and relatively fast service; are well integrated into communities with walkable, mixed-use, transit-oriented neighborhoods around stations. Currently, all such U.S. urban areas have large rail transit systems, but there is no inherent reason that similar service levels cannot be provided by extensive bus rapid transit (BRT) systems, so I emphasize that the key issue is transit service quality rather than vehicle design. As discussed later, Cox inaccurately argues that my research is “anti-bus.” 7 This issue is discussed in detail in Arrington and Sloop (2010), and the revised version of Rail Transit In America. 8 In endnote #22, Cox claims that a paper by Alain Bertaud, “shows the insurmountable challenges faced by transit in attempting to serve low-density or polycentric urban areas (such as exist in the United States) and that reconfiguring such urban areas for transit use would be impractical.” Bertaud’s paper shows nothing of the sort. It does imply that regulations alone generally have modest impacts on development policies, but it indicates that investments such as high quality transit, coupled with local policies that support transit-oriented development, certainly can influence the type of city that develops. 9 In this case he probably means portion rather than number, since the data indicate mode share not number of trips. 10 1960-90 data at www.census.gov/population/socdemo/journey/mode6790.txt. 2009 data from “Commuting Characteristics by Sex,” American Community Survey (http://factfinder.census.gov/servlet/STSelectServlet?_lang=en&_ts=317575780015). 11 FHWA (2000 and 2008), "Urbanized Area Summaries, Selected Characteristics: Table HM72," Highway Statistics, Federal Highway Administration (www.fhwa.dot.gov/ohim/hs00/xls/hm72r.xls and www.fhwa.dot.gov/policyinformation/statistics/2008/hm72.cfm. 12 See reviews of this literature in CTS 2009; Henry and Litman 2006; Lane 2008; Schumann 2005. It is important to note that travel impacts can vary widely depending on specific circumstances, particularly the degree that transit is integrated into a community through supportive land use development policies. For example, Freemark (2010) found that new rail transit systems in Texas were less successful at attracting automobile commuters than new rail transit systems in other states, presumably because of less supportive land use policies. 13 APTA (2009), Public Transportation Fact Book, American Public Transportation Association (www.apta.com/gap/policyresearch/Documents/APTA_2009_Fact_Book.pdf). 14 See criticisms in Haynes Goddard (2009), A Review of “On the Social Desirability of Urban Rail Systems” by C. Winston and V. Maheshrib, Department of Economics, University of Cincinnati; at www.vtpi.org/goddard.pdf; Todd Litman (2008), Evaluating Rail Transit Criticism, Victoria Transport Policy Institute (www.vtpi.org); at www.vtpi.org/railcrit.pdf; Ian W.H. Parry and Kenneth A. Small (2007), Should Urban Transit Subsidies Be Reduced? Discussion Paper 07-38, Resources for the Future (www.rff.org); at www.rff.org/rff/documents/rff-dp-07-38.pdf; Jay Warner (2007), Reassessing 'The Social Desirability of Urban Rail Transit Systems': Critique of Winston and Maheshri, VTPI (www.vtpi.org); at www.vtpi.org/warner.pdf;
The First Casualty of a Non-Existent War Victoria Transport Policy Institute
35
15 This is particularly true of walking and cycling, which many people value as enjoyable, healthy and sociable activities that users consider to have positive rather than negative value. There are few activities more ironic than people driving to a gym to walk on a treadmill or pedal a stationary bicycle. As a result, under favorable conditions the walking or cycling components of a transit trip is not necessarily a cost to users or society. For more discussion see Lachapelle, et al. (2011). Also see Todd Litman (2010), Evaluating Public Transportation Health Benefits, American Public Transportation Association (www.apta.com); at www.vtpi.org/tran_health.pdf. 16 Portland Metro data at http://library.oregonmetro.gov/files//1990-2009_dvmt-portland-us.pdf. 17 William Frey (2010), Bursting Migration Bubble Favors Coastal Metros, Urban Cores, Brookings Institute www.brookings.edu/opinions/2009/0320_census_frey.aspx. 18 Wendell Cox, “The Muddled CNT Housing and Transportation Index,” NewGeography, April 23, 2010, at www.newgeography.com/content/001526-the-muddled-cnt-housing-and-transportation-index. 19 Based on Harry Chmelynski (2008), National Economic Impacts per $1 Million Household Expenditures (2006); Spreadsheet Based On IMPLAN Input-Output Model, Jack Faucett Associates (www.jfaucett.com). 20 BLS (2006), Consumer Expenditure Survey, Bureau of Labor Statistics (www.bls.gov); at ftp://ftp.bls.gov/pub/special.requests/ce/standard/2006/quintile.txt 21 For information on these and other cost estimates see Highway Statistics (www.fhwa.dot.gov/policy/ohpi/hss/hsspubs.cfm) and Transportation Cost and Benefit Analysis (www.vtpi.org/tca). 22 Cox cites a 1998 study by Prud’homme and Lee indicating that improving employment access supports economic development. That study specifically cites high quality rail transit as the most effective way to support such development. 23 From Aurbach, http://pedshed.net/?p=219 24 For more detailed criticism see, Joe Cortright (2010), Driven Apart: How Sprawl is Lengthening Our Commutes and Why Misleading Mobility Measures are Making Things Worse, CEOs for Cities (www.ceosforcities.org); at www.ceosforcities.org/work/driven-apart. Todd Litman (2009), “Congestion Costs,” Transportation Cost and Benefit Analysis; Techniques, Estimates and Implications, Victoria Transport Policy Institute (www.vtpi.org/tca). 25 See my Planetizen blogs, Rea Vaya ("We are Moving") In South Africa (www.planetizen.com/node/41414) and “The Winner Is…” (www.planetizen.com/node/45041).