The First Phase of the U.S. Recovery James Bullard President and CEO Federal Reserve Bank of St. Louis Commerce Bank Economic Breakfast 18 November 2009 Any opinions expressed here are mine and do not necessarily reflect those of other Federal Open Market Committee members.
Transcript
The First Phase of the U.S. Recovery
James BullardPresident and CEOFederal Reserve Bank of St. Louis
Commerce Bank Economic Breakfast18 November 2009
Any opinions expressed here are mine and do not necessarily reflect those of other Federal Open Market Committee members.
Plan For This Talk
The nascent recoveryHow to think about current monetary policyThe regulatory reform debate
Real Gross Domestic Product. Actual and forecasted, percent change from previous quarter at annual rate.
Real GDP GrowthNov-2009 BC ForecastNov-2009 MA Forecast
Percent
Source: Bureau of Economic Analysis, Blue Chip Consensus, Macroeconomic Advisers.
Forecasters See Growth Ahead
Forces Driving the Recovery
Stronger-than-expected global growth, especially in Asia.Recovering consumption expenditure in the U.S.Less stress in financial markets.A stabilizing housing sector.
India8.0, 9.5, 9.0
Growth Rate in Real GDP, SAAR, Percent2009:Q2, 2009:Q3,2009:Q4
Source: Barclays Capital Global Economic Weekly.
Canada-3.4, 0.0, 5.0
U.S.-0.7, 3.5, 4.0
Latin America1.7, 4.5, 5.2
U.K.-2.3, -1.0, 1.7
EU-0.7, 1.8, 2.0
South Africa-3.0, 0.0, 2.2
Russia-2.2, 17.0, 13.7
China16.4, 12.0, 9.6
Japan2.3, 1.9, 2.4
Australia2.5, 2.0, 1.9
Global Growth is Improving
Manufacturing Around The Globe Is Improving
Source: Financial Times and Thomson Reuters Datastream.
Liquidity programs: lending on collateral to mitigate the panic.A near-zero interest rate policy.An asset purchase program, “quantitative easing.”
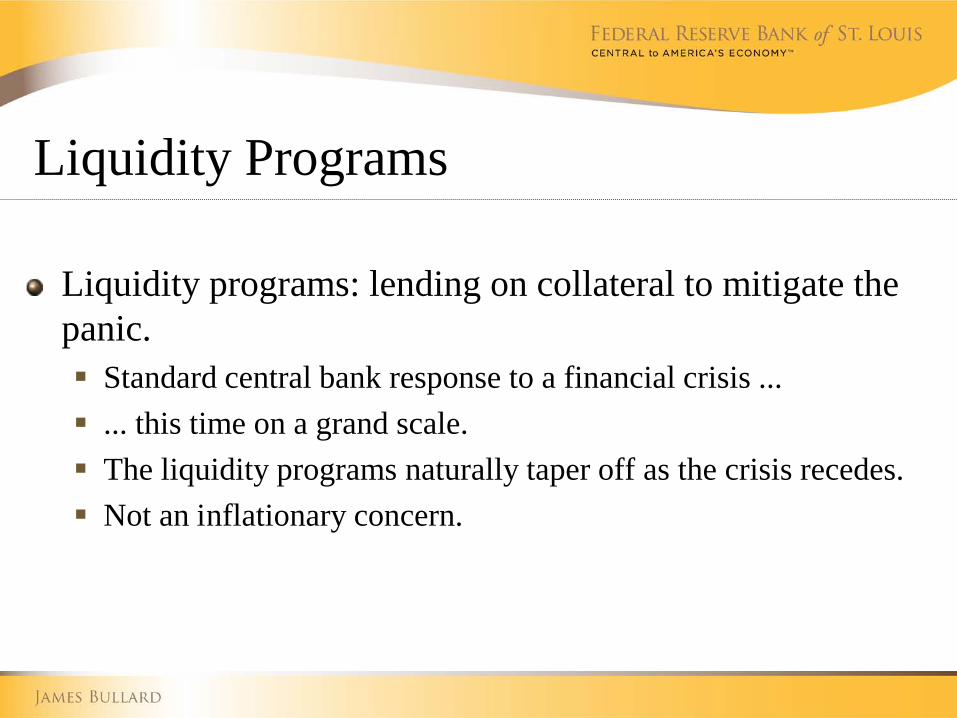
Liquidity Programs
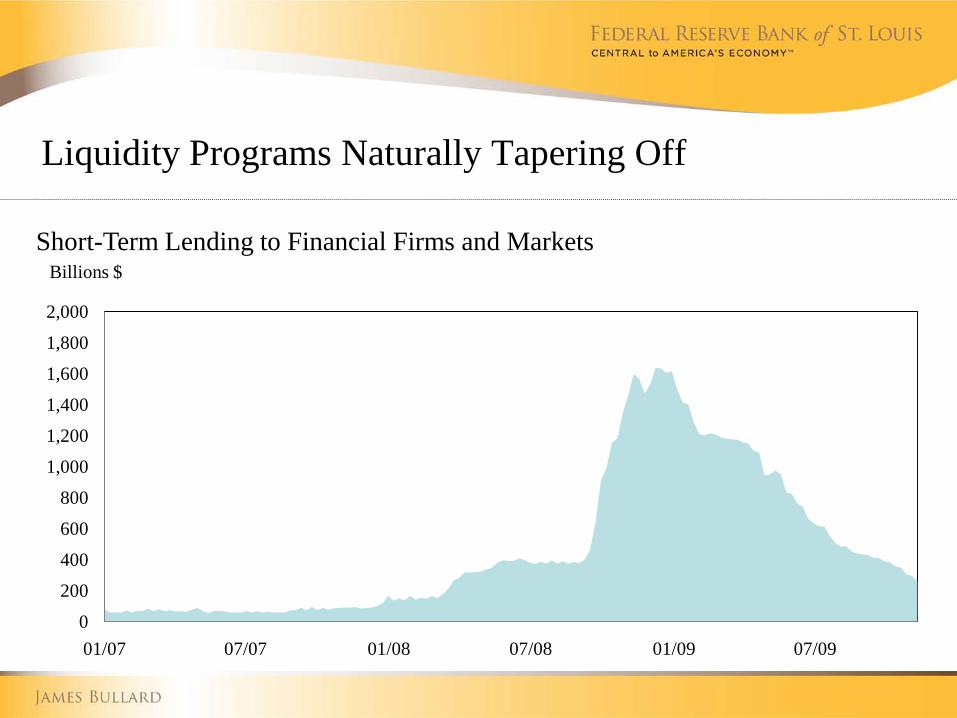
Liquidity programs: lending on collateral to mitigate the panic. Standard central bank response to a financial crisis ... ... this time on a grand scale. The liquidity programs naturally taper off as the crisis recedes. Not an inflationary concern.
0
200
400
600
800
1,000
1,200
1,400
1,600
1,800
2,000
01/07 07/07 01/08 07/08 01/09 07/09
Short-Term Lending to Financial Firms and MarketsBillions $
Liquidity Programs Naturally Tapering Off
0
1
2
3
4
5
6
Jan-07 Jul-07 Jan-08 Jul-08 Jan-09 Jul-09
U.K.
Euro Area
Canada
U.S.Japan
Rate (%)
Near-Zero Policy Rates in the G-7
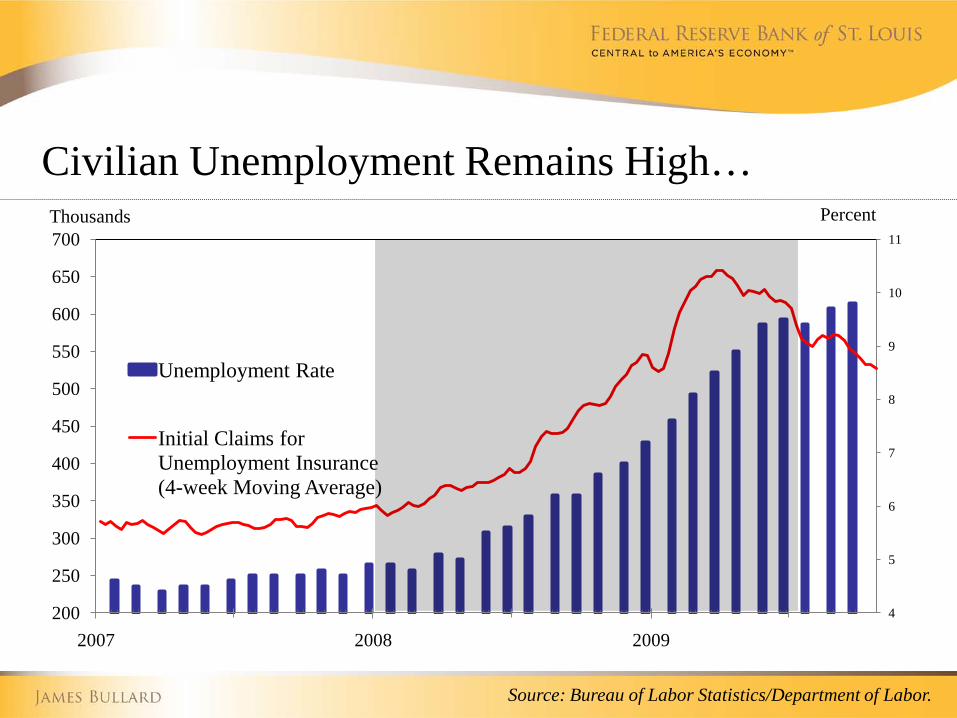
A Near-Zero Policy Rate
A near-zero interest rate policy Past two recessions: 2.5 - 3.0 years after the recession end before
policy rate increases began. The “too low for too long” argument may weigh heavily on the
FOMC this time. The market focus on interest rates is disappointing given quantitative
easing.
Composition of Federal Reserve Assets(Weekly Data. Last Observation: Nov. 11, 2009)
0
500
1,000
1,500
2,000
2,500
3,000
01/07 07/07 01/08 07/08 01/09 07/09 01/10
Short-Term Lending to Financial Firms and MarketsRescue Operations
Operations Focused on Longer-Term Credit ConditionsTraditional Portfolio
Traditional Portfolio and Long-Term Assets
Billions $
The Asset Purchase Program
The Committee announced an intention to buy up to $1.725 trillion in assets by 2010 Q1. Considered successful as quantitative easing. Causing a large and persistent increase in the monetary base ... ... and a medium-term inflation risk.
The FOMC asset purchase program does not have a state-contingent character.Main issue: How to adjust the asset purchase program going forward and not generate inflation?
Regulatory Reform
Key Problem: Too Big To Fail
“Too Big to Fail” is an intolerable situation which must be addressed.Large, complex, global institutions, many of which are not banks.One important idea: A resolution regime for large financial firms.
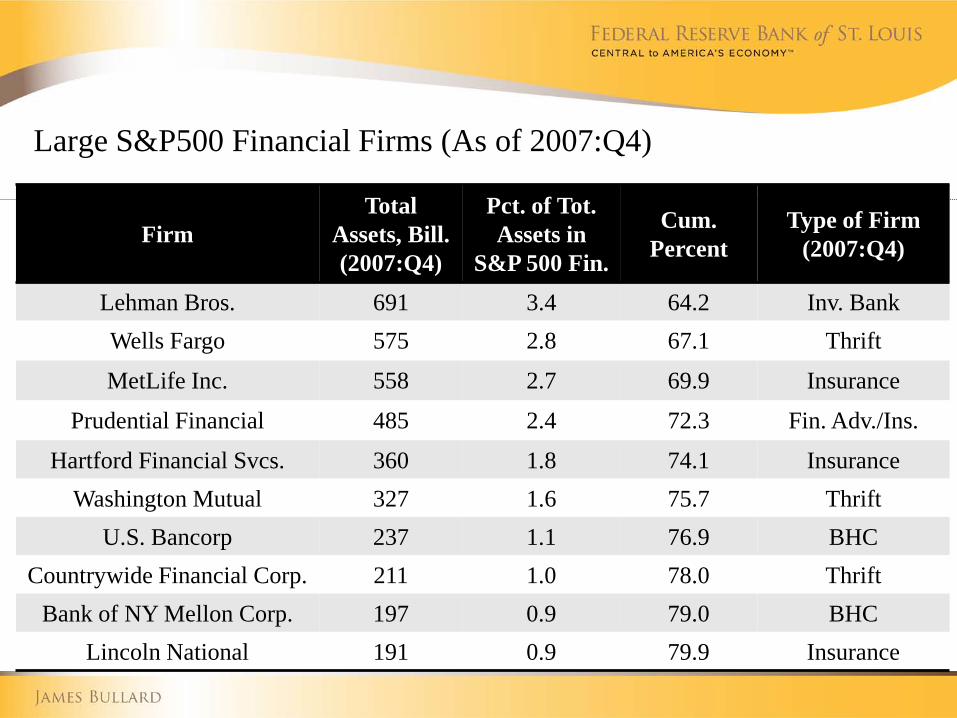
Large S&P 500 Financial Firms (As of 2007:Q4)
FirmTotal Assets,
Bill.(2007:Q4 )
Pct. of Tot. Assets in S&P
500 Fin.
Cum. Percent Type of Firm
(2007: Q4)
Citigroup Inc. $2,187 10.9% 10.9% BHCBank of America Corp. 1,715 8.5 19.5 BHC
Bank of NY Mellon Corp. 197 0.9 79.0 BHCLincoln National 191 0.9 79.9 Insurance
The Role of the Fed
Discount window: The Fed needs to have a role in regulating institutions to which it may lend.Monetary policy: To be effective, the Fed needs to know the condition of the financial system through hands on regulatory involvement.Fed independence is vital in maintaining credible monetary policy.
Federal Reserve Bank of St. Louisstlouisfed.org
Federal Reserve Economic Data (FRED)research.stlouisfed.org/fred2/
James Bullardresearch.stlouisfed.org/econ/bullard/


![ECONOMIC] OF THE PRi - St. Louis Fed](https://static.documents.pub/doc/80x56/616f073629d5171d3f5d3143/economic-of-the-pri-st-louis-fed.jpg)


