1 The First Year at School in the Western Cape: Growth, Development and Progress Peter Tymms, Sarah Howie, Christine Merrell, Celeste Combrinck and Lee Copping May 2017 The Nuffield Foundation is an endowed charitable trust that aims to improve social well-being in the widest sense. It funds research and innovation in education and social policy and also works to build capacity in education, science and social science research. The Nuffield Foundation has funded this project, but the views expressed are those of the authors and not necessarily those of the Foundation. More information is available at www.nuffieldfoundation.org.
Transcript
1
The First Year at School in the
Western Cape: Growth, Development and Progress
Peter Tymms, Sarah Howie, Christine Merrell,
Celeste Combrinck and Lee Copping
May 2017
The Nuffield Foundation is an endowed charitable trust that aims to improve social well-being in the
widest sense. It funds research and innovation in education and social policy and also works to build
capacity in education, science and social science research. The Nuffield Foundation has funded this
project, but the views expressed are those of the authors and not necessarily those of the
Foundation. More information is available at www.nuffieldfoundation.org.
List of Tables ........................................................................................................................................... 5
List of Figures .......................................................................................................................................... 6
5.1 Research Question 1: What do children in the Western Cape know and what can they do when they start school? .................................................................................................................... 18
5.2 Research Question 2: How do the starting points and progress vary by sub-groups: Language of instruction, home language, sex, home backgrounds (socio-economic status) and attendance in Grade R? ............................................................................................................................................ 26
5.3 Research Question 3: How much progress is made in the first year? ..................................... 38
5.4 Research Question 4: How do the learners in the Western Cape compare with learners in England and Scotland? ...................................................................................................................... 47
6. Summary of the findings ............................................................................................................... 50
7.1 Research Question 5: What implications do these analyses have for policies in the Western Cape? ................................................................................................................................................ 52
In this section, the adaptation and translation of the instruments is outlined, followed by a description
of the sampling procedure for schools and learners.
2.1 Adaptation and translation of the instruments
iPIPS is administered in the language of instruction, which in the Western Cape is Afrikaans (a
derivative of Dutch vernacular), English, and isiXhosa (an indigenous African language) in Grade 1.
These three languages dominate the Western Cape: Afrikaans is spoken by about half (49.7%) of the
population, isiXhosa by about a quarter (24.7%) and English by a fifth (20.7%). The remainder are split
between more than 10 further languages including sign language (0.4%).
The instruments were first adapted for the South African context and translated into Afrikaans and
isiXhosa. The Afrikaans translation was carried out without any problems as most of the instruments
had been previously translated and implemented widely (Scherman, Archer and Howie, 2012).
Although the instrument had previously been translated into other African languages, it had never
been translated into isiXhosa.
isiXhosa is the second most widely spoken language in South Africa spoken by 16% of the population
nationally. In the Western Cape, isiXhosa is the most widely spoken indigenous African language
(Edwards & Ngwaru, 2011; Prah, 2007). isiXhosa was standardised previously by harmonising and
elevating Gcaleka and Thembu out of more than six dialects1 (SAHO, 2015). The standardised form,
whilst being used for official purposes and in schools, is not always recognised by those speaking other
dialects.
After initial translation into isiXhosa, it was back translated into English; this is considered a strong
method for translating international comparative assessments (Martin and Kelly, 1996). The back
translation was studied for inconsistencies against the original text. This was an iterative process with
many translations, back translations and translation verifications. The main goal of the instrument is
to gain a measurement of what the child knows regarding literacy and mathematics in the standard
form of the language.
The aim was to establish equivalent versions in Afrikaans, English and isiXhosa where possible. The
Afrikaans and English versions had undergone years of trialling and implementation in Gauteng in
earlier years (Scherman, 2007; Archer, 2011) and therefore whilst the process was scientifically
rigorous, it was not as intensive and extensive as the processes required for the isiXhosa version.
2.2 Sampling of schools and learners
The Western Cape Department of Education (WCED) provided the latest updated list of schools and
learners within three school districts2 of the province. The population of focus was the Grade 1
1 There are 13 subgroups who speak a dialect of the isiXhosa language, including the isiMpondo (isiNdrondroza), Thembu, Bomvana, Mpondimise, Rharhabe, Gcaleka, Xesibe, Bhaca, Cele, Hlubi, Ntlangwini, Ngqika, Mfengu 2 Initially two districts were selected but a third was needed in order to include sufficient numbers of isiXhosa schools in the sample
11
learners. The target population was those who attended schools in three districts in the Western
Cape.
A two-stage stratified random sample was drawn using SPSS version 23 software. The first stage was
to select schools within the explicit stratum of language of learning and teaching per district. A
random sample of schools for each language was selected in each district. The second stage was to
select learners across classrooms in Grade 1. A random sample of 25 learners per school stratified on
gender was selected equally from all classrooms. The sample can be regarded as representative of
Grade 1 learners in each of the three districts.
Ultimately, the intended sample comprised 120 schools across three districts and from these 112
(92%) schools were tested (see Table 1). The fieldwork team managed to carry out assessments in all
the chosen Afrikaans schools, 86% of English schools and 95% of the isiXhosa schools. This rate for
each language met all the international levels set by the International Association for the Evaluation
of Educational Achievement (85%) (Gregory et al., 2001).
Table 1 Number of schools in intended and attained samples for Western Cape at the start and end of year
District A District B District C Total Intended Achieved Intended Achieved Intended Achieved Intended achieved
Afrikaans 13 8 13 19 13 12 39 39
English 14 14 14 8 14 14 42 36
isiXhosa 13 9 13 10 13 18 39 37
Total 40 31 40 37 40 44 120 112
The intended sample comprised 3,000 learners across the three districts (see Table 2). The fieldwork
team attained 93% of the schools at the start of the year; an excellent rate for international studies.
The international standards set by the International Association for the Evaluation of Educational
Achievement are that 85% of schools needed to participate (IEA report, in press). The same schools
were all involved in the data collection at the end of the year.
The proportion of the intended learners assessed at the start of the year was 90% (98% for Afrikaans
schools, 85% for English schools and 87% for isiXhosa schools) which still met the international levels.
Exactly why there were different response rates for the different groups is unclear. It could be cultural
or it might simply be natural variations. Unfortunately, absenteeism has become an established but
unofficial practice not only in Western Cape but nationally at the end of the year. During the year it is
not much different. Some of the absenteeism seems to relate to parents trying to save transport
money and apparently not seeing the value of schooling in the final month of school. The proportion
retested at the end of the year was 92% overall (91% for Afrikaans schools, 96% for English schools
and 91% for isiXhosa schools). Table 2 shows the number of learners who were assessed at the start
of the year and retested at the end of the year. For details on how we treated missing data, see the
section in the Appendix headed “Imputation and multi-level models”.
12
Table 2 Number of learners in intended and attained samples assessed at the start and end of year by language per district
District A District B District C Total Intended Start End Intended Start End Intended Start End Intended Start End
A further sampling procedure was employed to collect data from teachers about children’s personal
and social development and behaviour. In order not to over-burden them, they were asked to
complete forms for a randomly selected subset of learners from the original sample of learners. This
was for five forms per teacher and 1,837 learners in total. More than 1,560 forms were returned; a
response rate of over 80% (see Table 3).
3. The instruments and numbers of learners assessed
Table 3 shows the number of learners for whom data were collected at the start and end of the year.
Table 3 Number of learners for whom data were available as the start and end of year for Cognitive, Personal & Social Development and Behaviour by language
Reading, mathematics, vocabulary and phonological awareness
The iPIPS assessment that was implemented in the Western Cape has more than 200 items designed
to examine cognitive development. The questions are organised into a series of sub-assessments
corresponding to the development of vocabulary, phonological awareness, reading and mathematics
(Table 4). These have been shown to be predictive of later success in literacy and mathematics
(Tymms, 1999; Tymms, et al., 2012). Schooling helps vocabulary and it in turn helps with reading and
mathematics, whilst phonological awareness is particularly relevant to reading (Gathercole et al.,
1992).
13
Table 4 Cognitive constructs used in iPIPS
Developmental Area
Sub-assessment Description
Reading Name Writing The child is asked to write his/her own name and the quality of writing is scored.
Vocabulary Vocabulary Vocabulary – the child is asked to identify objects embedded within a picture.
Reading Ideas About Reading
Ideas about reading – assesses many of the ideas found in Marie Clay’s Concepts about Print. (Clay 1972)
Phonological awareness
Phonological awareness
Repeating Words - the child hears a word and is asked to repeat it. Rhymes – the child is asked to select a word which rhymes with another.
Reading Letters Letter identification – a fixed order of mixed upper and lower case letters.
Reading Early Reading Word
Word recognition and reading. This starts with word recognition and moves on to simple sentences that the child is asked to read aloud. The words within these sentences are high frequency and common to most reading schemes. This is followed by a more difficult comprehension exercise which requires the child to read a passage and at certain points select one word from a choice of three that best fits that position in the sentence.
Mathematics Ideas About Mathematics
Ideas about mathematics – assessment of understanding of the vocabulary associated with mathematical concepts.
Mathematics Counting Counting and numerosity – the child is asked to count four objects. These disappear from the screen and then the child is asked how many objects they saw. This is repeated with seven objects.
Mathematics Digits Digit identification – single, two-digits and three-digits.
Mathematics Shapes Identification of a variety of geometric shapes.
Mathematics Number Number manipulation – the child is asked how many more or less a number is than a target.
Mathematics Sums A (Informal) Sums – addition and subtraction problems presented without symbols.
Mathematics Sums B (Formal) More difficult mathematics problems including sums presented with formal notation.
For the analysis of the results, measures for the four main cognitive sections of the assessment
(reading, mathematics, vocabulary and phonological awareness) were constructed using a statistical
method called Rasch modelling based on data from the start of year. This technique transforms
learner’s raw scores into an equal interval scale, which can then be used to make direct comparisons
between the difficulty of items and the abilities of the learners. These scales can be thought of as a
measure like a ruler and the units of measurement are called Logits.
The difficulty of items can be plotted along the scale, rather like points on a ruler. Similarly, learner’s
ability on the assessment can be placed on the same ruler. This means it is possible to directly see the
kinds of items which a child can answer correctly, those which are easy and those which are beyond
their reach at the time of assessment. It allows us to set out what learners know and can do (Bond
and Fox, 2001; Linacre, 2003; Andrich, 2004).
When constructing the scales, it was important to investigate whether items behaved differently in
the different languages, i.e. were some items relatively more difficult or easier in one language
compared to another? This is known as Differential Item Functioning (DIF).
14
The reading section included 97 items, of which 34 were relatively easier in one language version
compared to another. In other words, these exhibited DIF and so were removed to leave a reading
scale which was suitable for comparing groups of learners who were assessed with the different
language versions of iPIPS. The newly constructed reading scale of 63 items had a person reliability of
0.73. We also checked for DIF by sex, age and quintile as well as for item fit but there was no need to
remove any further items.
The mathematics section initially comprised 64 items. During the analysis, a number of items were
excluded because they exhibited DIF between the three different language versions. No items were
excluded for DIF across the sexes, ages and quintiles. No items were excluded because they did not
fit the unidimensional scale. This left 42 items covering a wide range of difficulties. The scale had a
person reliability of 0.78.
It was not possible to put learners, assessed in the three different language versions, onto the same
vocabulary scale. Almost every item showed DIF between at least two of the language versions. Each
language version is therefore treated separately and no attempt is made to compare the vocabulary
levels. There were 30 items and the person reliabilities were 0.75, 0.82, and 0.64 for Afrikaans, English
and isiXhosa respectively. Within each language version there was very little evidence of DIF by sex,
age or quintile. A very small number of items were excluded from the analysis because everyone who
was shown them either got them right or wrong.
Two sections, Repeats and Rhymes, were used to assess phonological awareness. The items did not
work in an equivalent manner across the three language versions and, as with vocabulary, the scales
for each language version are reported separately. There were eight items in the Repeats section and
nine items in the Rhymes section. The two sections worked well together with the Repeats tending
to separate out the less able learners and the Rhymes being more suited to the more able. The person
reliabilities for phonological awareness were 0.69, 0.66, and 0.70 for Afrikaans, English and isiXhosa
respectively. All items were used in each language version and there was little evidence of DIF by sex,
age or quintile.
Personal and social development (PSD)
Teachers were asked to complete 11 items related to learners’ personal social development and 18
items related to behaviour. The items for personal and social development, shown below, were rated
on a five point scale:
• Upset: The child is upset at start of day and worried throughout the day
• Reliance: The child relies on others and needs help with clothing and personal activities
(clothing, toilet, etc.)
• Confidence: The child’s level of confidence and participation
• Concentration – teacher: The child finds it difficult to concentrate in teacher-directed activities
• Concentration – self: The child finds it difficult to concentrate in self-directed activities
• Impulsive: The child acts impulsively without consideration for themselves or others
• Communication – children: The child finds it difficult to communicate with other children and
make friends
• Communication – adults: The child finds it difficult to communicate with adults
15
• Rules: The child takes no notice of rules and distracts others and interrupts activities
• Cultural: The child is aware of cultural differences
• Communication: The child’s ability to communicate.
Behaviour
The 18 items related to behaviour were tightly based on the diagnostic criteria for Attention Deficit
Hyperactivity Disorder (ADHD) published by the American Psychiatric Association (2000) Diagnostic
and Statistics Manual (DSM IV). There are nine items related to inattention, six related to hyperactivity
and three to impulsiveness. Teachers were asked to rate learners on a six-point scale (0 to 5) covering
the range of never to always.
3.2 Home background (Socio-economic status)
A questionnaire for parents was developed to assess the home background (socio-economic status)
of the learners. This comprised 13 questions regarding access to amenities such as running tap
water, access to a car and resources that could assist a child’s learning such as access to books, their
own room and an internet connection. The items, which were used to form the scale described in
section 4.1, were adapted from the South African scale used in Progress in International Reading
Literacy Study (PIRLS 2016) Possessions in the home.
4. Profile of Learners
The next part of the report explores the Western Cape contextual variables and how learners vary
when they start school. In order to contextualise the assessment results, four key background
variables are used: language spoken at home, sex, age and socio-economic status.
Background data
Language spoken at home
South Africa has 11 languages recognised in the constitution including nine indigenous African
languages. As can be seen from Table 5, the learners who were assessed at the start of the year came
from homes speaking 10 languages although 99% reported that they spoke one of the assessment
languages at home. Although most learners were learning in their first language, a proportion were
being taught in a second language. Only 5% of learners assessed in Afrikaans did not nominate
Afrikaans as their home language. However, 18% of learners assessed in English did not identify
English their home language in contrast to almost all learners (98%) assessed in isiXhosa who said that
this was the language spoken at home. Bilingualism in the home is common in South Africa and even
at this young age, children may be multilingual, especially in urban areas. Anecdotal evidence from
principals and teachers suggests that a number of children from isiXhosa and Afrikaans speaking
families are sent to English medium school in the belief that they will gain long term advantages. As
many as 70% of learners in English medium schools in Grades 4 and 5 speak a different language at
home (Howie, van Staden, Tshele et al., 2012).
16
Table 5 Learners’ home language and language of instruction at the start of Grade 1 in Western Cape sample
Language of instruction Total
Afrikaans English isiXhosa
Home
language
Unidentified or other 0 15 1 16
Afrikaans 905 17 0 922
English 43 733 16 792
French 0 4 1 5
German 0 1 0 1
SeSotho 0 1 0 1
SiSwati 0 1 0 1
Xitsonga 0 1 0 1
isiXhosa 8 124 830 962
isiZulu 0 1 0 1
Total 956 898 848 2702
Sex
The sample comprised 48.8% females and 51.2% males, and these proportions did not vary across
language of instruction (p>.05).
Age
The average age at the time of the first assessment was 6.81 years (Standard Deviation = 0.49) with
the youngest child being 5.68 years and the oldest 9.70. The ages did not differ greatly for the three
languages as illustrated in Figure 1, although there were, proportionally, more older learners in the
Afrikaans sample.
17
Figure 1 Age distribution for the three language groups in the Western Cape at the start of Grade 1
Ignoring the groups of older learners (those above about 7.5 years of age) the distribution of ages is
approximately normal. This contrasts with the pattern in some other countries such as England where
the distribution is approximately rectangular. The policy in South Africa is that the child should start
school in Grade 1 within the year they become seven years of age, but it seems that some parents opt
to send their children to school at a younger age and some, about 10%, are older than expected. Grade
1 is the grade that is repeated most often in the South African schooling system (DoE, 2007) and this
could account for some of the older learners in the sample.
Socio-economic status (SES)
In South Africa, schools are categorised into quintiles according to the affluence of their location for
the purpose of the funding formula for schools. Quintile 1 represents the poorest neighbourhoods,
which are often found in formerly designated black townships. Quintile 5 is the most affluent and
they are often in formerly white suburbs. The breakdown of school quintiles by language group is
shown in Table 6 where NQ1 refers to Quintile 1, NQ2 to Quintile 2 and so on.
18
Table 6 Number of participating schools by quintile and language group in Western Cape
Quintile Total
NQ2 NQ3 NQ4 NQ5
Language of
Instruction
Afrikaans 2 6 28 4 40
English 0 0 11 25 36
isiXhosa 14 19 3 0 36
Total 16 25 42 29 112
The English language schools were from the top two quintiles (4 & 5). The Afrikaans language schools
were spread across the top four quintiles but concentrated in the 4th quintile (70%). The isiXhosa
language schools were predominantly from Quintiles 2 and 3. Of the lowest quintile schools, 88%
were isiXhosa, illustrating the persistent effect of South Africa’s historical racially-based policies.
There were no Quintile 1 schools in the three districts we sampled – they are usually found in remote
areas and extremely poor environments.
Data were also collected from 1,924 learners on a scale constructed for this study using the home
background questionnaire reported in Section 3.2. It had a reliability of 0.84. All items correlated well
together and there were no indications of poor model fit. We called the scale SES (socio-economic
status).
The data show a relationship between the school quintile and the average SES scale within each school
(see Table 7), with significant differences in levels of overall socio-economic status. In particular,
learners in the Quintile 5 schools appear, on average, to be significantly more affluent than learners
from other quintiles. This SES scale showed a small, positive correlation with school quintile (0.31,
p<.001).
Table 7 Average SES score for learners within each quintile
The results are reported in relation to the research questions.
5.1 Research Question 1: What do children in the Western Cape
know and what can they do when they start school?
The results for reading, mathematics, vocabulary and phonological awareness at the start of the year
are presented first and the learners’ levels of personal and social development are then reported
graphically. The behaviour scores are also reported.
19
Reading
In Figure 2, learners’ reading levels and the difficulty of the questions are placed on the same logit
scale. The learner’s reading levels are shown as # symbols on the left side of the map, with each #
representing 14 learners. Points with fewer than 14 learners are shown as dots. The ‘Measure’
column at the left side of the map shows the Logit scale which, in this instance, ranges from -9 to +5.
The difficulty of each item is shown on the right side of the map. The more negative the value on the
Logit scale, the easier the item. The scale moves from negative through to positive and items located
higher up in the scale are more difficult than those lower on the scale. Similarly, with the positioning
of learners on the Logit scale; the more able learners have more positive scores than the less able.
The ‘M’s on the scale denote the mean score of the learners on the left side of the scale, and the mean
difficulty of the reading scale on the right side with the items. Looking at the item map, we can see
that learners’ reading levels are approaching a normal distribution with some learners of very low
ability, the majority in the middle, average range, and some learners with very high scores. The mean
ability of the learners is lower than the mean difficulty of the items, which suggests that there are a
good number of items that were too difficult for many of the learners at the start of school. Since the
assessment is repeated at the end of the year to measure progress, this would be expected. However,
note that there is a small group of approximately 28 learners who were able to answer all questions
correctly at the start of school. These learners are represented by the dots extending to the top of
the scale, with each dot representing a point that has been reached by between 0 and 14 learners.
The ‘S’s on the scale denote one standard deviation above and below the mean and the ‘T’s two
standard deviations from the mean.
At the easier end of the scale, most learners were able to point to someone who was reading in a
picture of learners in a classroom, which is one of the questions in the Ideas about Reading section.
Learners within the average range of reading ability were typically able to identify the letters of the
alphabet and read aloud simple, high-frequency words in short sentences. Learners with the highest
level of reading ability were able to read aloud short stories which included words such as ‘quite’,
‘sometimes’ and ‘tastes’ and their equivalent in Afrikaans and isiXhosa. They were also presented
with a short story where approximately every fifth word was replaced with a choice of three, and
asked to select the most appropriate word from that choice. This required these learners to read
words such as ‘comfortable’, ‘everyone’, ‘cushion’ and ‘carried’ in the three languages and to
understand the text sufficiently to be able to make an informed choice about which word from each
choice of three best fit into the sentence.
This item map can provide teachers with information about the learning progression so that they can
pitch their teaching appropriately. At policy level, the item map could make an important contribution
to curriculum design, providing information about the order in which learners of this age acquire
reading skills.
20
MEASURE PERSON - MAP - ITEM
|
5 +
. |
|
. |
4 . +
|
. |
. | Reading Passage A
3 . +
. |S Reading Passage B - Two
. | Reading Passage B - they
. | Sentence (DogStory)
2 # + Sentences (Quite a few dogs enjoy)
Reading Passage B
.# T|
.# |
.# |
.## | Sentence(There were lots of shops)
.#### |
.## |
0 .# +M
.###### S| Sentence (She always goes home at night)
.##### |
.####### |
-1 .######## + Butterfly
.####### |
.######## | House
.########### | Ball
-2 .######### + Tree
.########### M|
.############ | Sentences – Quite a few dogs enjoy playing football
.####### |S Letter H
-3 .########### + Letter G
.######## | Letter D
.############ | Letter t
.##### |
-4 .##### +
.### S|
.#### | Letter L
.####### | Letter o
-5 .## + Letter m
. |
. |T
. |
-6 .# +
. T|
. |
.###### |
-7 .### +
. |
|
|
-8 +
|
| Ideas about Reading Classroom – person writing
|
-9 +
|
EACH "#" IS 14: EACH "." IS 1 TO 13
Figure 2 Reading Item Map for overall Western Cape sample
One way to think of these results is that they show a progression pathway which learners follow on
their way to full literacy. At the Ground level, children are starting to understand what reading is
without being able to do any of the activities usually associated with reading. They then move to the
Letters stage as they start to learn more about writing and can read many letters. At the next stage
(Words) the learners can decode and/or recognise some words and read simple sentences. They then
21
move on to Sentences when they become adept at reading and finally to Comprehension, when they
not only read but understand passages of text. This is shown below in Figure 3:
Comprehension
Can read and understand text 1.8%
Fourth rung
Sentences
Can read and understand short simple passages
4.1%
Third rung
Words
Can read simple words Can read easy sentences
33.1%
Second rung
Letters
Knows most letters Can write name well Knows where writing starts in a book
57.5%
First rung
Ground level
Recognises what reading and writing are Knows the first letter of name Tries to write name
3.5%
Figure 3 Reading ladder for overall Western Cape sample
A small proportion of learners were starting school at the Ground level; they were able to distinguish
children reading and writing within a picture of a classroom scene, they knew the name or sound of
the first letter of their name and they were able to make an attempt to write their own name. This is
a very small proportion of learners. Most learners in the sample were at the ‘letters’ and ‘words’
stages (between the first and third rung of ladder) of the pathway or higher. At the Letters stage, they
were able to give the name or sound of most letters, when they attempted to write their own name
they included mostly correct letters written in a recognisable style and they knew where to start
reading the writing on a book page. Very few learners were reading short passages with
22
understanding. However, as noted earlier, this would not be expected at the beginning of Grade 1
but would be hoped for at the end of Grade 1.
Mathematics
The Logit scale for mathematics covered a wide range of ability. Virtually no learners were able to
answer all questions correctly, leaving material for able learners at the end of the year. At the easiest
end of the scale, learners were able to point to the biggest cat in a picture of three cats of different
sizes (Biggest), and count four objects (How many balls?). Learners in the average range were typically
able to name single digits and were just starting to name one or two double digits, answer questions
such as ‘What is one more than five?’ (1>5) and ‘Here are three bicycles, if we put one more in the
picture, how many would there be?’ The most able learners were capable of carrying out calculations
presented with formal notation such as ‘9 – 6 =’, perform simple calculations involving money and
identify three-digit numbers. Figure 4 shows the item-person map for mathematics for the overall
Western Cape sample.
23
MEASURE PERSON - MAP - ITEM
|
8 +
. |
. | What is a quarter of 8?
7 . + What is twice three doubled
| 42-7=
. |
6 . +
. | 105+302
. | 21 more than 32? 15+21=
5 . +S 8 more than 13 10 less than 25
. |
. | 6 more than 15 15-4= Half of 6?
4 .# +
. T| 9-6=
.## | Pattern 10 4+11=
3 .# + Apple 50c 7+3= Number 281 Number 479
.# | 3 less than 8 ¾ circle Cover half bikes
.### | Patterns
2 .#### +
.##### |
.# | 3 more than 7
1 .##### S+
.###### |
.# | Number 55
0 .############ +M
.###### |
. |
-1 .############ + Number 13
.# | 1 more than 5
##### M|
-2 .######### +
.## | Number 20
.########## |
-3 .###### +
.## |
.############ |
-4 .#### +
.####### | Two dogs – add two more
.####### S| Number 9
-5 .## +S Number 0
.## | Number 8
.## | Number 6
-6 .#### + Number 4
.## |
.# |
-7 . + Count the dogs (7)
.## T| Smallest cat Number 3 Number 5
. | Who is holding more balloons?
-8 . + Count the balls (4)
|
| Biggest cat Number 2
-9 . +
|
|
-10 +
. |T
. |
-11 +
|
EACH "#" IS 17: EACH "." IS 1 TO 16
Figure 4 Mathematics Item Map for the overall Western Cape sample
An overview of the mathematics results for the Western Cape sample is represented in a ladder (see
Figure 5).
24
Advanced
Able to do harder formal sums Able to do complex mental arithmetic Able to count coins
1.3%
Fourth rung
Formal
arithmetic
Identifies three digit numbers Able to do formal sums Able to identify coins Able to count on Able to use simple fractions
24.1%
Third rung
Simple formal
arithmetic
Identifies two digit numbers Able to do harder informal sums Can do very simple formal sums
28.8%
Second rung
Informal
arithmetic
Identifies numbers 6 to 10 Able to do simple informal sums Knows words such as “most” and “more”
35.2%
First rung
Ground level
Identifies numbers 1 to 5 Counting a few objects by rote Knows what “how many” means
10.6%
Figure 5 Mathematics ladder for the overall Western Cape sample
Most learners were at the “informal arithmetic” or “simple formal arithmetic” levels although there
was considerable variation; more so than for reading.
Vocabulary
The item/learner maps for each of the three languages are shown in the first report (Howie et al.,
2016). Almost all learners who were assessed in Afrikaans were able to point to items commonly
found in a kitchen such as a fork, knife and pan. Less frequently known words were “jewellery” and
“microscope”. These are also difficult words for learners in other countries. Virtually none of the
learners could identify the body parts: “joint”, “tendon” and “bicep”.
Phonological awareness
As with the vocabulary, the phonological awareness item/learner maps are shown in the first report
(Howie et al., 2016).
25
The item maps for Afrikaans and English illustrate that phonological awareness was easy for many
learners, with many answering all items correctly. But, there was still a number of learners who were
able to repeat some words accurately but were not yet able to identify rhyming words. This skill of
rhyming is important for success in reading (Goswami, 1990) and identifying learners who have
difficulties at an early stage of their schooling means that interventions can be used to improve their
chances of reading successfully when they are older.
This scale in the isiXhosa version was more difficult for the learners than the English or Afrikaans
versions. This is a potentially important finding. Many of the learners who were assessed with the
isiXhosa version were unable to answer any questions about rhyming correctly. Qualitative
investigation is required to find out whether this is because of the administration of the instructions,
the rhyming words themselves or whether the concept of rhyme is less familiar in the isiXhosa
language.
Personal and Social Development
Teachers were asked to rate each child’s personal and social development on a five-point scale, with
a score of 5 indicating positive conduct listed earlier.
About 80% of the learners who were sampled were rated by their teachers (n = 1,447). This is a good
response rate from busy teachers.
Males and females were equally represented (p>.05). The rates were similar for Afrikaans, English
and isiXhosa respectively and across quintile groups.
Whilst the response rates were good, we must be tentative in drawing any comparative conclusions
because teachers may vary in the leniency/severity with which they give ratings. In other words,
teachers in one language group, or quintile, might give higher ratings for similar learners when
compared to teachers in another language groups or quintile. Despite these provisos, it is thought to
be worth reporting the findings.
The responses are shown in Figure 6.
26
Figure 6 Mean scores for Personal and Social Development for learners in Western Cape sample at the start of Grade 1. See Section 3.1 for the list of variables
Learners were reported as being comfortable in the school environment and self-reliant with personal
activities. The mean scores were lower for confidence, cultural awareness and communication; a
score of 3 was equivalent to ‘sometimes’ on the rating scale. This might be expected for the beginning
of Grade 1 where the learners are in a new environment with new classmates and some in very diverse
settings. The earlier cautions about this scale being based on teachers’ judgements should be borne
in mind when interpreting the results. These provide an overall pattern of learners’ personal and social
development at the start of school and are valuable in suggesting that some learners may need
additional support in areas such as building their confidence, concentration and general
communication skills.
5.2 Research Question 2: How do the starting points and progress
vary by sub-groups: Language of instruction, home language,
sex, home backgrounds (socio-economic status) and
attendance in Grade R? In this section we compare the measures at the start of Grade 1 for each of the sub-groups (language
of instruction, home language, gender and socio-economic status). We start with cognitive measures
followed by personal and social development, and behaviour.
Correlations between the cognitive measures
Before exploring the differences between the sub-groups, we investigated the correlations between
the cognitive measures. All the cognitive measures correlated positively with one another as shown
in Table 8.
1.00
1.50
2.00
2.50
3.00
3.50
4.00
4.50
5.00
27
Table 8 Correlation of the cognitive measures per Western Cape language groups
Reading Maths Vocabulary Phonological awareness Afrikaans English IsiXhosa Afrikaans English IsiXhosa
Afrikaans 587 -0.14* English 466 -0.16** IsiXhosa 494 -0.19**
Phonological Awareness
Afrikaans 585 -0.20** English 469 -0.22** IsiXhosa 497 0.01
*p<.05 ** p<.01
The correlations are low to modest, but suggest that those with high behaviour scores tend to start
school around one standard deviation behind those with very low scores. This is a large difference. If
someone is a standard deviation behind the average then instead of being ahead of 50% of the
population they would be ahead of just 16%. Furthermore, the relationship to reading and
mathematics varied by language group. The correlations were noticeably highest for the Afrikaans
group where the correlations between behaviour and reading and mathematics were -0.40 and -0.37
respectively. These are alarmingly high and are probably so high because there is such a spread of
scores in that group. The distributions are shown in Figure 8.
32
Figure 8 Distribution of inattentive, hyperactive and impulsive Behaviour scores across the three language groups in Western Cape schools
33
The distributions, which show a wide spread of scores, can be compared with nationally
representative data for England for children aged five years (Figure 9).
Figure 9 Distribution of inattentive, hyperactive and impulsive Behaviour scores in England for 5-year-old children in first year of school
The striking feature of the data from England is the small proportion of high scores and the high
proportion of very low scores. This is far from a normal distribution and results is a small proportion
attaining very high scores. This contrasts with the data from the Western Cape, particularly with the
Afrikaans medium schools. Of course, the Western Cape and England are different in terms of cultural
norms, expected behaviour from young children and social desirability. And so, ratings by teachers
from the two areas of the same behaviours can be expected to produce different results. But we
would not expect to find differences as large as those reported above. We also note that the published
negative link between the Behaviours and attainment (Merrell et al., 2017) mentioned earlier referred
to English data, and that a key finding of that paper was that the link between lower attainment and
Behaviour did not depend on a diagnosis of ADHD, but was seen at all levels on the scale, albeit to
varying degrees.
Languages of instruction and cognitive measures
Table 14 End of Year attainment levels for cognitive measures across language groups
Cognitive measure Test language n End of Year Score (in logits)
Reading Afrikaans 867 -1.96 English 862 .20 IsiXhosa 768 -2.28
Mathematics Afrikaans 867 2.25 English 862 3.67 IsiXhosa 769 2.34
Vocabulary
Afrikaans 866 .28 English 862 1.28 IsiXhosa 769 .12
Phonological Awareness
Afrikaans 867 1.95 English 860 2.07 IsiXhosa 769 .24
34
As shown in Table 14, there were differences in the end of year scores across cognitive measures.
Differences between cognitive developmental levels in reading by language were apparent. ES in the
English language scores were 0.38 higher than the Afrikaans language scores and the isiXhosa
language scores were 0.48 lower than the Afrikaans language scores. All of the differences were
statistically significant (p<0.01).
As with reading, there is much overlap between language groups in mathematics with the English-
speaking learners generally attaining higher scores than the other two groups. In ES, the English
language scores were 0.40 ahead of the Afrikaans language scores and the isiXhosa language scores
were 0.29 behind the Afrikaans language scores. As with reading, all of the differences were
statistically significant (p<0.01).
Viewing all variables together
Clearly, there are many factors which may influence the starting points of learners in the Western
Cape schools. The key ones have been outlined above and here they are all brought together to
estimate their relative importance. A technique known as multi-level modelling (MLM) is employed,
and, because there were some missing data, a further technique known as imputation was used to
estimate the scores of learners where the data had not been collected. This provides the best estimate
of the relative importance of the variables in predicting Reading and Mathematics scores. Details of
the procedures and findings are given in the appendix. Finally, the strength of each factor in the MLM
was converted to an ES (Tymms, 2004), to produce the results for reading shown in Figure 10.
Figure 10 Effect Sizes from multi-level models for reading at the start of Grade 1 in Western Cape sample
Figure 10 shows that, when examined together, just a few factors are statistically significant and of
substantive importance when predicting the reading levels of children start school. They are: the
-1
-0.8
-0.6
-0.4
-0.2
0
0.2
0.4
0.6
0.8
1
Effect SizeNon-significant
Significant
35
background of the children as measured by the SES of individuals, the SES of the school as a whole
and the District (District 3 had lower than expected scores), the behaviour ratings given by the
teachers in the first term, attendance at Grade R and the age of the child.
Why are these variables of importance? The SES measure captures the socio-economic background
of the family from which they child comes and is expected to relate to cognitive outcomes. It will be
linked to the time that the parents or guardian have available to devote to the learner, the finances
available to spend on educational relevant objects and on health, the presence of a stimulating
environment, the knowledge and skills of the parent/guardians and therefore their general ability of
help the chid. This measure is important at three levels, firstly at the pupil level and secondly at the
school level, which potentially captures neighbourhood interactions as well, perhaps, as the
aspirational levels of the parents/guardians as the select schools. The third level, the district, picks up
the same contrast at a further level of aggregation and appears in the chart as a significant negative
coefficient for District 3.
Attendance at Grade R is intended to help learners prepare for school and it is gratifying to see that
the data suggest that this is working. That older children tend to have higher scores is unsurprising.
Finally, there is a substantive link to the measure of inattention hyperactivity and impulsivity (labelled
Behaviour in the figure). This corresponds to the well-established link between inattention and
attainment. The only surprise is the magnitude of the link.
A number of factors which, by themselves are important, are not significant when considered with
other variables. They are: sex, being old for the year (older than 7.5 years, see Figure 1), attending a
school which teaches in a medium other than the home language, and the schools’ medium of
instruction.
The results for mathematics follow in Figure 11.
-1
-0.8
-0.6
-0.4
-0.2
0
0.2
0.4
0.6
0.8
1
Non-significant
Significant
36
Figure 11 Effect Sizes from multi-level models for mathematics at the start of Grade 1 in Western Cape sample
The results are broadly similar to those for reading and the explanations are also similar, although girls
started with lower scores than boys from similar backgrounds and learners at isiXhosa medium school
started at lower points than learners with similar backgrounds in schools with Afrikaans as the medium
of instruction. The links to attendance at Grade R, and having behavioural difficulties, were greater
for mathematics than for reading whilst the links to SES were lower. It is generally found that
mathematics is more amenable to education and that reading is more linked to SES.
Personal and Social Development (PSD)
Languages of instruction and PSD
The mean score for each item by language of instruction is shown below in Figure 12.
Figure 12 Mean scores for Personal and Social Development of learners rated by teachers for learners in Western Cape sample as previously described in Section 3.1
There were significant differences (p<0.05) in the reporting for all statements across languages except
for two statements: “Communication - children” and “Culture”. In a few cases, pairs of language
groups did not differ from one another but they did differ from the third group. For example, for the
Reliance statement, the Afrikaans and isiXhosa groups did not differ significantly but the Afrikaans and
isiXhosa groups differed significantly from the English group.
The scores of the English-speaking learners tended to be slightly more positive than the other two
groups with the exception of cultural awareness, where they were least positive, and for
communication, where their mean score was the same as the Afrikaans-speaking learners.
1.00
2.00
3.00
4.00
5.00
Rating
Afrikaans
English
IsiXhosa
37
However, as noted earlier, the response rates varied across the language groups and the differences
seen in the figure may have their origin in the different response rates or in different perceptions of
the teachers in the different schools.
Differences between Boys and Girls for PSD
The mean scores comparing male and female learners in personal and social development are
reported in Figure 13.
NB: All differences were significant at the 5% level except for “Culture”
Figure 13 Mean scores for Personal and Social Development by sex for Western Cape sample. See Section 3.1 for the list of variables
The girls were rated more positively by their teachers than boys. This same pattern was seen in data
for boys and girls at the start of school in Scotland and England (Tymms et al., 2014).
Quintiles and PSD
The mean scores for each PSD statement for the different quintile groups are shown in Figure 14.
Although SES is preferred to Quintiles for analysis the Quintile classification is so widely used that it
was thought to present data by Quintile
1.00
2.00
3.00
4.00
5.00
Rating
Male
Female
38
NB One-way ANOVA test indicated significant differences, p<.05, for just five of the 11 statements: “Upset”, “Reliance”, “Impulsive”, “Communication – children” and “Culture”
Figure 14 Mean scores for Personal and Social Development by socio-economic status for Western Cape sample. See Section 3.1 for the list of variables
There are some clear differences by quintile for some of the areas of Personal and Social Development,
but there were no consistent patterns. The behaviour at the start of the school day, “Upset”, of
learners from Quintile 2 was rated less positively than their peers, as was their “Reliance” and their
impulsivity. However, they were rated more positively than their peers in their cultural awareness.
Similarly, weak associations were found from analyses of learners starting school in England and in
Scotland.
But, once again, it should be recalled that the response rates from the different groups varied and the
difference seen above could be the result of differing samples or the way that the teachers rated the
children.
5.3 Research Question 3: How much progress is made in the first
year? This section reports on the progress made by learners in the Western Cape sample over the course of
the year. It starts with a brief outline of the data at the second testing point. The analysis begins with
an exploration of missing cases and an examination of the scales to ensure that they are still
psychometrically valid and reliable. An exploration of progress over the assessment points and how
it varies between schools and subgroups then follows.
Sex
The gender breakdown was the same as for the baseline assessment (51.2% boys and 48.8% girls
respectively).
Language spoken at home
1.001.502.002.503.003.504.004.505.00
Q2
Q3
Q4
Q5
39
South Africa has 11 constitutionally recognised languages and 9 languages indigenous to the
continent. This can often cause mismatch between languages spoken by learners at home and the
language of school instruction. In the baseline assessment, the concordance between home and
instructional language was 95% for Afrikaans medium schools, 98% for Xhosa medium schools and
82% for English medium schools. The proportions attending schools with the same language medium
of instruction as the language spoken at home in the follow up reflect this.
Age
The average age at the time of the second assessment was 7.41 years (Standard Deviation = 0.48) with
the youngest child being 6.33 years and the oldest 10.15. The group was, on average, a little over
seven months older when tested for the second time. Ideally the learners would have been assessed
shortly after starting school in January and the again at the end of the school year in December but
there was a delayed start because of the “Fees must fall” campaign and the university’s forced closure.
We could not test right at the end of the school year as testing in last term is officially prohibited; we
tested as late as possible.
Missing data
7.6% of learners did not complete a follow up assessment. A series of analyses were conducted to
determine if ‘missingness’ occurred in a systematic way. There was a small but significant correlation
between SES and completing the end of year assessment (-0.11, p<0.001) indicating that data from
higher SES homes tended to be missing. There is also some indication that learners who did not take
the follow up assessment also scored lower in mathematics (by 0.67 of a logit) and reading (by 0.47 of
a logit) at the start of the year.
The cognitive measures at the end of the year
Rasch modelling was used to check that scales for reading, mathematics, vocabulary and phonological
awareness developed at the start of the year were applicable at the end of the year. No problems
were found; in other words the items difficulties remained reasonably constant.
Reading
2,497 learners had baseline and end of year assessment scores. Progress was measured by subtracting
the baseline assessment score from the end of year score. Positive values represent progress and
values less than 0 show regression. Progress is illustrated in Figure 15. All schools made progress on
average as did 97.5% of learners. A breakdown by groups is shown in Table 15.
Table 15 Descriptive statistics for progress in reading overall, by language medium and by sex in Western Cape sample
In this section, we explore the end of Grade 1 results to further understand the progress and variance
in reading and mathematics. To this end, missing data were first imputed, as before, and a series of
MLMs were constructed. The details are reported in the Appendices. Figures 20 and 21 show the ES
for each variable used in predicting the end of year results for reading and mathematics.
Reading
-0.4
-0.2
0
0.2
0.4
0.6
0.8
1
1.2
1.4
Effect SizeNon-significant
Significant
45
Figure 20 Effect Sizes from multi-level models for factors affecting reading at the end of Grade 1 in Western Cape sample
By far the most important predictor for the reading at the end of the year was the level of reading at
the start of the year; present performance is generally best predicted by prior performance. The
second most important predictor of progress was the school which the learner went to; this, at least
in part, picks up how a child is taught. Interestingly, mathematics at the start of year, was also an
important predictor for later reading presumably because it taps into generally cognitive functioning
which is associated with academic progress. Learners from more affluent backgrounds tended to
make more progress corresponding to the general educational finding that greater affluence is
associated with higher attainment levels. Learners operating in their second language made
significantly more progress than their peers perhaps because their initial assessments were hampered
by being assessed in a second language and girls made a little more progress than boys again
corresponding to the general finding that females, on average, out-perform boys in literacy.
Older learners made a little less progress than their younger peers perhaps because they missed out
on age appropriate educational activities, or, perhaps because and those with behavioural difficulties
made less progress. Finally, the higher the score on the rating scales for inattentiveness, hyperactively
and impulsiveness (Behaviour score) the slower the progress.
Mathematics
Figure 21 Effect Sizes from multi-level models for factors affecting mathematics at the end of Grade 1 in Western Cape sample
The pattern for mathematics is very similar to the pattern for reading. The strongest predictor of end
of Grade 1 mathematics was early mathematics; again, prior attainment is the best predictor of future
attainment. Next was the particular school attended followed by attendance at an IsiXhosa medium
school. Perhaps the learners in those schools, starting from the lowest initial points found it easier to
make progress. Next In importance was early reading, possibly because it provides a general indicator
-0.6
-0.4
-0.2
0
0.2
0.4
0.6
0.8
1
1.2
1.4
Effect Size
Non-significant
Significant
46
of cognitive ability. English medium schools made more progress than those in Afrikaans medium
schools. Girls made a little less progress than boys and the older pupils made less progress then their
younger peers. The higher the Behaviour score that was recorded, the slower the progress.
Vocabulary
The MLMs for vocabulary were constructed separately for each language without imputation with the
intention of running models with imputation if unexpected results were found. The models generally
produced similar patterns to those found for reading and mathematics although fewer of the variables
were statistically significant: there were fewer cases in each model because separate models were
used for each language. The vocabulary level at the start of the year was the best predictor followed
by school membership, except for IsiXhosa where there was insufficient data to distinguish schools.
For English-medium schools only, there was a significant negative coefficient for learning in a second
language meaning that learners learning in English but speaking a different language at home made
less progress by the end of the year.
47
Phonological awareness
The phonological awareness data were suited to the construction of multi-level models. A large
proportion of leaders in Afrikaans and English medium school hit the ceiling when tested on “repeats”
at the start of the year and for the rhyming section, a large number failed to score at all in schools of
all three language mediums (Howie et al., 2016). By the time of the second assessment, as noted
above, much progress had been made particular in the isiXhosa medium schools where the scores
were so low. But this progress meant that more learners were essentially on top or rhyming and
repeats and hit the ceiling of the test. This is not a failure of the assessment, but a triumph for the
learners, and means that multi-level modelling would not be appropriate.
5.4 Research Question 4: How do the learners in the Western Cape
compare with learners in England and Scotland? iPIPS has also been used to investigate learners’ cognitive development at the start of school and their
progress during the first year of school with representative samples in England and Scotland. Other
countries, including Brazil and Russia are also collecting data but these were not available to include
in the analysis at the time of writing this report. Whilst the UK context is very different to South Africa,
we nevertheless felt that it was of interest to explore differences in early childhood development.
Start of Year
Table 20 shows the reading results from the start of year assessment for the Western Cape, England
and Scotland. It is clear that the children in the Western Cape start school ahead of the two UK
countries. The major explanation for this must surely be age. In England, the average age was 4.5
years, in Scotland 5.0 years and in the Western Cape it was 6.8 years. The results are presented using
the ladders format used previously.
Table 20 Cumulative percent of children in each category for Reading at the start of school across Western Cape, England and Scotland
Western Cape England Scotland
Comprehension 1.8 0.1 0.3
Sentences 5.9 1.0 2.8
Words 39.0 10.6 21.1
Letters 96.5 91.2 96.3
Ground Level 100 100 100
A similar pattern was seen for mathematics in Table 21.
Table 21 Cumulative percent of children in each category for mathematics at the start of school across Western Cape, England and Scotland
Western Cape England Scotland
Advanced 1.3 0 0.2
Formal Arithmetic 25.4 4.6 10.6
Simple Formal Arithmetic 54.2 31.5 48.0
Informal Arithmetic 89.4 93.5 97.4
Ground Level 100 99.9 100
48
Progress during the first year of school
The charts below show the starting and end points for learners, in the three Western Cape languages
alongside the same results for England and Scotland. The figures show learners in England and
Scotland start at a lower level in reading and mathematics than those educated in Afrikaans and
English. By the end of the year, the children in the UK were ahead of the children in the Western Cape.
Despite these obvious differences, it is worth asserting that all groups started at a reasonable level for
their age and all groups made clear progress during the first year at school.
Whilst these charts are striking, there are many reasons to treat them with caution. The children
themselves are different, as are the societies. The learners started school at different average ages:
6.8 years in the Western Cape, 5.0 in Scotland (Tymms et al., 2016) and 4.5 in England (Tymms et al.,
2014). They come from families with different traditions and attitudes to education (Lawson and
Silver, 2013; Anderson et al., 2016; Spaull, 2013). The UK is more affluent than South Africa (OECD,
2017) which leads to different housing conditions, different levels of everyday stress, different levels
of crime (Numbeo, 2017), different levels of health (WHO, 2017) and different levels of provision of
pre-school education (Economist Intelligence Unit, 2012). The histories of the countries suggest that
in Scotland and England it is more likely that families have a tradition of literacy and mathematics
which they may attempt to pass on at an early stage. We also note that the UK data are from nationally
representative samples in 2012/13, whereas the South African data are from one area in 2016. We
also note that the data for South Africa represent about seven months of schooling whereas for
England and Scotland it is closer to eight months at school. These are some of the reasons why the
charts should be interpreted carefully. An interesting additional comparison should become available
soon; the iPIPS project is collecting data in Brazil and it may provide a more meaningful perspective
since the level and variation in SES is similar. The countries have parallel colonial backgrounds with
large poor groups living in Townships or Favelas.
49
NB The Y-axis is related to the ladders in Figure 3. It gives the mean level. The Ground level is given a score of 0
Figure 22 International comparison for reading progress in Western Cape languages groups, Scotland and England
NB The Y-axis is related to the ladders in Figure 4. It gives the mean level. The Ground level is given a score of 0
Figure 23 International comparison for mathematics progress in Western Cape languages groups, Scotland and England
0
1
2
3
4
Gro
un
d le
vel t
o C
om
pre
he
nsi
on
0
1
2
3
4
Gro
un
d le
vel t
o A
dva
nce
d
50
6. Summary of the findings
The analysis of the responses at the start and end of the year in the Western Cape sample show that
children starting school in the Western Cape are very diverse. They are educated in three different
languages; generally the learners are educated in the same language that is spoken at home, although
a small proportion are educated in a different language to the one spoken at home, most commonly
English. On entry to school, the learners are on average 6.8 years old; a small proportion were less
than six years old and about 10% were much older and could have started school about a year earlier.
The older learners in the cohort may have been repeating a year; we do not have information about
this. The learners come from very varied socio-economic backgrounds which was best measured by
the socio-economic assessment created for the project, which asked about access to amenities and
learning resources. The quintile classification, which is used to allocate funds to schools, was not as
useful.
The educational cognitive measures were in the areas of reading, mathematics, vocabulary and
phonological awareness. Given the wide variety of backgrounds of the learners, it is not surprising to
find a wide variation in the cognitive starting points of children. In reading, the range went from about
3% who had not reached the first rung on the ladder towards full literacy to about 2% who were
reading and understanding complex texts. In mathematics, a similar range was observed with about
10% at the stage of counting a few objects by rote to about 1% who could deal with complex
arithmetic. The project also asked teachers to rate their students on personal and social development
and that generally produced positive responses with most learners communicating well, not relying
on others and being happy at school. It should be noted that this was based on teachers’ judgements
and may have been prone to bias with some teachers rating the characteristics of their learners more
leniently than others. However, looking at the results for groups provides interesting information
about differences in development between areas such as confidence compared with concentration,
and between groups of learners.
Many learners learning in English and Afrikaans had mastered the skills of phonological awareness
when they started school, but some had not and in isiXhosa-medium schools, a high proportion were
not able to identify rhymes, although this could be because of translation issues.
Two additional key variables were whether the child had attended Grade R and a measure of
inattentive, hyperactive and impulsive behaviour using ratings by the teachers. It was clear that the
behaviour ratings suggested a higher level of difficulties amongst learners in the Western Cape than
is generally found internationally. It could be that the severity of the raters’ judgments account for
the differences, and further research could confirm this, but the scores were so high that this seems
unlikely.
MLMs were constructed to see which variables were most related to the starting levels in reading and
mathematics. Just a few factors were statistically significant and of substantive importance for both
outcomes. They are: the socio-economic background and neighbourhood of the learners, the
behaviour ratings given by the teachers in the first term and attendance at Grade R. Socio-economic
background reflects the access to resources outside of school and environments where resources are
more abundant such as access to the internet and books are likely to contain richer opportunities for
learning than environments with scarce amenities (Bourdiey and Passeron, 1990). Attending school
51
one year earlier in the Reception class provides educational input at a stage that is so important to
early childhood development. The link between inattention and educational attainment and progress
is well documented and the results of this study showed a similar pattern.
At the end of the year, similar models were constructed with end of year scores as the outcome.
Common to both outcomes (reading and mathematics), start of year scores were the most dominant
predictors of end of year scores; this is not unexpected as the best predictor of present performance
is generally past performance. The importance of school membership and behavioural difficulties
should also not be understated. Which school a child went to, and, more specifically, which teachers
taught the learner, are important factors in the progress.
The rating of personal and social development at the end of the year were similar to those at the start
of the year.
52
7. Conclusions
iPIPS is operating in a rapidly changing country and it makes sense to start this section with some
comments about the context. South Africa is experiencing an unprecedented number of assessments
on a systemic level across the country. The programme of Annual National Assessments (ANAs),
implemented since 2009, has raised the ire of teachers countrywide regarding their use for political
accountability as opposed to educational use and concerns about their quality, use and cost have been
widespread amongst academics (Howie et al., 2016). Unfortunately, the unintended consequences
emanating from ANAs have impacted on other initiatives related to assessments as schools and
teachers are suspicious of and even resistant to implementing further assessments. iPIPS differs
significantly from these and other assessments at the Foundation Phase (Grades 1-3) in its
comprehensive approach to assessing early learning of specific abilities and in its goal of measurement
across an academic year providing schools and teachers with information about the status of each
child across multiple measures both at the beginning and end of year rather than a cross-sectional
assessment which broadly covers the curriculum.
7.1 Research Question 5: What implications do these analyses
have for policies in the Western Cape? There are a number of policy implications arising from the study and they focus on alterable variables.
• The significant factors which best predict the cognitive start points on entry level to Grade 1
include one obvious educationally alterable variable and that is attendance at Grade R. If the
proportion of learners going to Grade R could be increased this would surely be of benefit.
• The analysis presented in this report suggests that progress varied from school to school even
after controlling for the home background of learner, the schools’ locations and medium of
instruction. If all schools could make the same progress as the “best” the whole system would
be transformed. We are unable to provide a recipe for success based on this study but the
starting point would be an efficient monitoring system which can help identify the best.
• A third potentially alterable variable is not under the direct control of educationalist. It relates
to the very high ratings of inattention, hyperactivity and impulsivity. Although these are
subjective ratings, and we must be cautious about interpretations, the higher the rating the
lower the initial cognitive scores of learners and the slower the progress during the first year
at school. When put alongside the independent evidence for a high rate foetal alcohol
syndrome in the Western Cape it raises concern about the health of pregnant mothers.
• A requirement of the Nuffield award was that the assessments used during the project would,
subsequently, be made “free at the point of use”. With that in mind it is interesting to note
that during three meetings with principals and teachers, there were spontaneous requests for
access to the iPIPS assessment so that the teachers can understand and help the learners at
an early stage. It would be possible to provide an abbreviated version of iPIPS which would
be paper-based and cost effective. This would be administered and analysed by schools across
the Western Cape.
• Finally, we note that older learners tended to make slower progress and we are concerned
that they will be drawn into other activities before they become fully literate or numerate if
they simply missed the start for a variety of reasons. It may be that some are repeating a year.
53
Whatever the reason, successful efforts to get the 10% of older learners into school a year
earlier or to move up a year should bear fruit.
54
References
American Psychiatric Association (2000). DSM-IV-TR: Diagnostic and statistical manual of mental
disorders, text revision. Washington, DC: American Psychiatric Association.
Anderson, R., Freeman, M., & Paterson, L. (2016). The Edinburgh History of Education in Scotland.
Edinburgh: Edinburgh University Press, 2015. Pp. 384.
Andrich, D. (2004). Controversy and the Rasch Model: A Characteristic of Incompatible Paradigms?
Medical Care, 42, I-7 to I-16. doi.org/10.1097/01.mlr.0000103528.48582.7c
Archer, E. (2011). Bridging the gap: Optimising a feedback system for monitoring learner
performance. Doctoral dissertation, University of Pretoria.
Bond, T. G. and Fox, C. M. (2001). Applying the Rasch Model: Fundamental Measurement in the
Human Sciences. Mahwah, NJ: Lawrence Erlbaum Associates.
Bourdieu, P., & Passeron, J. C. (1990). Reproduction in education, society and culture (Vol. 4). Sage.
Clay, M. M. (1972). A Diagnostic Survey and Concepts About Print Test, Sand. Auckland, NZ.
Cohen J. (1988). Statistical Power Analysis for the Behavioral Sciences. New York, NY: Routledge
Academic
Department of Education (2007). Ministerial Report on Learner Retention. Pretoria: DoE.
Economist Intelligence Unit, (2012). Benchmarking early education across the world
http://graphics.eiu.com/upload/eb/lienstartingwell.pdf (Accessed on 21 August 2017)
Edwards, V., & Ngwaru, M. J. (2011). African language publishing for children in South Africa:
challenges for translators. International Journal of Bilingual Education and Bilingualism, 14, 589 -
602. doi.org/10.1080/13670050.2011.558618
Gathercole, S. E., Willis, C. S., Emslie, H., & Baddeley, A. D. (1992). Phonological memory and
vocabulary development during the early school years: A longitudinal study. Developmental
Figure A2 Learner/item map for reading (start and end) in S. Africa with cut-scores
Cuts at -2.8, 0.1, 1.8 and 5.2
The two tables below indicate how the cut-scores were chosen for the two measures. These cut
scores were used to create easy to understand progress ladders. The progress ladder allows us to
group children by a level of ability in a language that can be understood by practitioners and parent,
rather than simply classifying children by an actual Rasch value or range. There is inevitably a degree
of arbitrariness in the precise choice of cut-score but that is thought to be worthwhile give the
advantages of grouping.
59
Table A1 The guiding principles behind the cut points are shown below
Reading: Start at the bottom and work up
Comprehension Higher Sentences Below a 50:50 chance of scoring points on a reading passage Words Below a 50:50 chance of reading a sentence Letters Below a 50:50 chance of knowing the easiest word Ground Level Below a 50:50 chance of knowing the easiest letter
Table A2 The guiding principles behind the cut points are shown below
Mathematics: Start at the bottom and work up
Advanced Higher Formal Arithmetic Below the ability to calculate 105+302 or Sum B15 Simple Formal Arithmetic Below the ability to identify 3 digit numbers Informal Arithmetic Below a 50:50 chance of identifying a 2 digit number or doing a formal sum Ground Level Below a 50:50 chance of identifying a number above 5
Imputation and multi-level models
For both the start of year and end of year data there is a need to combine all the predictor variables
together in a single model and to account for the hierarchical nature of the data. To this end
multilevel-models (MLMs) were employed (see for example Raudenbush & Willms (1995) using MlWin
version 2.36.
There were missing data, and in particular the proportions of missing data for SES (35%). For
Behaviour at the start and end of year data were available for a random sample of 68% with just 16%
missing at the start and end of the year. Further the data were not spread evenly across the sample.
Technically the data were Missing Not at Random (MNAR). We know this because the missing data
were, for example, disproportionally from learners with lower starting mathematics scores. The
differences range from small to large across the outcome of interest. However, the missingness in the
data should be considered non-ignorable and these cases should thus be included. On balance, it was
thought better to impute data and to produce as robust estimates as possible so that we could
continue to use the full sample. The technique chose was the automatic option for multiple
imputation in the SPPS software version 21 (Raghunathan et al., 2001). This employs a variety of
statistical techniques including multiple linear regression and logistic regression employing all the data
available in five iterations. The MLMs used the pooled data from the iterations which provides us with
conservative estimates for the missing cases. All the MLMs were checked against MLMs without
imputation and without missing data to ensure that similar conclusions were drawn.
The MLMs are reported below:
Table A3 MLM for start of year Reading
Fixed Null Full
Cons 0.025(0060)
English medium -0.267 (0.160)
IsiXhosa medium -0.161 (0.111)
60
Girl 0.033 (0.030)
2nd language -0.069 (0.055)
Old for the year 0.031 (0.052)
District 2 -0.032 (0.097)
District 3 -0.201 (0.070)
SES 0.104 (0.020)
Age 0.104 (0.021)
School SES 0.536 (0.113)
Behaviour start -0.296 (0.017)
Grade R 0.196 (0.044)
Random
School 0.208 (0.034) 0.162 (0.026)
Learner 0.791 (0022) 0.560 (0.015)
Figures in parentheses are Standard Errors All continuous variables were standardised to aid interpretation
Table A4 MLM for start of year mathematics
Fixed Null Full
Cons
English medium -0.285 (0.143)
IsiXhosa medium -0.279 (0.098)
Girl -0.12 (0.032)
2nd language -0.109 (0.058)
Old for the year 0.101 (0.054)
District 2 -0.046 0.086)
District 3 -0.097 (0.069)
SES 0.15 (0.021)
Age 0.072 (0.022)
School SES 0.379 (0.102)
Behaviour -0.323 (0.017)
Grade R 0.212 (0.045)
School 0.263 (0.041) 0.117 (0.020)
Learner 0.748 (0.021) 0.623 (0.017)
Figures in parentheses are Standard Errors All continuous variables were standardised to aid interpretation
Table A5 MLM for end of year Reading
Fixed Null Full
Cons 0.026 (0.053)
English medium 0.072 (0.095)
IsiXhosa medium 0.119 (0.095)
Girl 0.082 (0.024)
2nd language 0.129 (0.043)
Old for the year 0.048 (0.040)
District 2 -0.044 (0057)
61
District 3 -0.091 (0.048)
SES 0.078 (0.016)
Age -0.067 (0.016)
School SES 0.064 (0.068)
Behaviour start -0.125 (0.014)
Grade R -0.014 (0.033)
Random
School 0.25 (0.040) 0.047 (0.009)
Learner 0.756 (0.021) 0.342 (0.009)
Figures in parentheses are Standard Errors All continuous variables were standardised to aid interpretation
Table A6 MLM for end of year mathematics
Fixed Null Full
Cons -0.143 (0.072)
English medium 0.207 (0.102)
IsiXhosa medium 0.333 (0.070)
Girl -0.091 (0.025)
2nd language 0.080 (0.045)
Old for the year 0.101 (0.042)
District 2 -0.073 (0.061)
District 3 -0.079 (0.051)
SES 0.032 (0.017)
Age -0.069 (0.017)
School SES 0.048 (0.073)
Behaviour start -0.156 (0.014)
Grade R -0.017 (0.035)
Random
School 0.055 (0.010)
Learner 0.375 (0.010)
Figures in parentheses are Standard Errors All continuous variables were standardised to aid interpretation


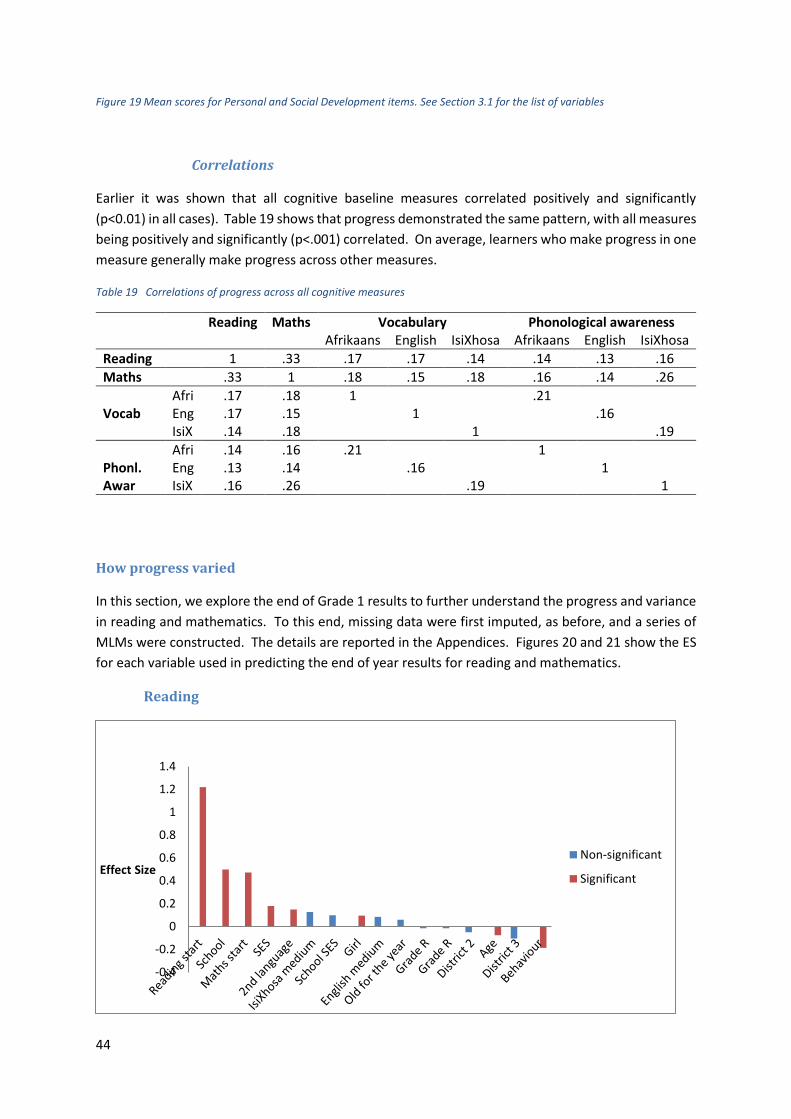


![[ Disability Sport Western Cape ]](https://static.documents.pub/doc/80x56/5681322c550346895d988a23/-disability-sport-western-cape-.jpg)


