The flexural toughness of round plastic fiber reinforced shotcrete specimens with ring-supports Seung-Hwan Han, Sang-Don Lee & Jeong-Un Lee Expressway and Transportation Research Institute, Korea In-Chang Jin Hicofiber co, Korea ABSTRACT: The functionality of shotcrete is measured by determining its two-dimensional flexural per- formance in tunnel structures. Though beam specimens have prevailingly been used to determine flexural toughness in Korea to date, the need for a more effective testing method has arisen and the panel specimens used in some other countries are being investigated. The round panel specimens with three support points have been recognized as a realistic method for testing shotcrete performance. However there are concerns that this testing method presumes too much about the crack point and is difficult to manage in the field. The objec- tives of this research are to investigate the behavior of round fiber reinforced shotcrete specimens with ring supports, and to evaluate its applicability as the standard testing method for evaluating flexural performance. It is anticipated that this method would not presume the crack path without disturbing the 2-dimensional flex- ural behavior and that it would also be easy to handle. The specimens used in this study were manufactured by being sprayed in the field and were tested against other specimens that met Korean. The conclusion of this study is that the round specimens with ring support provide a quite consistent and rational means for evaluat- ing the flexural toughness of plastic fiber reinforced shotcrete. Also, this study confirmed that some values may be provided for classifying the grade of fiber reinforced shotcrete. 1 INTRODUCTION Fibers have prevailingly been used for reinforcing the shotcrete lining in tunnel construction. One of their major roles is to maintain structural stability under the loose surface of rock spall. This capacity can be evaluated by examining toughness to endure loads under the excessive deflections of lining. There are several specified methods to evaluate the toughness characteristics, such as ASTM C 1018, ASTM C 1550, and EFNARC (European Specifica- tion For Sprayed Concrete). These specifications can be classified by speci- men types, namelypanel shape and beam shape. Panel specimens are widely accepted as having ad- vantages in simulating the actual 2D behavior of tunnel linings. Round panels have not been adopted yet in Korea, because of perceived usage difficulties and arguments regarding thepresumption of the cracking line in the process of testing , which is in- duced from the point support condition. In our research, we examined the feasibility of the smaller round panel in comparison to theASTM C 1550. This considered the easiness of handling of specimens. Furthermore the ring type boundary con- dition is used for discarding the pre-assumption of the crack path. This could let the cracks initiate and propagate to the weakest parts of the specimen. 2 TOUGHNESS OF SHOTCRETE 2.1 Definitions Toughness isdefined as the capacity to resiststatic and impact loading. More precisely, it is the energy absorption capacity of structural elements under stat- ic, dynamic, and impact loads. Every agency has its own methods to estimate this characteristic. The methods vary according to specimen type, test procedure, and representing in- dex. All methods have their own advantages and disadvantages. Therefore it is important to use the method that is best suited to the details of the situa- tion in which one is working. 2.2 Specimens Generally, specimens can be classified as either beam type or panel type specimens. Furthermore panel type can be divided into the subcategories of square panel and round panel. It is widely accepted Fracture Mechanics of Concrete and Concrete Structures - Assessment, Durability, Monitoring and Retrofitting of Concrete Structures- B. H. Oh, et al. (eds) ⓒ 2010 Korea Concrete Institute, Seoul, ISBN 978-89-5708-181-5
Transcript
The flexural toughness of round plastic fiber reinforced shotcrete specimens with ring-supports
Seung-Hwan Han, Sang-Don Lee & Jeong-Un Lee Expressway and Transportation Research Institute, Korea
In-Chang Jin Hicofiber co, Korea
ABSTRACT: The functionality of shotcrete is measured by determining its two-dimensional flexural per-formance in tunnel structures. Though beam specimens have prevailingly been used to determine flexural toughness in Korea to date, the need for a more effective testing method has arisen and the panel specimens used in some other countries are being investigated. The round panel specimens with three support points have been recognized as a realistic method for testing shotcrete performance. However there are concerns that this testing method presumes too much about the crack point and is difficult to manage in the field. The objec-tives of this research are to investigate the behavior of round fiber reinforced shotcrete specimens with ring supports, and to evaluate its applicability as the standard testing method for evaluating flexural performance. It is anticipated that this method would not presume the crack path without disturbing the 2-dimensional flex-ural behavior and that it would also be easy to handle. The specimens used in this study were manufactured by being sprayed in the field and were tested against other specimens that met Korean. The conclusion of this study is that the round specimens with ring support provide a quite consistent and rational means for evaluat-ing the flexural toughness of plastic fiber reinforced shotcrete. Also, this study confirmed that some values may be provided for classifying the grade of fiber reinforced shotcrete.
1 INTRODUCTION
Fibers have prevailingly been used for reinforcing the shotcrete lining in tunnel construction. One of their major roles is to maintain structural stability under the loose surface of rock spall. This capacity can be evaluated by examining toughness to endure loads under the excessive deflections of lining. There are several specified methods to evaluate the toughness characteristics, such as ASTM C 1018, ASTM C 1550, and EFNARC (European Specifica-tion For Sprayed Concrete).
These specifications can be classified by speci-men types, namelypanel shape and beam shape. Panel specimens are widely accepted as having ad-vantages in simulating the actual 2D behavior of tunnel linings. Round panels have not been adopted yet in Korea, because of perceived usage difficulties and arguments regarding thepresumption of the cracking line in the process of testing , which is in-duced from the point support condition.
In our research, we examined the feasibility of the smaller round panel in comparison to theASTM C 1550. This considered the easiness of handling of specimens. Furthermore the ring type boundary con-dition is used for discarding the pre-assumption of
the crack path. This could let the cracks initiate and propagate to the weakest parts of the specimen.
2 TOUGHNESS OF SHOTCRETE
2.1 Definitions
Toughness isdefined as the capacity to resiststatic and impact loading. More precisely, it is the energy absorption capacity of structural elements under stat-ic, dynamic, and impact loads.
Every agency has its own methods to estimate this characteristic. The methods vary according to specimen type, test procedure, and representing in-dex. All methods have their own advantages and disadvantages. Therefore it is important to use the method that is best suited to the details of the situa-tion in which one is working.
2.2 Specimens
Generally, specimens can be classified as either beam type or panel type specimens. Furthermore panel type can be divided into the subcategories of square panel and round panel. It is widely accepted
Fracture Mechanics of Concrete and Concrete Structures -Assessment, Durability, Monitoring and Retrofitting of Concrete Structures- B. H. Oh, et al. (eds)
ⓒ 2010 Korea Concrete Institute, Seoul, ISBN 978-89-5708-181-5
that the beam type specimens have the advantage of ease in handling and testing, but also have the disad-vantage of poorly simulating actual 2D behavior in tunnel lining. On the other hand, the panel speci-mens are widely accepted as more accurately simu-lating the 2D lining behavior. The square panel is usedin the EFNARC guide and the round panel is used in the ASTM.
The line support is recommended in the EF-NARC square panel, while the three point support is prescribed in the ASTM round panel. As mentioned before, each has the meaning whether it does deter-mine the crack path or not. In testing the square panel system, we discovered some irregular distor-tion of boundary lines in the process of loading. Specifically, part of the linear support deformed up-ward and lost contact with the support. We con-cluded that these irregularities possiblyincrease the uncertainty of the results.
Figure 1. Square panel specimen.
Figure 2. Round panel specimen.
2.3 Toughness Index
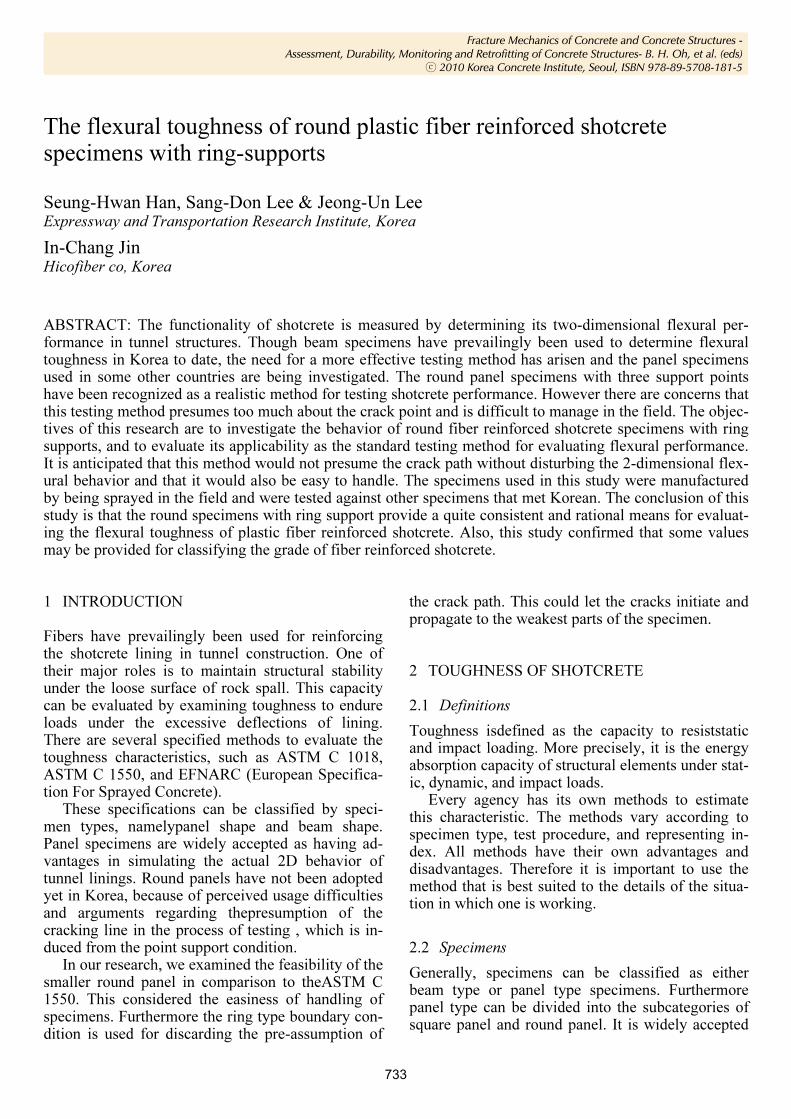
There are various ways to express the toughness of fiber reinforced concrete or shotcrete, such as resid-ual strength, equivalent flexural strength, and energy absorption.
Residual strength, which is only one stress or the average of stresses in the specified deflections, is de-scribed not only as a discrete value, but also in vari-ous ratios to strength. The equivalent strength is a mixed form of strength and energy, expressed as a virtual average strength to certain deflections (Fig. 3). When using the panel specimens, the ratio of ab-sorption energy to a certain deflection is regarded as its toughness value.
Figure 3. Absorption energy and equivalent strength.
3 TEST VARIABLES AND SPECIMENS
3.1 Test Variables
The purpose of this research is to investigate the fea-sibility of the proposed specimen type: the round shape with ring support. Therefore, round panel spe-cimens of ASTM C 1550 are considered as control specimens for comparison with the proposed round panel specimens with ring support.
Fiber types containing plastic fiber (Polypropyl-ene Fiber) and steel fiber, were used to evaluate the variability of fiber contents. The contents of plastic fiber were varied by 8kgf/m
3, 10kgf/m
3, and 12kgf/m
3.
3.2 Specimen Preparation
The preparation of the specimens and the execution of the test procedures followed the prescribed stan-dard methods. The test specimens were prepared by being casted and sprayed in the field. The mix pro-portions are described in Table 1.
Table 1. Mix proportion of concrete.
Ingredients Cement Water F.A. C.A. SP
Quantity(kgf/m3) 478 174 976 663 4.78
Two types of round panel were fabricated. One
was the round panel with the size of φ800×75mm, which is the standard specimen according to the ASTM C 1550, the other is the φ600×75mm round panel—the subject ofthis research. Not only the size of the specimens, but also the support conditions are different. Specifically, the φ800×75mm round panel has the three point support as described in Figure 2 and Figure 6, but the φ600×75mm round panel has the ring support as shown in Figure 4 and Figure 7.
Proceedings of FraMCoS-7, May 23-28, 2010
hThD ∇−= ),(J (1)
The proportionality coefficient D(h,T) is called moisture permeability and it is a nonlinear function of the relative humidity h and temperature T (Bažant & Najjar 1972). The moisture mass balance requires that the variation in time of the water mass per unit volume of concrete (water content w) be equal to the divergence of the moisture flux J
J•∇=∂
∂−
t
w (2)
The water content w can be expressed as the sum
of the evaporable water we (capillary water, water vapor, and adsorbed water) and the non-evaporable (chemically bound) water wn (Mills 1966, Pantazopoulo & Mills 1995). It is reasonable to assume that the evaporable water is a function of relative humidity, h, degree of hydration, αc, and degree of silica fume reaction, αs, i.e. we=we(h,αc,αs) = age-dependent sorption/desorption isotherm (Norling Mjonell 1997). Under this assumption and by substituting Equation 1 into Equation 2 one obtains
nscw
s
ew
c
ew
hh
Dt
h
h
ew
&&& ++∂
∂
∂
∂
=∇•∇+∂
∂
∂
∂
− αα
αα
)(
(3)
where ∂we/∂h is the slope of the sorption/desorption isotherm (also called moisture capacity). The governing equation (Equation 3) must be completed by appropriate boundary and initial conditions.
The relation between the amount of evaporable water and relative humidity is called ‘‘adsorption isotherm” if measured with increasing relativity humidity and ‘‘desorption isotherm” in the opposite case. Neglecting their difference (Xi et al. 1994), in the following, ‘‘sorption isotherm” will be used with reference to both sorption and desorption conditions. By the way, if the hysteresis of the moisture isotherm would be taken into account, two different relation, evaporable water vs relative humidity, must be used according to the sign of the variation of the relativity humidity. The shape of the sorption isotherm for HPC is influenced by many parameters, especially those that influence extent and rate of the chemical reactions and, in turn, determine pore structure and pore size distribution (water-to-cement ratio, cement chemical composition, SF content, curing time and method, temperature, mix additives, etc.). In the literature various formulations can be found to describe the sorption isotherm of normal concrete (Xi et al. 1994). However, in the present paper the semi-empirical expression proposed by Norling Mjornell (1997) is adopted because it
explicitly accounts for the evolution of hydration reaction and SF content. This sorption isotherm reads
( ) ( )( )
( ) ( )⎥⎥
⎦
⎤
⎢⎢
⎣
⎡
⎥⎥⎥
⎦
⎤
⎢⎢⎢
⎣
⎡
−
−∞
+
−∞
−=
1110
,1
110
11,
1,,
hcc
ge
scK
hcc
ge
scG
sch
ew
αα
αα
αα
αααα
(4)
where the first term (gel isotherm) represents the physically bound (adsorbed) water and the second term (capillary isotherm) represents the capillary water. This expression is valid only for low content of SF. The coefficient G1 represents the amount of water per unit volume held in the gel pores at 100% relative humidity, and it can be expressed (Norling Mjornell 1997) as
( ) ss
s
vgkc
c
c
vgk
scG αααα +=,1
(5)
where k
cvg and k
svg are material parameters. From the
maximum amount of water per unit volume that can fill all pores (both capillary pores and gel pores), one can calculate K1 as one obtains
( )1
110
110
11
22.0188.00
,1
−⎟⎠
⎞⎜⎝
⎛−∞
⎥⎥⎥
⎦
⎤
⎢⎢⎢
⎣
⎡⎟⎠
⎞⎜⎝
⎛−∞
−−+−
=
hcc
ge
hcc
geGs
ssc
w
scK
αα
αα
αα
αα
(6)
The material parameters k
cvg and k
svg and g1 can
be calibrated by fitting experimental data relevant to free (evaporable) water content in concrete at various ages (Di Luzio & Cusatis 2009b).
2.2 Temperature evolution
Note that, at early age, since the chemical reactions associated with cement hydration and SF reaction are exothermic, the temperature field is not uniform for non-adiabatic systems even if the environmental temperature is constant. Heat conduction can be described in concrete, at least for temperature not exceeding 100°C (Bažant & Kaplan 1996), by Fourier’s law, which reads
T∇−= λq (7)
where q is the heat flux, T is the absolute temperature, and λ is the heat conductivity; in this
Figure 4. Round Panel Specimen with ring support.
3.3 Test Procedures
Mounted specimens, which were positioned sym-metrically as shown in Figure 9, were center-loaded at a constant rate of 4.0±1.0mm/min to cer-tain specified deflections. The net center deflec-tions were measured by a displacement gauge at the center bottom of the specimens asthe load was applied. The measurement of deflections was con-ducted to more than 40mm for the φ800×75mm specimens with point support, and more than 25mm for the φ600×75mm specimens with ring support.
Figure 5. Toughness test of beam specimen.
Figure 6. Apparatus for the point supported panel.
Figure 7. Apparatus for the ring sopported panel.
Figure 8. The ring supported panel specimen.
Figure 9. View of tested panel specimen.
4 TEST RESULTS
4.1 Cracking Pattern
The φ800×75mm point supported panels have for-malized cracking patterns due to the predictable crack lines that form as a result of theirsupport con-dition. The three primary cracks occur at the center of the two adjacent point supports, and they propa-gate outward from the center to the edge as shown in Figure 10. However, the φ600×75mm ring supported panels have no predetermined failure line due to
Proceedings of FraMCoS-7, May 23-28, 2010
hThD ∇−= ),(J (1)
The proportionality coefficient D(h,T) is called moisture permeability and it is a nonlinear function of the relative humidity h and temperature T (Bažant & Najjar 1972). The moisture mass balance requires that the variation in time of the water mass per unit volume of concrete (water content w) be equal to the divergence of the moisture flux J
J•∇=∂
∂−
t
w (2)
The water content w can be expressed as the sum
of the evaporable water we (capillary water, water vapor, and adsorbed water) and the non-evaporable (chemically bound) water wn (Mills 1966, Pantazopoulo & Mills 1995). It is reasonable to assume that the evaporable water is a function of relative humidity, h, degree of hydration, αc, and degree of silica fume reaction, αs, i.e. we=we(h,αc,αs) = age-dependent sorption/desorption isotherm (Norling Mjonell 1997). Under this assumption and by substituting Equation 1 into Equation 2 one obtains
nscw
s
ew
c
ew
hh
Dt
h
h
ew
&&& ++∂
∂
∂
∂
=∇•∇+∂
∂
∂
∂
− αα
αα
)(
(3)
where ∂we/∂h is the slope of the sorption/desorption isotherm (also called moisture capacity). The governing equation (Equation 3) must be completed by appropriate boundary and initial conditions.
The relation between the amount of evaporable water and relative humidity is called ‘‘adsorption isotherm” if measured with increasing relativity humidity and ‘‘desorption isotherm” in the opposite case. Neglecting their difference (Xi et al. 1994), in the following, ‘‘sorption isotherm” will be used with reference to both sorption and desorption conditions. By the way, if the hysteresis of the moisture isotherm would be taken into account, two different relation, evaporable water vs relative humidity, must be used according to the sign of the variation of the relativity humidity. The shape of the sorption isotherm for HPC is influenced by many parameters, especially those that influence extent and rate of the chemical reactions and, in turn, determine pore structure and pore size distribution (water-to-cement ratio, cement chemical composition, SF content, curing time and method, temperature, mix additives, etc.). In the literature various formulations can be found to describe the sorption isotherm of normal concrete (Xi et al. 1994). However, in the present paper the semi-empirical expression proposed by Norling Mjornell (1997) is adopted because it
explicitly accounts for the evolution of hydration reaction and SF content. This sorption isotherm reads
( ) ( )( )
( ) ( )⎥⎥
⎦
⎤
⎢⎢
⎣
⎡
⎥⎥⎥
⎦
⎤
⎢⎢⎢
⎣
⎡
−
−∞
+
−∞
−=
1110
,1
110
11,
1,,
hcc
ge
scK
hcc
ge
scG
sch
ew
αα
αα
αα
αααα
(4)
where the first term (gel isotherm) represents the physically bound (adsorbed) water and the second term (capillary isotherm) represents the capillary water. This expression is valid only for low content of SF. The coefficient G1 represents the amount of water per unit volume held in the gel pores at 100% relative humidity, and it can be expressed (Norling Mjornell 1997) as
( ) ss
s
vgkc
c
c
vgk
scG αααα +=,1
(5)
where k
cvg and k
svg are material parameters. From the
maximum amount of water per unit volume that can fill all pores (both capillary pores and gel pores), one can calculate K1 as one obtains
( )1
110
110
11
22.0188.00
,1
−⎟⎠
⎞⎜⎝
⎛−∞
⎥⎥⎥
⎦
⎤
⎢⎢⎢
⎣
⎡⎟⎠
⎞⎜⎝
⎛−∞
−−+−
=
hcc
ge
hcc
geGs
ssc
w
scK
αα
αα
αα
αα
(6)
The material parameters k
cvg and k
svg and g1 can
be calibrated by fitting experimental data relevant to free (evaporable) water content in concrete at various ages (Di Luzio & Cusatis 2009b).
2.2 Temperature evolution
Note that, at early age, since the chemical reactions associated with cement hydration and SF reaction are exothermic, the temperature field is not uniform for non-adiabatic systems even if the environmental temperature is constant. Heat conduction can be described in concrete, at least for temperature not exceeding 100°C (Bažant & Kaplan 1996), by Fourier’s law, which reads
T∇−= λq (7)
where q is the heat flux, T is the absolute temperature, and λ is the heat conductivity; in this
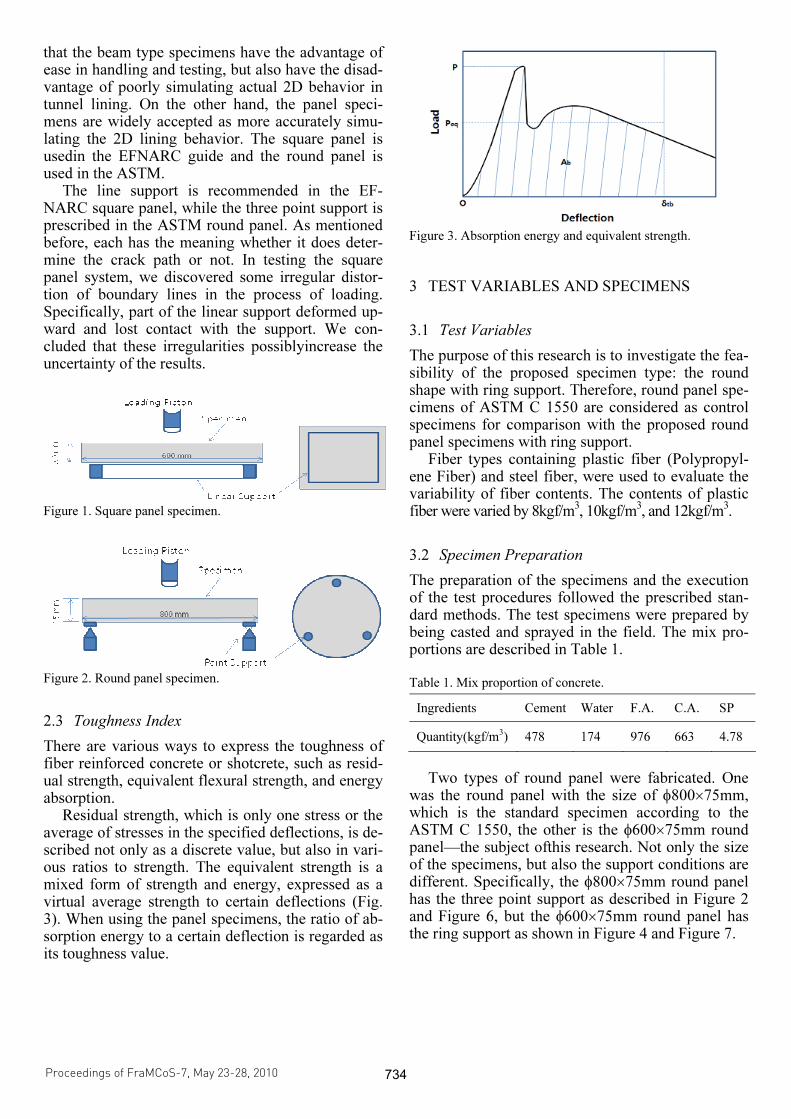
their continuous support condition. The crack loca-tion and number of cracks might vary according to the specimen characteristics. The five or six cracks generally occur in the specimens as shown in Figure 11 and Figure 12. It is not easy to distinguish one crack pattern in the ring supported panel, and it is in-ferred that the varianceof crack patterns is a natural phenomenon of these specimens.
Figure 10. Typical crack pattern of point supported panel.
Figure 11. Crack pattern-1 of ring supported panel.
Figure 12. Crack pattern-2 of ring supported panel.
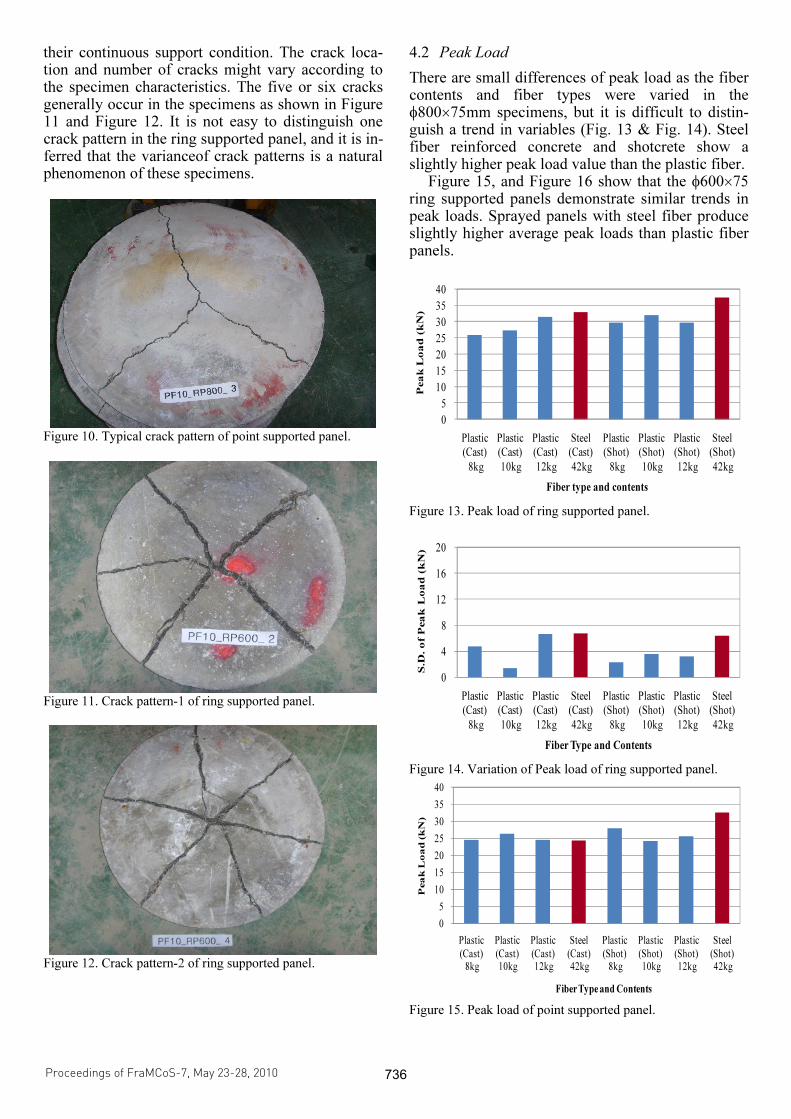
4.2 Peak Load
There are small differences of peak load as the fiber contents and fiber types were varied in the φ800×75mm specimens, but it is difficult to distin-guish a trend in variables (Fig. 13 & Fig. 14). Steel fiber reinforced concrete and shotcrete show a slightly higher peak load value than the plastic fiber.
Figure 15, and Figure 16 show that the φ600×75 ring supported panels demonstrate similar trends in peak loads. Sprayed panels with steel fiber produce slightly higher average peak loads than plastic fiber panels.
0
5
10
15
20
25
30
35
40
Plastic
(Cast)
8kg
Plastic
(Cast)
10kg
Plastic
(Cast)
12kg
Steel
(Cast)
42kg
Plastic
(Shot)
8kg
Plastic
(Shot)
10kg
Plastic
(Shot)
12kg
Steel
(Shot)
42kg
Pea
k L
oa
d (
kN
)
Fiber type and contents
Figure 13. Peak load of ring supported panel.
0
4
8
12
16
20
Plastic
(Cast)
8kg
Plastic
(Cast)
10kg
Plastic
(Cast)
12kg
Steel
(Cast)
42kg
Plastic
(Shot)
8kg
Plastic
(Shot)
10kg
Plastic
(Shot)
12kg
Steel
(Shot)
42kg
S.D
. o
f P
ea
k L
oa
d (
kN
)
Fiber Type and Contents
Figure 14. Variation of Peak load of ring supported panel.
0
5
10
15
20
25
30
35
40
Plastic
(Cast)8kg
Plastic
(Cast)10kg
Plastic
(Cast)12kg
Steel
(Cast)42kg
Plastic
(Shot)8kg
Plastic
(Shot)10kg
Plastic
(Shot)12kg
Steel
(Shot)42kg
Pea
k L
oa
d (k
N)
Fiber Type and Contents
Figure 15. Peak load of point supported panel.
Proceedings of FraMCoS-7, May 23-28, 2010
hThD ∇−= ),(J (1)
The proportionality coefficient D(h,T) is called moisture permeability and it is a nonlinear function of the relative humidity h and temperature T (Bažant & Najjar 1972). The moisture mass balance requires that the variation in time of the water mass per unit volume of concrete (water content w) be equal to the divergence of the moisture flux J
J•∇=∂
∂−
t
w (2)
The water content w can be expressed as the sum
of the evaporable water we (capillary water, water vapor, and adsorbed water) and the non-evaporable (chemically bound) water wn (Mills 1966, Pantazopoulo & Mills 1995). It is reasonable to assume that the evaporable water is a function of relative humidity, h, degree of hydration, αc, and degree of silica fume reaction, αs, i.e. we=we(h,αc,αs) = age-dependent sorption/desorption isotherm (Norling Mjonell 1997). Under this assumption and by substituting Equation 1 into Equation 2 one obtains
nscw
s
ew
c
ew
hh
Dt
h
h
ew
&&& ++∂
∂
∂
∂
=∇•∇+∂
∂
∂
∂
− αα
αα
)(
(3)
where ∂we/∂h is the slope of the sorption/desorption isotherm (also called moisture capacity). The governing equation (Equation 3) must be completed by appropriate boundary and initial conditions.
The relation between the amount of evaporable water and relative humidity is called ‘‘adsorption isotherm” if measured with increasing relativity humidity and ‘‘desorption isotherm” in the opposite case. Neglecting their difference (Xi et al. 1994), in the following, ‘‘sorption isotherm” will be used with reference to both sorption and desorption conditions. By the way, if the hysteresis of the moisture isotherm would be taken into account, two different relation, evaporable water vs relative humidity, must be used according to the sign of the variation of the relativity humidity. The shape of the sorption isotherm for HPC is influenced by many parameters, especially those that influence extent and rate of the chemical reactions and, in turn, determine pore structure and pore size distribution (water-to-cement ratio, cement chemical composition, SF content, curing time and method, temperature, mix additives, etc.). In the literature various formulations can be found to describe the sorption isotherm of normal concrete (Xi et al. 1994). However, in the present paper the semi-empirical expression proposed by Norling Mjornell (1997) is adopted because it
explicitly accounts for the evolution of hydration reaction and SF content. This sorption isotherm reads
( ) ( )( )
( ) ( )⎥⎥
⎦
⎤
⎢⎢
⎣
⎡
⎥⎥⎥
⎦
⎤
⎢⎢⎢
⎣
⎡
−
−∞
+
−∞
−=
1110
,1
110
11,
1,,
hcc
ge
scK
hcc
ge
scG
sch
ew
αα
αα
αα
αααα
(4)
where the first term (gel isotherm) represents the physically bound (adsorbed) water and the second term (capillary isotherm) represents the capillary water. This expression is valid only for low content of SF. The coefficient G1 represents the amount of water per unit volume held in the gel pores at 100% relative humidity, and it can be expressed (Norling Mjornell 1997) as
( ) ss
s
vgkc
c
c
vgk
scG αααα +=,1
(5)
where k
cvg and k
svg are material parameters. From the
maximum amount of water per unit volume that can fill all pores (both capillary pores and gel pores), one can calculate K1 as one obtains
( )1
110
110
11
22.0188.00
,1
−⎟⎠
⎞⎜⎝
⎛−∞
⎥⎥⎥
⎦
⎤
⎢⎢⎢
⎣
⎡⎟⎠
⎞⎜⎝
⎛−∞
−−+−
=
hcc
ge
hcc
geGs
ssc
w
scK
αα
αα
αα
αα
(6)
The material parameters k
cvg and k
svg and g1 can
be calibrated by fitting experimental data relevant to free (evaporable) water content in concrete at various ages (Di Luzio & Cusatis 2009b).
2.2 Temperature evolution
Note that, at early age, since the chemical reactions associated with cement hydration and SF reaction are exothermic, the temperature field is not uniform for non-adiabatic systems even if the environmental temperature is constant. Heat conduction can be described in concrete, at least for temperature not exceeding 100°C (Bažant & Kaplan 1996), by Fourier’s law, which reads
T∇−= λq (7)
where q is the heat flux, T is the absolute temperature, and λ is the heat conductivity; in this
0
4
8
12
16
20
Plastic
(Cast)8kg
Plastic
(Cast)10kg
Plastic
(Cast)12kg
Steel
(Cast)42kg
Plastic
(Shot)8kg
Plastic
(Shot)10kg
Plastic
(Shot)12kg
Steel
(Shot)42kg
S.D
. o
f P
ea
k L
oa
d (k
N)
Fiber Type and Contents
Figure 16. Variation of Peak load of point supported panel.
Flexural strength of beam specimens was also
evaluated for the same batch of concrete. From the test results, it was concluded that there were no sig-nificant variation of flexural strength among the variables. Even higher contents, 12% of plastic fiber shotcrete showed a higher flexural strength of beam specimens as shown in Figure 17.
0.00
2.00
4.00
6.00
8.00
10.00
Plastic
(Cast)8kg
Plastic
(Cast)10kg
Plastic
(Cast)12kg
Steel
(Cast)42kg
Plastic
(Shot)8kg
Plastic
(Shot)10kg
Plastic
(Shot)12kg
Steel
(Shot)42kg
Fle
xu
ra
l S
tren
gth
(M
pa
)
Fiber Type and Contents
Figure 17. Flexural strength of beam specimens.
4.3 Energy Absorption
Normally, the toughness of tunnel shotcrete lining is expressed in terms of energy absorption. The EF-NARC and ASTM standard test specificationmeth-ods for calculating energy absorption were followed in this research.
It was expected that the specimens with ring sup-port would have no distinct failure surface and would show some fluctuating results. The crack generally propagates through the structure by fol-lowing the weakest path according to the applied loads, and this has relevance toreal-world behavior.
The test results of absorption energy are shown in figures 18 through 21The first two figures show the energy value and its variance of φ600×75mm panels with ring support, and the last two figures show the energy values and variance of φ800×75mm with point support.
0
100
200
300
400
500
600
700
Plastic
(Cast)8kg
Plastic
(Cast)10kg
Plastic
(Cast)12kg
Steel
(Cast)42kg
Plastic
(Shot)8kg
Plastic
(Shot)10kg
Plastic
(Shot)12kg
Steel
(Shot)42kg
En
erg
y (J
)
Fiber Type and Contents
Figure 18. Absorption energy of ring supported panel.
0
5
10
15
20
25
30
Plastic
(Cast)8kg
Plastic
(Cast)10kg
Plastic
(Cast)12kg
Steel
(Cast)42kg
Plastic
(Shot)8kg
Plastic
(Shot)10kg
Plastic
(Shot)12kg
Steel
(Shot)42kg
Co
eff
. o
f V
aria
nce (%
)
Fiber Type and Contents
Figure 19. Variance of energy in ring support panel.
As can be seen in the figures, the plastic fiber re-
inforced concrete and shotcrete specimens both re-veal a rise in absorption energy as fiber contents are increased. Insufficent datafor the performance of the plastic fiber specimens with 10kg/m
3 fiber contents
make the resultsomewhat inconclusive. However, the plastic fiber reinforced concrete and shotcrete showed higher absorption energy than even the steel fiber reinforced panels.
The variance of test results is slightly higher in the ring supported panels than the point supported panels, as was expected. The ASTM specifies the al-lowable discrepancy as 17% between specimens in the same test. Some test results of φ600×75mm pan-els have a higher variance than this value, but all have less than 23%.
It can be assumed that this variance can be reduced to the specified value if we increase the number of specimens to a certain value. For convenience, only three specimens were tested at each variable, but more than six specimens are recommended.
4.4 Correlation Between Energy Absorption
We attempted to ascertain if there was a correlation between the ring supported panel and the point sup-ported panel as specified in the ASTM. Some corre-lation can be confirmed as shown in Figure 14, but
Proceedings of FraMCoS-7, May 23-28, 2010
hThD ∇−= ),(J (1)
The proportionality coefficient D(h,T) is called moisture permeability and it is a nonlinear function of the relative humidity h and temperature T (Bažant & Najjar 1972). The moisture mass balance requires that the variation in time of the water mass per unit volume of concrete (water content w) be equal to the divergence of the moisture flux J
J•∇=∂
∂−
t
w (2)
The water content w can be expressed as the sum
of the evaporable water we (capillary water, water vapor, and adsorbed water) and the non-evaporable (chemically bound) water wn (Mills 1966, Pantazopoulo & Mills 1995). It is reasonable to assume that the evaporable water is a function of relative humidity, h, degree of hydration, αc, and degree of silica fume reaction, αs, i.e. we=we(h,αc,αs) = age-dependent sorption/desorption isotherm (Norling Mjonell 1997). Under this assumption and by substituting Equation 1 into Equation 2 one obtains
nscw
s
ew
c
ew
hh
Dt
h
h
ew
&&& ++∂
∂
∂
∂
=∇•∇+∂
∂
∂
∂
− αα
αα
)(
(3)
where ∂we/∂h is the slope of the sorption/desorption isotherm (also called moisture capacity). The governing equation (Equation 3) must be completed by appropriate boundary and initial conditions.
The relation between the amount of evaporable water and relative humidity is called ‘‘adsorption isotherm” if measured with increasing relativity humidity and ‘‘desorption isotherm” in the opposite case. Neglecting their difference (Xi et al. 1994), in the following, ‘‘sorption isotherm” will be used with reference to both sorption and desorption conditions. By the way, if the hysteresis of the moisture isotherm would be taken into account, two different relation, evaporable water vs relative humidity, must be used according to the sign of the variation of the relativity humidity. The shape of the sorption isotherm for HPC is influenced by many parameters, especially those that influence extent and rate of the chemical reactions and, in turn, determine pore structure and pore size distribution (water-to-cement ratio, cement chemical composition, SF content, curing time and method, temperature, mix additives, etc.). In the literature various formulations can be found to describe the sorption isotherm of normal concrete (Xi et al. 1994). However, in the present paper the semi-empirical expression proposed by Norling Mjornell (1997) is adopted because it
explicitly accounts for the evolution of hydration reaction and SF content. This sorption isotherm reads
( ) ( )( )
( ) ( )⎥⎥
⎦
⎤
⎢⎢
⎣
⎡
⎥⎥⎥
⎦
⎤
⎢⎢⎢
⎣
⎡
−
−∞
+
−∞
−=
1110
,1
110
11,
1,,
hcc
ge
scK
hcc
ge
scG
sch
ew
αα
αα
αα
αααα
(4)
where the first term (gel isotherm) represents the physically bound (adsorbed) water and the second term (capillary isotherm) represents the capillary water. This expression is valid only for low content of SF. The coefficient G1 represents the amount of water per unit volume held in the gel pores at 100% relative humidity, and it can be expressed (Norling Mjornell 1997) as
( ) ss
s
vgkc
c
c
vgk
scG αααα +=,1
(5)
where k
cvg and k
svg are material parameters. From the
maximum amount of water per unit volume that can fill all pores (both capillary pores and gel pores), one can calculate K1 as one obtains
( )1
110
110
11
22.0188.00
,1
−⎟⎠
⎞⎜⎝
⎛−∞
⎥⎥⎥
⎦
⎤
⎢⎢⎢
⎣
⎡⎟⎠
⎞⎜⎝
⎛−∞
−−+−
=
hcc
ge
hcc
geGs
ssc
w
scK
αα
αα
αα
αα
(6)
The material parameters k
cvg and k
svg and g1 can
be calibrated by fitting experimental data relevant to free (evaporable) water content in concrete at various ages (Di Luzio & Cusatis 2009b).
2.2 Temperature evolution
Note that, at early age, since the chemical reactions associated with cement hydration and SF reaction are exothermic, the temperature field is not uniform for non-adiabatic systems even if the environmental temperature is constant. Heat conduction can be described in concrete, at least for temperature not exceeding 100°C (Bažant & Kaplan 1996), by Fourier’s law, which reads
T∇−= λq (7)
where q is the heat flux, T is the absolute temperature, and λ is the heat conductivity; in this
the correlation is notdistinct. This may beovercomed as more test resultsare accumulated. However, ac-cording to the results of this study, we cannot de-scribe the correlation as certain. However, the dif-ference between two support conditions, provide the individual failure mechanism from the other.
0
100
200
300
400
500
600
700
Plastic
(Cast)8kg
Plastic
(Cast)10kg
Plastic
(Cast)12kg
Steel
(Cast)42kg
Plastic
(Shot)8kg
Plastic
(Shot)10kg
Plastic
(Shot)12kg
Steel
(Shot)42kg
En
erg
y (J
)
Fiber Type and Contents
Figure 20. Absorption energy of point supported panel.
0
5
10
15
20
25
30
Plastic
(Cast)8kg
Plastic
(Cast)10kg
Plastic
(Cast)12kg
Steel
(Cast)42kg
Plastic
(Shot)8kg
Plastic
(Shot)10kg
Plastic
(Shot)12kg
Steel
(Shot)42kg
Co
eff
. o
f V
aria
nce (%
)
Fiber Type and Contents
Figure 21. Variance of energy in point support panel.
y = 0.000x2 + 0.742x + 58.94
R² = 0.401
0
200
400
600
800
1000
1200
0 200 400 600 800 1000
En
erg
y o
f 8
00
mm
Ro
un
d P
an
el (J
)
Energy of 600mm Round Panel (J) Figure 22. Correlation between two test results.
5 CONCLUSIONS
It is not easy to define the characteristics required for the safety of permanent shotcrete lining, but toughness, as defined by absorption energy, is the
accepted standard. The panel specimens accurately represent the two dimensional behavior of lining, and have been preferred for this reason.
However, the square panel has the disadvantage of an irregular support condition, so that, in the process of loading,parts of the support lose their contact. The predetermined crack line might have a possibility of the non-conservative estimation in the round panel specimens with point support. Some field managers also complain that the φ800×75mm round panel specimens have quality control difficul-ties. The applicability of the φ600×75mm panels is evaluated in this research for evaluating the tough-ness of the test specimen.
(1) The crack patterns of the φ600×75mm panels
with ring support, are not uniform among the
specimens. But we did not find that these vari-
able crack patterns seriously influenced the test
results of toughness.
(2) The toughness results of the φ600×75mm panels
with ring support, might discern the toughness of
the fiber reinforced shotcrete with variable fiber
contents.
(3) It is found that the ring supported panel have a
higher fluctuation of data than the point sup-
ported panel, but the increase is not quite as high
as was assumed.
(4) There are many efforts stillneeded in order to use
the φ600×75mm panels for evaluating the tough-
ness of fiber reinforced concrete and shotcrete,
such as developing the energy requirement, set-
ting updetailed procedures to ensure consistent
methods, and inducing the correction factor.
ACKNOWLEDGEMENT
This research was supported by a grant(06-CIT-A02:Standardization Research for Construction Ma-terials) from Construction Infrastructure Technology Program funded by Ministry of Construction & Transportation of Korean Government.
REFERENCES
ASTM 2003, ASTM C 1550-03a “Standard Test Method for Flexural Toughness of Fiber Reinforced Concrete (Using Centrally Loaded Round Panel),” Annual Book of ASTM Standard, Vol.04.02, USA.
Bernard, E. S. 2000, “Behavior of Round Steel Fiber Rein-forced Concrete Panels under Point Loads,” Materials and Structures, RILEM, V.33, pp.181-188.
EFNARC 1999, “European Specification for Sprayed Concrete Guidelines,” United Kingdom.
Proceedings of FraMCoS-7, May 23-28, 2010
hThD ∇−= ),(J (1)
The proportionality coefficient D(h,T) is called moisture permeability and it is a nonlinear function of the relative humidity h and temperature T (Bažant & Najjar 1972). The moisture mass balance requires that the variation in time of the water mass per unit volume of concrete (water content w) be equal to the divergence of the moisture flux J
J•∇=∂
∂−
t
w (2)
The water content w can be expressed as the sum
of the evaporable water we (capillary water, water vapor, and adsorbed water) and the non-evaporable (chemically bound) water wn (Mills 1966, Pantazopoulo & Mills 1995). It is reasonable to assume that the evaporable water is a function of relative humidity, h, degree of hydration, αc, and degree of silica fume reaction, αs, i.e. we=we(h,αc,αs) = age-dependent sorption/desorption isotherm (Norling Mjonell 1997). Under this assumption and by substituting Equation 1 into Equation 2 one obtains
nscw
s
ew
c
ew
hh
Dt
h
h
ew
&&& ++∂
∂
∂
∂
=∇•∇+∂
∂
∂
∂
− αα
αα
)(
(3)
where ∂we/∂h is the slope of the sorption/desorption isotherm (also called moisture capacity). The governing equation (Equation 3) must be completed by appropriate boundary and initial conditions.
The relation between the amount of evaporable water and relative humidity is called ‘‘adsorption isotherm” if measured with increasing relativity humidity and ‘‘desorption isotherm” in the opposite case. Neglecting their difference (Xi et al. 1994), in the following, ‘‘sorption isotherm” will be used with reference to both sorption and desorption conditions. By the way, if the hysteresis of the moisture isotherm would be taken into account, two different relation, evaporable water vs relative humidity, must be used according to the sign of the variation of the relativity humidity. The shape of the sorption isotherm for HPC is influenced by many parameters, especially those that influence extent and rate of the chemical reactions and, in turn, determine pore structure and pore size distribution (water-to-cement ratio, cement chemical composition, SF content, curing time and method, temperature, mix additives, etc.). In the literature various formulations can be found to describe the sorption isotherm of normal concrete (Xi et al. 1994). However, in the present paper the semi-empirical expression proposed by Norling Mjornell (1997) is adopted because it
explicitly accounts for the evolution of hydration reaction and SF content. This sorption isotherm reads
( ) ( )( )
( ) ( )⎥⎥
⎦
⎤
⎢⎢
⎣
⎡
⎥⎥⎥
⎦
⎤
⎢⎢⎢
⎣
⎡
−
−∞
+
−∞
−=
1110
,1
110
11,
1,,
hcc
ge
scK
hcc
ge
scG
sch
ew
αα
αα
αα
αααα
(4)
where the first term (gel isotherm) represents the physically bound (adsorbed) water and the second term (capillary isotherm) represents the capillary water. This expression is valid only for low content of SF. The coefficient G1 represents the amount of water per unit volume held in the gel pores at 100% relative humidity, and it can be expressed (Norling Mjornell 1997) as
( ) ss
s
vgkc
c
c
vgk
scG αααα +=,1
(5)
where k
cvg and k
svg are material parameters. From the
maximum amount of water per unit volume that can fill all pores (both capillary pores and gel pores), one can calculate K1 as one obtains
( )1
110
110
11
22.0188.00
,1
−⎟⎠
⎞⎜⎝
⎛−∞
⎥⎥⎥
⎦
⎤
⎢⎢⎢
⎣
⎡⎟⎠
⎞⎜⎝
⎛−∞
−−+−
=
hcc
ge
hcc
geGs
ssc
w
scK
αα
αα
αα
αα
(6)
The material parameters k
cvg and k
svg and g1 can
be calibrated by fitting experimental data relevant to free (evaporable) water content in concrete at various ages (Di Luzio & Cusatis 2009b).
2.2 Temperature evolution
Note that, at early age, since the chemical reactions associated with cement hydration and SF reaction are exothermic, the temperature field is not uniform for non-adiabatic systems even if the environmental temperature is constant. Heat conduction can be described in concrete, at least for temperature not exceeding 100°C (Bažant & Kaplan 1996), by Fourier’s law, which reads
T∇−= λq (7)
where q is the heat flux, T is the absolute temperature, and λ is the heat conductivity; in this