S-036 (10/2008) 02162017.1035 Page 1 of 1 2017 Regular Session The Florida Senate COMMITTEE MEETING EXPANDED AGENDA APPROPRIATIONS SUBCOMMITTEE ON PRE-K - 12 EDUCATION Senator Simmons, Chair Senator Young, Vice Chair MEETING DATE: Thursday, February 16, 2017 TIME: 9:00—10:30 a.m. PLACE: Pat Thomas Committee Room, 412 Knott Building MEMBERS: Senator Simmons, Chair; Senator Young, Vice Chair; Senators Broxson, Farmer, Grimsley, Lee, Montford, and Rouson TAB BILL NO. and INTRODUCER BILL DESCRIPTION and SENATE COMMITTEE ACTIONS COMMITTEE ACTION 1 Budget Workshop Discussed Other Related Meeting Documents
Transcript
S-036 (10/2008) 02162017.1035 Page 1 of 1
2017 Regular Session The Florida Senate
COMMITTEE MEETING EXPANDED AGENDA
APPROPRIATIONS SUBCOMMITTEE ON PRE-K - 12 EDUCATION
Senator Simmons, Chair
Senator Young, Vice Chair
MEETING DATE: Thursday, February 16, 2017
TIME: 9:00—10:30 a.m. PLACE: Pat Thomas Committee Room, 412 Knott Building
MEMBERS: Senator Simmons, Chair; Senator Young, Vice Chair; Senators Broxson, Farmer, Grimsley, Lee, Montford, and Rouson
TAB BILL NO. and INTRODUCER BILL DESCRIPTION and
SENATE COMMITTEE ACTIONS COMMITTEE ACTION
1
Budget Workshop
Discussed
Other Related Meeting Documents
THE FLORIDA LEGISLATURE’S OFFICE OF PROGRAM POLICY ANALYSIS & GOVERNMENT ACCOUNTABILI TY
OPPAGA Analysis of theExtra Hour Initiative
February 15, 2017
Mark Baird,Senior Legislative Analyst
A presentation to the Senate Appropriations Subcommittee on Pre-K - 12 Education
oppag THE FLORIDA LEGISLATURE’S OFFICE OF PROGRAM POLICY ANALYSIS & GOVERNMENT ACCOUNTABILI TY
Overview
Review of Prior OPPAGA Analyses on Low 100 Elementary Schools in Years One and Two of Program
Low 300 School Performance: Increase in Percentage of Students Performing Satisfactorily
Low 300 School Performance: Number of Schools Moving off Low 300 List
1
2
3
2
THE FLORIDA LEGISLATURE’S OFFICE OF PROGRAM POLICY ANALYSIS & GOVERNMENT ACCOUNTABILI TY
Prior OPPAGA Analyses of Low 100 School Outcomes
3
THE FLORIDA LEGISLATURE’S OFFICE OF PROGRAM POLICY ANALYSIS & GOVERNMENT ACCOUNTABILI TY
Changes in the Number of Schools on List and Assessments Used to Rank Schools
• Lowest 100 elementary schools participating in 2012-13 based on 2011-12 FCAT 2.0 Reading scores
Year 1: 2011-12
• Lowest 100 elementary schools participating in 2013-14 based on 2012-13 FCAT 2.0 Reading scores
Year 2: 2012-13
• Lowest 300 elementary schools participating in 2014-15 based on 2013-14 FCAT 2.0 Reading scores
Year 3: 2013-14
• Lowest 300 elementary schools participating in 2015-16 remained the same as the previous year1
Year 4: 2014-15
• Lowest 300 elementary schools participating in 2016-17 based on 2015-16 FSA English Language Arts scores
Year 5: 2015-161DOE did not want to choose a new 2014-15 list due to FSA replacing the FCAT as the statewide assessment and a required validation study of the FSA.
List Year
4
Analysis of the 100 Lowest Performing Schools in First Two Years of Program
Moved off of the Low 100 listYear One: 69% (66 of 96) schoolsYear Two: 65% (61 of 94) schools
Increased the percentage of students reading at grade level
Year One: 76% (73 of 96) schoolsYear Two: 69% (65 of 94) schools
Increased the percentage of below-grade-level students who made a year’s worth of growth
Year One: 75% (72 of 96) schoolsYear Two: 78% (73 of 94) schools
5
At 19 Extra Hour schools, students performed better than similar students at non-participating schools in Year Two
At 13 Extra Hour schools, students performed lower than similar students at non-participating schools in Year Two
These changes were statistically significant
At 19 Schools, Students Performed Statistically Better Than Similar Students in non-Low 100 Schools in Year Two
6
THE FLORIDA LEGISLATURE’S OFFICE OF PROGRAM POLICY ANALYSIS & GOVERNMENT ACCOUNTABILI TY
Low 300 School Outcomes
7
THE FLORIDA LEGISLATURE’S OFFICE OF PROGRAM POLICY ANALYSIS & GOVERNMENT ACCOUNTABILI TY
Analysis Results Should Be Interpreted With Caution
• The FSA English Language Arts assesses bothreading and writing in grades 4 to 10 and thus isnot directly comparable to the FCAT Readingassessment1
• Florida experienced implementation challengeswith the initial year of the FSA English LanguageArts (2014-15)
1 Students in grades 3 to 10 take the reading component of the ELA assessment. Students in grades 4 to 10 also take both the reading and writing components of the ELA assessment; DOE does not publish scores for reading separate from composite scores.
8
THE FLORIDA LEGISLATURE’S OFFICE OF PROGRAM POLICY ANALYSIS & GOVERNMENT ACCOUNTABILI TY
How many Extra Hour schools increased the percentageof students performing satisfactory or above on statewideassessments?
OPPAGA’s Analysis Addressed Two Questions
We used school accountability report data publishedby the Department of Education to address tworesearch questions
1
How many Extra Hour schools moved off of the Low 300List?2
9
THE FLORIDA LEGISLATURE’S OFFICE OF PROGRAM POLICY ANALYSIS & GOVERNMENT ACCOUNTABILI TY
How many Extra Hour schools increased the percentage of students performing satisfactory or above on
statewide assessments?
10
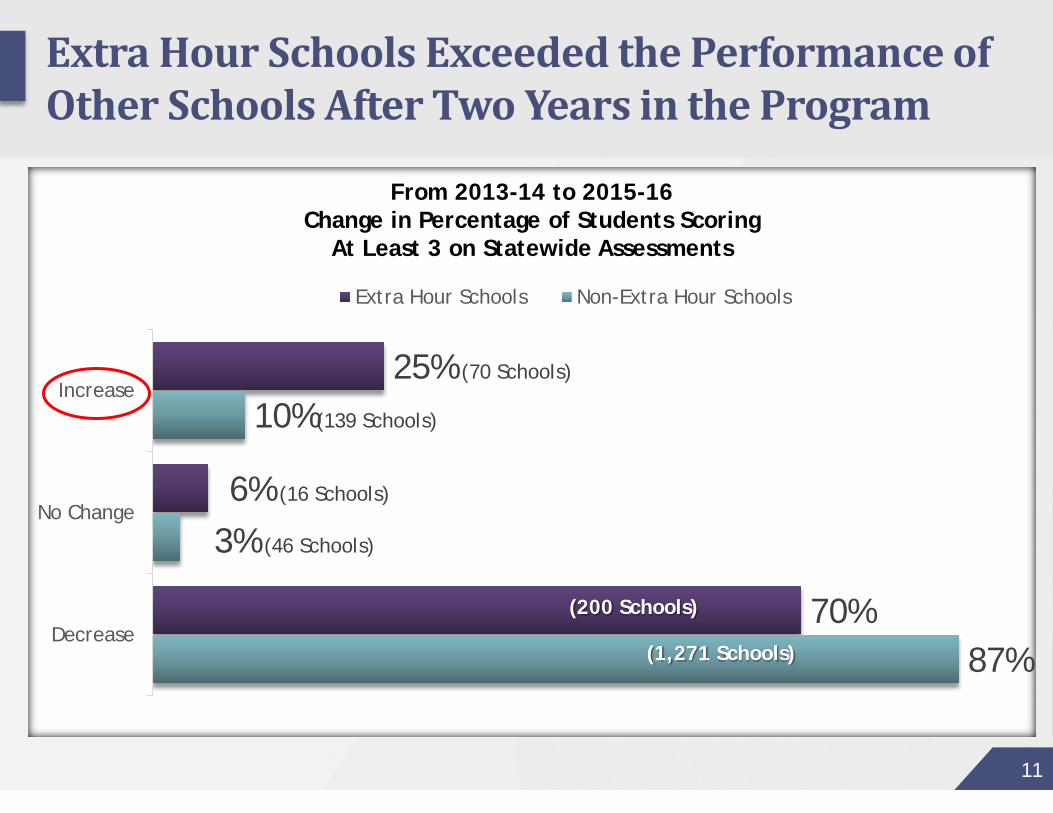
25% (70 Schools)
6% (16 Schools)
70%
10% (139 Schools)
3% (46 Schools)
87%
Increase
No Change
Decrease
Extra Hour Schools Non-Extra Hour Schools
(1,271 Schools)
(200 Schools)
Extra Hour Schools Exceeded the Performance of Other Schools After Two Years in the Program
11
From 2013-14 to 2015-16 Change in Percentage of Students Scoring
At Least 3 on Statewide Assessments
23% (69 Schools)
4% (12 Schools)
73%
7% (103 Schools)
3% (40 Schools)
90%
Increase
No Change
Decrease
Extra Hour Schools Non-Extra Hour Schools
(1,348 Schools)
(221 Schools)
Extra Hour Schools Exceeded the Performance of Other Schools in Their First Year of the Program
12
From 2013-14 to 2014-15 Change in Percentage of Students Scoring
At Least 3 on Statewide Assessments
49% (139 Schools)
6% (16 Schools)
46% (131 Schools)
45% (666 Schools)
9% (131 Schools)
47% (699 Schools)
Increase
No Change
Decrease
Extra Hour Schools Non-Extra Hour Schools
Extra Hour Schools Exceeded the Performance of Other Schools in Their Second Year of the Program
13
From 2014-15 to 2015-16 Change in Percentage of Students Scoring
At Least 3 on Statewide Assessments
THE FLORIDA LEGISLATURE’S OFFICE OF PROGRAM POLICY ANALYSIS & GOVERNMENT ACCOUNTABILI TY
How many Extra Hour schools moved off of the Low 300 List?
14
THE FLORIDA LEGISLATURE’S OFFICE OF PROGRAM POLICY ANALYSIS & GOVERNMENT ACCOUNTABILI TY
119 Extra Hour Schools (42%) Moved Off of the Low 300 List
Moved Off of the Low 300
List: 119Schools (42%)
Stayed On the Low 300 List:167 Schools
(58%)
15
T H E F L O R I D A L E G I S L A T U R E ’ S OFFICE OF PROGRAM POLICY ANALYSIS & GOVERNMENT ACCOUNTABILITY
OPPAGA supports the Florida Legislature by providing data, evaluative research, and objective analyses that assist legislative budget and policy deliberations.
oppag THE FLORIDA LEGISLATURE’S OFFICE OF PROGRAM POLICY ANALYSIS & GOVERNMENT ACCOUNTABILI TY
OPPAGA Review of Recess Policies and Practices
Senate Appropriations Subcommittee On Pre-K – 12 Education
Tina Young, Legislative Policy Analyst
February 15, 2017
oppag THE FLORIDA LEGISLATURE’S OFFICE OF PROGRAM POLICY ANALYSIS & GOVERNMENT ACCOUNTABILI TY
State Requirements
2
s. 1003.455, Florida Statutes, requires 150 minutes of PE each week for elementary grades Equivalent of one class period per day of PE for one
semester of each year for grades 6-8Physical education shall consist of physical activities of at least a moderate intensity level
Physical Education
(PE)
Recess There are no state requirements for recess
OPPAGA’s research focused on recess policies and practices in Florida
oppag THE FLORIDA LEGISLATURE’S OFFICE OF PROGRAM POLICY ANALYSIS & GOVERNMENT ACCOUNTABILI TY
Overview
School Districts Surveyed all 67 school districts about their school board-approved recess policies
Surveyed all 2,904 public elementary and middle schools (both charter and traditional) about their school recess practices
1
Schools2
3
67 Districts
1,189Schools
OPPAGA was asked to provide information on current district recess policies and the implementation of recess in schools
oppag THE FLORIDA LEGISLATURE’S OFFICE OF PROGRAM POLICY ANALYSIS & GOVERNMENT ACCOUNTABILI TY
District Recess Policies
4
THE FLORIDA LEGISLATURE’S OFFICE OF PROGRAM POLICY ANALYSIS & GOVERNMENT ACCOUNTABILI TY 5
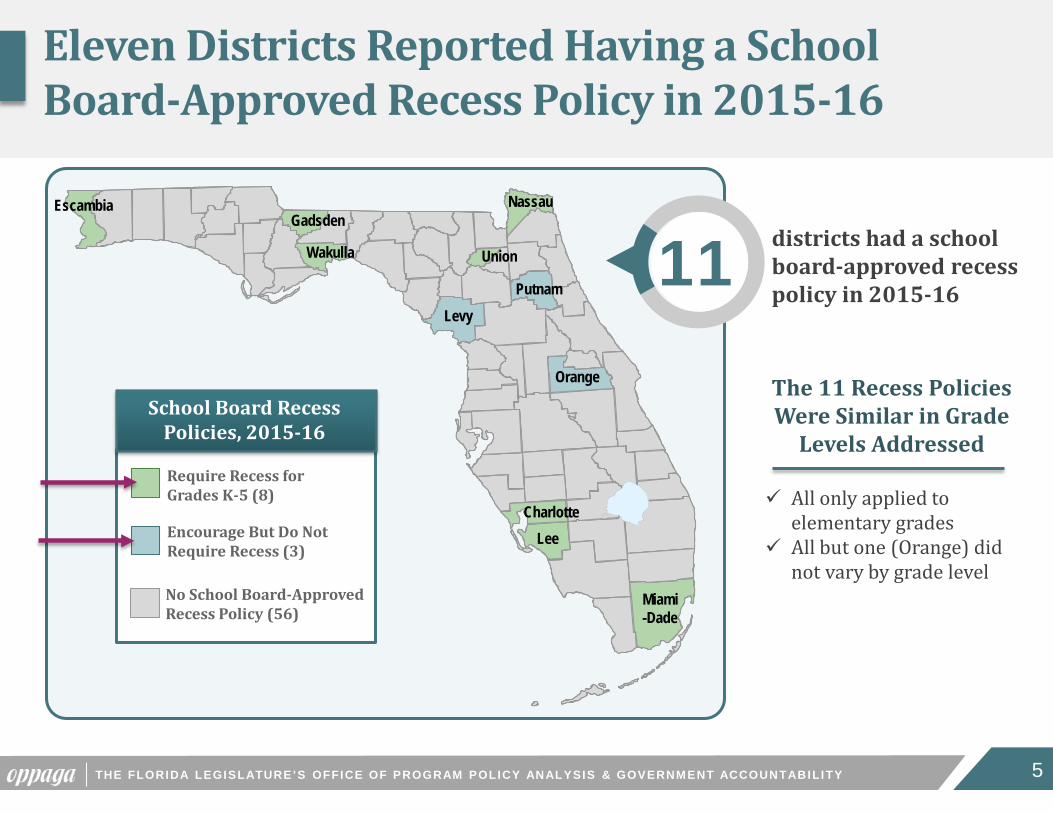
Require Recess for Grades K-5 (8)
Encourage But Do Not Require Recess (3)
No School Board-Approved Recess Policy (56)
School Board Recess Policies, 2015-16
11 districts had a school board-approved recess policy in 2015-16
All only applied to elementary grades
All but one (Orange) did not vary by grade level
The 11 Recess Policies Were Similar in Grade
Levels Addressed
LeeCharlotte
Miami-Dade
Putnam Levy
Wakulla
GadsdenNassau
Union
Escambia
Orange
Eleven Districts Reported Having a School Board-Approved Recess Policy in 2015-16
THE FLORIDA LEGISLATURE’S OFFICE OF PROGRAM POLICY ANALYSIS & GOVERNMENT ACCOUNTABILI TY
Combination of Unstructured Free Play and Structured Play
1 +District
Unstructured Free Play4
Districts
Did not specify activities 6
Districts
6
Charlotte Gadsden Levy Nassau Union Wakulla
Escambia
Lee Miami-Dade Orange Putnam
Recess Included Unstructured Free Play in Five School Districts’ Policies
THE FLORIDA LEGISLATURE’S OFFICE OF PROGRAM POLICY ANALYSIS & GOVERNMENT ACCOUNTABILI TY
Structured Activities Often Includes a Wide Range of Games That Children Can Play During Recess
7
Hula Hoops
Frisbee Throw
Horseshoes
Scoops and Balls
Bowling
Football Passing
Rope Jumping
VolleyballBeanbag Toss
Examples of Structured Activities in Escambia
THE FLORIDA LEGISLATURE’S OFFICE OF PROGRAM POLICY ANALYSIS & GOVERNMENT ACCOUNTABILI TY
Days Per Week for Recess
7Districts
2Districts
2Districts
5 days per week
Number of days per week varied
Number of days per week not specified
8
Charlotte, Escambia, Gadsden, Lee, Levy, Putnam, and Union
Miami-Dade and Orange
Nassau and Wakulla
Seven District Policies Specified Daily Recess
THE FLORIDA LEGISLATURE’S OFFICE OF PROGRAM POLICY ANALYSIS & GOVERNMENT ACCOUNTABILI TY
Minutes Per Week for Recess
9
1District
4Districts
3Districts
1District
Less than 50 minutes
50 – 99 minutes
100 – 149 minutes
200+ minutes
Miami-Dade
Escambia, Lee, Nassau, and Orange
Levy, Putnam, and Wakulla
Gadsden
2Districts
Number of minutes not specified Charlotte and Union
District Policies Varied in the Amount of Recess Time Per Week
≈ 10 – 19 minutes/day
THE FLORIDA LEGISLATURE’S OFFICE OF PROGRAM POLICY ANALYSIS & GOVERNMENT ACCOUNTABILI TY
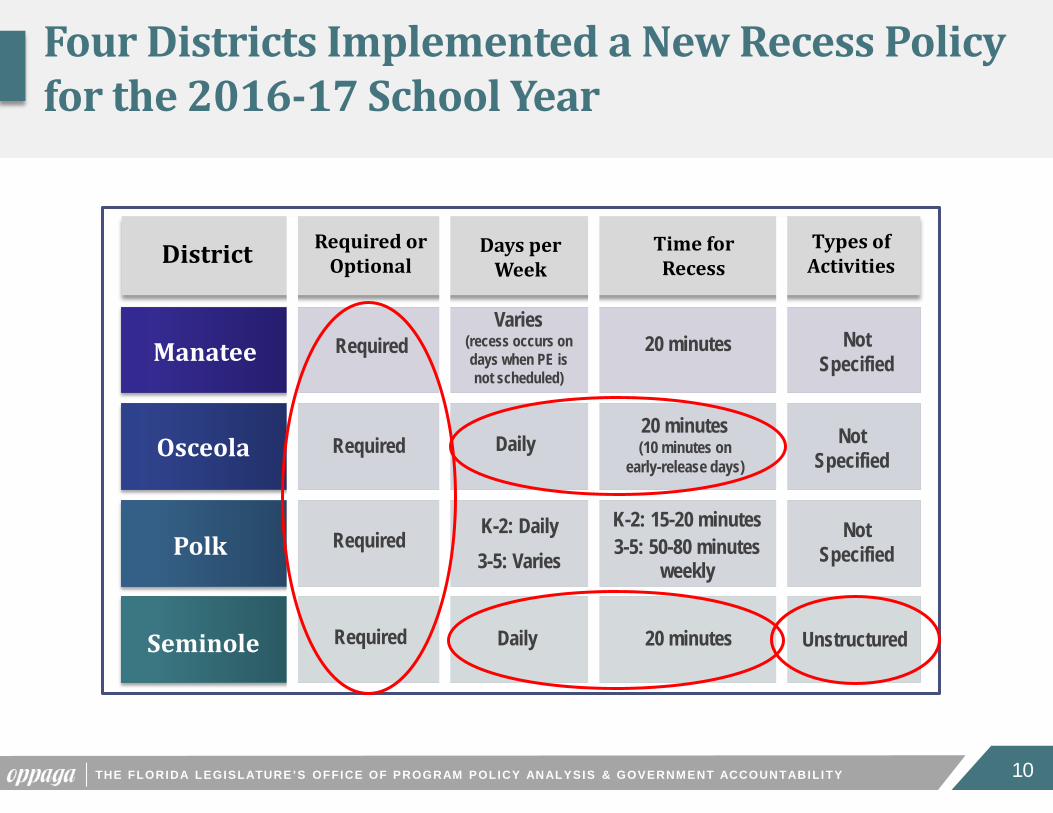
District Time for Recess
Days per Week
Required or Optional
Types of Activities
Osceola
Manatee
Seminole
Polk Required K-2: 15-20 minutes3-5: 50-80 minutes
weekly
K-2: Daily3-5: Varies
Not Specified
Not Specified
UnstructuredRequired
Required 20 minutes
20 minutesDaily
Varies (recess occurs on days when PE is not scheduled)
Four Districts Implemented a New Recess Policy for the 2016-17 School Year
10
Not Specified
Required 20 minutes (10 minutes on
early-release days)Daily
oppag THE FLORIDA LEGISLATURE’S OFFICE OF PROGRAM POLICY ANALYSIS & GOVERNMENT ACCOUNTABILI TY
School Recess Practices
11
oppag THE FLORIDA LEGISLATURE’S OFFICE OF PROGRAM POLICY ANALYSIS & GOVERNMENT ACCOUNTABILI TY 12
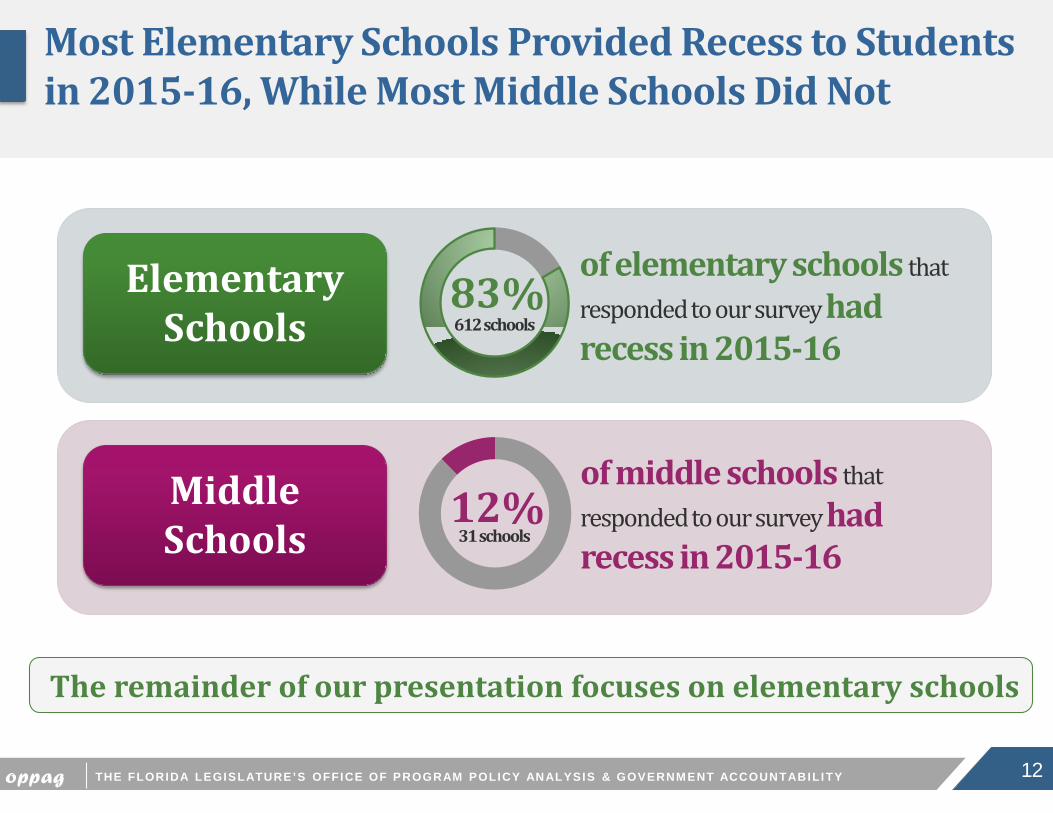
of elementary schools that responded to our survey had recess in 2015-16
Most Elementary Schools Provided Recess to Students in 2015-16, While Most Middle Schools Did Not
Elementary Schools
83%
of middle schools that responded to our survey hadrecess in 2015-16
Middle Schools
12%
The remainder of our presentation focuses on elementary schools
612 schools
31 schools
oppag THE FLORIDA LEGISLATURE’S OFFICE OF PROGRAM POLICY ANALYSIS & GOVERNMENT ACCOUNTABILI TY 13
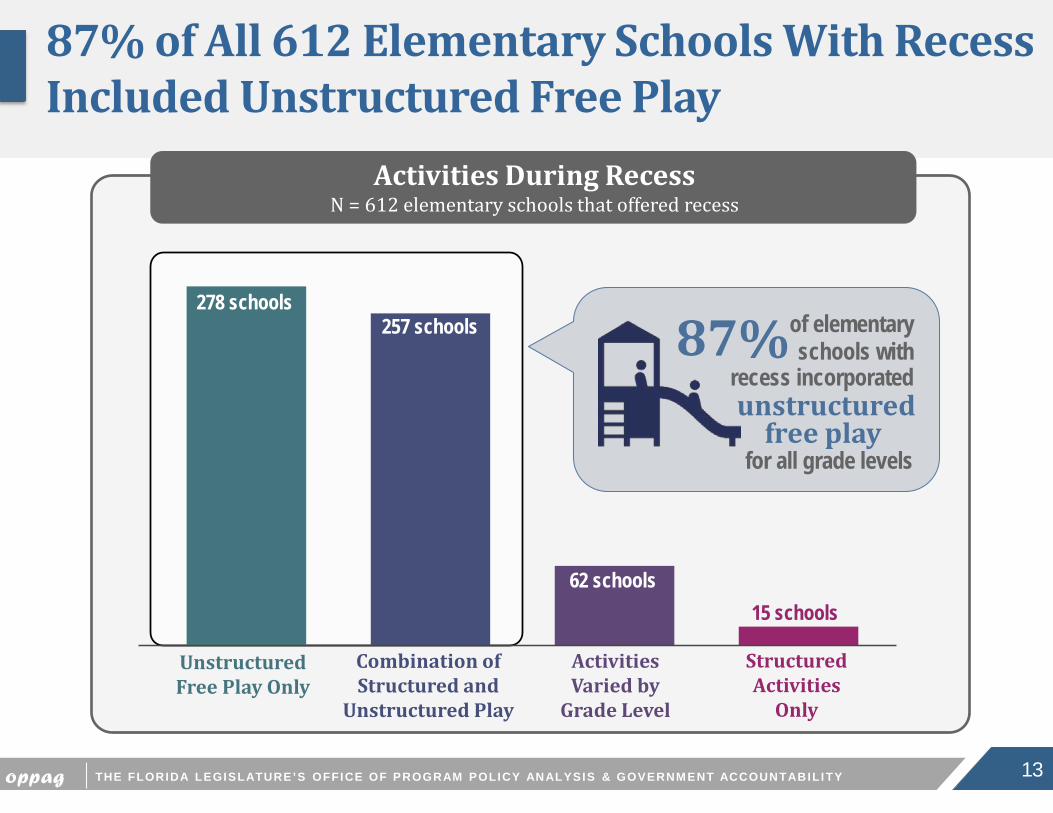
Activities Varied by
Grade Level
Structured Activities
Only
Combination of Structured and
Unstructured Play
Unstructured Free Play Only
15 schools62 schools
257 schools278 schools
of elementary
unstructuredfree play
recess incorporated87% schools with
for all grade levels
Activities During RecessN = 612 elementary schools that offered recess
87% of All 612 Elementary Schools With Recess Included Unstructured Free Play
oppag THE FLORIDA LEGISLATURE’S OFFICE OF PROGRAM POLICY ANALYSIS & GOVERNMENT ACCOUNTABILI TY
The frequency and length of recess was up to teacher discretion81
Schools
The frequency and length of recess was consistent across the school (same practice for all grade levels)
457Schools
The frequency and length of recess varied across grade levels74
Schools
14
N=612 schools
280of these schools
provided recess daily
75%
At Most Elementary Schools, the Frequency and Length of Recess Was Consistent for All Grades
oppag THE FLORIDA LEGISLATURE’S OFFICE OF PROGRAM POLICY ANALYSIS & GOVERNMENT ACCOUNTABILI TY
N=457 schools where recess was consistent
across grade levels
1515
Days per Week for Recess
280Schools
Daily Recess
2 days per week
1 day per week
Number of days per week varied
4 days per week
3 days per week
Schools
Schools
Schools
Schools
Schools
22
54
22
2
77
61%
Most of the 457 Elementary Schools Where Recess Was Consistent Across Grade Levels Offered Recess Daily
oppag THE FLORIDA LEGISLATURE’S OFFICE OF PROGRAM POLICY ANALYSIS & GOVERNMENT ACCOUNTABILI TY 16
N=457 schools where recess was consistent
across grade levels
137Schools
Less than 50 minutes
150 – 199 minutes
200 or more minutes
100 – 149 minutes
Schools
Schools
Schools
75
72
3
Minutes per Week for Recess
67%50 – 99 minutes
Schools170
Most of These 457 Schools Provided Less Than 100 Minutes of Weekly Recess Time
oppag THE FLORIDA LEGISLATURE’S OFFICE OF PROGRAM POLICY ANALYSIS & GOVERNMENT ACCOUNTABILI TY 17
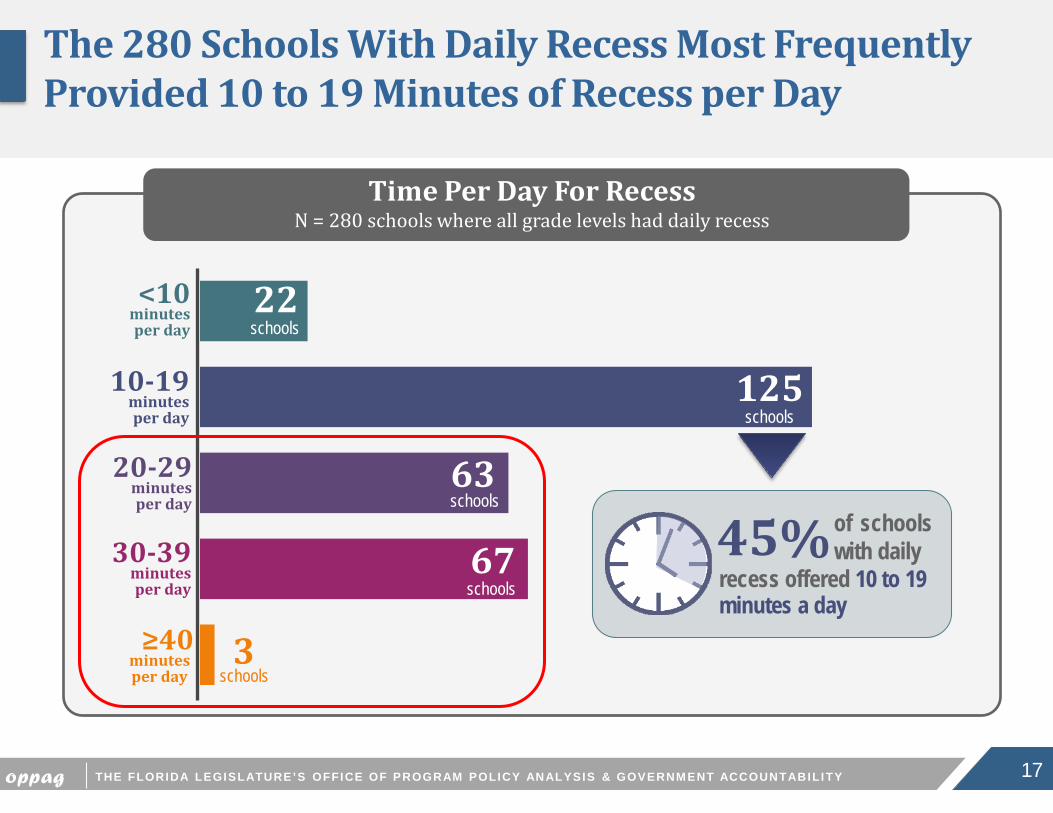
schools
schools3
<10 minutes per day
≥40minutes per day
20-29 minutes per day
30-39 minutes per day
10-19 minutes per day
125
schools63
schools67
22schools
of schoolswith daily45%
recess offered 10 to 19 minutes a day
schools
Time Per Day For RecessN = 280 schools where all grade levels had daily recess
The 280 Schools With Daily Recess Most Frequently Provided 10 to 19 Minutes of Recess per Day
oppag THE FLORIDA LEGISLATURE’S OFFICE OF PROGRAM POLICY ANALYSIS & GOVERNMENT ACCOUNTABILI TY 18
physical education academic instruction special classes like art and music and/or assistance to students who struggle in
academic subjects such as reading or math
Some schools reported that there was not enough time in the day for recess due to time spent on other
requirements such as
Reasons Schools Did Not Provide Recess
Elementary Schools Without Regularly Scheduled Recess Often Cited a Lack of Time in Their Schedules
oppag THE FLORIDA LEGISLATURE’S OFFICE OF PROGRAM POLICY ANALYSIS & GOVERNMENT ACCOUNTABILI TY
Summary of Research Results
19
School Districts
Schools with Recess
11 of 67 districts had a recess policy in 2015-16; 8 of the districts required recess of all elementary grades and 3 encouraged recess
Most elementary schools that responded to our survey provided recess, including elementary schools with no district recess requirement
The Majority of Elementary
Schools with Recess
Included unstructured free play in recess Offered the same frequency and length of recess to all
grade levels, which was most often daily and less than 100 minutes per week
T H E F L O R I D A L E G I S L A T U R E ’ S OFFICE OF PROGRAM POLICY ANALYSIS & GOVERNMENT ACCOUNTABILITY
OPPAGA supports the Florida Legislature by providing data, evaluative research, and objective analyses that assist legislative budget and policy deliberations.
Contact Information
David SummersStaff Director, Education Policy Area
Budgets within PreK-12 EducationMajor Fiscal Policy Decision Points
• Early Learning Programs (VPK and School Readiness) o VPK Workload Funding – this is linked to estimating conference resultso Base Student Allocation (BSA) funding level for the VPK programo Use of nonrecurring federal funds associated with the School Readiness programo Local Funding Initiatives – funding for individual projects
• Florida Education Finance Program (FEFP)o Percentage Increase in Per Student (FTE) funding – compared to the prior year;
the funds per student is linked to estimating conference results for the number of students and ad valorem revenue
o New and/or changes to various categorical funding initiatives (i.e. Digital Classrooms, Extra Hour Initiative,…) within the FEFP
o Required Local Effort Increase
• Educational Media and Technology o No major decision points in this area of the budget (typically)
2
Budgets within EducationMajor Fiscal Policy Decision Points…Continued
• K-12 Non-FEFP Programs o Best and Brightest Program - funding and policyo Gardiner Scholarship Program - funding and policyo Standard Student Attire Incentive Program - funding and policyo Principal Autonomy Program - funding and policyo Funding for the Florida School for the Deaf and the Blindo Teacher and Principal Training/Awards – funding and policyo Statewide Strategic Initiatives – funding (a limited set of initiatives that target specific
issues on a statewide basis)o Local Funding Initiatives – funding for individual projects
• K-12 Federal Programso No major decision points in this area of the budget (typically)
• State Board of Educationo K-12 assessment funding and policyo Department of Education IT fundingo Funding for various Department of Education initiatives typically linked to statewide
standards and curricula (training and tools for teachers)o Department of Education Administrative funding
3
Chair Priorities
• VPK BSA Increase
• Modified Extra Hour Initiativeo Allow schools who improve performance to continue the Extra Hour
Initiative after exiting the 300 lowest performing school list
o Add a summer component
o Refine the implementation requirements for the program
• Modified Best and Brightest Programo Expand the ways that highly effective teachers can qualify for the bonuso Add a principal component
• Authorize school districts to increase their discretionary capital improvement millages to 2 mills
• Gardiner Scholarships
4
Total PreK-12 Education Funds by Budget Entity2016-17 AppropriationsIncludes Local Funds – No PECO
Percent of Total
FEFP86%
Ed Media < 0%
Non-FEFP 1%
Federal Programs 7%
State Board of Education 1%
Early Learning 5%
Total $
Florida Education Finance Program (FEFP) $20,172,946,837
Standard Student Attire Incentive Program $14,000,000
Other Teacher & Administrator Programs $11,432,338
Total $280,188,545
15
Other Budget Process Issues and Considerations
• Implementing Bill Provisionso Statutory changes needed to implement the Senate budget
o The Implementing Bill’s duration is for one fiscal year
o Ideally, Implementing Bill provisions should be used for statutory changes that are needed on a temporary or one-year basis
o The Implementing Bill is not specific to a committee, it covers provisions needed for all appropriations subcommittee. There is one Implementing Bill.
• Conforming Billso Statutory changes needed to implement the Senate budgeto Conforming Bill changes become permanent lawo Conform Bill provisions should be used for statutory changes that are needed on a
permanent basiso Conforming Bills are specific to appropriations subcommittees or the full appropriations
committeeo Subcommittees may have multiple conforming bills
o Conforming Bill provisions that change policy (other than technical fiscal policy issues) should ideally be heard in the appropriate policy committee
16
CourtSmart Tag Report Room: KN 412 Case No.: Type: Caption: Senate Appropriations Committee on Pre-K - 12 Judge: Started: 2/16/2017 9:03:11 AM Ends: 2/16/2017 10:21:36 AM Length: 01:18:26 9:03:16 AM Call to Order Sen. Simmons 9:03:27 AM Roll Call 9:03:31 AM Quorum Present 9:05:41 AM Sen. Simmons 9:06:48 AM TAB 1 A - OPPAGA Presentation on Extra Hour Initiative 9:08:35 AM Mark Baird, Senior Legislative Analyst, OPPAGA 9:10:23 AM Sen. Montford 9:10:45 AM M. Baird 9:14:59 AM Sen. Simmons 9:16:32 AM Tina Young, Legislative Analyst, OPPAGA 9:22:36 AM Sen. Simmons 9:23:29 AM T. Young 9:23:52 AM Sen. Simmons 9:24:44 AM T. Young 9:25:24 AM Sen. Simmons 9:26:02 AM T. Young 9:26:16 AM Sen. Simmons 9:26:33 AM T. Young 9:28:38 AM Sen. Montford 9:30:04 AM T. Young 9:30:07 AM Sen. Montford 9:30:16 AM Sen. Simmons 9:30:27 AM T. Young 9:30:35 AM Sen. Simmons 9:31:46 AM Sen. Montford 9:31:59 AM Sen. Simmons 9:32:02 AM Sen. Broxson 9:33:26 AM T. Young 9:33:38 AM Sen. Broxson 9:33:59 AM T. Young 9:34:09 AM Sen. Simmons 9:34:37 AM Sen. Farmer 9:35:19 AM T. Young 9:35:41 AM Sen. Montford 9:40:32 AM Sen. Simmons 9:42:29 AM TAB 1 B - Overview of Budget Development Process 9:43:06 AM Sen. Simmons 9:45:51 AM TAB 1 C - Discussion of Key Decision Points in Pre K - 12 Budget and Funding Priorities 9:45:52 AM Sen. Simmons 9:59:53 AM Sen. Lee 10:04:41 AM Sen. Simmons 10:09:16 AM Sen. Montford 10:11:32 AM Sen. Farmer 10:15:22 AM Sen. Montford 10:16:19 AM Sen. Rouson 10:19:05 AM Sen. Grimsley 10:19:28 AM Sen. Simmons 10:19:34 AM Meeting Adjourned Sen. Grimsley