The Flow of Energy: The Flow of Energy: Higher Trophic Levels Higher Trophic Levels We wish to know: • With what efficiency is energy converted between trophic levels? • What is assimilation efficiency , net production efficiency , and ecological efficiency ? • What are pyramids of numbers, biomass, and energy? • How much energy is available to humans, and how much do we use? • What are the major controls on ecosystem function?
Transcript
The Flow of Energy: The Flow of Energy: Higher Trophic LevelsHigher Trophic Levels
We wish to know:
• With what efficiency is energy converted between trophic levels?
• What is assimilation efficiency, net production efficiency, and ecological efficiency?
• What are pyramids of numbers, biomass, and energy?
• How much energy is available to humans, and how much do we use?
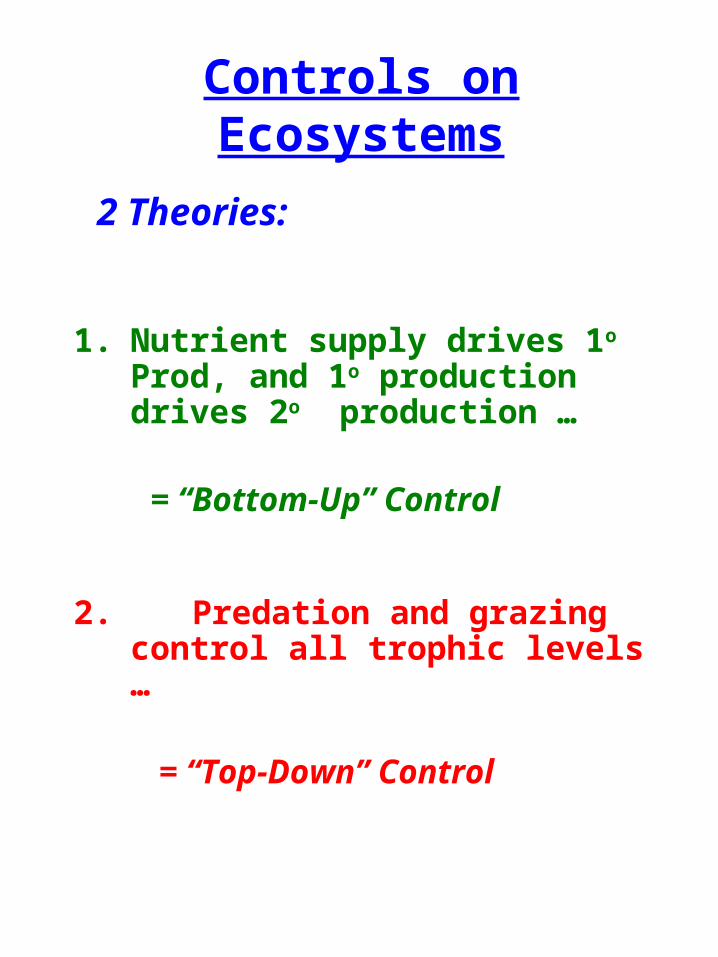
• What are the major controls on ecosystem function?
A typical food web showing A typical food web showing trophic levelstrophic levels
Energy Transfers to Higher Trophic Levels
What happens to NPP?What happens to NPP?
On average, it is consumed. On average, it is consumed. Some is stored in sediments Some is stored in sediments (coal, oil). (coal, oil).
Energy is released in this Energy is released in this consumption, and metabolic consumption, and metabolic work is done as cellular work is done as cellular respiration converts energy respiration converts energy stored in chemical bonds into stored in chemical bonds into heat. This energy is lost for the heat. This energy is lost for the next trophic level.next trophic level.
Energy Flows and Losses
Principles of Energy Flow
As energy passes from trophic level to trophic level:
• Only a fraction of the energy available to one trophic level is transferred to the next trophic level. The rule of thumb is ~10%, but this can vary from 1 - 15%.
• Typically the numbers and biomass of organisms decreases as one ascends the food chain. This is called a “pyramid”.
1. “Assimilation Efficiency”
= (Assimilation / Ingestion)
Assimilation = (Ingestion) – (Excretion)
Assimilation Efficiency
= 15 – 50 % for plant food
= 16 – 90 % for animal food
2. “Net Production Efficiency”= (Production / Assimilation)
Production = (Growth + Reproduction)
• For plants, net production efficiency
= (NPP / GPP) = 30-85%
• For invertebrates = 20% on average
• For vertebrates = 2% on average
WHY ?
3. “Ecological Efficiency”
For example,
= Fox production / Rabbit production
= [(10 kg/yr) / (100 kg/yr) ] * 100
= 10 %
= consumer production / prey production
* Ecological efficiency ranges from ~1 to 15 %
* This sets the absolute number of trophic levels in a food web
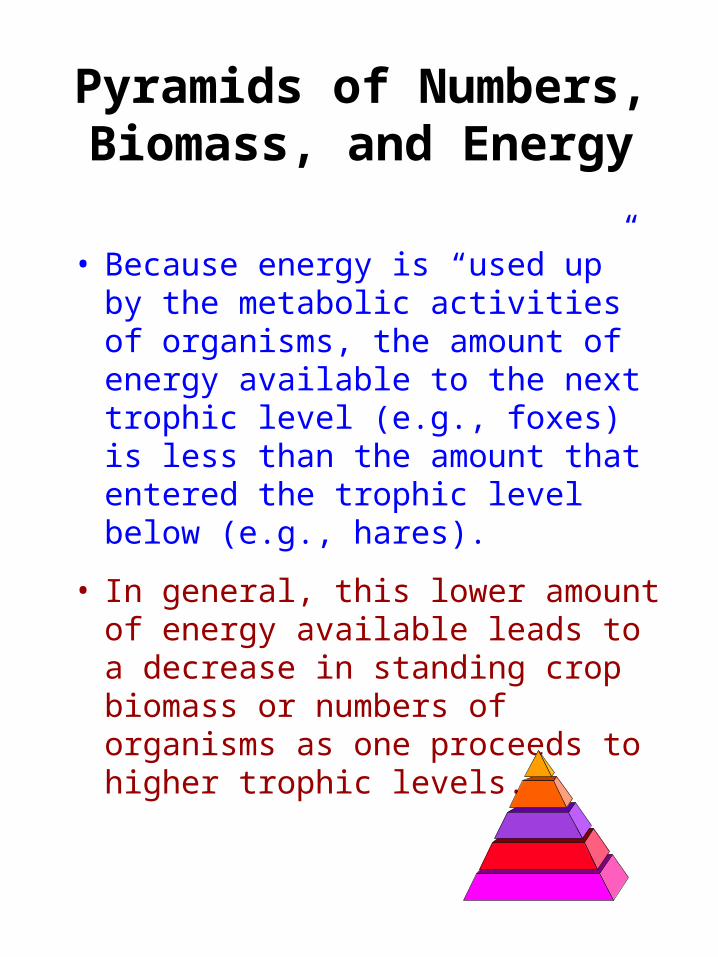
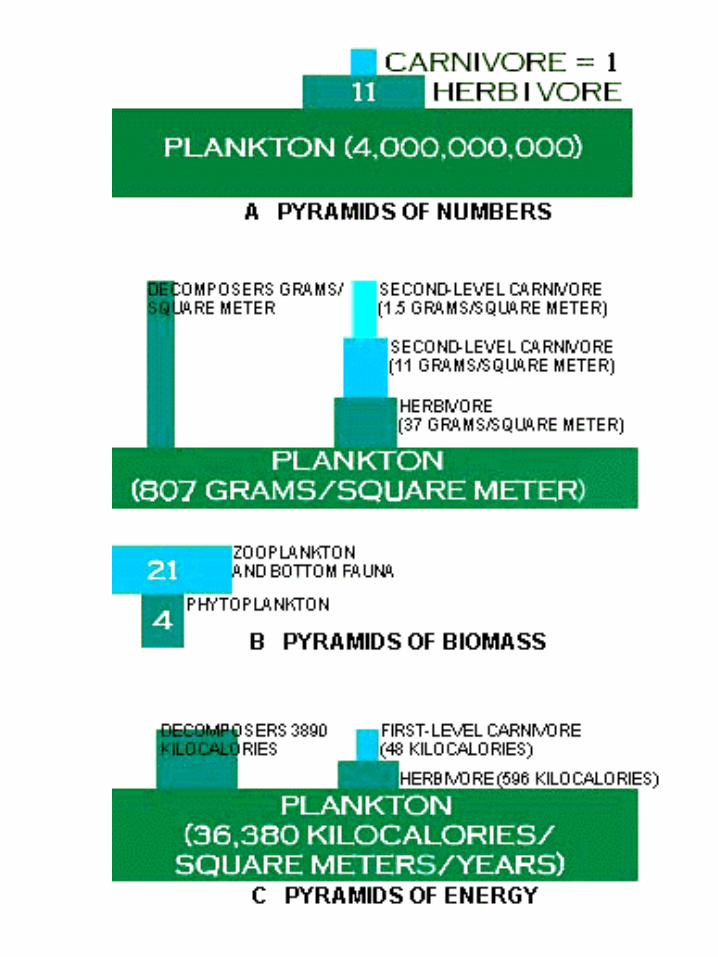
Pyramids of Numbers, Biomass, and Energy
• Because energy is “used up” by the metabolic activities of organisms, the amount of energy available to the next trophic level (e.g., foxes) is less than the amount that entered the trophic level below (e.g., hares).
• In general, this lower amount of energy available leads to a decrease in standing crop biomass or numbers of organisms as one proceeds to higher trophic levels.
A Typical Pyramid of Biomass
Pyramids -- complications and exceptions
• Complications: pyramids of numbers might be steep if the predators are much larger than their prey, - or -, they might be inverted if large plants have numerous insect grazers.
• Exceptions: pyramids of biomass might be inverted if a lower trophic level has a much higher turnover rate than a higher trophic level.
• Pyramids of energy can never be inverted.
Residence Time of EnergyResidence Time of Energy
• RT= ( energy in biomass/ net productivity )
Ecosystem NPP Biomass RT
(g/m2/yr) (g/m2) years
Tropical Rainforest
2,000 45,000 22.5 yrs
Boreal Forest 800 20,000 25.0 yrs
Temperate Grassland
500 1,500 3.0 yrs
Lakes 500 20 15 days
Open Ocean 125 3 9 days
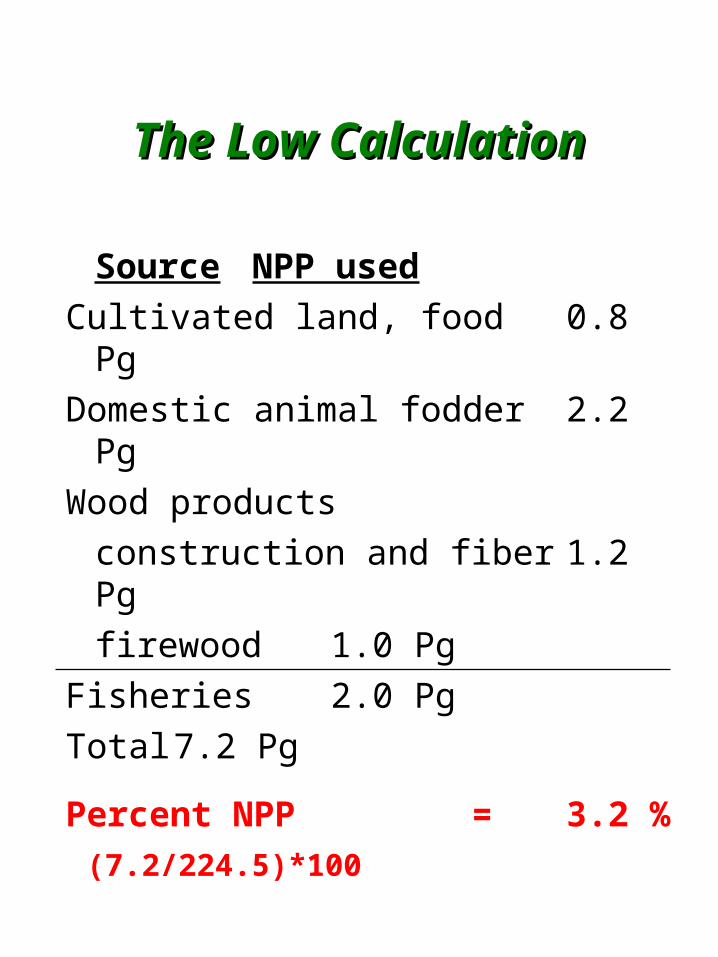
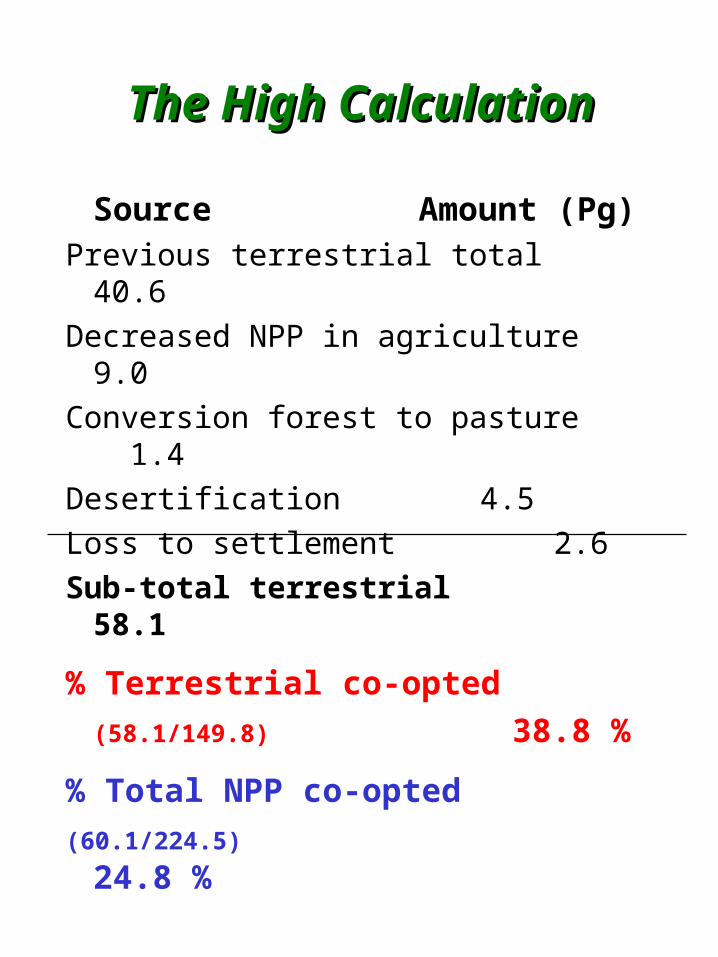
World NPP & Human World NPP & Human ConsumptionConsumption
• World NPP is ~ 224.5 Pg/yr of organic matter.
• 1 pedagram = 1015 g = 109 metric tonnes (1 metric tonne = 1,000 kg)