148

The following foreign exchange rates are applied in this study:
US$1.00=LE(Egyptian Pound)3.50=JP¥109.00
US$1.30= SDR1.00
as of August, 2000
JAPAN INTERNATIONAL COOPERATION AGENCY (JICA) SUEZ CANAL AUTHORITY (SCA)
ANNEX V TOLL POLICY AND ISSUES
FINAL
THE STUDY ON THE EFFECTIVE MANAGEMENT SYSTEM OF THE SUEZ CANAL IN THE ARAB REPUBLIC OF EGYPT
AUGUST 2001
THE OVERSEAS COASTAL AREA DEVELOPMENT INSTITUTE OF JAPAN (OCDI)
MITSUBISHI RESEARCH INSTITUTE, INC. (MRI)

ABBREVIATION LIST APA Alexandria Port Authority BAF Banker Adjusting Factor BIMCO Baltic and International Maritime Council BOT Build, Operate and Transfer C/B Charter Base CBE Central Bank of Egypt CEU Car Equivalent Unit CFS Container Freight Station CHS Container Handling Surcharge CIF Cost, Insurance and Freight CRF Capital Recovery Factor CY Container Yard DEM/DES Demurrage/Dispatch DO Diesel Oil DPA Damietta Port Authority DST Double Stack Train DWT Dead Weight Tonnage ECSA European Community Ship-owners' Association EDI Electronic Data Interchange EMDB Egyptian Maritime Data Bank ENR Egyptian National Railway ETA Estimated Time of Arrival FAK Freight All Kinds FCL Full Container Load Cargo FIRR Financial Internal Rate of Return FO Fuel Oil FOB Free on Board GDP Gross Domestic Product GARE Government of Arab Republic of Egypt GOJ Government of Japan GT Gross Tonnage H/B Hire Base ICS International Chamber of Shipping INSROP International Northern Sea Route Program INTERCARGO International Association of Dry Cargo Ship-owners INTERTANKO International Association of Independent Tanker Owners JAMRI Japan Maritime Research Institute JICA Japan International Cooperation Agency JP¥ Japanese Yen LB Land Bridge LCL Less than Container Load Cargo LE Egyptian Pound LNG Liquefied Natural Gas
LOA Length Overall LOOP Louisiana Offshore Oil Port LPG Liquefied Petroleum Gas LUP Laying-Up Point MOMT Ministry of Maritime Transport MRI Mitsubishi Research Institute, Inc. MSL Maersk-Sealand MT Metric Ton N/P Net Proceeds NPV Net Present Value NWA New World Alliance OCDI Overseas Coastal Area Development Institute of Japan O-D Origin and Destination OSRA Ocean Shipping Reform Act PAE Petroleum Authority of Egypt PCC Pure Car Carrier P/L Profit/Loss PSPA Port Said Port Authority QGC Quay-side Gantry Crane RGT Rubber-Tired Gantry S/C Service Contract SCA Suez Canal Authority SCCT Suez Canal Container Terminal SCGT Suez Canal Gross Tonnage SCNT Suez Canal Net Tonnage SCVTMS The Suez Canal Vessel Traffic Management System SDR Special Drawing Right SSA Stevedoring Services of America SUMED Arab Petroleum Pipelines Co. S/W Scope of Work TEU Twenty-foot Equivalent Unit ULCC Ultra Large Crude Carrier US$ US Dollar VLCC Very Large Crude Carrier WSF World Scale Flat WSR World Scale Rate

CONTENTS ANNEX V Toll Policy and Issues Chapter 1 Influence of Toll ....................................................................................... 1-1
1.1 Outlook of the Suez Canal........................................................................ 1-1 1.2 Influence of the Canal Toll on the world shipping and economy............. 1-3 1.3 Macroscopic influence of toll - Theoretical explanations ........................ 1-9
Chapter 2 Behavior of Shipping Lines and Shippers/Consignees ............................. 2-1
2.1 Kind and definition of shipping operation................................................ 2-1 2.1.1 Industrial Carrier ........................................................................... 2-1 2.1.2 Commercial Industrial Carrier by shipping lines .......................... 2-1 2.1.3 Pure Car Carriers, LNG/LPG Carriers as Semi-Industrial Carrier 2-2 2.2 Tramp market and tanker market.............................................................. 2-2 2.2.1 Peculiarity of sea-transportation.................................................... 2-2 2.2.2 Behavior of shipping lines in tramp/tanker market ....................... 2-3 2.3 Liner market ............................................................................................. 2-3 2.3.1 Definition of liner market .............................................................. 2-3 2.3.2 Operation of liner service .............................................................. 2-4 2.3.3 Behavior of shipping line in liner market ...................................... 2-4 2.4 Associations of shipping lines and ahippers/consignees.......................... 2-5
Chapter 3 Relations between vessel profitability and costs at Suez.......................... 3-1
3.1 Shipping cost ............................................................................................ 3-1 3.2 Profitability of shipping lines and vessel deployments ............................ 3-1 3.3 Relations between vessel profitability and costs at Suez ......................... 3-2 3.3.1 Basic relations ............................................................................... 3-2 3.3.2 Common tramp carriers ................................................................. 3-3 3.3.3 Liners............................................................................................. 3-4 3.3.4 Industrial carriers........................................................................... 3-5
Chapter 4 Issues on the Currency Unit of Toll .......................................................... 4-1 Chapter 5 Toll Structure and Rates............................................................................ 5-1
5.1 Basic toll level .......................................................................................... 5-1 5.1.1 Current basic toll level .................................................................. 5-1 5.1.2 Evaluation...................................................................................... 5-1 5.1.3 Proposition..................................................................................... 5-2 5.1.4 Conclusion..................................................................................... 5-3 5.2 Tariff system............................................................................................. 5-4 5.2.1 Current tariff system...................................................................... 5-4 5.2.2 Evaluation...................................................................................... 5-4 5.2.3 Conclusion..................................................................................... 5-5 5.3 Vessel size classification in tariff ............................................................. 5-6 5.3.1 Current vessel size classification................................................... 5-6

5.3.2 Evaluation...................................................................................... 5-6 5.3.3 Proposition..................................................................................... 5-13 5.3.4 Conclusion..................................................................................... 5-13 5.4 Vessel type classification in tariff............................................................. 5-14 5.4.1 Current vessel type classification .................................................. 5-14 5.4.2 Evaluation...................................................................................... 5-14 5.4.3 Proposition..................................................................................... 5-15 5.4.4 Conclusion..................................................................................... 5-15 5.5 Classification by laden/ballast in tariff..................................................... 5-16 5.5.1 Current classification by laden/ballast........................................... 5-16 5.5.2 Evaluation...................................................................................... 5-16 5.5.3 Proposition..................................................................................... 5-16 5.5.4 Conclusion..................................................................................... 5-17 5.6 Standard saved distance and Long Haul Rebate....................................... 5-18 5.6.1 Current standard saved distance and Long Haul Rebate ............... 5-18 5.6.2 Evaluation...................................................................................... 5-18 5.6.3 Proposition..................................................................................... 5-27 5.6.4 Conclusion..................................................................................... 5-28 5.7 Toll for Tankers of Crude Oil ................................................................... 5-30 5.7.1 Current toll for Tankers of Crude Oil ............................................ 5-30 5.7.2 Evaluation...................................................................................... 5-30 5.7.3 Proposition..................................................................................... 5-35 5.7.4 Conclusion..................................................................................... 5-36 5.8 Toll for Tankers of Petroleum Products.................................................... 5-37 5.8.1 Current toll for Tankers of Petroleum Products............................. 5-37 5.8.2 Evaluation...................................................................................... 5-37 5.8.3 Proposition..................................................................................... 5-38 5.8.4 Conclusion..................................................................................... 5-39 5.9 Toll for Chemical Carriers........................................................................ 5-40 5.9.1 Current toll for Chemical Carriers................................................. 5-40 5.9.2 Evaluation...................................................................................... 5-40 5.9.3 Proposition..................................................................................... 5-41 5.9.4 Conclusion..................................................................................... 5-41 5.10 Toll for LNG Carriers ................................................................................ 5-42 5.10.1 Current toll for LNG Carriers......................................................... 5-42 5.10.2 Evaluation....................................................................................... 5-42 5.10.3 Conclusion...................................................................................... 5-43 5.11 Toll for LPG Carriers................................................................................. 5-44 5.11.1 Current toll for LPG Carriers.......................................................... 5-44 5.11.2 Evaluation....................................................................................... 5-44 5.11.3 Proposition...................................................................................... 5-45 5.11.4 Conclusion ...................................................................................... 5-45 5.12 Toll for Dry Bulk Carriers ......................................................................... 5-46 5.12.1 Current toll for Dry Bulk Carriers .................................................. 5-46 5.12.2 Evaluation....................................................................................... 5-46 5.12.3 Proposition ..................................................................................... 5-47

5.12.4 Conclusion...................................................................................... 5-48 5.13 Toll for Container Ships ............................................................................ 5-49 5.13.1 Current toll for Container Ships ..................................................... 5-49 5.13.2 Evaluation....................................................................................... 5-49 5.13.3 Proposition ..................................................................................... 5-55 5.13.4 Conclusion...................................................................................... 5-57 5.14 Toll for Vehicle Carriers ............................................................................ 5-58 5.14.1 Current toll for Vehicle Carriers ..................................................... 5-58 5.14.2 Evaluation....................................................................................... 5-58 5.14.3 Proposition ..................................................................................... 5-60 5.14.4 Conclusion...................................................................................... 5-61 5.15 Toll for General Cargo Ships..................................................................... 5-62 5.15.1 Current toll for General Cargo Ships.............................................. 5-62 5.15.2 Evaluation....................................................................................... 5-62 5.15.3 Proposition ..................................................................................... 5-63 5.15.4 Conclusion...................................................................................... 5-63 5.16 Tariff-setting procedure ............................................................................. 5-65 5.16.1 Current tariff-setting procedure ...................................................... 5-65 5.16.2 Evaluation....................................................................................... 5-65 5.16.3 Proposition ..................................................................................... 5-65 5.16.4 Conclusion...................................................................................... 5-65
Appendix A Analysis of the SC Transit Database for Tariff-Setting......................... A-1
A.1 Outline of the SC transit database ........................................................... A-1 A.2 Number and total SCNT of vessels by new vessel types......................... A-4 A.3 Toll revenue estimation by vessel type and size ...................................... A-7 A.4 Number of vessels transiting the Canal by O-D pairs ............................. A-10
Appendix B Standard Toll Level Calculation and Draft New Tariff ......................... B-1 Appendix C Extract of the Panama Canal's regulations ............................................ C-1
C.1 Organic Law of the Panama Canal Authority(article 75 to 80) ............... C-1 C.2 Regulation on the Procedure to Revise the Panama Canal Tolls Rate ..... C-2

List of Tables ANNEX V Toll Policy and Issues Table 1.1.1 Suez Canal Toll as a GDP Share ......................................................... 1-2 Table 1.1.2 Suez Canal Toll in the State Budget Revenue..................................... 1-2 Table 1.1.3 Suez Canal Toll in the Foreign Currency Revenue............................. 1-2 Table 1.2.1 Shortening Effect of Maritime Distances by the Suez Canal.............. 1-3 Table 1.2.2 Cargoes carried through the Suez Canal ............................................. 1-4 Table 1.2.3 O-D of Cargoes carried through the Suez Canal in 1999.................... 1-5 Table 1.2.4 O-D of Dry Cargoes carried through the Suez Canal in 1999 ............ 1-6 Table 4.1 Comparison of Elasticity .................................................................... 4-6 Table 5.3.1 Current Tariff Format.......................................................................... 5-6 Table 5.3.2 Tariff Format Alternative-1................................................................. 5-7 Table 5.3.3 Tariff Format Alternative-2................................................................. 5-7 Table 5.3.4 Vessel Size Distribution Transiting the Canal..................................... 5-9 Table 5.4.1 Shipping Cost by Vessel Type............................................................. 5-15 Table 5.6.1 Potential Cargo O-D by Vessel Type(1998) ........................................ 5-20 Table 5.6.2 Potential Cargo O-D by Vessel Type(2020) ........................................ 5-21 Table 5.6.3 Relative Toll Revenue by Vessel Type(1998) ..................................... 5-22 Table 5.6.4 Relative Toll Revenue by Vessel Type(2020) ..................................... 5-23 Table 5.7.1 Current Tariff (Tankers of Crude Oil)................................................. 5-30 Table 5.7.2 Main Parameters of World Scale Flat ................................................. 5-31 Table 5.7.3 Shippers'/Consignees' Payment for Crude Oil Transport(Common Carriers) ............................................................................................................ 5-32 Table 5.7.4 Shippers'/Consignees' Payment Calculation for Crude Oil Transport (Common Carriers) ............................................................................. 5-33 Table 5.7.5 Number of Vessel Transiting the Canal (Tankers of Crude Oil) ......... 5-34 Table 5.7.6 Crude Oil Transport from Arabian Gulf to America and Europe via Cape ............................................................................................................ 5-34 Table 5.7.7 Toll Comparison (Tankers of Crude Oil) ............................................ 5-35 Table 5.8.1 Current Tariff (Tankers of Petroleum Products) ................................. 5-37 Table 5.8.2 Accumulation of Number of Vessels (Tankers of Petroleum Products) ............................................................................................................ 5-38 Table 5.8.3 Number of Vessel Transiting the Canal (Tankers of Petroleum Products) ............................................................................................................ 5-38 Table 5.8.4 Toll Comparison (Tankers of Petroleum Products)............................. 5-38 Table 5.9.1 Current Tariff (Chemical Carriers) ..................................................... 5-40 Table 5.9.2 Accumulation of Number of Vessels (Chemical Carriers).................. 5-40 Table 5.9.3 Number of Vessel Transiting the Canal (Chemical Carriers).............. 5-40 Table 5.9.4 Toll Comparison (Chemical Carriers)................................................. 5-41 Table 5.10.1 Current Tariff (LNG Carriers) ............................................................ 5-42 Table 5.10.2 Number of Vessel Transiting the Canal (LNG Carriers) ..................... 5-42 Table 5.10.3 LNG Price at Exporting and Importing Countries .............................. 5-43 Table 5.11.1 Current Tariff (LPG Carriers) ............................................................. 5-44 Table 5.11.2 Accumulation of Number of Vessels (LPG Carriers) ......................... 5-44

Table 5.11.3 Number of Vessel Transiting the Canal (LPG Carriers) ..................... 5-44 Table 5.11.4 Toll Comparison (LPG Carriers) ........................................................ 5-45 Table 5.12.1 Current Tariff (Dry Bulk Carriers)...................................................... 5-46 Table 5.12.2 Accumulation of Number of Vessels (Dry Bulk Carriers) .................. 5-46 Table 5.12.3 Number of Vessel Transiting the Canal (Dry Bulk Carriers) .............. 5-46 Table 5.12.4 Toll Comparison (Dry Bulk Carriers) ................................................. 5-47 Table 5.13.1 Current Tariff (Container Ships) ......................................................... 5-49 Table 5.13.2 Distribution of Commodity Value in Container.................................. 5-51 Table 5.13.3 Number of Vessel Transiting the Canal (Container Ships) ................. 5-52 Table 5.13.4 Toll Comparison (Container Ships, Case-1) ....................................... 5-53 Table 5.13.5 Toll Comparison (Container Ships, Case-2) ....................................... 5-53 Table 5.13.6 Toll Comparison (Container Ships, Case-3) ....................................... 5-54 Table 5.13.7 Toll Comparison (Container Ships, Case-4) ....................................... 5-54 Table 5.13.8 Surcharge for Containers over Weather Deck..................................... 5-55 Table 5.13.9 Distribution of Ratio of Carried Containers to Nominal Capacity ..... 5-55 Table 5.13.10 Image of New Discount System on Container Ships .......................... 5-56 Table 5.14.1 Current Tariff (Vehicle Carriers)......................................................... 5-58 Table 5.14.2 Accumulation of Number of Vessels (Vehicle Carriers) ..................... 5-58 Table 5.14.3 Number of Vessel Transiting the Canal (Vehicle Carriers) ................. 5-59 Table 5.14.3 Toll Comparison (Vehicle Carriers, Case-1) ....................................... 5-60 Table 5.14.4 Toll Comparison (Vehicle Carriers, Case-2) ....................................... 5-60 Table 5.15.1 Current Tariff (General Cargo Ships) ................................................. 5-62 Table 5.15.2 Accumulation of Number of Vessels (General Cargo Ships).............. 5-62 Table 5.15.3 Number of Vessel Transiting the Canal (General Cargo Ships).......... 5-62 Table 5.15.4 Toll Comparison (General Cargo Ships)............................................. 5-63 Table A.1.1 Vessel Types of the SC Transit Database ............................................ A-1 Table A.1.2 Regions and Countries of the SC Transit Database ............................ A-2 Table A.1.3 Cargo Types of the SC Transit Database ............................................ A-3 Table A.2.1 Relation between New Vessel Types and those of the Database......... A-4 Table A.2.2 Number of Vessels Transiting the Canal ............................................. A-5 Table A.2.3 Total SCNT of Vessels Transiting the Canal....................................... A-6 Table A.3.1 Toll Revenue by Vessel Type .............................................................. A-7 Table A.3.2 Input Data on Surcharge & Discount .................................................. A-8 Table A.3.3 Comparison of Estimated Revenue to Real Revenue in 1999
(Reproduction).................................................................................... A-8 Table A.3.4 Estimated Toll Revenue by Vessel Types and Size in 1999 ................ A-9 Table A.4.1 Number of Vessels Transiting the Canal ............................................. A-11 Table A.4.2 Number of Vessels Transiting the Canal ............................................. A-12 Table A.4.3 Number of Vessels Transiting the Canal ............................................. A-13 Table A.4.4 Number of Vessels Transiting the Canal ............................................. A-14 Table A.4.5 Number of Vessels Transiting the Canal ............................................. A-15 Table A.4.6 Number of Vessels Transiting the Canal ............................................. A-16 Table A.4.7 Number of Vessels Transiting the Canal ............................................. A-17 Table A.4.8 Number of Vessels Transiting the Canal ............................................. A-18 Table A.4.9 Number of Vessels Transiting the Canal ............................................. A-19 Table A.4.10 Number of Vessels Transiting the Canal ............................................. A-20

Table A.4.11 Number of Vessels Transiting the Canal ............................................. A-21 Table A.4.12 Number of Vessels Transiting the Canal ............................................. A-22 Table A.4.13 Number of Vessels Transiting the Canal ............................................. A-23 Table A.4.14 Number of Vessels Transiting the Canal ............................................. A-24 Table A.4.15 Number of Vessels Transiting the Canal ............................................. A-25 Table A.4.16 Number of Vessels Transiting the Canal ............................................. A-26 Table A.4.17 Number of Vessels Transiting the Canal ............................................. A-27 Table A.4.18 Number of Vessels Transiting the Canal ............................................. A-28 Table A.4.19 Number of Vessels Transiting the Canal ............................................. A-29 Table A.4.20 Number of Vessels Transiting the Canal ............................................. A-30 Table B.1.1 Calculation Method getting Optimal Toll Rate................................... B-2 Table B.1.2 Shipping Cost per mile (B) ................................................................. B-2 Table B.1.3 Excess Cost at the Suez Canal (Esc)................................................... B-2 Table B.1.4 Optimal Toll Rate (Standard Saved Distance: 4,700 miles)................ B-3 Table B.1.5 Optimal Toll (Standard Saved Distance:4,700 miles) ......................... B-3 Table B.1.6 Current Toll......................................................................................... B-3 Table B.1.7 Current Toll with Weather Deck Surcharge ........................................ B-4 Table B.1.8 Ratio of Optimal Toll to Current Toll with Weather Deck Surcharge. B-4 Table B.1.9 Revising Ratio for Draft New Tariff ................................................... B-4 Table B.1.10 Toll for Draft New Tariff .................................................................... B-5 Table B.1.11 Draft New Tariff in US$ ..................................................................... B-5 Table B.1.12 Draft New Tariff in SDR..................................................................... B-5 Table B.1.13 Draft New Tariff (exchange rate: 1.30 US$/SCNT) ........................... B-6

List of Figures ANNEX V Toll Policy and Issues Figure 1.3.1 Relation between Price and Quantity of Shipment ............................. 1-10 Figure 1.3.2 Relation between Toll and Demand for Trade .................................... 1-10 Figure 3.1.1 Components of Shipping Cost ............................................................ 3-1 Figure 5.1.1 Relation between Economic Benefit of the Canal and Toll ................ 5-1 Figure 5.3.1 Applied Toll and Theoretical Toll (Current Tariff Format)................. 5-8 Figure 5.3.2 Applied Toll and Theoretical Toll (Tariff Format Alternative-1) ........ 5-8 Figure 5.3.3 Applied Toll and Theoretical Toll (Tariff Format Alternative-2) ........ 5-8 Figure 5.3.4 Applied Toll and Theoretical Toll (Type1) ......................................... 5-10 Figure 5.3.5 Applied Toll and Theoretical Toll (Type2) ......................................... 5-10 Figure 5.3.6 Applied Toll and Theoretical Toll (Type3) ......................................... 5-10 Figure 5.3.7 Applied Toll and Theoretical Toll (Type4) ......................................... 5-11 Figure 5.3.8 Applied Toll and Theoretical Toll (Type5) ......................................... 5-11 Figure 5.3.9 Applied Toll and Theoretical Toll (Type6) ......................................... 5-11 Figure 5.3.10 Applied Toll and Theoretical Toll (Type7) ......................................... 5-12 Figure 5.3.11 Applied Toll and Theoretical Toll (Type8) ......................................... 5-12 Figure 5.4.1 Shipping Cost by Vessel Type............................................................. 5-15 Figure 5.6.1 Relative Toll Revenue (Total)............................................................. 5-24 Figure 5.6.2 Relative Toll Revenue (Tankers of Crude Oil) ................................... 5-24 Figure 5.6.3 Relative Toll Revenue (Tankers of Petroleum Products) .................... 5-24 Figure 5.6.4 Relative Toll Revenue (Chemical Carriers) ........................................ 5-25 Figure 5.6.5 Relative Toll Revenue (LNG/LPG Carriers)....................................... 5-25 Figure 5.6.6 Relative Toll Revenue (Dry Bulk Carriers) ........................................ 5-25 Figure 5.6.7 Relative Toll Revenue (Container Ships) ........................................... 5-26 Figure 5.6.8 Relative Toll Revenue (Vehicle Carriers) ........................................... 5-26 Figure 5.6.9 Relative Toll Revenue (General Cargo Ships) .................................... 5-26 Figure 5.10.1 LNG Price at Exporting and Importing Countries .............................. 5-43 Figure 5.13.1 Distribution of Commodity Value in Container .................................. 5-51 Figure 5.16.1 Proposed Tariff-Setting Procedure...................................................... 5-66 Figure A.3.1 Flowchart of Toll Revenue Estimation ............................................... A-8 Figure A.3.4 Estimated Toll Revenue by Vessel Type and Size in 1999.................. A-9

1 - 1
Chapter 1 Influence of Toll 1.1 Outlook on the Suez Canal Since its opening, the Suez Canal has been playing an important role both in the world economy and in Egyptian economy by connecting the economies of the east and west. The Canal connects the Mediterranean Sea with Red Sea over a distance of 162km and it is the world longest channel without locks. The channel has been widened and deepened to meet the demand of international shipping. The Canal was closed from 1967 to 1974. This came at a time when the world economy was rapidly growing, in particular, there was an increasing demand for crude oil transport. Hence, the impact which the closure of the Canal had on the world economy was very severe. Although the Canal’s relative share in terms of cargo transiting the Canal versus world seaborne cargo and its economic contribution to the Egyptian economy have been decreasing, it is still playing an important role both in the Egyptian economy and in the world economy. About 6% of the world's seaborne cargo is now transiting the Canal compared to 3-4% for the Panama Canal. As to the short cut effect, the distance via Suez Canal route is 29% of distance via the Cape route in traveling between the port of Mumbay and port of Ismir and 71% in case between Singapore and Rotterdam. Considering the maritime shipping trunk line connecting the west and the east of the Canal, it can be said to constitute the artery of world economic activity. The role the Canal plays in the Egyptian economy is also important. The importance of the Canal toll revenue in the national economy can be identified by looking at its share in the national government’s current revenue and in the foreign currency earnings in the balance of payment. In the national budget account, the contribution is allocated to tax revenue which the SCA pays in the form of industrial and commercial tax (42% of net profit) and to fees in the form of royalty (5% of toll revenue) and to profit transfer in terms of surplus. Tax and fees are not explicitly denoted in the statistics but the profit transfer is explicitly denoted as 2,914 million LE in 1998/99 (around 5% of the current revenue of the state budget). Although the share in the national budget is decreasing relative to that of tax revenue, the amount of transfer from SCA is still almost equivalent to that from other major authorities (Petroleum Authority of Egypt and Central Bank of Egypt). Looking at the foreign currency earning in the balance of payment account, Suez Canal revenue account for 9% of the total, almost twice that of petroleum exports in 1998/99.

1 - 2
Considering the negative current account balance of Egypt, the Canal is still important source of foreign currency revenue.
Table 1.1.1 Suez Canal Toll as a GDP Share
Table 1.1.2 Suez Canal Toll in the State Budget Revenue
Table 1.1.3 Suez Canal Toll in the Foreign Currency Revenue
It is therefore urgent to have a tool to forecast the toll revenue based on an accurate estimation of transit demand and more profitable toll structure as well as to diversify revenue sources both for SCA and the Egyptian Government.
(Lemn)GDP at Factor Cost (1996/97 prices)
97/98 share growthrate
98/99 share growthrate
GDP 253,090 100% 5.7 268,398 100% 6Commodity Sector 126,209 50% 6.5 133,335 50% 5.6Productive Service Sector 81,242 32% 4.8 87,024 32% 7.1 Transport & Communication 17,300 7% 6.8 18,355 7% 6.1 Suez Canal 6,502 3% 0.1 6,519 2% 0.3 Trade 44,015 17% 6.2 46,670 17% 6 Finance 10,340 4% 10 11,550 4% 11.7 Insurance 202 0% 11 221 0% 9.4 Restaurants & Hotels 2,883 2% -24.7 3,709 1% 28.7Social Seervice Sectors 45,639 18% 5.1 48,039 18% 5.3
(Lemn)The State Budget Revenue 96/97 97/98 98/99 share97 share98 share99total revenue 64,498 67,963 71,295current revenue 60,753 63,889 66,626central government 57,179 60,035 62,449tax revenue 40,518 43,962 47,149 67% 69% 71%Non tax revenue 16,661 16,073 15,300 27% 25% 23% profit transfers from; 11,423 10,780 9,802 The petroleum authority 4,788 3,870 2,227 8% 6% 3% Suez Canal authority 2,828 2,940 2,914 5% 5% 4% Central Bank of Egypt 2,587 2,617 3,222 4% 4% 5% Others 1,220 1,353 1,439 Fees 1,427 1,483 1,532 Miscellaneous 3,811 3,810 3,966Local Government 2,354 2,426 2,601 4% 4% 4%Service Authorities 1,220 1,428 1,576 2% 2% 2%Capital Revenue 3,745 4,074 4,669
(Lemn)92/93 93/94 94/95 95/96 96/97 97/98 98/99
Transfers 19,127.8 13,651.7 14,251.4 11,957.0 14,070.3 15,613.4 16,541.7 share 32% 25% 22% 19% 20% 23% 24%Suez Canal 6,472.8 6,714.5 6,986.6 6,397.9 6,276.1 6,029.4 6,015.6 share 11% 12% 11% 10% 9% 9% 9%Travel 7,918.3 6,001.6 7,802.5 10,215.8 12,377.1 9,979.8 10,989.6 share 13% 11% 12% 16% 18% 15% 16%Petroleum 7,040.8 5,977.3 7,383.2 7,555.0 8,749.8 5,866.2 3,396.0 share 12% 11% 12% 12% 12% 9% 5%Others 18,767.2 21,792.8 27,065.6 27,580.2 28,899.4 31,015.7 32,117.0
total 59,326.9 54,137.9 63,489.3 63,705.9 70,372.7 68,504.5 69,059.9

1 - 3
1.2 Influence of the Canal Toll on the world shipping and economy To grasp the influence of the Canal toll on the world shipping and economy, we can refer to the bitter experience of the closure of the Canal in the past. The Suez Canal has been playing a very important role as a major maritime transport route between the countries east of the Canal and those west of the Canal for more than one century. The Canal offers amazing savings in transport distance when compared to the Cape route. For instance, the voyage distance between Tokyo and Rotterdam via Suez Canal is 1/4 shorter than via the Cape route and the distance between Bombay and Odessa is cut by 2/3.
Table 1.2.1 Shortening Effect of Maritime Distance by the Suez Canal (nautical miles)
Maritime Distance Shortening Effect
Journey via Suez Canal
(S)
round the Cape of Good Hope
(C)
Difference S/C
Rotterdam - Ras Tanura - Bombay
- Singapore
- Darwin
6,436 6,337
8,288
9,377
11,169 10,743
11,755
11,319
4,733 4,406
3,467
1,942
57% 59%
71%
83%
New York - Ras Tanura - Darwin
8,281 11,222
11,794 11,954
3,513 732
70% 94%
Ismir - Bombay 3,422 11,694 8,272 29%
Source) "World Shipping Encyclopaedia V.9.3", Oct.2000, Fairplay
Shortening of the transport distance will be reflected in the transport cost and time reduction and has a great influence on the various cost items of maritime transport. Through these effects, the Suez Canal has contributed to the development of maritime transport between the regions connected by the Canal. The volume of cargo transiting the Canal once grew at a rate comparable to that of the total volume of world maritime transport. Seventy three million tons of cargo passed through the Canal in 1950 and 169 million tons of cargo (around twice that in 1950) was transported via the Canal ten years later. In 1966, one year before the closing of the Canal, 242 million tons of cargo (176 million tons of oil and 66 million tons of dry bulk cargo) transited the Canal, representing 14% of the world maritime transport volume. The Canal’s share of the world maritime transport volume declined, however, due to the Canal’s closure in 1967. In 1990 the volume through the Canal recovered to its 1966 level. Although the share of tanker cargo had fallen, the total volume amounted to 272million tons, which was 7% of the world seaborne cargo. Moreover, the growth rate of Canal transit cargo was a

1 - 4
remarkable 7.9% per annum compared to an 0.8% growth rate for world seaborne cargo during the same period. From 1990 to 1999, average annual growth rate of total transit cargo (1.4%) was less than that of world seaborne cargo (2.9%), mainly due to the decreasing share of tanker cargo transiting the Canal (5% in 1990 and 1% in 1999). Although the share of Canal transit cargo in the world seaborne cargo has decreased, the growth rate of dry cargo transit is still higher than that of world seaborne cargo. Between 1990 and 1999, the annual growth rate of dry cargo transiting the Canal was 4.4% while that of world seaborne cargo was 3.0%. On the other hand, tanker cargo transit has decreased since the opening of the SUMED pipeline running parallel with the Canal and Iraq-Turkey pipeline. As a result, total cargo transit has shown a lower growth rate than that of world seaborne cargo.
Table 1.2.2 Cargoes carried through the Suez Canal (million metric tons)
Cargoes Carried through the Suez Canal Year Cargo
Southbound Northbound Total (S)
International Sea-born Trade
(I)
S/I
1966 Tanker Cargo
Dry Cargo Total
9
39 48
167
27 194
176
66 242
950
820 1,770
19%
8% 14%
1980 Tanker Cargo
Dry Cargo
Total
14
26
40
28
59
87
42
85
127
1,871
1,883
3,704
2%
5%
3%
1990 Tanker Cargo
Dry Cargo
Total
14
103
117
66
89
155
80
192
272
1,755
2,253
4,008
5%
9%
7%
1999 Tanker Cargo Dry Cargo
Total
5 148
153
18 136
154
23 284
307
2,223 2,950
5,173
1 % 10 %
6 %
Notes) Tankers Cargo in this Table means Crude Oil and Petroleum Products.
Source) "Suez Canal Yearly Report", SCA and "Review of Maritime Transport", UNCTAD

1 - 5
The use of the Canal has traditionally played an important role for certain cargo and transport between certain regions. In 1966, for instance, 36% of oil loaded at the ports in the Arabian Gulf was transported via Suez route and 1/3 of the oil imported by the west European countries passed through the Canal. In 1966, the volume of dry cargo passing through the Canal reached 66 million tons, equivalent to 1/4 of total transit cargo. Most of this dry cargo was handled in ports of Europe and America. However, this represented only 5% of the total dry cargo handled at the ports of both regions. On the contrary, dry cargo transported via the Suez route has great importance for the countries south and east of the Canal. For instance, 41% of the dry cargo handled in the ports of the Arabian Gulf and 32% of the dry cargo handled in the ports of the Red Sea and East Africa and 24% of that handled in the ports in South and South-East Asia passed through the Canal.
Table 1.2.3 O-D of Cargoes carried through the Suez Canal in 1999 (million metric tons)
Origin Region Destination Total Share
Through SC Through SC
15
32 12
23
51 7
10
3
East & S.E. Mediterranean
North Mediterranean West & S.W. Mediterranean
Black Sea
North, West Europe & U.K. Baltic Sea
America
Others
31
40 18
5
53 1
5
1
15%
23% 10%
9%
34% 3%
5%
1%
153 (Southbound) - Total - (Northbound) 154 100%
25 5
18
20 65
22
-
Red Sea East Africa & Aden
Arabian Gulf
South Asia Southeast Asia & Far East
Australia
Others
43 2
19
25 64
1
-
22% 2%
12%
15% 42%
7%
-
154 (Northbound) - Total - (Southbound) 153 100%
Source) "Suez Canal Report December 1999", SCA
Table 1.2.3 shows regional distribution of cargo transited through the Canal in 1999. North of the Canal, North, West Europe and U.K. is the region with the largest share (34% of the total) followed by North Mediterranean (23%) and West, South West Mediterranean (15%). South of the Canal, South-east Asia and Far East has the largest share (41.9%) followed by Red Sea (22.1%), South Asia (14.6%) and Arabian Gulf (11.8%). At the time of this study, a comparison of shares of transited cargo by each region with that of world maritime cargo could not be made, however, it can be said that regions affected by a higher toll would be much wider than in 1966, because of the high growth of dry cargo, especially by container

1 - 6
carriers, in spite of the drastic decline in tanker cargo (compare with Table 1.2.4).
Table 1.2.4 O-D of Dry Cargoes carried through the Suez Canal in 1999 (million metric tons)
Origin Region Destination Total Share
Through SC Through SC
15
31 10
22
50 7
10
3
East & S.E. Mediterranean
North Mediterranean West & S.W. Mediterranean
Black Sea
North, West Europe & U.K. Baltic Sea
America
Others
30
35 14
5
47 1
3
1
16%
23% 8%
10%
34% 3%
5%
1%
148 (Southbound) - Total - (Northbound) 136 100%
18 5
7
20 65
22
-
Red Sea East Africa & Aden
Arabian Gulf
South Asia Southeast Asia & Far East
Australia
Others
42 2
19
24 61
1
-
21% 2%
9%
15% 44%
8%
-
136 (Northbound) - Total - (Southbound) 148 100%
Source) "Suez Canal Report December 1999", SCA
The closure of the Canal in 1967 brought severe consequences to the world maritime transport, especially in the form of higher transport cost. The severest influence was on oil transport and the maritime foreign trade of the countries of East Africa and South and Southeast Asia. The influence on oil transport was especially great and that on oil transport from the Middle East to Europe was, inter-alia, immense. At the same time, it caused a sudden increase in the demand for the world tanker fleet. Additional supply of the oil tanker fleet to meet this increased demand was not so difficult, though it linked with the enlargement of vessel size. Sudden change in the maritime transport condition for the countries south and east of the Canal made various trade relations messy. Additional increase in the trade cost such as transportation, insurance and other trade related cost items led to a loss in competitive power of export goods in the existing market and also to a price increase of the imported goods. Major industries of certain countries such as banana production in Somalia were seriously damaged. Moreover, the change in the maritime transport routes by the closure of the Canal affected various fields of economy and resulted in an economic slowdown in the countries of the related regions. Total loss in the export to Europe incurred by East Africa and Southeast Asia was said to amount to 560 million US$ and the loss in 1969 and 1970 was estimated as around 13% of

1 - 7
total export from these regions to Europe. The closure of the Canal resulted in oil exports being switched from the Middle East to regions closer to the consumption countries such as oil production areas in North Africa and West Africa. Total amount shifted was around 40 million tons per annum at a value of 500 million US$/year for the years up to 1970 and totaled around $2,000 million. Other various economic impacts were felt with the closure of the Canal. Insurance and commercial credit costs were raised due to the longer delivery time of products and goods. The ports nearby the Canal such as Aden, Djibouti and Port Sudan experienced a severe decline in port activities. If the project to deepen the Canal to 40ft by the end of the year 1967 could have been completed, fully laden 60,000 DWT vessels would have been able to transit the Canal and 200,000 DWT ballast vessels would have been able to transit the Canal. By 1967, 90% of the tankers and oil/bulk carriers in operation and/or under construction could transit the Canal at least in ballast. At the end of the year 1971, almost 1/2 of these vessels in operation and/or under construction were larger than 200,000 DWT. Therefore, these vessels could not transit the Canal whether in laden or ballast condition. Thus the closure of the Canal added a new factor to be considered in the construction of the large tankers. Large tankers with rather low construction and operation costs such as the vessels which prevailed in the late 1960s showed scale merit in comparison with smaller vessels. As a result, in the case of oil transport from the Gulf of Persia to Europe, transport cost by large tanker via the Cape route, in spite of the much longer voyage distance, became less than when transported by smaller tanker via the Suez route before the closure. Since 1970, however, both the construction cost and operation cost of vessels, especially for large tankers, increased to a large extent. Therefore the cost advantage of the large tanker had decreased and transport by large tankers over longer distances might have lost its advantage over transport by smaller tanker over shorter distances. It was reported that if it were realized, then oil transportation cost from the Gulf of Persia to Europe, especially to the ports in Mediterranean Sea would decrease after reopening of the Canal. As a result of the Canal closure, capacity of the pipelines to transport Middle East oil to the east Mediterranean base (both under operation and planned) has largely increased. Since some of these pipelines ran or planned to run parallel to the Canal, large tanker can load and unload oil at the pipeline base without restriction by the Canal. If these pipelines are used in combination with the Canal, it will be possible to, (a) increase the oil transport capacity by decreasing the voyage distance of large tankers and (b) avoid the cost increase involved in long distance oil transportation. Tendency to construct larger dry bulk carriers was observed both before and after the closure of the Canal. Transportation of dry bulk cargo and liner cargo would enjoy the benefit of reopening of the Canal to large extent, since all dry bulk carriers currently under

1 - 8
operation and under construction could transit the Canal. Increase of transport cost must be borne by the traders and countries which enjoy the benefit of the Canal. The competitiveness of products should not be affected. Thus the effects of the Canal toll can be roughly grasped through an analysis of its past closure. The composition of the transiting vessels has changed compared with the pre-closure composition. Number of oil tankers transiting the Canal has decreased with the appearance of VLCC and ULCC and also due to the pipelines. These days, the appearance of large container vessels has also changed the composition by decreasing the number of general cargo vessels. Hence, a new toll system will be necessary to meet these changing shipping circumstances. In devising the new toll system the effects experienced after the Canal closure had to be considered. Higher toll will not always increase the revenue of SCA. It will cause the decrease in transit demand as vessels divert to the route via the Cape. And an extremely high toll would be similar in effect to the closure of the Canal, namely, it would result in a structural change in world trade and a decline in SCA revenue. Therefore, optimal toll should be carefully considered to balance the revenue maximizing motivations of SCA and the traders reflecting the possible trends in world trade patterns. In this context, timely restructuring of toll system is indispensable for the better management of the Canal. Toll revenue is important not only for the SCA but also for the national economy of Egypt since it is one of the major sources of revenue for the central government, especially foreign currency. Toll revenue becomes the revenue of the central government through industrial and commercial tax (42% of net profit) and royalty fee (5% of toll revenue) and surplus transfer. In 1999 industrial and commercial tax paid is estimated as around US$ 770 million, royalty fee as US$ 89 million, and surplus is US$ 858 million (or LE 2,914 million). In this context, toll system to maximize net profit rather than to maximize toll revenue is more important from the central government’s view. Therefore, expenditure by SCA for management and operation of the Canal including project investment cost and interest payment as well as the dividend from the affiliate company, all of which are the determinants of the profit of the SCA, are other important factors in deciding the optimal toll system. Hence, investment in the development of the Canal such as widening and/or deepening should only be done after considering the factors which affect the world trade pattern including possible toll level as well as the necessary period of development within the foreseeable future time span in the world maritime market.

1 - 9
1.3 Macroscopic influence of toll - Theoretical explanations The influence of toll on the change of transit demand and trade pattern can be theoretically explained as follows. The shipper’s short run transport demand for a trade to a certain foreign market is derived as a function of distance, freight rate of maritime transport. It enables us to construct a demand of transiting the Suez Canal as well as analyze the divergence of transport demand by the characteristics of cargo. The assumptions made here are rather simple because the purpose of the analysis here is focused on the interaction between transport cost and the trade demand rather than on the demand structure itself. The following set of assumptions is adopted. A1. The firm/shipper operates under the condition of perfect competition. A2. It is located in a certain region/country and sells all of its output of a single
homogeneous product at a certain market at a given price outside the country. A3. The firm purchases all of its inputs locally so that the only transport it requires is for
shipping its product to the market. Then firm’s profit maximization behavior is expressed as following equation.
Max. π = (P - Tm・d - Pc - Ts)Q - f(Q) (Parameters)
P: price of the commodity at the market Tm: maritime transport tariff exclusive of port charges and Canal toll
and assumed to be proportional to the transport distance inclusive of inland transport
Pc: port charges inclusive of all the cost incurred in the port Ts: Suez Canal toll Q: quantity of shipment f(Q):production cost function of the trade commodity
Then profit maximization conditions are;
f’(Q) = P - Tm・d - Pc - Ts (1) f”(Q) > 0 (2)
Equations (1) and (2) state the usual profit maximization condition that marginal cost f’(Q) equals marginal revenue (P - Tm・d - Pc - Ts), and that the marginal cost curve is rising. Hereafter, marginal revenue is referred to as the net price, denoted P^. With P constant and T = Tm・d + Pc + Ts variable, equation (1) also yields the firm’s demand function for trade with respect to freight rate.

1 - 10
If its marginal cost curve is U-shaped, this function is truncated but has the ordinary negative slope (see Figure 1.3.1 and Figure 1.3.2). The truncation occurs because the firm will stop production if the transport cost rises to the point where P^ = P - T is less than the minimum average variable cost; that is, the shut down price Ps. From this demand function, we can observe the followings;
Obs.1 Demand for trade tends to shrink with the increase of toll (increase of T in Figure 1.3.2).
Obs.2 Aggregated demand function can also be truncated and there might be a level of toll at which some group of transit demand will all disappear.
Figure 1.3.1 Relation between Price and Quantity of Shipment
Figure 1.3.2 Relation between Toll and Demand for Trade
MC AVC
Q1 Qn Q0
P-T1=Ps
Q
P-Tn=Pn
^
P=P
^
T1
Tn
Q1 Qn
1 - 11
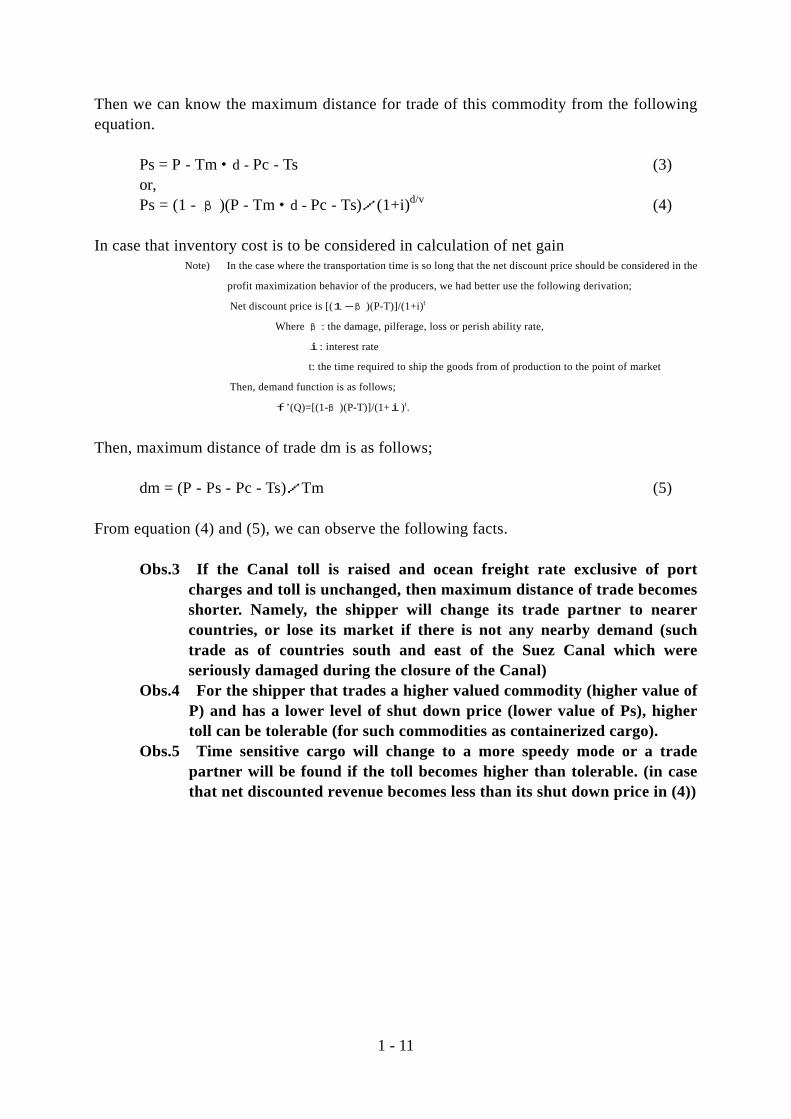
Then we can know the maximum distance for trade of this commodity from the following equation.
Ps = P - Tm・d - Pc - Ts (3) or, Ps = (1 - β)(P - Tm・d - Pc - Ts)/(1+i)d/v (4)
In case that inventory cost is to be considered in calculation of net gain
Note) In the case where the transportation time is so long that the net discount price should be considered in the
profit maximization behavior of the producers, we had better use the following derivation;
Net discount price is [(1-β)(P-T)]/(1+i)t
Where β: the damage, pilferage, loss or perish ability rate,
i: interest rate
t: the time required to ship the goods from of production to the point of market
Then, demand function is as follows;
f’(Q)=[(1-β)(P-T)]/(1+i)t.
Then, maximum distance of trade dm is as follows;
dm = (P - Ps - Pc - Ts)/Tm (5) From equation (4) and (5), we can observe the following facts.
Obs.3 If the Canal toll is raised and ocean freight rate exclusive of port charges and toll is unchanged, then maximum distance of trade becomes shorter. Namely, the shipper will change its trade partner to nearer countries, or lose its market if there is not any nearby demand (such trade as of countries south and east of the Suez Canal which were seriously damaged during the closure of the Canal)
Obs.4 For the shipper that trades a higher valued commodity (higher value of P) and has a lower level of shut down price (lower value of Ps), higher toll can be tolerable (for such commodities as containerized cargo).
Obs.5 Time sensitive cargo will change to a more speedy mode or a trade partner will be found if the toll becomes higher than tolerable. (in case that net discounted revenue becomes less than its shut down price in (4))
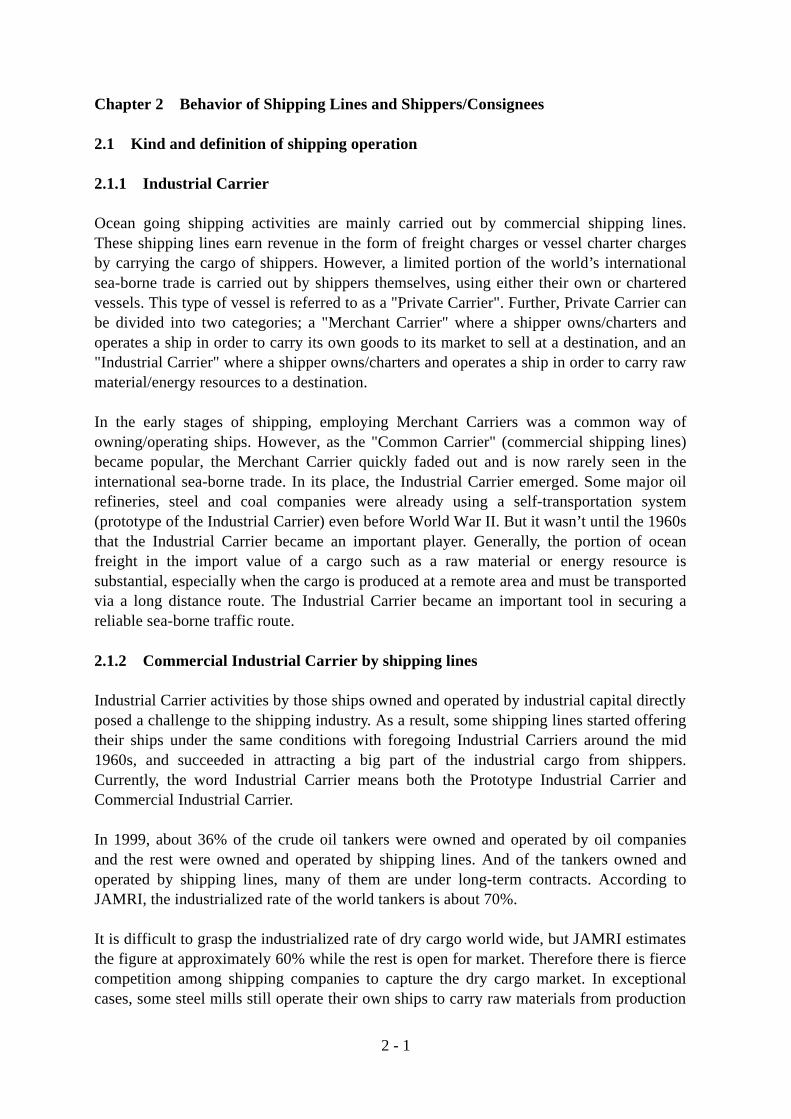
2 - 1
Chapter 2 Behavior of Shipping Lines and Shippers/Consignees 2.1 Kind and definition of shipping operation 2.1.1 Industrial Carrier Ocean going shipping activities are mainly carried out by commercial shipping lines. These shipping lines earn revenue in the form of freight charges or vessel charter charges by carrying the cargo of shippers. However, a limited portion of the world’s international sea-borne trade is carried out by shippers themselves, using either their own or chartered vessels. This type of vessel is referred to as a "Private Carrier". Further, Private Carrier can be divided into two categories; a "Merchant Carrier" where a shipper owns/charters and operates a ship in order to carry its own goods to its market to sell at a destination, and an "Industrial Carrier" where a shipper owns/charters and operates a ship in order to carry raw material/energy resources to a destination. In the early stages of shipping, employing Merchant Carriers was a common way of owning/operating ships. However, as the "Common Carrier" (commercial shipping lines) became popular, the Merchant Carrier quickly faded out and is now rarely seen in the international sea-borne trade. In its place, the Industrial Carrier emerged. Some major oil refineries, steel and coal companies were already using a self-transportation system (prototype of the Industrial Carrier) even before World War II. But it wasn’t until the 1960s that the Industrial Carrier became an important player. Generally, the portion of ocean freight in the import value of a cargo such as a raw material or energy resource is substantial, especially when the cargo is produced at a remote area and must be transported via a long distance route. The Industrial Carrier became an important tool in securing a reliable sea-borne traffic route. 2.1.2 Commercial Industrial Carrier by shipping lines Industrial Carrier activities by those ships owned and operated by industrial capital directly posed a challenge to the shipping industry. As a result, some shipping lines started offering their ships under the same conditions with foregoing Industrial Carriers around the mid 1960s, and succeeded in attracting a big part of the industrial cargo from shippers. Currently, the word Industrial Carrier means both the Prototype Industrial Carrier and Commercial Industrial Carrier. In 1999, about 36% of the crude oil tankers were owned and operated by oil companies and the rest were owned and operated by shipping lines. And of the tankers owned and operated by shipping lines, many of them are under long-term contracts. According to JAMRI, the industrialized rate of the world tankers is about 70%. It is difficult to grasp the industrialized rate of dry cargo world wide, but JAMRI estimates the figure at approximately 60% while the rest is open for market. Therefore there is fierce competition among shipping companies to capture the dry cargo market. In exceptional cases, some steel mills still operate their own ships to carry raw materials from production

2 - 2
points to mills, but a Commercial Industrial Carrier is employed in the majority of cases. Many of Prototype Industrial Carriers were spun out from organizations of mills and are now commercial shipping lines. "Shipping Market" consists of shipping lines and cargo. Industrial Carriers and cargo carried by Industrial Carriers are not strictly part of the Shipping Market. It must be remembered that the Shipping Market can be divided into "Liner Market" and "Tramp Market". The Liner Market is not confined to the shipping industry but belongs to a broader trade industry between shipping lines and shippers/consignees of cargo, while Tramp Market exists only among shipping lines/brokers and shippers of tramp cargo, where cargo freights, charterage, voyage charter contracts, trip charter contracts, in various period of terms and volumes are negotiated and contracted. 2.1.3 Pure Car Carriers, LNG/LPG Carriers as Semi-Industrial Carrier (1) Pure Car Carriers Today, the transportation of motor vehicles by sea forms part of a complex logistics chain. This has taken the carriage of cars from its early origins in the Tramp Market through to its current position where the spot market has all but disappeared. There are a number of people in the shipping industry who see this trend as the way forward. What looks certainly true in the case of car carriers is that shipping has moved from being a secondary activity into an integral part of the global car business. In this sense, Pure Car Carriers are 100 % industrial carriers, but some of them can be trip or voyage chartered subject to some conditions in a certain group of car producers and shipping lines. (2) LPG/LNG Carriers There is no spot market in the LPG/LNG field, because they are project-oriented businesses. All LPG/LNG carriers are built as a part of each project to transport the output together with a pipeline system. Ship’s building cost is included in the total project cost for a whole period of 20 to 30 years. In very rare case, a charterer of LNG/LPG carriers (in most cases a project originator) will deploy ships for an extra voyage to utilize empty space. Strictly speaking, therefore, it is difficult to classify this category of ships as industrial carrier. 2.2 Tramp market and tanker market 2.2.1 Peculiarity of sea-transportation Shipping Market can be divided into Liner Market, Tramp Market and also "Tanker Market" based on the kind of ships and cargoes. Tanker Market is rather independent from the other two markets due to the nature of liquid crude oil. Liner Market and Tramp Market both deal with dry cargo. The difference between the two lies in the characteristics of the cargo transported. Cargo which is cheap in value but or transported in large volumes (e.g. raw materials for energy, for many industrial products and for food) is generally referred to

2 - 3
as "Tramp Cargo". The first priority for this type of cargo is a "low freight rate", while "transport speed" or "care during transport" are not such important factors. "Liner Cargo", on the other hand, is time sensitive, market sensitive and interest sensitive. Transit time, regularity, frequency and freight rate level of sea-transportation are important factors for Liner Cargo. 2.2.2 Behavior of shipping lines in tramp/tanker market "Low freight" is a prerequisite for both markets. If a shipping line can provide a low freight rate, it can play a role in the market. A new ship is not necessary; an older ship or a chartered ship is sufficient on condition that the ship is sea-worthy. Because of the openness of the two markets, number of buyers and sellers is numerous, thus the market share of an individual shipping line is quite limited. There is no dominant player in either market, which can event influence over the whole market. Also, it is difficult for certain members to work together and control the market because size and nature of each shipping line widely differ. For these reasons, free competition is observed in these two markets. Freight rates and charterage are automatically decided in the markets through the so-called invisible hands of Adam Smith and those levels constantly change according to the balance of demand/supply of ships’ space. For example, where there is an oversupply of space in one regional market, the freight level in that region will decrease. However, a shipping line will generally not carry cargo if the freight level is insufficient to reach the break-even point of operation cost. As a result, after a certain period, the freight rate level will recover to a normal level. Both markets have an automatic adjusting function regarding freight level and ships’ space. In these markets, cost/profit margins are rarely satisfied for the sake of competition. The range of these markets is worldwide but a level of freight rate at a given time for a given commodity of cargo can be applied to any voyage of any other route as far as they are applied to the same type of ship and same kind of cargo. 2.3 Liner market 2.3.1 Definition of liner market Liner Market is completely different from Tramp Market and Tanker Market. The value per ton of liner cargo is high while the portion of freight charges in the CIF value is small, thus freight paying power is strong. Typical liner cargoes are: finished goods, semi-finished goods, fresh food, other high value cargo and postal goods. These cargoes are sensitive to transit time, commodity market changes and interest as already explained before. The transportation needs for these cargoes are, therefore, safety, speed, and frequency of shipping. Freight rate level itself is one of the most important concerns of shippers/consignees but the quality of services is as important as freight. Higher operation cost is needed to transport "Liner Cargo" and naturally higher freight rate

2 - 4
is quoted to shippers/consignees who accept it as far as the quality of transportation service meets the level they request. General cargo of this kind (often called Break-bulk cargo) is traded usually in a smaller volume compared with Tramp Cargo but a stream of cargo flow and places of origin are comparatively fixed. Because the direction and volume of the cargo flow are stable, it is possible for shipping lines to maintain a regular liner route by consolidating a small amount of cargo. 2.3.2 Operation of liner service Shipping lines in liner services make a public notice regarding "Sailing Schedule" and "Itemized Freight Rate (Freight Tariff)” to shippers/consignees. The service operated under these advertised schedules and freight rates by regular calling vessels are called "Liner Services". An abstract name of "Liner Market" is given to these liner operations between shipping lines and shippers/consignees. Liner vessels, once announced and deployed, are generally fixed to a particular service route and seldom changed. As a result, the service line itself becomes a market in the region, consisting of the shipping lines, the shippers and the consignees. Further, to maintain a regular frequency and safe and speedy service, a fleet of ships, "Fleet Line", are needed. In addition, a large investment is required to set up a cargo canvassing network and cargo handling systems, especially in this era of containerization. Nowadays, there are only few liner operators and the Liner Market is a typical oligopoly. 2.3.3 Behavior of shipping line in liner market Liner Market does not have an automatic space-adjusting function as in the Tramp Market and Tanker Market. It is a non-elastic market, although the basic nature of the Liner Market has been in a transition period since OSRA-Ocean Shipping Reform Act of 1998, USA. In this market, competition between shipping lines tends to become a very severe due to the lack of an automatic adjusting mechanism. Generally, because of a sociological background as an old established company, liner operators are expected to maintain a once started service route and they usually find it extremely difficult to suspend their services or even reduce service frequency. Consequently, liner operators’ final and only means to counter decreasing market shares is strengthening marketing and canvassing power. And the only way to achieve this is to draw business away from a competitor. Once a rate-war begins, rate levels fall drastically. As each player in the market is more or less similar in scale marketing power, a rate-war can be financially devastating to all included. To modify this non-elastic market, the international trading world has traditionally put the market beyond the anti cartel regulations. The international cartel of liner operators is called "Shipping Conference". For more than one century, shipping conferences have played an important role in stabilizing trade. In 1990, there were 360 shipping conferences in the world. A careful observation is need on what changes will come after the OSRA.

2 - 5
2.4 Associations of shipping lines and shippers/consignees Major associations of shipping lines and shippers/consignees listed below with a short explanation from the view point of marketing of the Suez Canal. International Chamber of Shipping ( ICS )
A non-governmental organization established in 1921. The members come from ship owners associations in 34 countries. The head office in London and should be consulted whenever a tariff revision is being contemplated regardless of the kind of ship
European Shippers’ Council
A non-governmental organization established in 1963 as ENSC ( European National Shippers’ Council ), then changed its name to the present name. Members come grom 16 shippers associations in 16 EU Countries. Specialized in a multi-modal transportation system.
European Community Ship-owners’ Association ( ECSA )
In 1965, CAACE ( Comite des Associations d Armateurs des Communautes Europeeenes ) was organized by 15 EU countries and Norway. Changed its names to ECSA in 1999. Governmental Organization. The head office is in Brussel. Should be consulted for any formal explanation on the Canal marketing policy.
Asian Shipowners’ Forum
Established in 1992 with on the initiative of Japanese Government. Members come from 13 ship owners associations from ASEAN, Australia, China, Hong Kong, Japan , Korea and Taiwan. Should be consulted for any formal explanation on the Canal marketing policy
Baltic and International Maritime Council ( BIMCO )
Established in 1905 as The Baltic and White Sea Conference, then changed its name to BIMCO. There are currently 2,745 members from 118 countries, including more than 1,000 shipping lines, 1,635 of shipping agents and brokers. Should be consulted for marketing of tramp and tanker owners and operators.
International Association of Dry Cargo Ship-owners ( INTERCARGO )
Established in 1980; its head office is in London. Members comprize 150 shipping lines from 30 countries. The most influential association in dry cargo ( including oil/dry carriers ) business. Should be consulted for marketing of tramp all kinds.
International Association of Independent Tanker Owners ( INTERTANKO )
Established in 1970. The head office is in London, with branch offices in Singapore and Washington. Members comprize 270 tanker owners and the total tonnage under control is 172m D/W, 2000 tankers. Should be consulted for marketing of tankers all kind.

3 - 1
Chapter 3 Relations between vessel profitability and costs at Suez 3.1 Shipping cost The shipping cost consists of the managing cost and the operation cost.
Figure 3.1.1 Components of Shipping Cost The managing cost consists of the indirect managing cost (capital cost and depreciation cost) and the direct managing cost (manning, insurance, etc.). This managing cost occurs every day even if a vessel is not in service. The operation cost consists of the fuel cost and the other operation cost (dues/charges at ports/canals, cargo expenses, etc.). The operation cost occurs only the days while a vessel is in service (voyage or calling at port for charging/discharging the cargoes). In case of vessels not less than Panamax size, the managing cost accounts for more than 70% of shipping cost except container ships. As for container ships, the operation cost at ports and cargo expenses are higher than other vessel types since container transport services are built in the inter-modal transportation system. 3.2 Profitability of shipping lines and vessel deployments Shipping lines grasp their profitability with the profit/loss figures derived from the freight earnings and the shipping cost. The profit/loss figures are analyzed by each activity segment (by a vessel or by a fleet lines, etc). Shipping lines make their vessel deployments including the route choice and the fleet mix arrangement after comparing a voyage or an annual profit/loss figures that would result from the possible vessel deployments.
Shipping Cost
Managing Cost Operation Cost
Indirect M. Cost - Capital Cost - Depreciation Cost
Direct M. Cost - Manning Cost - Insurance - Lubricate oil - R & M, etc.
Fuel Cost Other Operation Costs - Dues /Charges at at Ports/Canals - Cargo Expenses - Agency Fee, etc.

3 - 2
3.3 Relations between vessel profitability and costs at Suez 3.3.1 Basic relations Shipping lines are considered to make their route choice after comparing the profit/loss figures that would result from using each of the possible routes. (1) Case-1: annual profitability of a vessel The Study Team would like to introduce here a simplified mathematical model based on certain assumptions in order to roughly grasp the relation between vessel profitability and costs at Suez. For example, annual profit/loss of a vessel via the Suez and that via the Cape can be expressed as Equation-1 and Equation-2.
Ps = (Fs - 2T' - 2ODs/S)Ns - (2MDs/S)Nsx (1) Pc = (Fc - 2ODc/S)Nc - (2MDc/S)Ncx (2)
(Parameters) Ps (US$/SCNT): Annual profit/loss via the Suez
Pc (US$/SCNT): Annual profit/loss via the Cape
Fs (US$/SCNT/voyage): Freight revenue of round voyage via the Suez
Fc (US$/SCNT/voyage): Freight revenue of round voyage via the Cape
T' (US$/SCNT/transit): Costs (toll, other charges and loss) at the Suez
M (US$/SCNT/day): Managing cost
O (US$/SCNT/day): Operation cost (= fuel cost by Assumption-a.)
Ds (miles): Distance of origin-destination pair via the Suez
Dc (miles): Distance of origin-destination pair via the Cape
S (miles/day): Speed
Ns: Annual number of round voyages via the Suez
Nsx: Maximum annual number of round voyages via the Suez
Nc: Annual number of round voyages via the Cape
Ncx: Maximum annual number of round voyages via the Cape
A: Managing cost recovery ratio via the Cape
Definition) Fc = 2(AM + O)Dc/S
A<1 at recession
A=1 at full cost recovery level
A>1 at boom
(Assumptions) a. Days and costs at Ports are assumed to be neglected.
b. Effect of costs at Suez on trade O-D and on its volume is assumed to be neglected.
c. Speeds are assumed to be constant regardless of laden or in ballast.
d. Costs at Suez of in-bound and out-bound are assumed to be the same.
e. Vessels are assumed to call only O-D ports.
Shipping lines choose the route via the Suez when profit/loss of a vessel via Suez is not less than that via the Cape, namely, Ps-Pc>=0. In this case, T' or costs at Suez can be
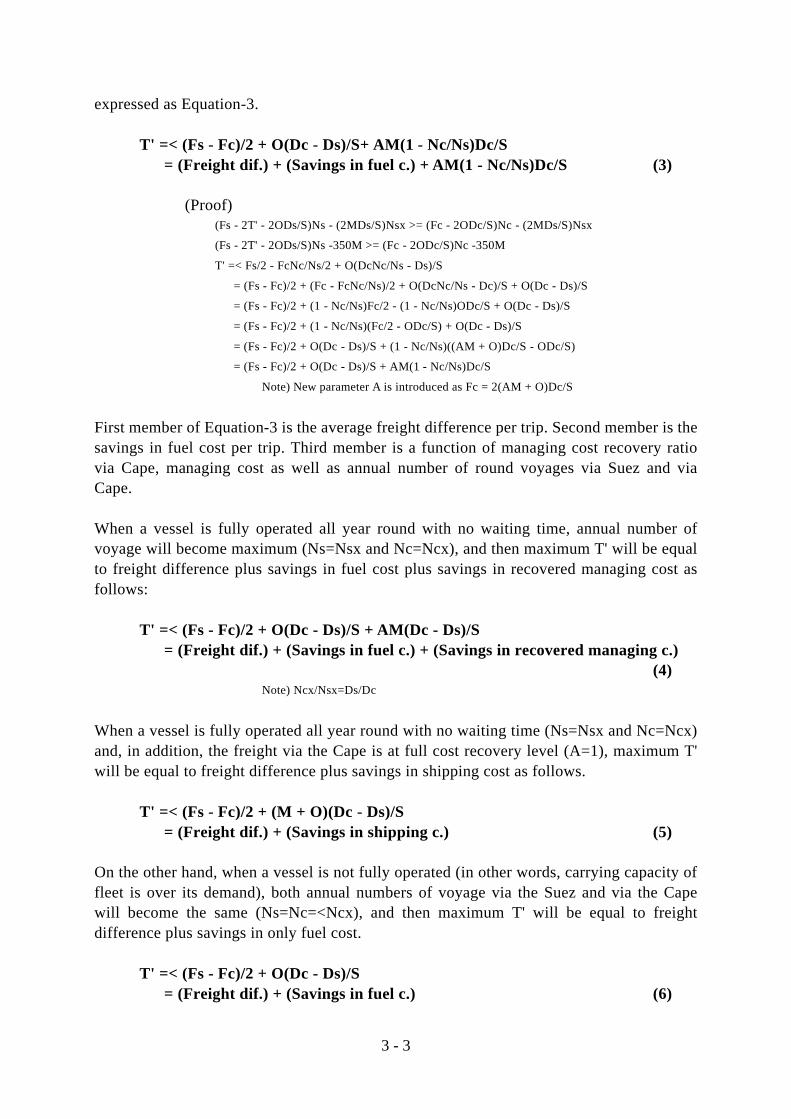
3 - 3
expressed as Equation-3.
T' =< (Fs - Fc)/2 + O(Dc - Ds)/S+ AM(1 - Nc/Ns)Dc/S = (Freight dif.) + (Savings in fuel c.) + AM(1 - Nc/Ns)Dc/S (3)
(Proof) (Fs - 2T' - 2ODs/S)Ns - (2MDs/S)Nsx >= (Fc - 2ODc/S)Nc - (2MDs/S)Nsx
(Fs - 2T' - 2ODs/S)Ns -350M >= (Fc - 2ODc/S)Nc -350M
T' =< Fs/2 - FcNc/Ns/2 + O(DcNc/Ns - Ds)/S
= (Fs - Fc)/2 + (Fc - FcNc/Ns)/2 + O(DcNc/Ns - Dc)/S + O(Dc - Ds)/S
= (Fs - Fc)/2 + (1 - Nc/Ns)Fc/2 - (1 - Nc/Ns)ODc/S + O(Dc - Ds)/S
= (Fs - Fc)/2 + (1 - Nc/Ns)(Fc/2 - ODc/S) + O(Dc - Ds)/S
= (Fs - Fc)/2 + O(Dc - Ds)/S + (1 - Nc/Ns)((AM + O)Dc/S - ODc/S)
= (Fs - Fc)/2 + O(Dc - Ds)/S + AM(1 - Nc/Ns)Dc/S
Note) New parameter A is introduced as Fc = 2(AM + O)Dc/S First member of Equation-3 is the average freight difference per trip. Second member is the savings in fuel cost per trip. Third member is a function of managing cost recovery ratio via Cape, managing cost as well as annual number of round voyages via Suez and via Cape. When a vessel is fully operated all year round with no waiting time, annual number of voyage will become maximum (Ns=Nsx and Nc=Ncx), and then maximum T' will be equal to freight difference plus savings in fuel cost plus savings in recovered managing cost as follows:
T' =< (Fs - Fc)/2 + O(Dc - Ds)/S + AM(Dc - Ds)/S = (Freight dif.) + (Savings in fuel c.) + (Savings in recovered managing c.) (4)
Note) Ncx/Nsx=Ds/Dc
When a vessel is fully operated all year round with no waiting time (Ns=Nsx and Nc=Ncx) and, in addition, the freight via the Cape is at full cost recovery level (A=1), maximum T' will be equal to freight difference plus savings in shipping cost as follows.
T' =< (Fs - Fc)/2 + (M + O)(Dc - Ds)/S = (Freight dif.) + (Savings in shipping c.) (5)
On the other hand, when a vessel is not fully operated (in other words, carrying capacity of fleet is over its demand), both annual numbers of voyage via the Suez and via the Cape will become the same (Ns=Nc=<Ncx), and then maximum T' will be equal to freight difference plus savings in only fuel cost.
T' =< (Fs - Fc)/2 + O(Dc - Ds)/S = (Freight dif.) + (Savings in fuel c.) (6)
3 - 4
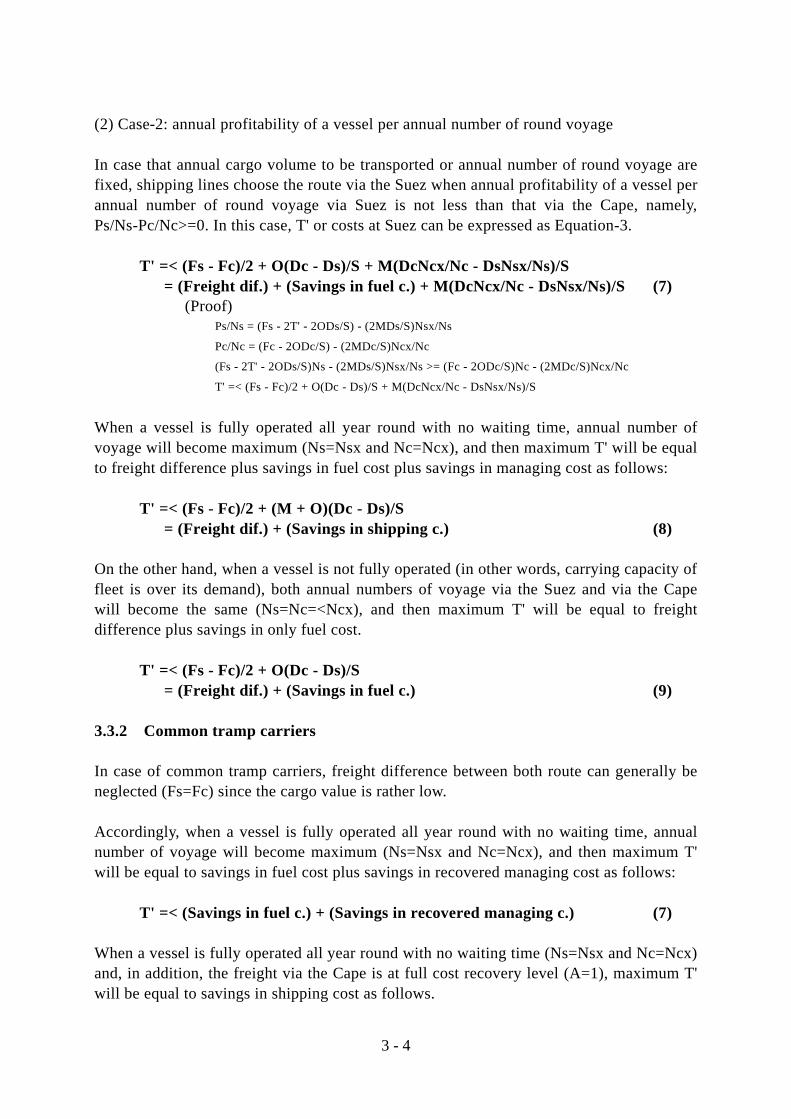
(2) Case-2: annual profitability of a vessel per annual number of round voyage In case that annual cargo volume to be transported or annual number of round voyage are fixed, shipping lines choose the route via the Suez when annual profitability of a vessel per annual number of round voyage via Suez is not less than that via the Cape, namely, Ps/Ns-Pc/Nc>=0. In this case, T' or costs at Suez can be expressed as Equation-3.
T' =< (Fs - Fc)/2 + O(Dc - Ds)/S + M(DcNcx/Nc - DsNsx/Ns)/S = (Freight dif.) + (Savings in fuel c.) + M(DcNcx/Nc - DsNsx/Ns)/S (7)
(Proof) Ps/Ns = (Fs - 2T' - 2ODs/S) - (2MDs/S)Nsx/Ns
Pc/Nc = (Fc - 2ODc/S) - (2MDc/S)Ncx/Nc
(Fs - 2T' - 2ODs/S)Ns - (2MDs/S)Nsx/Ns >= (Fc - 2ODc/S)Nc - (2MDc/S)Ncx/Nc
T' =< (Fs - Fc)/2 + O(Dc - Ds)/S + M(DcNcx/Nc - DsNsx/Ns)/S
When a vessel is fully operated all year round with no waiting time, annual number of voyage will become maximum (Ns=Nsx and Nc=Ncx), and then maximum T' will be equal to freight difference plus savings in fuel cost plus savings in managing cost as follows:
T' =< (Fs - Fc)/2 + (M + O)(Dc - Ds)/S = (Freight dif.) + (Savings in shipping c.) (8)
On the other hand, when a vessel is not fully operated (in other words, carrying capacity of fleet is over its demand), both annual numbers of voyage via the Suez and via the Cape will become the same (Ns=Nc=<Ncx), and then maximum T' will be equal to freight difference plus savings in only fuel cost.
T' =< (Fs - Fc)/2 + O(Dc - Ds)/S = (Freight dif.) + (Savings in fuel c.) (9)
3.3.2 Common tramp carriers In case of common tramp carriers, freight difference between both route can generally be neglected (Fs=Fc) since the cargo value is rather low. Accordingly, when a vessel is fully operated all year round with no waiting time, annual number of voyage will become maximum (Ns=Nsx and Nc=Ncx), and then maximum T' will be equal to savings in fuel cost plus savings in recovered managing cost as follows:
T' =< (Savings in fuel c.) + (Savings in recovered managing c.) (7) When a vessel is fully operated all year round with no waiting time (Ns=Nsx and Nc=Ncx) and, in addition, the freight via the Cape is at full cost recovery level (A=1), maximum T' will be equal to savings in shipping cost as follows.
3 - 5
T' =< (Savings in shipping c.) (8) On the other hand, when a vessel is not fully operated (in other words, carrying capacity of fleet is over its demand), both annual numbers of voyage via the Suez and via the Cape will become the same (Ns=Nc=<Ncx), and then maximum T' will be equal to savings in only fuel cost.
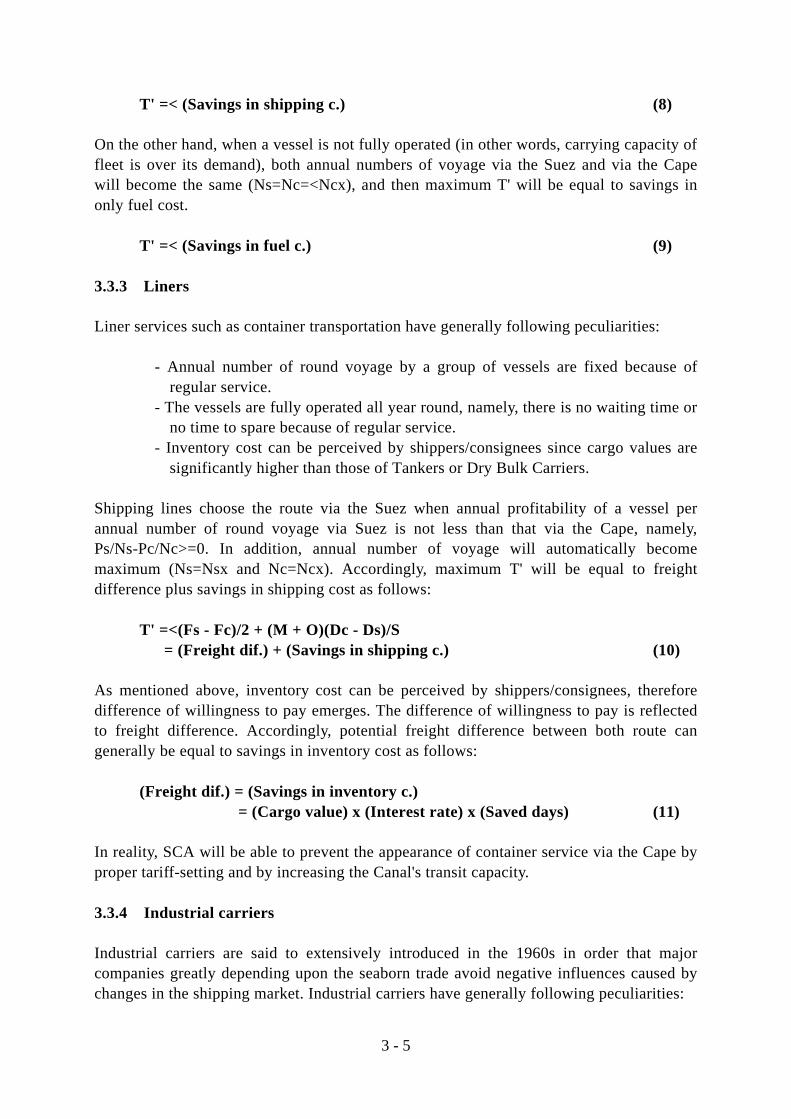
T' =< (Savings in fuel c.) (9) 3.3.3 Liners Liner services such as container transportation have generally following peculiarities:
- Annual number of round voyage by a group of vessels are fixed because of regular service.
- The vessels are fully operated all year round, namely, there is no waiting time or no time to spare because of regular service.
- Inventory cost can be perceived by shippers/consignees since cargo values are significantly higher than those of Tankers or Dry Bulk Carriers.
Shipping lines choose the route via the Suez when annual profitability of a vessel per annual number of round voyage via Suez is not less than that via the Cape, namely, Ps/Ns-Pc/Nc>=0. In addition, annual number of voyage will automatically become maximum (Ns=Nsx and Nc=Ncx). Accordingly, maximum T' will be equal to freight difference plus savings in shipping cost as follows:
T' =<(Fs - Fc)/2 + (M + O)(Dc - Ds)/S = (Freight dif.) + (Savings in shipping c.) (10)
As mentioned above, inventory cost can be perceived by shippers/consignees, therefore difference of willingness to pay emerges. The difference of willingness to pay is reflected to freight difference. Accordingly, potential freight difference between both route can generally be equal to savings in inventory cost as follows:
(Freight dif.) = (Savings in inventory c.) = (Cargo value) x (Interest rate) x (Saved days) (11)
In reality, SCA will be able to prevent the appearance of container service via the Cape by proper tariff-setting and by increasing the Canal's transit capacity. 3.3.4 Industrial carriers Industrial carriers are said to extensively introduced in the 1960s in order that major companies greatly depending upon the seaborn trade avoid negative influences caused by changes in the shipping market. Industrial carriers have generally following peculiarities:

3 - 6
- Freight charges or in-house one are equal to or a little bit more than the shipping cost since the vessels are owned and operated by such major companies or by shipping lines under long-term contracts which are agreed at nearly full cost recovery level.
- The vessels are fully operated all year round, namely, there is no waiting time or no time to spare.
From the first point, vessel profitability is considered to always be zero or a little more regardless of route, and the least cost route are generally chosen. Accordingly, it is thought to be appropriate to set the toll level based on savings in shipping cost.
T' =< (M + O)(Dc - Ds)/S = (Savings in shipping c.) (12)
(Proof) (Cost via the Suez)/Ns = (2T' + 2ODs/S) + (2MDs/S)Nsx/Ns
(Cost via the Cape)/Nc = (2ODc/S) + (2MDc/S)Ncx/Nc
Note) Ns=Nsx, Nc=Ncx
(2T' + 2ODs/S) + (2MDs/S)Nsx/Nsx =< (2ODc/S)Nc + (2MDc/S)Ncx/Ncx
T' =< O(Dc - Ds)/S + M(Dc - Ds)/S
As to second point, in case that there is enough time to spare until next operation after transiting the Canal, savings perceived by shipping lines are only in fuel cost (variable cost). Savings in managing cost (nearly fixed cost) are not perceived. Full savings in managing cost are perceived only when shipping lines can fully utilize days saved by using the Canal for their next operation.

4 - 1
Chapter 4 Issues on the Currency Unit of Toll From the view point of the foreign currency earning function of the canal, it is an important issue to which currency unit the toll should be pegged. Currently it is pegged to SDR and paid by US$ applying the exchange rate of US$ to SDR. In the past, this issue was discussed from the viewpoint of purchasing power of US$ and SDR (refer to 2.2 of the Final Report Annex E on Development of the Suez Canal by Suez Canal Study Consortium). It developed, however, into a somewhat messy discussion. The issue on currency to be pegged for the toll can be discussed in various way on the various basis for the discussion. Questions raised by the SCA staffs are as follows;
(1) Which currency is more favorable to purchase commodities in the foreign market? (2) Which currency is more favorable in terms of getting stable revenue? For instance,
this year’s revenue decreased against that of last year in spite of the same level of transit volume. This would seem to suggest that the US$ is more favorable.
(3) Since most user’s accounting based on the US$, wouldn't the US$ be more welcomed by users?
(4) Most expenditures of SCA are in US$. Does this again indicate that the US$ is preferable to SDR.
The Study Team's answers to these questions are as follows.
(1) The issue of charging currency can be discussed from the viewpoint of a risk hedge against changes in the US$/SDR exchange rate. There are 3 interested parties: 1) users who pay tolls, 2) SCA who sets tolls, 3) Egyptian national treasury (including SCA) who gets toll revenue.
(2) For users who pay tolls, US$ pegged toll is preferable since almost all transactions of international maritime transport are now conducted in US$.
(3) For SCA who sets tolls, US$ pegged toll is preferable since toll setting is now originally made in US$.
(4) For Egyptian national treasury (including SCA) who gets toll revenue, it depends upon the purpose of use: 1) payments for purchasing goods, 2) repayments of the foreign debt.
(5) Purchasing power of the currency solely depends on the exchange rates of SDR at the time of purchase and the fixed toll. There is no difference by the currency pegged as far as it is required to pay in respective currency after exchange of US$ currency SCA owns.
(6) Actual toll is paid in US$ currency even though the toll is pegged to SDR. Then, it is natural to have different revenue in US$ by the exchange rate change of SDR to US$. Then the issue should be discussed from the view point of the purpose of revenue, in other words, for what purpose will SCA use the revenue? Basically the answer to this question is the same as the answer to the 4th question: The US$ pegged toll is more favorable because the payments are directly linked with the US$ and there is no risk arising from the variation of exchange rate. If the major purpose of getting revenue from the toll is to improve the debt service ratio of Egypt, in other words, to be used for repayment of the foreign

4 - 2
debt, then it is better to peg the toll to the currency which is more favorable from the view point of repayability of national debt. In order to judge which currency is more repayable, we can introduce an index to evaluate the sensitivity of revenue and total debt of the nation evaluated in US$ to the fluctuation of SDR value against US$. If the sensitivity of the toll revenue ($value change of toll revenue by the change of SDR value in US$ compared with the value before SDR value change) is more/less than that of total national debt ($ value change of total national debt by the change of SDR value in US$ compared with the value before SDR value change), it can be said that repayability of the toll revenue is more sensitive. In other words, it is more risky. Then the optimal solution depends on the % share of the debt in US$. To find the break point which is more risky, evaluation table is shown in the following part.
The theoretical explanations of the above mentioned answers are derived as follows. In order to discuss about the purchasing power of the currency, let’s consider following two cases:
(1) toll is pegged to SDR denoting Ts(SDR) as a toll/SCNT in SDR. (2) toll is pegged to USD denoting Td($) as a toll/SCNT in dollar.
Comparison of Purchasing Power between SDR-pegged toll and USD-pegged toll Denote TRs and TRd as toll revenue pegged to SDR and that pegged to USD respectively. TRsi=Ts・SCNTi (SDR), dTRsi=Ts・SCNTi・Rsi ($) (1) TRdi=Td・SCNTi ($) (2) As Td=Ts・Rs, then dTRsi=Td・SCNTi・(Rsi/Rs) ($) (3) Denote price index in the Euro, Yen, Pound and USD market as PIu, PIy, PIp and PId respectively. The purchasing power of toll revenue in the respective market can be expressed as follows denoting PPDn (n=d, u, y, p) as purchasing power of USD pegged toll in the respective currency market and PPSn (n=d, u, y, p) as that of SDR pegged toll; USD pegged toll TRdi, PPDdi = TRdi/PIdi = Td・SCNTi/PIdi PPDui = TRdi/Rui/PIui PPDyi = TRdi/Ryi/PIyi PPDpi = TRdi/Rpi/PIpi SDR pegged toll revenue PPSdi = dTRsi/PIdi=Td・SCNTi・(Rsi/Rs)/PIdi PPSui = dTRsi/Rui/PIui=Td・SCNTi・(Rsi/Rs)/Rui/PIui PPSyi = dTRsi/Ryi/PIyi=Td・SCNTi・(Rsi/Rs)/Ryi/PIyi PPSpi = dTRsi/Rpi/PIyi=Td・SCNTi・(Rsi/Rs)/Rpi/PIpi Therefore, relative purchasing power of SDR pegged toll to USD pegged toll in each currency market (PPSni/PPDni) is expressed as follows; In USD market; Td・SCNTi・(Rsi/Rs)/PIdi/Td・SCNTi/PIdi=Rsi/Rs

4 - 3
In Euro market; Td・SCNTi・(Rsi/Rs)/Rui/PIui/Td・SCNTi/Rui/PIui=Rsi/Rs for the other currency the results are the same as Rsi/Rs Hence, it can be said that relative purchasing power of SDR-pegged toll to USD-pegged toll is Rsi/Rs in all currency markets as far as toll is paid by USD currency. Comparison of Repayment Ability of the Debt between SDR-pegged Toll and USD-pegged Toll Let’s consider first the variation of the debt amount in USD by value change of USD to SDR. The dollar value of SDR is calculated as follows by it’s definition. SDR=(0.3519Ru+27.2Ry+0.105Rp+0.5821)$=Rs$ (1) where Ru, Ry, Rp, Rs denote $ value of each currency, ie. Euro, Yen, Pound-starling and SDR. Consider the condition that total debt amount is D$ at the $value of SDR equals to Rs and its composition of each currency in terms of $ are Su, Sy, Sp, Sd. Then, D=Su・D+Sy・D+Sp・D+Sd・D ($) (2) and Su+Sy+Sp+Sd=1 (3) Consider the case that $ value of 1SDR(Rs) increases or decreases (if γ is negative) by γ%, namely, by denoting suffix i as the state after change of the $value of SDR, Rsi = (1+γ)Rs (4) and $ value of each currency other than USD increases or decreases by same χ%. Namely, Rui = Ru(1+χ), Ryi=Ry(1+χ), Rpi=Rp(1+χ) (5) Then, Rsi = 0.3519Rui+27.2Ryi+0.105Rpi+0.5821 = (0.3519Ru+27.2Ry+0.105Rp)(1+χ)+0.5821 (6) Denote P =(0.3519Ru+27.2Ry+0.105Rp), Then from (1) and (4), Rsi = P(1+χ)+0.5821 = (P+0.5821)(1+γ) (7) Hence, χ ={(P+0.5821)/P}・γ (8) Therefore, $value of debt of each currency becomes as follows; Euro:(Su・D/Ru)・Rui=(Su・D/Ru)(1+((P+0.5821)/P)・γ)Ru =Su・D(1+((P+0.5821)/P)γ) (9) Yen : Sy・D(1+((P+0.5821)/P)γ (10) Pound: Sp・D(1+((P+0.5821)/P)γ) (11) Hence, current total amount of debt in USD (Di) is, by denoting a=(P+0.5821)/P, Di=(Su+Sy+SP)・D・(1+a・γ)+Sd・D (12)
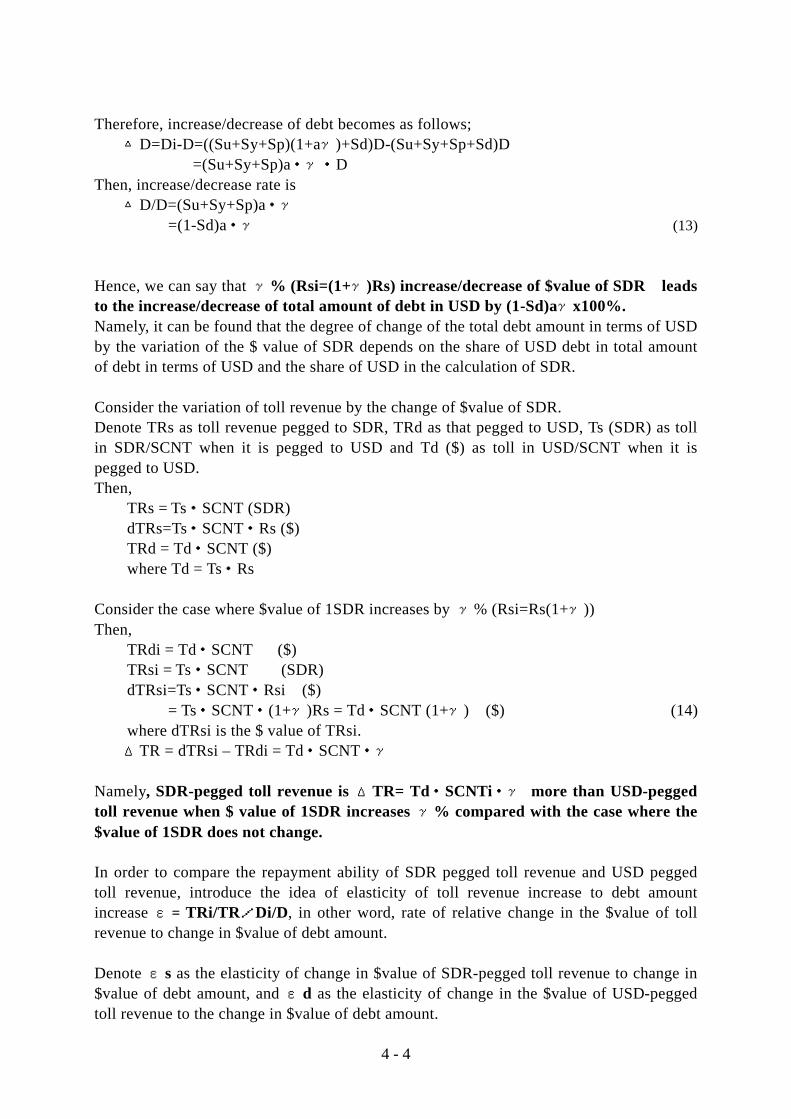
4 - 4
Therefore, increase/decrease of debt becomes as follows; △D=Di-D=((Su+Sy+Sp)(1+aγ)+Sd)D-(Su+Sy+Sp+Sd)D =(Su+Sy+Sp)a・γ・D Then, increase/decrease rate is △D/D=(Su+Sy+Sp)a・γ =(1-Sd)a・γ (13) Hence, we can say that γ% (Rsi=(1+γ)Rs) increase/decrease of $value of SDR leads to the increase/decrease of total amount of debt in USD by (1-Sd)aγx100%. Namely, it can be found that the degree of change of the total debt amount in terms of USD by the variation of the $ value of SDR depends on the share of USD debt in total amount of debt in terms of USD and the share of USD in the calculation of SDR. Consider the variation of toll revenue by the change of $value of SDR. Denote TRs as toll revenue pegged to SDR, TRd as that pegged to USD, Ts (SDR) as toll in SDR/SCNT when it is pegged to USD and Td ($) as toll in USD/SCNT when it is pegged to USD. Then, TRs = Ts・SCNT (SDR) dTRs=Ts・SCNT・Rs ($) TRd = Td・SCNT ($) where Td = Ts・Rs Consider the case where $value of 1SDR increases by γ% (Rsi=Rs(1+γ)) Then, TRdi = Td・SCNT ($) TRsi = Ts・SCNT (SDR) dTRsi=Ts・SCNT・Rsi ($) = Ts・SCNT・(1+γ)Rs = Td・SCNT (1+γ) ($) (14) where dTRsi is the $ value of TRsi. ΔTR = dTRsi – TRdi = Td・SCNT・γ Namely, SDR-pegged toll revenue is ΔTR= Td・SCNTi・γ more than USD-pegged toll revenue when $ value of 1SDR increases γ% compared with the case where the $value of 1SDR does not change. In order to compare the repayment ability of SDR pegged toll revenue and USD pegged toll revenue, introduce the idea of elasticity of toll revenue increase to debt amount increase ε= TRi/TR/Di/D, in other word, rate of relative change in the $value of toll revenue to change in $value of debt amount. Denote εs as the elasticity of change in $value of SDR-pegged toll revenue to change in $value of debt amount, and εd as the elasticity of change in the $value of USD-pegged toll revenue to the change in $value of debt amount.

4 - 5
Then, εs=dTRsi/dTRs/Di/D (15) εd=TRdi/TRd/Di/D (16) From (14) dTRsi/dTRs=Ts・SCNT(1+γ)Rs/Ts・SCNT・Rs=1+γ From (12) Di=(1-Sd)D(1+a・γ)+Sd・D =(1+a・γ(1-Sd))D Therefore, Di/D=(1+a・γ (1-Sd))D/D=1+a・γ(1-Sd) Hence, εs=dTRsi/dTRs/Di/D =(1+γ)/(1+a・γ(1-Sd)) (17) εd=TRdi/TRd/Di/D =1/(1+a・γ(1-Sd)) (18) since TRdi=TRd (indifferent with SDR) Hence, we can say that when ε>1, repayability of toll revenue is strengthened (ε<1, weakened), and when εs>εd at the same condition, i.e. at the same revel of $value of SDR and same share of debt of USD in the $value amount of total debt, then SDR-pegged toll revenue is more repayable than USD-pegged toll revenue in case of ε>1. ( in case of ε<1, situation is said to be that SDR-pegged toll revenue is less payable) Now let’s find out the condition (share of USD currency debt in the total amount of debt evaluated by USD) that SDR-pegged toll and USD-pegged toll have the same level of repayability (εs=1/εd). In other word, this situation is said to be that SDR-pegged toll and USD-pegged toll are in complete complimentary situation. This is the situation equivalent to the situation that εd・εs=1. From (17) and (18), (1+γ)/(1+a・γ(1-Sd))・(1/(1+a・γ(1-Sd))=1 Since a=(P+0.5821)/P, and P=0.3519Ru+27.2Ry+0.105Rp At the time of Oct.18th, P=0.711464 Therefore, by searching the share Sd which have almost same value indifferent to the change ofγ, we can see with the current composition of each currency in SDR, it is around 70~80 %. Table 4.1 shows the variation of εin accordance with the level of $value change of SDR and % share of USD debt in total amount of $value debt.
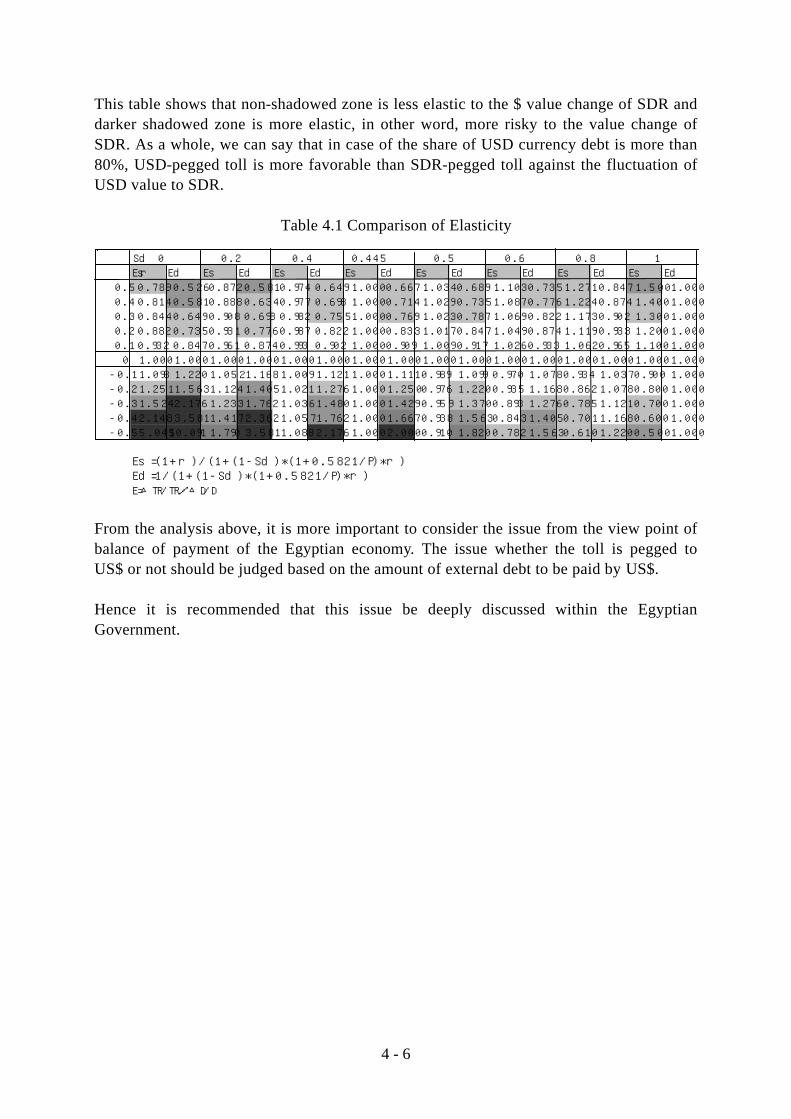
4 - 6
This table shows that non-shadowed zone is less elastic to the $ value change of SDR and darker shadowed zone is more elastic, in other word, more risky to the value change of SDR. As a whole, we can say that in case of the share of USD currency debt is more than 80%, USD-pegged toll is more favorable than SDR-pegged toll against the fluctuation of USD value to SDR.
Table 4.1 Comparison of Elasticity
From the analysis above, it is more important to consider the issue from the view point of balance of payment of the Egyptian economy. The issue whether the toll is pegged to US$ or not should be judged based on the amount of external debt to be paid by US$. Hence it is recommended that this issue be deeply discussed within the Egyptian Government.
Sd 0 0.2 0.4 0.445 0.5 0.6 0.8 1 r Es Ed Es Ed Es Ed Es Ed Es Ed Es Ed Es Ed Es Ed
0.5 0.789 0.526 0.872 0.581 0.974 0.649 1.000 0.667 1.034 0.689 1.103 0.735 1.271 0.847 1.500 1.0000.4 0.814 0.581 0.888 0.634 0.977 0.698 1.000 0.714 1.029 0.735 1.087 0.776 1.224 0.874 1.400 1.0000.3 0.844 0.649 0.908 0.698 0.982 0.755 1.000 0.769 1.023 0.787 1.069 0.822 1.173 0.902 1.300 1.0000.2 0.882 0.735 0.931 0.776 0.987 0.822 1.000 0.833 1.017 0.847 1.049 0.874 1.119 0.933 1.200 1.0000.1 0.932 0.847 0.961 0.874 0.993 0.902 1.000 0.909 1.009 0.917 1.026 0.933 1.062 0.965 1.100 1.000
0 1.000 1.000 1.000 1.000 1.000 1.000 1.000 1.000 1.000 1.000 1.000 1.000 1.000 1.000 1.000 1.000-0.1 1.098 1.220 1.052 1.168 1.009 1.121 1.000 1.111 0.989 1.099 0.970 1.078 0.934 1.037 0.900 1.000-0.2 1.251 1.563 1.124 1.405 1.021 1.276 1.000 1.250 0.976 1.220 0.935 1.168 0.862 1.078 0.800 1.000-0.3 1.524 2.176 1.233 1.762 1.036 1.480 1.000 1.429 0.959 1.370 0.893 1.276 0.785 1.121 0.700 1.000-0.4 2.148 3.581 1.417 2.362 1.057 1.762 1.000 1.667 0.938 1.563 0.843 1.405 0.701 1.168 0.600 1.000-0.5 5.045 10.091 1.790 3.581 1.088 2.176 1.000 2.000 0.910 1.820 0.782 1.563 0.610 1.220 0.500 1.000
Es=(1+r)/(1+(1-Sd)*(1+0.5821/P)*r)Ed=1/(1+(1-Sd)*(1+0.5821/P)*r)E=△TR/TR/△D/D

5 - 1
Chapter 5 Toll Structure and Rates 5.1 Basic toll level 5.1.1 Current basic toll level Current basic toll level of the Suez Canal is considered to be set, in principle, based on the savings by using the Canal taking account of peculiarities by vessel type. On the other hand, that of the Panama Canal has been set based on the cost in providing the canal services. 5.1.2 Evaluation The economic benefit of the Canal can be expressed by deducting the cost in providing the canal services from the savings by using the Canal. The savings by using the Canal, in principle, can basically be measured by the savings in shipping cost. The benefit will increase by increasing the canal transit. The benefit will be enjoyed by both users and the Egyptian Government. The users' surplus will be divided among shipping lines as a direct users of the Canal and shippers/consignees, and then indirectly contribute to the world economy. If the canal dues (tolls and other charges) were not to exceed the cost incurred by SCA in providing the canal services, all the benefit would belong to the world economy. When the canal dues are higher than the cost incurred by SCA as at present, the Egyptian Government also enjoys a part of the benefit.
Figure 5.1.1 Relation between Economic Benefit of the Canal and Toll If canal dues were to exceed savings by using the Canal, shipping lines would not use the Canal at all. In order to prevent vessels from diverting to other routes and to increase the canal transit, it is necessary to set the canal dues for each user at a level that is below the savings by using the Canal.
Savings by using the Canal (basically measured by Savings in Shipping Cost)
Canal Dues (= Tolls and Other Charges)
Users' Surplus
Cost in providing Canal Services
Egyptian Surplus
Economic Benefit of the Canal

5 - 2
It should be noted that while setting the canal dues at a level which slightly undercuts the savings may theoretically maximize toll revenue in the short-term, shipping lines may rearrange their fleet mix into a more profitable configuration based on their freight earnings and the shipping cost in the long-term. The Study Team proposed the following toll setting principle (see section (iii) C V of the Main Report).
- Maximizing the net profit to SCA under the conditions that world trade shall not be adversely affected and that trade in the region surrounding the Suez Canal shall be promoted.
In other words, tolls should be set at the maximum tolerable level without risk of vessels diverting to other routes under the conditions mentioned above. To conform with this toll setting principle, the basic toll level of the Suez Canal should not be set based on the cost in providing the canal services like the Panama Canal, but be set based on the savings by using the Canal. Accordingly, the current basic toll level of the Suez Canal can be basically judged appropriate. 5.1.3 Proposition It is advisable to set the basic toll at a level sufficiently below the savings by using the Canal to attract users. Then, the standard toll level could be expressed as Equation-1.
Ts = S x Rs = (B x Ds - Esc) x Rs (1) (Parameters)
Ts (US$/SCNT): Standard Toll Level S (US$/SCNT): Saved Cost by using the Suez Canal
Rs: Ratio of Supplier's Receipt (deducting Users' Surplus)
B (US$/SCNT/mile): Shipping Cost at sea per mile Ds (mile): Saved Distance
Esc (US$/SCNT): Excess Cost at the Suez Canal
Esc = Escmo + Escoc Escmo: Managing Cost & Fuel Cost by time loss
Escoc: Other Charges
(Note) It is necessary to take account of Excess Cost (Panama Canal toll for example) at other
route.
The ratio of the users' surplus must be high enough for users to perceive it. If users perceive an obvious cost advantage in the route via the Canal, they will be much more likely to choose that route.

5 - 3
Japanese shipping lines generally adopt the following rational in choosing a route.
- If users' surplus is less than 10%, shipping lines do not perceive an obvious cost advantage in the route via the Canal by taking account of various uncertainty (unexpected delay or fluctuations in exchange rate of US$/SDR, for example). In this case, other factors besides cost are considered in route choice.
- If users' surplus is more than 20% (at least 10%), shipping lines perceive an obvious cost advantage in the route via the Canal and are much more likely to choose it.
Accordingly, the Study Team would like to propose to set the rate of the users' surplus at 20% (Rs = 0.8). 5.1.4 Conclusion Current basic toll level of the Suez Canal is considered to be set, in principle, based on the savings by using the Canal taking account of peculiarities by vessel type. This way of toll setting is consistent with the following toll setting principle:
- Maximizing the net profit to SCA under the conditions that world trade shall not be adversely affected and that trade in the region surrounding the Suez Canal shall be promoted.
Accordingly, the current basic toll level of the Suez Canal can be basically judged appropriate. The Study Team would like to propose to set the rate of the users' surplus at 20% (Rs = 0.8) in order to make shipping lines perceive an obvious cost advantage in the route via the Canal.

5 - 4
5.2 Tariff system 5.2.1 Current tariff system The Canal tolls are calculated by vessel type and size based on the tariff announced yearly by SCA. 5.2.2 Evaluation Current basic toll level of the Suez Canal is considered to be set, in principle, based on the savings by using the Canal taking account of peculiarities by vessel type. On the other hand, that of the Panama Canal has been set based on the cost in providing the canal services. Savings by using the Canal vary mainly according to the following items of each trip;
- Vessel type and size - Saved distance by O-D pair - Shipping market conditions (Tanker's World Scale, Bulk Carrier's Charter Rate, fuel price, etc.)
Even though the above items are more or less constant, savings can still vary according to the vessel acquisition price, vessel age, speed and fuel consumption. Namely, savings by using the Canal vary by each trip. Accordingly, perfect price discrimination for each trip is needed to maximize toll revenue. However, the following procedure would have to be followed to calculate perfect price discrimination for each trip.
- The users submit the cost calculation (including detailed data) to SCA. - SCA checks the submitted cost calculation based on it's own data and
recalculates it. - The users submit certifications of calling ports and so forth to SCA.
Such a process is accompanied by the following problems;
- Complexity of cost calculation for users - Complexity of checking the submitted cost calculation and making necessary
adjustments for SCA - Delay of toll settlement timing - Absence of fixed tariff with actual figures which is convenient for shipping
lines' business management and for dealing with shippers/consignees - Lack of administrative simplicity
Current tariff system can therefore basically be judged appropriate since it shows toll rates with actual figures and generally avoids the problems associated with perfect price discrimination for each trip.

5 - 5
It should be noted that the tariff by vessel type and size at present is based on the following premises:
- Saved distance and the shipping market conditions are set at a certain or standard level.
- Savings of same vessel type and size are the same in spite of the vessel acquisition price, vessel age, speed and fuel consumption.
5.2.3 Conclusion Current tariff can basically be judged appropriate since it shows toll rates with actual figures and generally avoids the problems associated with perfect price discrimination for each trip.
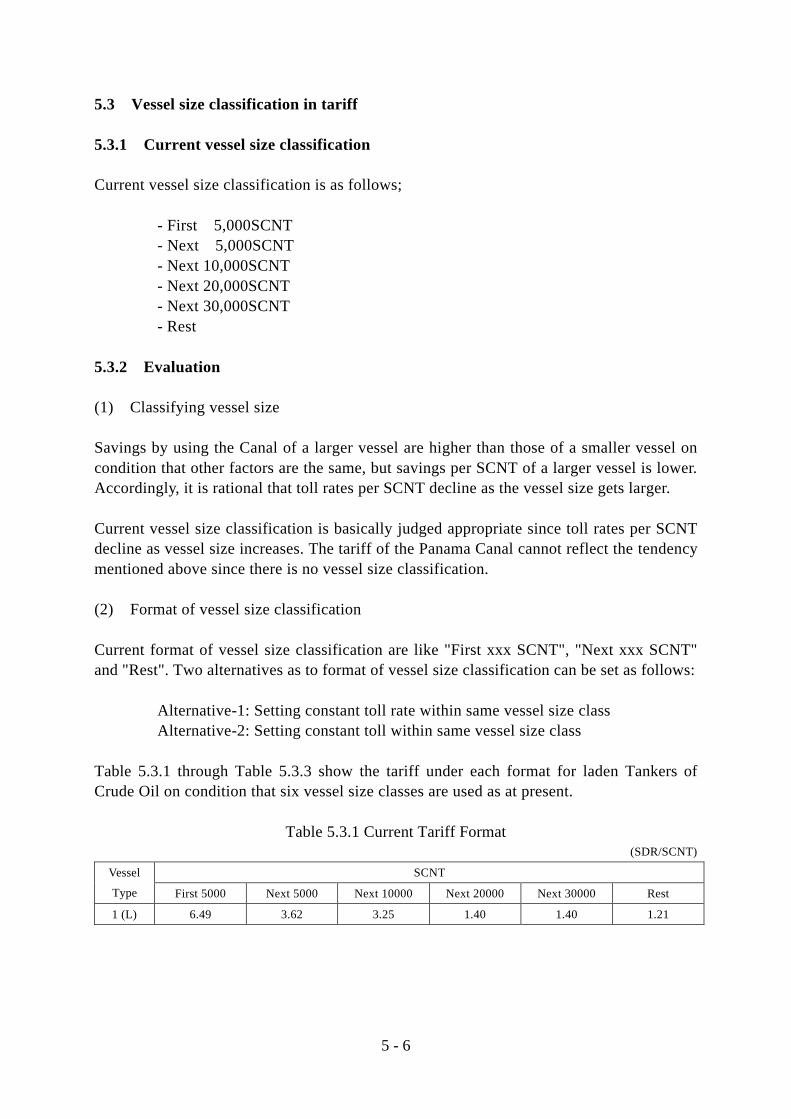
5 - 6
5.3 Vessel size classification in tariff 5.3.1 Current vessel size classification Current vessel size classification is as follows;
- First 5,000SCNT - Next 5,000SCNT - Next 10,000SCNT - Next 20,000SCNT - Next 30,000SCNT - Rest
5.3.2 Evaluation (1) Classifying vessel size Savings by using the Canal of a larger vessel are higher than those of a smaller vessel on condition that other factors are the same, but savings per SCNT of a larger vessel is lower. Accordingly, it is rational that toll rates per SCNT decline as the vessel size gets larger. Current vessel size classification is basically judged appropriate since toll rates per SCNT decline as vessel size increases. The tariff of the Panama Canal cannot reflect the tendency mentioned above since there is no vessel size classification. (2) Format of vessel size classification Current format of vessel size classification are like "First xxx SCNT", "Next xxx SCNT" and "Rest". Two alternatives as to format of vessel size classification can be set as follows:
Alternative-1: Setting constant toll rate within same vessel size class Alternative-2: Setting constant toll within same vessel size class
Table 5.3.1 through Table 5.3.3 show the tariff under each format for laden Tankers of Crude Oil on condition that six vessel size classes are used as at present.
Table 5.3.1 Current Tariff Format (SDR/SCNT)
SCNT Vessel
Type First 5000 Next 5000 Next 10000 Next 20000 Next 30000 Rest
1 (L) 6.49 3.62 3.25 1.40 1.40 1.21
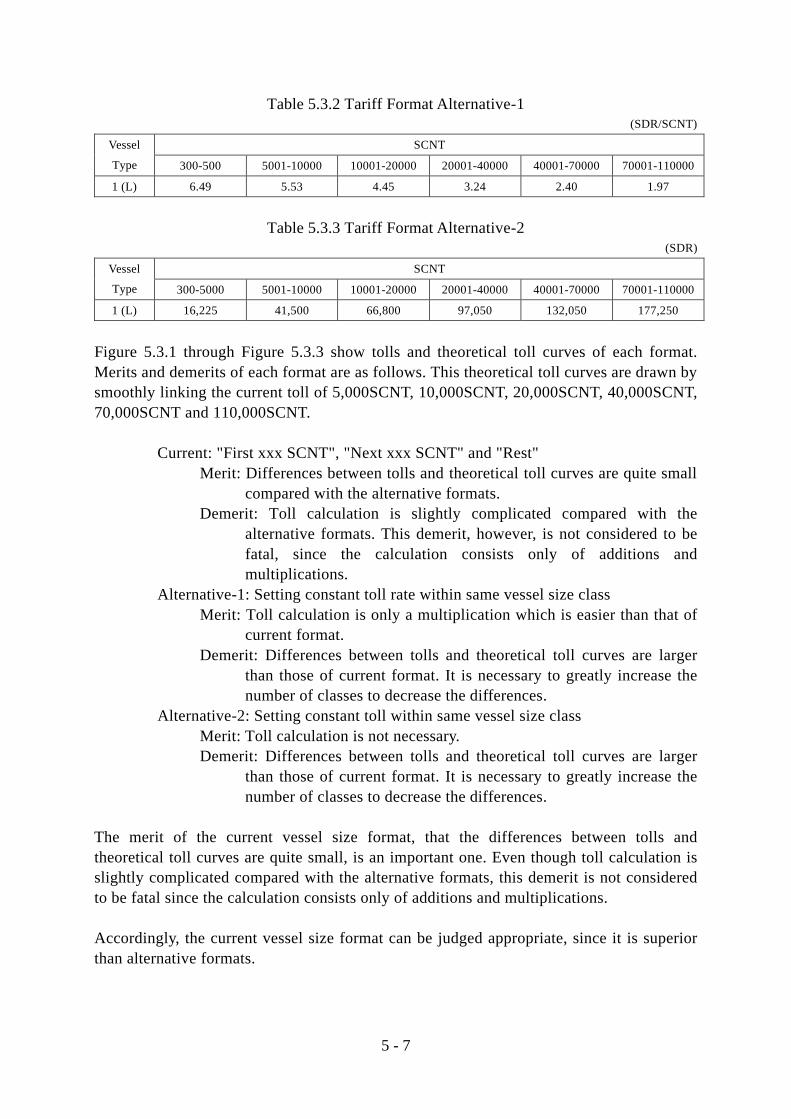
5 - 7
Table 5.3.2 Tariff Format Alternative-1 (SDR/SCNT)
SCNT Vessel
Type 300-500 5001-10000 10001-20000 20001-40000 40001-70000 70001-110000
1 (L) 6.49 5.53 4.45 3.24 2.40 1.97
Table 5.3.3 Tariff Format Alternative-2
(SDR)
SCNT Vessel
Type 300-5000 5001-10000 10001-20000 20001-40000 40001-70000 70001-110000
1 (L) 16,225 41,500 66,800 97,050 132,050 177,250
Figure 5.3.1 through Figure 5.3.3 show tolls and theoretical toll curves of each format. Merits and demerits of each format are as follows. This theoretical toll curves are drawn by smoothly linking the current toll of 5,000SCNT, 10,000SCNT, 20,000SCNT, 40,000SCNT, 70,000SCNT and 110,000SCNT.
Current: "First xxx SCNT", "Next xxx SCNT" and "Rest" Merit: Differences between tolls and theoretical toll curves are quite small
compared with the alternative formats. Demerit: Toll calculation is slightly complicated compared with the
alternative formats. This demerit, however, is not considered to be fatal, since the calculation consists only of additions and multiplications.
Alternative-1: Setting constant toll rate within same vessel size class Merit: Toll calculation is only a multiplication which is easier than that of
current format. Demerit: Differences between tolls and theoretical toll curves are larger
than those of current format. It is necessary to greatly increase the number of classes to decrease the differences.
Alternative-2: Setting constant toll within same vessel size class Merit: Toll calculation is not necessary. Demerit: Differences between tolls and theoretical toll curves are larger
than those of current format. It is necessary to greatly increase the number of classes to decrease the differences.
The merit of the current vessel size format, that the differences between tolls and theoretical toll curves are quite small, is an important one. Even though toll calculation is slightly complicated compared with the alternative formats, this demerit is not considered to be fatal since the calculation consists only of additions and multiplications. Accordingly, the current vessel size format can be judged appropriate, since it is superior than alternative formats.
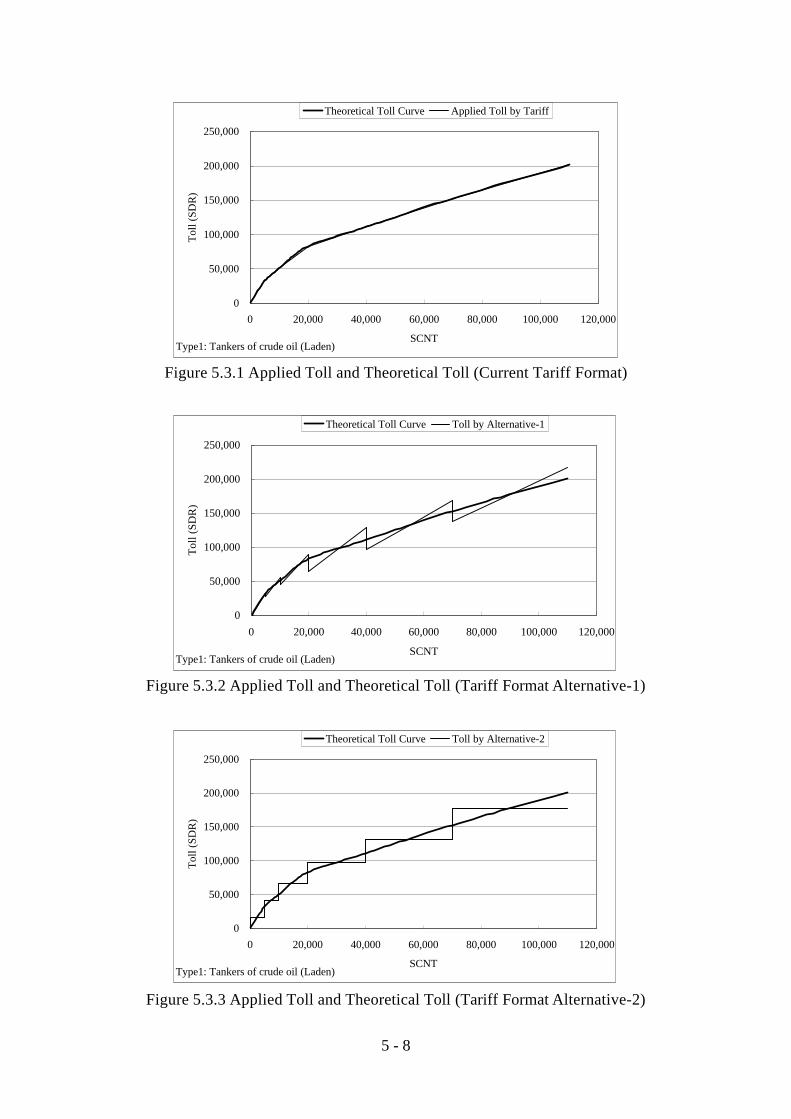
5 - 8
Figure 5.3.1 Applied Toll and Theoretical Toll (Current Tariff Format)
Figure 5.3.2 Applied Toll and Theoretical Toll (Tariff Format Alternative-1)
Figure 5.3.3 Applied Toll and Theoretical Toll (Tariff Format Alternative-2)
Type1: Tankers of crude oil (Laden)
0
50,000
100,000
150,000
200,000
250,000
0 20,000 40,000 60,000 80,000 100,000 120,000
SCNT
Tol
l (SD
R)
Theoretical Toll Curve Applied Toll by Tariff
Type1: Tankers of crude oil (Laden)
0
50,000
100,000
150,000
200,000
250,000
0 20,000 40,000 60,000 80,000 100,000 120,000
SCNT
Tol
l (SD
R)
Theoretical Toll Curve Toll by Alternative-1
Type1: Tankers of crude oil (Laden)
0
50,000
100,000
150,000
200,000
250,000
0 20,000 40,000 60,000 80,000 100,000 120,000
SCNT
Tol
l (SD
R)
Theoretical Toll Curve Toll by Alternative-2

5 - 9
(3) Interval of vessel size classification Figure 5.3.4 through Figure 5.3.11 show tolls and theoretical toll curves by vessel type. It is observed that the bend of the theoretical curve decreases as the vessel size gets larger. Accordingly, it is rational to set the width of smaller vessel classes closer in order to decrease the differences between tolls and theoretical toll curves. Current interval of vessel size classification can be judged appropriate since it has the rationality mentioned above. On the other hand, current interval of vessel size classification has no difference by vessel type. A alternative is setting interval of vessel size classification by vessel type. Table 5.3.4 shows vessel size distribution transiting the Canal by vessel type.
Table 5.3.4 Vessel Size Distribution Transiting the Canal Vessel Type Vessel Size Distribution Tankers of Crude Oil over 40,000SCNT up to 220,000SCNT Tankers of Petroleum Products up to 70,000SCNT Chemical Carriers up to 30,000SCNT LNG Carriers over 40,000SCNT up to 110,000SCNT LPG Carriers up to 50,000SCNT Dry Bulk Carriers up to 110,000SCNT Container Ships up to 90,000SCNT Vehicle Carriers up to 70,000SCNT General Cargo Ships up to 30,000SCNT Other Vessels up to 90,000SCNT
Note) Refer to Table A.2.2 of Appendix A.
However, even though current interval of vessel size classification has no difference by vessel type, differences between tolls and theoretical toll curves are quite small. Moreover, current width of vessel size classification is superior from the point of view of simplicity, which is one of the toll setting principles. Accordingly, current width of vessel size classification can be judged appropriate. It should be noted, however, that differences between tolls and theoretical toll curves could arise in the "Rest" class, where vessel size ranges widely from 70,000SCNT to over 200,000SCNT.

5 - 10
Figure 5.3.4 Applied Toll and Theoretical Toll (Type1)
Figure 5.3.5 Applied Toll and Theoretical Toll (Type2)
Figure 5.3.6 Applied Toll and Theoretical Toll (Type3)
Type3: Dry bulk carriers, etc.
0
50,000
100,000
150,000
200,000
0 20,000 40,000 60,000 80,000 100,000 120,000
SCNT
Tol
l (SD
R)
Theoretical Toll Curve Applied Toll by Tariff
Type2: Tankers of petroleum products, etc.
0
50,000
100,000
150,000
200,000
250,000
300,000
0 20,000 40,000 60,000 80,000 100,000 120,000
SCNT
Tol
l (SD
R)
Theoretical Toll Curve Applied Toll by Tariff
Type1: Tankers of crude oil, etc.
0
50,000
100,000
150,000
200,000
250,000
0 20,000 40,000 60,000 80,000 100,000 120,000
SCNT
Tol
l (SD
R)
Theoretical Toll Curve Applied Toll by Tariff

5 - 11
Figure 5.3.7 Applied Toll and Theoretical Toll (Type4)
Figure 5.3.8 Applied Toll and Theoretical Toll (Type5)
Figure 5.3.9 Applied Toll and Theoretical Toll (Type6)
Type4: Chemical carriers, etc.
0
50,000
100,000
150,000
200,000
250,000
300,000
350,000
0 20,000 40,000 60,000 80,000 100,000 120,000
SCNT
Tol
l (SD
R)
Theoretical Toll Curve Applied Toll by Tariff
Type5: LPG carriers
0
50,000
100,000
150,000
200,000
250,000
300,000
350,000
0 20,000 40,000 60,000 80,000 100,000 120,000
SCNT
Tol
l (SD
R)
Theoretical Toll Curve Applied Toll by Tariff
Type6: Container ships & Vehicle carriers
0
50,000
100,000
150,000
200,000
250,000
300,000
0 20,000 40,000 60,000 80,000 100,000 120,000
SCNT
Tol
l (SD
R)
Theoretical Toll Curve Applied Toll by Tariff
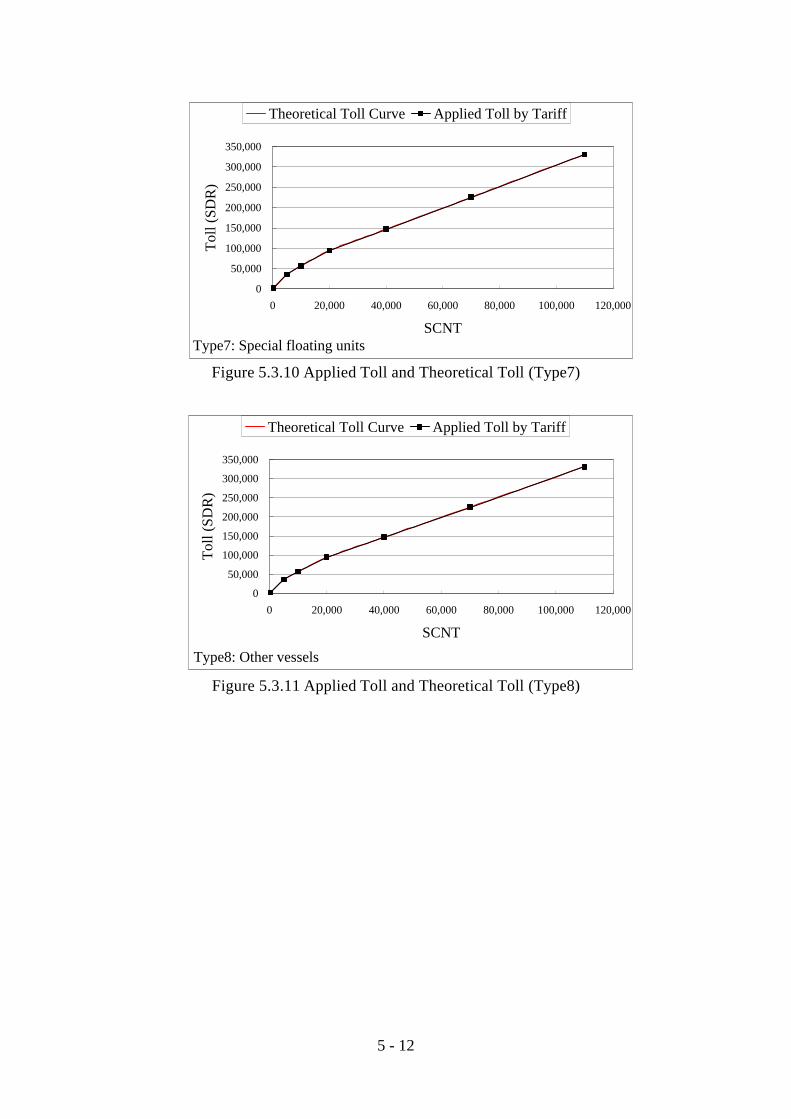
5 - 12
Figure 5.3.10 Applied Toll and Theoretical Toll (Type7)
Figure 5.3.11 Applied Toll and Theoretical Toll (Type8)
Type7: Special floating units
0
50,000
100,000
150,000
200,000
250,000
300,000
350,000
0 20,000 40,000 60,000 80,000 100,000 120,000
SCNT
Tol
l (SD
R)
Theoretical Toll Curve Applied Toll by Tariff
Type8: Other vessels
0
50,000
100,000
150,000
200,000
250,000
300,000
350,000
0 20,000 40,000 60,000 80,000 100,000 120,000
SCNT
Tol
l (SD
R)
Theoretical Toll Curve Applied Toll by Tariff

5 - 13
5.3.3 Proposition The Study Team would like to propose the following additional two classes to eliminate the possibility of differences arising between tolls and theoretical toll curves in "Rest" class, where vessel size ranges widely from 70,000SCNT to over 200,000SCNT.
- First 5,000SCNT - Next 5,000SCNT - Next 10,000SCNT - Next 20,000SCNT - Next 30,000SCNT - Next 40,000SCNT additional - Next 50,000SCNT additional - Rest
Merits and demerits of this proposition are as follows;
Merit: No fear of differences between tolls and theoretical toll curves in the "Rest" class which has wide range from 70,000SCNT to over 200,000SCNT.
Demerit: Number of steps in toll calculation increases. This demerit, however, is not considered to be fatal since the calculation consists only of additions and multiplications.
5.3.4 Conclusion Current vessel size classification can be basically judged appropriate from the view point of format and interval of vessel size classification. The Study Team would like to propose the following additional two classes to eliminate the possibility of differences arising between tolls and theoretical toll curves in "Rest" class, where vessel size ranges widely from 70,000SCNT to over 200,000SCNT.
- First 5,000SCNT - Next 5,000SCNT - Next 10,000SCNT - Next 20,000SCNT - Next 30,000SCNT - Next 40,000SCNT additional - Next 50,000SCNT additional - Rest

5 - 14
5.4 Vessel type classification in tariff 5.4.1 Current vessel type classification Current vessel type classification are as follows;
- Tankers of Crude Oil, etc. - Tankers of Petroleum Products, etc. - Dry Bulk Carriers, etc. - Chemical Carriers, LNG Carriers, etc. - LPG Carriers - Container Ships, Vehicle Carriers - Special Floating Units - Other Vessels
5.4.2 Evaluation (1) Classifying vessel type Savings by using the Canal differ according to the type of vessel, even though other factors are the same. Accordingly, it is rational to set toll rates by vessel type. Current vessel type classification is basically judged appropriate, since toll rates are set by vessel type. The tariff of the Panama Canal cannot reflect the tendency mentioned above since there is no vessel type classification. (2) Classified vessel types By comparing current classified vessel types and shipping cost per unit by vessel type (see Table 5.4.1 and Figure 5.4.1), the following points are observed;
- Chemical Carriers and LNG Carriers are in the same class in spite of the fact that there is a significant difference in shipping cost per unit between these types.
- Container Ships and Vehicle Carriers are in the same class in spite of the fact that there is a significant difference in shipping cost per unit between these types.
The following minor points are also observed.
- Tankers of Crude Oil and Tankers of Petroleum Products are in a different class although the shipping cost per unit of those types is similar.
- Chemical Carriers and LPG Carriers are in a different class although the shipping cost per unit of those types is similar.
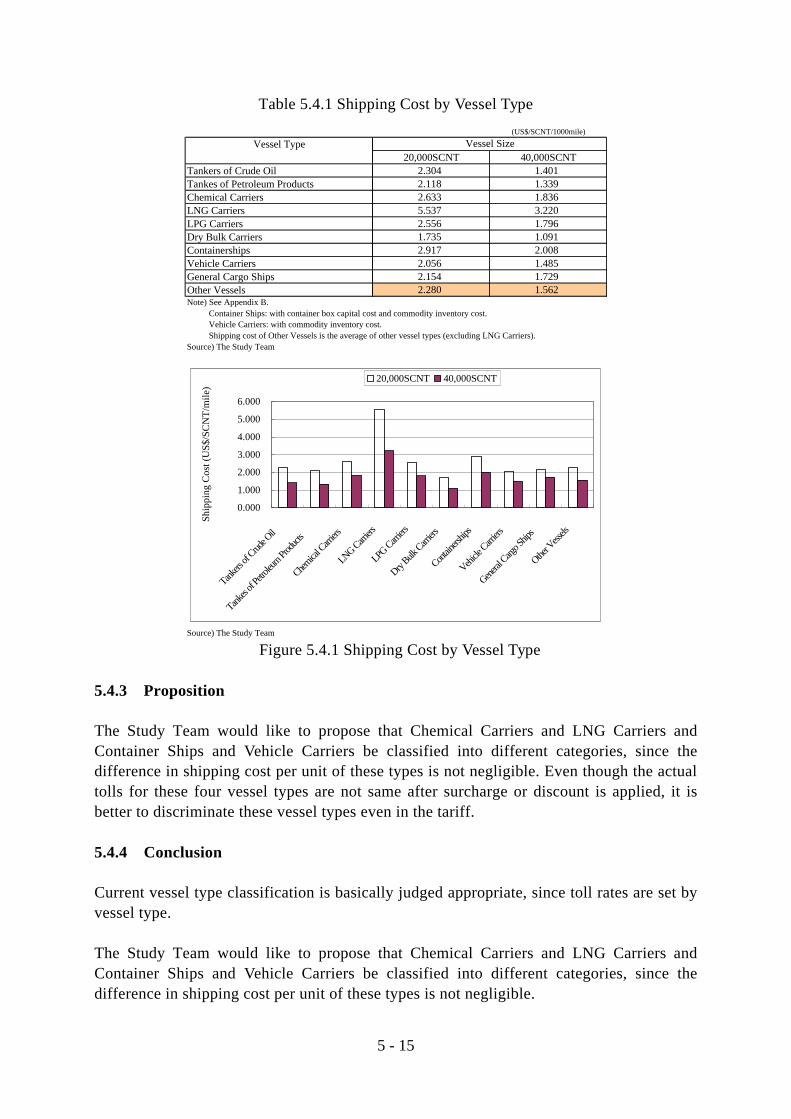
5 - 15
Table 5.4.1 Shipping Cost by Vessel Type
Figure 5.4.1 Shipping Cost by Vessel Type 5.4.3 Proposition The Study Team would like to propose that Chemical Carriers and LNG Carriers and Container Ships and Vehicle Carriers be classified into different categories, since the difference in shipping cost per unit of these types is not negligible. Even though the actual tolls for these four vessel types are not same after surcharge or discount is applied, it is better to discriminate these vessel types even in the tariff. 5.4.4 Conclusion Current vessel type classification is basically judged appropriate, since toll rates are set by vessel type. The Study Team would like to propose that Chemical Carriers and LNG Carriers and Container Ships and Vehicle Carriers be classified into different categories, since the difference in shipping cost per unit of these types is not negligible.
(US$/SCNT/1000mile)
Vessel Type20,000SCNT 40,000SCNT
Tankers of Crude Oil 2.304 1.401Tankes of Petroleum Products 2.118 1.339Chemical Carriers 2.633 1.836LNG Carriers 5.537 3.220LPG Carriers 2.556 1.796Dry Bulk Carriers 1.735 1.091Containerships 2.917 2.008Vehicle Carriers 2.056 1.485General Cargo Ships 2.154 1.729Other Vessels 2.280 1.562
Source) The Study Team
Note) See Appendix B. Container Ships: with container box capital cost and commodity inventory cost. Vehicle Carriers: with commodity inventory cost. Shipping cost of Other Vessels is the average of other vessel types (excluding LNG Carriers).Source) The Study Team
Vessel Size
0.000
1.000
2.000
3.000
4.000
5.000
6.000
Tankers
of Crud
e Oil
Tankes
of Pe
troleu
m Prod
ucts
Chemica
l Carr
iers
LNG Carriers
LPG Carr
iers
Dry Bulk
Carrier
s
Contain
ership
s
Vehicle
Carrier
s
General
Cargo S
hips
Other V
essels
Ship
ping
Cos
t (U
S$/S
CN
T/m
ile)
20,000SCNT 40,000SCNT

5 - 16
5.5 Classification by laden/ballast in tariff 5.5.1 Current classification by laden/ballast In the current tariff, toll rates for vessels in ballast are set at 85% of laden vessels in principle. 5.5.2 Evaluation The speed of a vessel in ballast is said to be 10% to 20% greater than that of a laden vessel, since the draught of a vessel in ballast is shallower than that of a laden vessel and water resistance decreases significantly. Managing cost of a vessel in ballast decreases proportionately with the increased velocity, since the voyage period decreases. Accordingly, it is appropriate to set the toll rate for a vessel in ballast lower proportionately with the increased velocity than that of a laden vessel. Current classification by laden/ballast can be judged appropriate since the toll rates for vessels in ballast are set at 85% of laden vessels which is lower proportionately with the increased velocity than that of a laden vessel. On the other hand, in case that there is enough time to spare until next operation after transiting the Canal, savings perceived by shipping lines are only in fuel cost (variable cost). Savings in managing cost (basically fixed cost) are not perceived. Full savings in managing cost are perceived only when shipping lines can fully utilize days saved by using the Canal for their next operation. It is considered that most vessels in ballast using the route via the Cape have enough time to spare until next operation after transiting the Canal. On the other hand, it is considered that there is no time to spare until next operation after transiting the Canal for most vessels in ballast using the Canal. 5.5.3 Proposition In case that there is enough time to spare until next operation after transiting the Canal, savings perceived by shipping lines are only in fuel cost (variable cost). Savings in managing cost (basically fixed cost) are not perceived. Accordingly, as to applying the Long Haul Rebate for vessels in ballast, the Study Team would like to propose to set the rebate rates based on savings only in fuel cost in case that there is enough time to spare until next operation after transiting the Canal, while on savings in shipping cost including managing cost in case that there is no time to spare until next operation after transiting the Canal. SCA can verify this by requiring users to submit certificates proving that there was enough time to spare until next operation after transiting the Canal, in case of setting the rebate rates based on savings only in fuel cost.

5 - 17
5.5.4 Conclusion Current classification by laden/ballast can be judged appropriate since the toll rates for vessels in ballast are set at 85% of laden vessels which is lower proportionately with the increased velocity than that of a laden vessel. As to applying the Long Haul Rebate for vessels in ballast, the Study Team would like to propose to set the rebate rates based on savings only in fuel cost in case that there is enough time to spare until next operation after transiting the Canal, while on savings in shipping cost including managing cost in case that there is no time to spare until next operation after transiting the Canal. SCA can verify this by requiring users to submit certificates proving that there was enough time to spare until next operation after transiting the Canal, in case of setting the rebate rates based on savings only in fuel cost.

5 - 18
5.6 Standard saved distance and Long Haul Rebate 5.6.1 Current standard saved distance and Long Haul Rebate SCA seems to set the tariff by taking account of standard O-D and its saved distance by vessel type, even though SCA does not directly use the term "standard saved distance". Standard saved distances are set at around 4,700 miles for Tankers of Crude Oil and at around 3,500 miles for Dry Bulk Carriers. Standard saved distances for other vessel types are unknown. On the other hand, SCA provides the Long Haul Rebate in order to prevent vessels, whose canal dues exceed savings by using the Canal, from diverting to other routes such as the Cape of Good Hope. The Long Haul Rebate rates are set by each trip after examining applications of users. In case of Tankers of Crude Oil, standard O-D for tariff is set at the Arabian Gulf - NW. Europe, where the saved distance is around 4,700 miles, while SCA provides the reduction for VLCC in ballast coming from America to Arabian Gulf where the saved distance is less than standard one. 5.6.2 Evaluation Saved distances by O-D pairs are key variables in deciding savings by using the Canal, and basic toll level is nearly in proportion to saved distance (see Equation-1 of the section 5.1.3). It is theoretically possible to classify the tariff by saved distance. Classifying the tariff by saved distance, however, is almost equivalent to setting the toll for each trip which may be accompanied by problems as mentioned in section 5.2.2. To avoid those problems, setting standard saved distance is thought to be effective. However, in case of trips where the saved distance is less than standard one, the vessels may divert to other routes because the canal dues including toll exceed savings by using the Canal. To prevent vessels from diverting to other routes, a complementary discount system is needed. Current tariff can basically be judged appropriate since the tariff is set based on the idea of standard saved distance and complemented by discount systems such as Long Haul Rebate for trips where saved distance are less than standard one. Table5.6.1 and Table5.6.2 show potential cargo O-D by vessel type. Table5.6.3, Table5.6.4, Figure5.6.1 through Figure5.6.9 show "relative toll revenue" by vessel type estimated based on potential cargo O-D by vessel type. Relative toll revenue is an index introduced by the Study Team to observe relative changes

5 - 19
of toll revenue by changes in standard saved distance. Relative toll revenue becomes 100% if standard saved distance is set at 8,767 miles and no vessels divert to the other routes, namely, all vessels transit the Canal. By substituting standard saved distance at maximum relative toll revenue for Ds of Equation-1 of section 5.1.3, toll rate realizing maximum toll revenue in case that there is no discount system can be obtained. Peaks (*: remarkable peak) of relative toll revenue by vessel type are as follows. It should be noted that Container Ships, General Cargo Ships and Vehicle Carriers have peculiarity of calling plural ports.
Tankers of Crude Oil * 2,600 miles (Arabian Gulf - N. America) * 4,500 - 4,700 miles (Arabian Gulf - NW. Europe & N. Africa, etc) * 5,900 miles (Arabian Gulf - W. Mediterranean)
Tankers of Petroleum Products 3,200 - 3,800 miles 4,600 - 4,700 miles (Arabian Gulf - NW. Europe, etc) 6,500 - 6,700 miles
Chemical Carriers 3,200 - 3,500 miles 4,500 - 4,700 miles 2,000 - 2,300 miles
LNG/LPG Carriers * 5,900 miles (Arabian Gulf - W. Mediterranean) * 8,000 miles (Arabian Gulf - E. Mediterranean) 2,000 miles (Arabian Gulf - CS. America)
Dry Bulk Carriers * 2,300 miles (Oceania - NW. Europe, etc.) * 3,500 miles (SE. Asia - NW. Europe, etc.) 4,600 miles (SE. Asia - W. Mediterranean, etc.)
Container Ships * 3,300 miles (E. Asia - NW. Europe) 4,500 - 4,700 miles 5,600 miles (E. Asia - W. Mediterranean)
Vehicle Carriers * 3,300 miles (E. Asia - NW Europe) * 2,100 miles (E. Asia - N. America) 4,500 - 4,700 miles
General Cargo Ships 3,200 - 3,800 miles 4,500 - 4,700 miles

1998 (MT)SavedDistance
Total
(mile) CrudeOil
OilProducts
LNGLPG
Chemicals OthersTankers
BulkCarriers
CombinedCarriers
GeneralCargoShips
ContainerShips
LASH Ro/Ro CarCarriers
Others
0E. Africa Durban W. Med. Barcelona 244 0 0 0 0 0 18,834 0 0 0 0 0 0 0 18,834SE. Asia Singapore N. America New Orleans 470 0 0 0 0 0 12,764 0 0 0 0 0 0 0 12,764E. Asia Pusan CS. America Aruba 566 3,053 318 0 867 0 0 9 3 0 0 0 0 4 4,255E. Africa Durban N. Africa Annaba 676 0 0 0 0 0 26 0 0 0 0 0 0 0 26SE. Asia Singapore CS. America Aruba 712 865 1,536 28 1,111 0 0 62 3 0 0 0 0 6 3,612
713Oceania Melbourne N. Africa Casablanca 1,061 0 0 0 0 0 0 0 43 40 0 0 0 1 84Oceania Weipa N. America New York 1,082 0 0 0 0 0 0 0 0 0 0 0 0 0 0Oceania Melbourne NW. Europe Rotterdam 1,137 0 0 0 0 0 0 1 56 1,347 2 12 124 4 1,546E. Africa Mombasa N. America New York 1,170 0 0 0 3 0 0 0 4 149 0 1 2 0 160
1,171S. Asia Karachi CS. America Aruba 1,927 0 0 0 32 0 0 0 0 0 0 0 0 0 33A. Gulf Bandar Abbas CS. America Aruba 1,978 3,722 1,291 1,456 883 0 0 85 3 0 0 0 0 5 7,444E. Asia Pusan N. America New York 2,101 46 871 85 2,182 22 0 52 51 3,511 4 26 915 33 7,799E. Asia Pusan NW. Europe Rotterdam 2,123 0 0 0 0 0 2,803 0 0 0 0 0 0 0 2,803Oceania Weipa N. Africa Casablanca 2,226 0 0 11 18 0 0 1 55 0 1 1 0 2 89SE. Asia Singapore N. America New York 2,247 447 1,386 21 2,944 3 0 182 919 5,949 15 45 21 61 11,991Oceania Weipa NW. Europe Rotterdam 2,302 42 19 2 208 1 31,490 105 768 1,923 4 9 1 3 34,575E. Africa Mombasa N. Africa Casablanca 2,314 0 0 0 4 0 0 0 20 29 1 1 1 1 57E. Africa Durban E. Med. Istanbul 2,331 0 0 0 0 0 19,858 0 0 0 0 0 0 0 19,858E. Africa Mombasa NW. Europe Rotterdam 2,390 0 51 0 44 1 0 3 108 118 4 4 16 6 355S. Asia Colombo N. America New York 2,531 0 0 0 0 0 0 44 187 643 1 7 3 10 896S. Asia Karachi N. America New Orleans 2,603 0 0 0 0 0 3,310 0 0 0 0 0 0 0 3,310A. Gulf Bandar Abbas N. America New Orleans 2,654 49,941 0 0 0 0 2,730 0 0 0 0 0 0 0 52,671
2,655E. Asia Pusan N. Africa Casablanca 3,245 0 445 42 92 4 0 25 267 5,404 12 35 83 12 6,421E. Asia Pusan NW. Europe Rotterdam 3,321 1,356 115 0 991 42 0 105 1,180 13,337 34 105 1,599 66 18,932SE. Asia Singapore N. Africa Casablanca 3,391 130 20 11 312 5 0 11 526 1,816 19 20 3 28 2,901Oceania Melbourne W. Med. Marsaxlokk 3,400 0 0 0 0 0 0 0 9 220 0 2 13 0 244Oceania Weipa W. Med. Barcelona 3,432 0 0 11 6 0 8,536 28 195 216 1 1 0 1 8,995S. Asia Karachi N. America New York 3,462 0 379 0 335 1 0 0 160 798 4 6 0 5 1,689SE. Asia Singapore NW. Europe Rotterdam 3,467 1,995 644 1 1,897 20 16,531 185 2,528 26,132 88 181 174 127 50,503A. Gulf Dubai N. America New York 3,513 0 0 0 0 0 0 46 678 1,123 13 30 118 41 2,048E. Africa Mombasa W. Med. Barcelona 3,520 0 30 0 6 1 0 29 148 628 2 4 0 2 850S. Asia Colombo N. Africa Casablanca 3,675 0 0 0 0 0 0 3 56 134 1 2 0 41 236S. Asia Colombo NW. Europe Rotterdam 3,751 0 0 0 0 0 0 14 513 1,598 10 24 6 31 2,197A. Gulf Bandar Abbas N. America New York 3,783 2,628 2,220 249 1,985 7 0 225 150 480 2 4 0 17 7,969E.Asia Pusan W.Med Barcelona 3,848 0 0 0 0 0 695 0 0 0 0 0 0 0 695Oceania Weipa N.Africa Annaba 3,864 0 0 0 0 0 1,135 0 0 0 0 0 0 0 1,135E.Asia Pusan N.Africa Annaba 4,280 0 0 0 0 0 610 0 0 0 0 0 0 0 610E.Asia Pusan W.Med Barcelona 4,451 0 27 1 279 7 0 1 198 1,938 8 13 136 11 2,620SE.Asia Singapore W.Med Barcelona 4,597 0 475 2 1,176 9 10,278 43 731 1,193 25 20 3 34 13,989S.Asia Karachi N.Africa Casablanca 4,606 0 3 0 2,517 1 0 0 95 130 3 3 2 4 2,758E.Africa Monbasa W.Med Marsaxlokk 4,653 0 0 0 0 0 0 3 31 624 1 5 1 2 667A.Gulf Bandar Abbas N.Africa Casablanca 4,657 4,798 13 45 248 8 0 16 783 326 24 23 1 46 6,330S.Asia Karachi NW.Europe Rotterdam 4,682 0 38 1 289 6 3,285 9 223 2,330 5 12 8 5 6,212A.Gulf Bandar Abbas NW.Europe Rotterdam 4,733 16,100 2,008 158 1,746 20 4,977 208 1,956 4,081 39 82 194 123 31,692
4,734SE.Asia Singapore N.Africa Annaba 5,029 0 0 0 0 0 1,736 0 0 0 0 0 0 0 1,736Oceania Melbourne E.Med Haifa 5,171 0 0 0 0 0 0 0 43 621 1 4 3 2 674Oceania Weipa E.Med Istanbul 5,519 0 0 18 83 0 10,216 26 224 757 2 4 0 2 11,332E.Asia Pusan W.Med Marsaxlokk 5,584 0 0 0 0 0 0 5 305 13,321 17 87 18 11 13,765E.Africa Mombasa E.Med Istanbul 5,607 0 16 4 10 1 0 41 241 191 2 2 0 2 510SE.Asia Singapore W.Med Marsaxlokk 5,730 0 0 0 0 0 0 9 271 302 5 10 5 27 628S.Asia Karachi W.Med Barcelona 5,812 0 71 0 328 5 1,279 3 279 110 10 7 2 13 2,106A.Gulf Bandar Abbas W.Med Barcelona 5,863 12,298 262 1,287 442 15 1,784 38 252 234 10 7 0 14 16,644E.Asia Pusan E.Med Istanbul 5,935 0 0 0 0 0 4,417 0 0 0 0 0 0 0 4,417S.Asia Colombo W.Med Marsaxlokk 6,014 0 0 0 0 0 0 9 229 90 4 7 5 18 363S.Asia Karachi N.Africa Annaba 6,244 0 0 0 0 0 511 0 0 0 0 0 0 0 511A.Gulf Bandar Abbas N.Africa Annaba 6,295 0 0 0 0 0 964 0 0 0 0 0 0 0 964E.Africa Monbasa E.Med Haifa 6,424 0 0 0 0 0 0 3 66 403 1 4 5 3 486E.Asia Pusan E.Med Istanbul 6,538 1,085 709 1 385 20 0 9 253 7,779 10 39 653 6 10,948SE.Asia Singapore E.Med Istanbul 6,684 920 3,208 15 2,071 6 15,285 130 549 5,408 16 31 24 26 27,689A.Gulf Dubai W.Med Marsaxlokk 6,996 0 0 0 0 0 0 27 1,086 801 22 37 15 70 2,057E.Asia Pusan E.Med Haifa 7,355 0 0 0 0 0 0 130 465 3,111 8 29 15 22 3,781SE.Asia Singapore E.Med Haifa 7,501 0 0 0 0 0 0 136 1,056 4,941 9 45 8 30 6,225S.Asia Colombo E.Med Haifa 7,785 0 0 0 0 0 0 10 481 858 7 16 9 23 1,404S.Asia Karachi E.Med Istanbul 7,899 0 19 3 173 5 4,735 8 239 1,186 5 8 6 6 6,392A.Gulf Bandar Abbas E.Med Istanbul 7,950 10,607 221 1,406 479 15 3,853 35 273 681 9 9 2 15 17,604
7,951A.Gulf Dubai E.Med Haifa 8,767 0 0 0 0 0 0 29 1,255 2,681 24 51 12 71 4,124
Total 110,033 16,398 4,858 24,146 223 182,645 2,143 20,213 119,693 485 1,072 4,207 1,095 487,210Source) The Study Team
5 - 20
O-D Pair Vessel Type
Table 5.6.1 Potential Cargo O-D by Vessel Type (1998)
Zone
Port
Zone
Port

2020 (MT)SavedDistance
Total
(mile) CrudeOil
OilProducts
LNGLPG
Chemicals OthersTankers
BulkCarriers
CombinedCarriers
GeneralCargoShips
ContainerShips
LASH Ro/Ro CarCarriers
Others
0E.Africa Durban W.Med Barcelona 244 0 0 0 0 19,066 0 0 0 0 19,066SE.Asia Singapore N.Amrica New Orleans 470 0 0 0 0 26,738 0 0 0 0 26,738E.Asia Pusan CS.America Aruba 566 7,899 629 0 3,200 0 0 0 0 0 11,729E.Africa Durban N.Africa Annaba 676 0 0 0 0 53 0 0 0 0 53SE.Asia Singapore CS.America Aruba 712 2,395 7,086 31 7,438 0 0 0 0 0 16,950
713Oceania Melbourne N.Africa Casablanca 1,061 0 0 0 0 0 0 94 0 0 94Oceania Weipa N.Amrica New York 1,082 0 0 0 0 0 0 0 0 0 0Oceania Melbourne NW.Europe Rotterdam 1,137 0 0 0 0 0 0 8,527 1 287 8,815E.Africa Mombasa N.Amrica New York 1,170 0 0 0 4 0 0 551 0 3 558
1,171S.Asia Karachi CS.America Aruba 1,927 0 0 0 196 0 0 0 0 0 197A.Gulf Bandar Abbas CS.America Aruba 1,978 6,531 1,615 1,266 1,221 0 0 0 0 0 10,633E.Asia Pusan N.Amrica New York 2,101 23 786 59 4,981 0 0 7,555 0 1,855 15,260E.Asia Pusan NW.Europe Rotterdam 2,123 0 0 0 0 5,798 0 0 0 0 5,798Oceania Weipa N.Africa Casablanca 2,226 0 0 4 49 0 0 0 0 0 53SE.Asia Singapore N.Amrica New York 2,247 2,224 3,728 30 11,185 0 0 29,199 0 135 46,503Oceania Weipa NW.Europe Rotterdam 2,302 52 12 1 377 41,923 0 0 0 0 42,364E.Africa Mombasa N.Africa Casablanca 2,314 0 0 0 7 0 32 88 4 1 132E.Africa Durban E.Med Istanbul 2,331 0 0 0 0 20,419 0 0 0 0 20,419E.Africa Mombasa NW.Europe Rotterdam 2,390 0 36 0 66 0 296 419 4 18 840S.Asia Colombo N.Amrica New York 2,531 0 0 0 0 0 0 7,363 3 16 7,383S.Asia Karachi N.Amrica New Orleans 2,603 0 0 0 0 7,478 0 0 0 0 7,478A.Gulf Bandar Abbas N.Amrica New Orleans 2,654 65,990 0 0 0 5,208 0 0 0 0 71,198
2,655E.Asia Pusan N.Africa Casablanca 3,245 0 491 47 393 0 0 12,355 8 120 13,412E.Asia Pusan NW.Europe Rotterdam 3,321 615 75 0 1,692 0 0 27,116 10 2,700 32,207SE.Asia Singapore N.Africa Casablanca 3,391 220 61 10 1,370 0 0 9,759 7 9 11,436Oceania Melbourne W.Med Marsaxlokk 3,400 0 0 0 0 0 0 946 0 49 996Oceania Weipa W.Med Barcelona 3,432 0 0 4 17 10,912 0 0 0 0 10,933S.Asia Karachi N.Amrica New York 3,462 0 662 0 710 0 0 0 0 0 1,373SE.Asia Singapore NW.Europe Rotterdam 3,467 1,966 698 1 6,793 54,486 0 122,981 100 872 187,896A.Gulf Dubai N.Amrica New York 3,513 0 0 0 0 0 0 3,960 126 316 4,401E.Africa Mombasa W.Med Barcelona 3,520 0 22 0 21 0 0 0 0 0 43S.Asia Colombo N.Africa Casablanca 3,675 0 0 0 0 0 283 1,128 8 10 1,430S.Asia Colombo NW.Europe Rotterdam 3,751 0 0 0 0 0 1,101 16,143 6 71 17,321A.Gulf Bandar Abbas N.Amrica New York 3,783 3,473 2,810 422 2,776 0 0 0 0 0 9,481E.Asia Pusan W.Med Barcelona 3,848 0 0 0 0 1,743 0 0 0 0 1,743Oceania Weipa N.Africa Annaba 3,864 0 0 0 0 1,721 0 0 0 0 1,721E.Asia Pusan N.Africa Annaba 4,280 0 0 0 0 1,198 0 0 0 0 1,198E.Asia Pusan W.Med Barcelona 4,451 0 21 1 361 0 0 0 0 0 384SE.Asia Singapore W.Med Barcelona 4,597 0 751 2 3,865 33,212 0 0 0 0 37,830S.Asia Karachi N.Africa Casablanca 4,606 0 4 0 14,434 0 0 0 0 0 14,438E.Africa Monbasa W.Med Marsaxlokk 4,653 0 0 0 0 0 156 4,550 33 1 4,740A.Gulf Bandar Abbas N.Africa Casablanca 4,657 3,463 16 51 571 0 1,050 572 162 3 5,889S.Asia Karachi NW.Europe Rotterdam 4,682 0 42 1 637 12,410 0 0 0 0 13,091A.Gulf Bandar Abbas NW.Europe Rotterdam 4,733 19,842 1,651 144 1,860 6,893 2,746 7,543 53 501 41,233
4,734SE.Asia Singapore N.Africa Annaba 5,029 0 0 0 0 10,235 0 0 0 0 10,235Oceania Melbourne E.Med Haifa 5,171 0 0 0 0 0 0 2,440 0 8 2,448Oceania Weipa E.Med Istanbul 5,519 0 0 7 105 12,327 0 0 0 0 12,439E.Asia Pusan W.Med Marsaxlokk 5,584 0 0 0 0 0 0 35,959 5 260 36,224E.Africa Mombasa E.Med Istanbul 5,607 0 14 3 19 0 0 0 0 0 36SE.Asia Singapore W.Med Marsaxlokk 5,730 0 0 0 0 0 0 7,980 24 51 8,056S.Asia Karachi W.Med Barcelona 5,812 0 69 0 1,220 4,417 0 0 0 0 5,706A.Gulf Bandar Abbas W.Med Barcelona 5,863 12,333 236 1,421 687 2,700 0 0 0 0 17,377E.Asia Pusan E.Med Istanbul 5,935 0 0 0 0 6,096 0 0 0 0 6,096S.Asia Colombo W.Med Marsaxlokk 6,014 0 0 0 0 0 1,135 817 62 22 2,036S.Asia Karachi N.Africa Annaba 6,244 0 0 0 0 1,243 0 0 0 0 1,243A.Gulf Bandar Abbas N.Africa Annaba 6,295 0 0 0 0 1,574 0 0 0 0 1,574E.Africa Monbasa E.Med Haifa 6,424 0 0 0 0 0 237 1,866 0 5 2,108E.Asia Pusan E.Med Istanbul 6,538 1,108 366 0 504 0 0 0 0 0 1,978SE.Asia Singapore E.Med Istanbul 6,684 644 2,917 30 4,395 77,112 0 0 0 0 85,098A.Gulf Dubai W.Med Marsaxlokk 6,996 0 0 0 0 0 1,893 1,297 920 23 4,133E.Asia Pusan E.Med Haifa 7,355 0 0 0 0 0 0 20,881 6 608 21,495SE.Asia Singapore E.Med Haifa 7,501 0 0 0 0 0 0 48,229 29 134 48,393S.Asia Colombo E.Med Haifa 7,785 0 0 0 0 0 1,014 7,629 22 85 8,750S.Asia Karachi E.Med Istanbul 7,899 0 38 2 332 14,487 0 0 0 0 14,859A.Gulf Bandar Abbas E.Med Istanbul 7,950 11,192 294 1,404 689 8,955 0 0 0 0 22,534
7,951A.Gulf Dubai E.Med Haifa 8,767 0 0 0 0 0 2,146 6,680 312 57 9,195
Total 139,971 25,132 4,939 72,178 388,404 12,089 394,629 1,904 8,221 1,047,467Source) The Study Team
Port Port
5 - 21
Table 5.6.2 Potential Cargo O-D by Vessel Type (2020)O-D Pair Vessel Type
Zone Zone
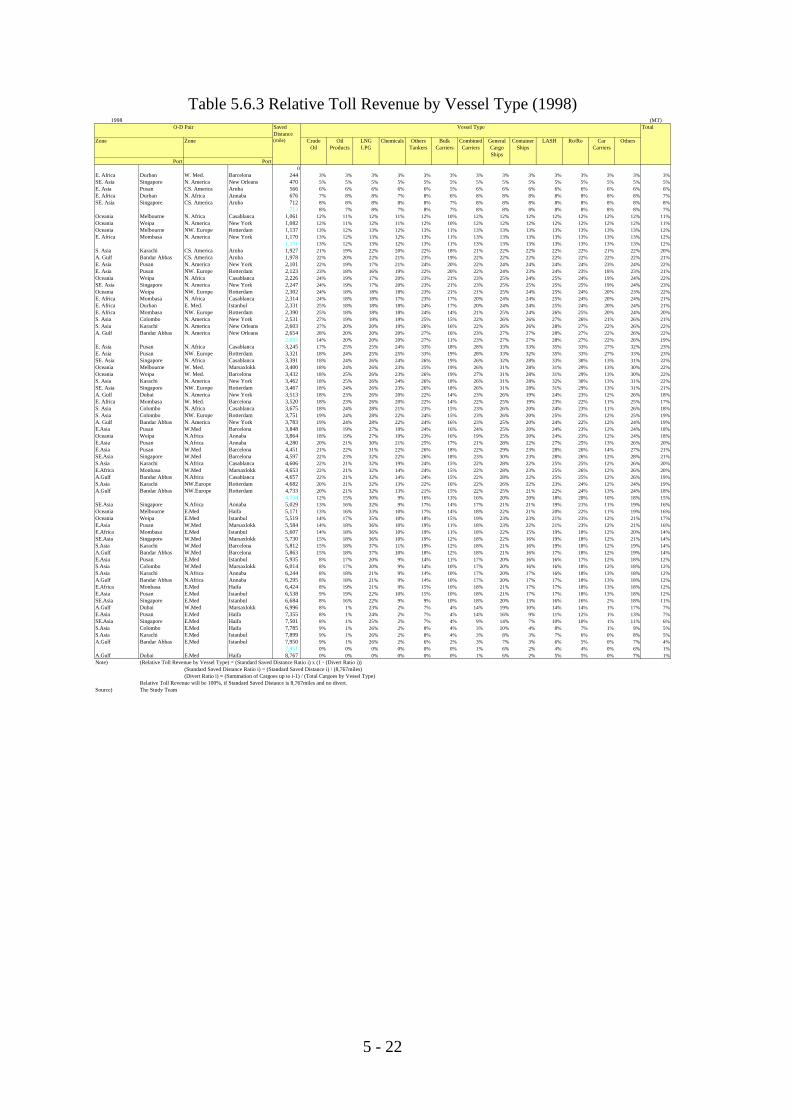
1998 (MT)SavedDistance
Total
(mile) CrudeOil
OilProducts
LNGLPG
Chemicals OthersTankers
BulkCarriers
CombinedCarriers
GeneralCargoShips
ContainerShips
LASH Ro/Ro CarCarriers
Others
0E. Africa Durban W. Med. Barcelona 244 3% 3% 3% 3% 3% 3% 3% 3% 3% 3% 3% 3% 3% 3%SE. Asia Singapore N. America New Orleans 470 5% 5% 5% 5% 5% 5% 5% 5% 5% 5% 5% 5% 5% 5%E. Asia Pusan CS. America Aruba 566 6% 6% 6% 6% 6% 5% 6% 6% 6% 6% 6% 6% 6% 6%E. Africa Durban N. Africa Annaba 676 7% 8% 8% 7% 8% 6% 8% 8% 8% 8% 8% 8% 8% 7%SE. Asia Singapore CS. America Aruba 712 8% 8% 8% 8% 8% 7% 8% 8% 8% 8% 8% 8% 8% 8%
713 8% 7% 8% 7% 8% 7% 8% 8% 8% 8% 8% 8% 8% 7%Oceania Melbourne N. Africa Casablanca 1,061 12% 11% 12% 11% 12% 10% 12% 12% 12% 12% 12% 12% 12% 11%Oceania Weipa N. America New York 1,082 12% 11% 12% 11% 12% 10% 12% 12% 12% 12% 12% 12% 12% 11%Oceania Melbourne NW. Europe Rotterdam 1,137 13% 12% 13% 12% 13% 11% 13% 13% 13% 13% 13% 13% 13% 12%E. Africa Mombasa N. America New York 1,170 13% 12% 13% 12% 13% 11% 13% 13% 13% 13% 13% 13% 13% 12%
1,171 13% 12% 13% 12% 13% 11% 13% 13% 13% 13% 13% 13% 13% 12%S. Asia Karachi CS. America Aruba 1,927 21% 19% 22% 20% 22% 18% 21% 22% 22% 22% 22% 21% 22% 20%A. Gulf Bandar Abbas CS. America Aruba 1,978 22% 20% 22% 21% 23% 19% 22% 22% 22% 22% 22% 22% 22% 21%E. Asia Pusan N. America New York 2,101 22% 19% 17% 21% 24% 20% 22% 24% 24% 24% 24% 23% 24% 22%E. Asia Pusan NW. Europe Rotterdam 2,123 23% 18% 16% 19% 22% 20% 22% 24% 23% 24% 23% 18% 23% 21%Oceania Weipa N. Africa Casablanca 2,226 24% 19% 17% 20% 23% 21% 23% 25% 24% 25% 24% 19% 24% 22%SE. Asia Singapore N. America New York 2,247 24% 19% 17% 20% 23% 21% 23% 25% 25% 25% 25% 19% 24% 23%Oceania Weipa NW. Europe Rotterdam 2,302 24% 18% 18% 18% 23% 21% 21% 25% 24% 25% 24% 20% 23% 22%E. Africa Mombasa N. Africa Casablanca 2,314 24% 18% 18% 17% 23% 17% 20% 24% 24% 25% 24% 20% 24% 21%E. Africa Durban E. Med. Istanbul 2,331 25% 18% 18% 18% 24% 17% 20% 24% 24% 25% 24% 20% 24% 21%E. Africa Mombasa NW. Europe Rotterdam 2,390 25% 18% 18% 18% 24% 14% 21% 25% 24% 26% 25% 20% 24% 20%S. Asia Colombo N. America New York 2,531 27% 19% 19% 19% 25% 15% 22% 26% 26% 27% 26% 21% 26% 21%S. Asia Karachi N. America New Orleans 2,603 27% 20% 20% 19% 26% 16% 22% 26% 26% 28% 27% 22% 26% 22%A. Gulf Bandar Abbas N. America New Orleans 2,654 28% 20% 20% 20% 27% 16% 23% 27% 27% 28% 27% 22% 26% 22%
2,655 14% 20% 20% 20% 27% 11% 23% 27% 27% 28% 27% 22% 26% 19%E. Asia Pusan N. Africa Casablanca 3,245 17% 25% 25% 24% 33% 18% 28% 33% 33% 35% 33% 27% 32% 23%E. Asia Pusan NW. Europe Rotterdam 3,321 18% 24% 25% 25% 33% 19% 28% 33% 32% 35% 33% 27% 33% 23%SE. Asia Singapore N. Africa Casablanca 3,391 18% 24% 26% 24% 26% 19% 26% 32% 28% 33% 30% 13% 31% 22%Oceania Melbourne W. Med. Marsaxlokk 3,400 18% 24% 26% 23% 25% 19% 26% 31% 28% 31% 29% 13% 30% 22%Oceania Weipa W. Med. Barcelona 3,432 18% 25% 26% 23% 26% 19% 27% 31% 28% 31% 29% 13% 30% 22%S. Asia Karachi N. America New York 3,462 18% 25% 26% 24% 26% 18% 26% 31% 28% 32% 30% 13% 31% 22%SE. Asia Singapore NW. Europe Rotterdam 3,467 18% 24% 26% 23% 26% 18% 26% 31% 28% 31% 29% 13% 31% 21%A. Gulf Dubai N. America New York 3,513 18% 23% 26% 20% 22% 14% 23% 26% 19% 24% 23% 12% 26% 18%E. Africa Mombasa W. Med. Barcelona 3,520 18% 23% 26% 20% 22% 14% 22% 25% 19% 23% 22% 11% 25% 17%S. Asia Colombo N. Africa Casablanca 3,675 18% 24% 28% 21% 23% 15% 23% 26% 20% 24% 23% 11% 26% 18%S. Asia Colombo NW. Europe Rotterdam 3,751 19% 24% 28% 22% 24% 15% 23% 26% 20% 25% 23% 12% 25% 19%A. Gulf Bandar Abbas N. America New York 3,783 19% 24% 28% 22% 24% 16% 23% 25% 20% 24% 22% 12% 24% 19%E.Asia Pusan W.Med Barcelona 3,848 18% 19% 27% 19% 24% 16% 24% 25% 20% 24% 23% 12% 24% 18%Oceania Weipa N.Africa Annaba 3,864 18% 19% 27% 19% 23% 16% 19% 25% 20% 24% 23% 12% 24% 18%E.Asia Pusan N.Africa Annaba 4,280 20% 21% 30% 21% 25% 17% 21% 28% 22% 27% 25% 13% 26% 20%E.Asia Pusan W.Med Barcelona 4,451 21% 22% 31% 22% 26% 18% 22% 29% 23% 28% 26% 14% 27% 21%SE.Asia Singapore W.Med Barcelona 4,597 22% 23% 32% 22% 26% 18% 23% 30% 23% 28% 26% 12% 28% 21%S.Asia Karachi N.Africa Casablanca 4,606 22% 21% 32% 19% 24% 15% 22% 28% 22% 25% 25% 12% 26% 20%E.Africa Monbasa W.Med Marsaxlokk 4,653 22% 21% 32% 14% 24% 15% 22% 28% 23% 25% 26% 12% 26% 20%A.Gulf Bandar Abbas N.Africa Casablanca 4,657 22% 21% 32% 14% 24% 15% 22% 28% 22% 25% 25% 12% 26% 19%S.Asia Karachi NW.Europe Rotterdam 4,682 20% 21% 32% 13% 22% 16% 22% 26% 22% 23% 24% 12% 24% 19%A.Gulf Bandar Abbas NW.Europe Rotterdam 4,733 20% 21% 32% 13% 21% 15% 22% 25% 21% 22% 24% 13% 24% 18%
4,734 12% 15% 30% 9% 16% 13% 16% 20% 20% 18% 20% 10% 18% 15%SE.Asia Singapore N.Africa Annaba 5,029 13% 16% 32% 9% 17% 14% 17% 21% 21% 19% 21% 11% 19% 16%Oceania Melbourne E.Med Haifa 5,171 13% 16% 33% 10% 17% 14% 18% 22% 21% 20% 22% 11% 19% 16%Oceania Weipa E.Med Istanbul 5,519 14% 17% 35% 10% 18% 15% 19% 23% 23% 21% 23% 12% 21% 17%E.Asia Pusan W.Med Marsaxlokk 5,584 14% 18% 36% 10% 19% 11% 18% 23% 22% 21% 23% 12% 21% 16%E.Africa Mombasa E.Med Istanbul 5,607 14% 18% 36% 10% 19% 11% 18% 22% 15% 19% 18% 12% 20% 14%SE.Asia Singapore W.Med Marsaxlokk 5,730 15% 18% 36% 10% 19% 12% 18% 22% 16% 19% 18% 12% 21% 14%S.Asia Karachi W.Med Barcelona 5,812 15% 18% 37% 11% 19% 12% 18% 21% 16% 19% 18% 12% 19% 14%A.Gulf Bandar Abbas W.Med Barcelona 5,863 15% 18% 37% 10% 18% 12% 18% 21% 16% 17% 18% 12% 19% 14%E.Asia Pusan E.Med Istanbul 5,935 8% 17% 20% 9% 14% 11% 17% 20% 16% 16% 17% 12% 18% 12%S.Asia Colombo W.Med Marsaxlokk 6,014 8% 17% 20% 9% 14% 10% 17% 20% 16% 16% 18% 12% 18% 12%S.Asia Karachi N.Africa Annaba 6,244 8% 18% 21% 9% 14% 10% 17% 20% 17% 16% 18% 13% 18% 12%A.Gulf Bandar Abbas N.Africa Annaba 6,295 8% 18% 21% 9% 14% 10% 17% 20% 17% 17% 18% 13% 18% 12%E.Africa Monbasa E.Med Haifa 6,424 8% 19% 21% 9% 15% 10% 18% 21% 17% 17% 18% 13% 18% 12%E.Asia Pusan E.Med Istanbul 6,538 9% 19% 22% 10% 15% 10% 18% 21% 17% 17% 18% 13% 18% 12%SE.Asia Singapore E.Med Istanbul 6,684 8% 16% 22% 9% 9% 10% 18% 20% 13% 16% 16% 2% 18% 11%A.Gulf Dubai W.Med Marsaxlokk 6,996 8% 1% 23% 2% 7% 4% 14% 19% 10% 14% 14% 1% 17% 7%E.Asia Pusan E.Med Haifa 7,355 8% 1% 24% 2% 7% 4% 14% 16% 9% 11% 12% 1% 13% 7%SE.Asia Singapore E.Med Haifa 7,501 8% 1% 25% 2% 7% 4% 9% 14% 7% 10% 10% 1% 11% 6%S.Asia Colombo E.Med Haifa 7,785 9% 1% 26% 2% 8% 4% 3% 10% 4% 8% 7% 1% 9% 5%S.Asia Karachi E.Med Istanbul 7,899 9% 1% 26% 2% 8% 4% 3% 8% 3% 7% 6% 0% 8% 5%A.Gulf Bandar Abbas E.Med Istanbul 7,950 9% 1% 26% 2% 6% 2% 3% 7% 3% 6% 5% 0% 7% 4%
7,951 0% 0% 0% 0% 0% 0% 1% 6% 2% 4% 4% 0% 6% 1%A.Gulf Dubai E.Med Haifa 8,767 0% 0% 0% 0% 0% 0% 1% 6% 2% 5% 5% 0% 7% 1%Note) (Relative Toll Revenue by Vessel Type) = (Standard Saved Distance Ratio i) x (1 - (Divert Ratio i))
(Standard Saved Distance Ratio i) = (Standard Saved Distance i) / (8,767miles)(Divert Ratio i) = (Summation of Cargoes up to i-1) / (Total Cargoes by Vessel Type)
Relative Toll Revenue will be 100%, if Standard Saved Distance is 8,767miles and no divert.Source) The Study Team
5 - 22
Table 5.6.3 Relative Toll Revenue by Vessel Type (1998)O-D Pair Vessel Type
Zone Zone
Port Port

2020 (MT)SavedDistance
Total
(mile) CrudeOil
OilProducts
LNGLPG
Chemicals OthersTankers
BulkCarriers
CombinedCarriers
GeneralCargoShips
ContainerShips
LASH Ro/Ro CarCarriers
Others
0E. Africa Durban W. Med. Barcelona 244 3% 3% 3% 3% 3% 3% 3% 3% 3% 3%SE. Asia Singapore N. America New Orleans 470 5% 5% 5% 5% 5% 5% 5% 5% 5% 5%E. Asia Pusan CS. America Aruba 566 6% 6% 6% 6% 6% 6% 6% 6% 6% 6%E. Africa Durban N. Africa Annaba 676 7% 8% 8% 7% 7% 8% 8% 8% 8% 7%SE. Asia Singapore CS. America Aruba 712 8% 8% 8% 8% 7% 8% 8% 8% 8% 8%
713 8% 6% 8% 7% 7% 8% 8% 8% 8% 8%Oceania Melbourne N. Africa Casablanca 1,061 11% 8% 12% 10% 11% 12% 12% 12% 12% 11%Oceania Weipa N. America New York 1,082 11% 9% 12% 11% 11% 12% 12% 12% 12% 11%Oceania Melbourne NW. Europe Rotterdam 1,137 12% 9% 13% 11% 11% 13% 13% 13% 13% 12%E. Africa Mombasa N. America New York 1,170 12% 9% 13% 11% 12% 13% 13% 13% 13% 12%
1,171 12% 9% 13% 11% 12% 13% 13% 13% 13% 12%S. Asia Karachi CS. America Aruba 1,927 20% 15% 22% 19% 19% 22% 21% 22% 21% 20%A. Gulf Bandar Abbas CS. America Aruba 1,978 21% 16% 22% 19% 20% 23% 22% 23% 22% 21%E. Asia Pusan N. America New York 2,101 21% 15% 18% 20% 21% 24% 23% 24% 23% 22%E. Asia Pusan NW. Europe Rotterdam 2,123 21% 14% 18% 18% 21% 24% 23% 24% 18% 22%Oceania Weipa N. Africa Casablanca 2,226 22% 15% 18% 19% 22% 25% 24% 25% 19% 23%SE. Asia Singapore N. America New York 2,247 23% 15% 19% 20% 22% 26% 25% 26% 19% 23%Oceania Weipa NW. Europe Rotterdam 2,302 23% 12% 19% 16% 23% 26% 23% 26% 19% 22%E. Africa Mombasa N. Africa Casablanca 2,314 23% 12% 19% 16% 20% 26% 23% 26% 19% 21%E. Africa Durban E. Med. Istanbul 2,331 23% 12% 19% 16% 20% 27% 23% 27% 19% 21%E. Africa Mombasa NW. Europe Rotterdam 2,390 24% 12% 20% 16% 19% 27% 24% 27% 20% 21%S. Asia Colombo N. America New York 2,531 25% 13% 21% 17% 20% 28% 25% 29% 21% 23%S. Asia Karachi N. America New Orleans 2,603 26% 13% 21% 18% 21% 29% 26% 29% 21% 23%A. Gulf Bandar Abbas N. America New Orleans 2,654 26% 14% 22% 18% 21% 29% 26% 30% 22% 23%
2,655 12% 14% 22% 18% 15% 29% 26% 30% 22% 21%E. Asia Pusan N. Africa Casablanca 3,245 15% 17% 27% 22% 25% 36% 32% 37% 27% 26%E. Asia Pusan NW. Europe Rotterdam 3,321 15% 16% 27% 23% 26% 37% 32% 37% 27% 26%SE. Asia Singapore N. Africa Casablanca 3,391 15% 16% 27% 22% 26% 38% 30% 38% 15% 25%Oceania Melbourne W. Med. Marsaxlokk 3,400 15% 16% 27% 21% 26% 38% 29% 38% 15% 25%Oceania Weipa W. Med. Barcelona 3,432 15% 17% 28% 22% 26% 38% 29% 38% 14% 25%S. Asia Karachi N. America New York 3,462 15% 17% 28% 22% 25% 38% 29% 39% 15% 25%SE. Asia Singapore NW. Europe Rotterdam 3,467 15% 16% 28% 22% 26% 38% 29% 39% 15% 25%A. Gulf Dubai N. America New York 3,513 15% 15% 28% 18% 20% 39% 17% 37% 11% 18%E. Africa Mombasa W. Med. Barcelona 3,520 15% 15% 28% 18% 20% 39% 17% 35% 9% 18%S. Asia Colombo N. Africa Casablanca 3,675 16% 15% 30% 19% 21% 41% 17% 36% 9% 19%S. Asia Colombo NW. Europe Rotterdam 3,751 16% 16% 30% 19% 22% 41% 18% 37% 10% 19%A. Gulf Bandar Abbas N. America New York 3,783 16% 16% 30% 19% 22% 37% 16% 37% 9% 19%E.Asia Pusan W.Med Barcelona 3,848 15% 11% 27% 18% 22% 38% 16% 38% 9% 19%Oceania Weipa N.Africa Annaba 3,864 15% 11% 27% 18% 22% 38% 16% 38% 9% 19%E.Asia Pusan N.Africa Annaba 4,280 17% 12% 30% 20% 24% 42% 18% 42% 10% 21%E.Asia Pusan W.Med Barcelona 4,451 18% 13% 31% 21% 25% 44% 19% 43% 11% 21%SE.Asia Singapore W.Med Barcelona 4,597 18% 13% 33% 21% 26% 45% 19% 45% 11% 22%S.Asia Karachi N.Africa Casablanca 4,606 18% 12% 33% 19% 21% 45% 19% 45% 11% 20%E.Africa Monbasa W.Med Marsaxlokk 4,653 18% 12% 33% 8% 22% 46% 20% 45% 11% 20%A.Gulf Bandar Abbas N.Africa Casablanca 4,657 18% 12% 33% 8% 22% 45% 19% 45% 11% 19%S.Asia Karachi NW.Europe Rotterdam 4,682 17% 12% 33% 8% 22% 41% 19% 40% 11% 19%A.Gulf Bandar Abbas NW.Europe Rotterdam 4,733 17% 12% 33% 7% 20% 41% 19% 41% 12% 19%
4,734 10% 8% 31% 6% 19% 29% 18% 39% 8% 17%SE.Asia Singapore N.Africa Annaba 5,029 10% 9% 33% 6% 21% 30% 19% 42% 9% 18%Oceania Melbourne E.Med Haifa 5,171 11% 9% 34% 6% 20% 31% 20% 43% 9% 18%Oceania Weipa E.Med Istanbul 5,519 11% 10% 37% 7% 21% 33% 21% 46% 10% 19%E.Asia Pusan W.Med Marsaxlokk 5,584 12% 10% 37% 7% 19% 34% 21% 46% 10% 18%E.Africa Mombasa E.Med Istanbul 5,607 12% 10% 37% 7% 19% 34% 15% 46% 8% 16%SE.Asia Singapore W.Med Marsaxlokk 5,730 12% 10% 38% 7% 20% 35% 16% 47% 8% 16%S.Asia Karachi W.Med Barcelona 5,812 12% 10% 38% 7% 20% 35% 15% 47% 8% 16%A.Gulf Bandar Abbas W.Med Barcelona 5,863 12% 10% 39% 6% 19% 36% 15% 47% 8% 16%E.Asia Pusan E.Med Istanbul 5,935 6% 10% 20% 6% 19% 36% 15% 48% 8% 15%S.Asia Colombo W.Med Marsaxlokk 6,014 6% 10% 20% 6% 18% 36% 15% 49% 8% 15%S.Asia Karachi N.Africa Annaba 6,244 7% 10% 21% 6% 19% 31% 16% 48% 8% 15%A.Gulf Bandar Abbas N.Africa Annaba 6,295 7% 10% 21% 6% 19% 31% 16% 49% 8% 15%E.Africa Monbasa E.Med Haifa 6,424 7% 11% 21% 6% 19% 32% 16% 50% 8% 15%E.Asia Pusan E.Med Istanbul 6,538 7% 11% 22% 6% 19% 31% 16% 50% 8% 15%SE.Asia Singapore E.Med Istanbul 6,684 6% 10% 22% 6% 20% 32% 16% 52% 8% 16%A.Gulf Dubai W.Med Marsaxlokk 6,996 6% 1% 23% 1% 5% 33% 17% 54% 9% 10%E.Asia Pusan E.Med Haifa 7,355 7% 1% 24% 1% 5% 22% 18% 16% 9% 10%SE.Asia Singapore E.Med Haifa 7,501 7% 1% 24% 1% 5% 22% 14% 16% 3% 8%S.Asia Colombo E.Med Haifa 7,785 7% 1% 25% 1% 5% 23% 3% 16% 2% 5%S.Asia Karachi E.Med Istanbul 7,899 7% 1% 26% 1% 5% 16% 2% 15% 1% 4%A.Gulf Bandar Abbas E.Med Istanbul 7,950 7% 1% 26% 1% 2% 16% 2% 15% 1% 3%
7,951 0% 0% 0% 0% 0% 16% 2% 15% 1% 1%A.Gulf Dubai E.Med Haifa 8,767 0% 0% 0% 0% 0% 18% 2% 16% 1% 1%Note) (Relative Toll Revenue by Vessel Type) = (Standard Saved Distance Ratio i) x (1 - (Divert Ratio i))
(Standard Saved Distance Ratio i) = (Standard Saved Distance i) / (8,767miles)(Divert Ratio i) = (Summation of Cargoes up to i-1) / (Total Cargoes by Vessel Type)
Relative Toll Revenue will be 100%, if Standard Saved Distance is 8,767miles and no divert.Source) The Study Team
Port Port
Zone Zone
Table 5.6.4 Relative Toll Revenue by Vessel Type (2020)O-D Pair Vessel Type
5 - 23
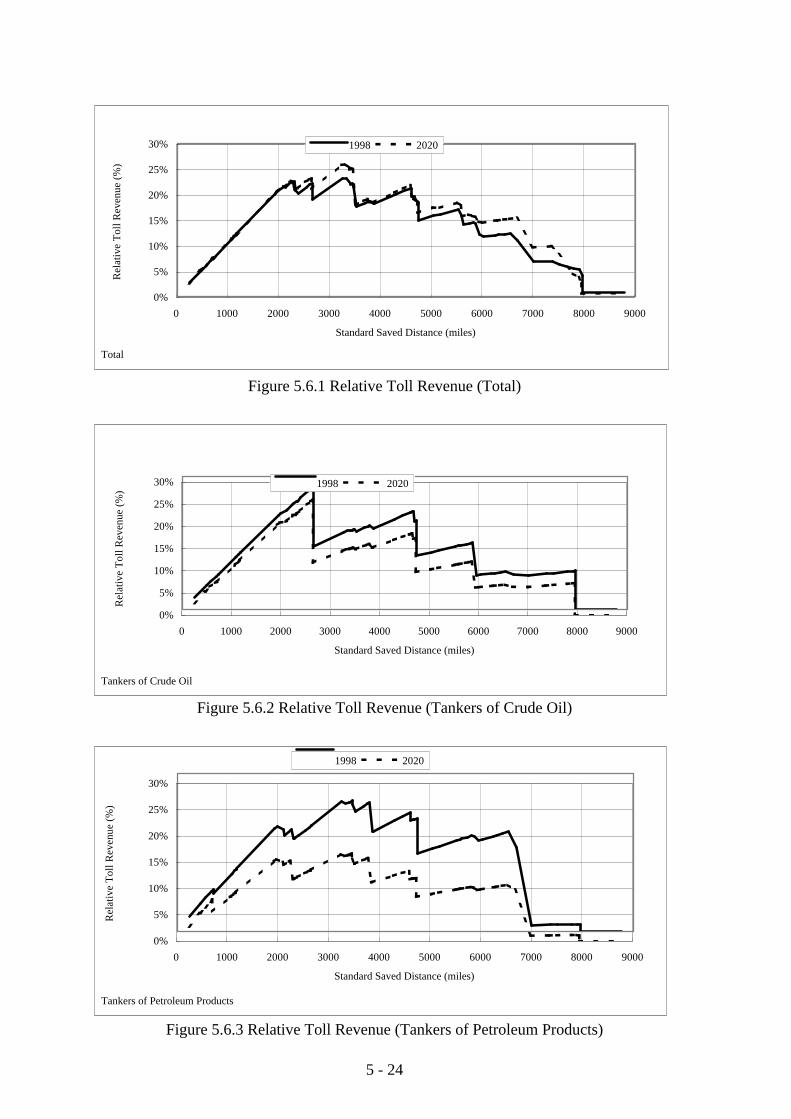
Figure 5.6.1 Relative Toll Revenue (Total)
Figure 5.6.2 Relative Toll Revenue (Tankers of Crude Oil)
Figure 5.6.3 Relative Toll Revenue (Tankers of Petroleum Products)
5 - 24
Total
0%
5%
10%
15%
20%
25%
30%
0 1000 2000 3000 4000 5000 6000 7000 8000 9000
Standard Saved Distance (miles)
Rel
ativ
e T
oll R
even
ue (%
)
1998 2020
Tankers of Crude Oil
0%
5%
10%
15%
20%
25%
30%
0 1000 2000 3000 4000 5000 6000 7000 8000 9000
Standard Saved Distance (miles)
Rel
ativ
e T
oll R
even
ue (%
)
1998 2020
Tankers of Petroleum Products
0%
5%
10%
15%
20%
25%
30%
0 1000 2000 3000 4000 5000 6000 7000 8000 9000
Standard Saved Distance (miles)
Rel
ativ
e T
oll R
even
ue (%
)
1998 2020

Figure 5.6.4 Relative Toll Revenue (Chemical Carriers)
Figure 5.6.5 Relative Toll Revenue (LNG/LPG Carriers)
Figure 5.6.6 Relative Toll Revenue (Dry Bulk Carriers)
5 - 25
Chemical Carriers
0%
5%
10%
15%
20%
25%
30%
0 1000 2000 3000 4000 5000 6000 7000 8000 9000
Standard Saved Distance (miles)
Rel
ativ
e T
oll R
even
ue (%
)
1998 2020
LNG/LPG Carriers
0%
5%
10%
15%
20%
25%
30%
35%
40%
45%
0 1000 2000 3000 4000 5000 6000 7000 8000 9000
Standard Saved Distance (miles)
Rel
ativ
e T
oll R
even
ue (%
)
1998 2020
Dry Bulk Carriers
0%
5%
10%
15%
20%
25%
30%
0 1000 2000 3000 4000 5000 6000 7000 8000 9000
Standard Saved Distance (miles)
Rel
ativ
e T
oll R
even
ue (%
)
1998 2020

Figure 5.6.7 Relative Toll Revenue (Container Ships)
Figure 5.6.8 Relative Toll Revenue (Vehicle Carriers)
Figure 5.6.9 Relative Toll Revenue (General Cargo Ships)
5 - 26
Container Ships
0%
5%
10%
15%
20%
25%
30%
35%
0 1000 2000 3000 4000 5000 6000 7000 8000 9000
Standard Saved Distance (miles)
Rel
ativ
e T
oll R
even
ue (%
)
1998 2020
Vehicle Carriers
0%
5%
10%
15%
20%
25%
30%
0 1000 2000 3000 4000 5000 6000 7000 8000 9000
Standard Saved Distance (miles)
Rel
ativ
e T
oll R
even
ue (%
)
1998 2020
General Cargo Ships
0%5%
10%15%20%25%30%35%40%45%50%
0 1000 2000 3000 4000 5000 6000 7000 8000 9000
Standard Saved Distance (miles)
Rel
ativ
e T
oll R
even
ue (%
)
1998 2020
5 - 27
Some shipping lines operating Dry Bulk Carriers are using the route via the Cape, even though they are well aware of the Long Haul Rebate provided by SCA. These shipping lines' rationale is thought to be as follows;
- A shipping line calculates the shipping cost of one voyage or one term (for example one year) to propose a freight rate to a shipper/consignee.
- In the calculation, the shipping line sets the Long Haul Rebate rate lower than the actual level, because they do not want to undertake a risk.
- As a result, since the full rebate that could be expected is not applied in this calculation, calculated shipping cost via the Cape becomes lower than that via the Canal.
- After the freight rate and route (via the Cape) are fixed by contract between the shipping line and the shipper/consignee, the shipping line cannot change the route from via the Cape to via the Canal without the consent of the consignee because this would possibly generate additional inventory cost for the consignee.
It is thought to be possible to prevent the vessels from diverting to the route via the Cape, if shipping lines or shippers/consignees could know in advance the fixed figure of the Long Haul Rebate rates of the O-D pairs. 5.6.3 Proposition The Study Team would like to propose setting the standard saved distance for tariff at 4,700 miles (or between saved distance at maximum relative toll revenue and 4,700 miles) on condition that SCA continues discount systems such as Long Haul Rebate. This is consistent with one of the key toll setting principles:
- Maximizing the net profit to SCA under the conditions that world trade shall not be adversely affected and that trade in the region surrounding the Suez Canal shall be promoted.
Setting standard saved distance over 4,700 miles may have a negative impact on the trade in the region surrounding the Suez Canal. This region was the most affected region by the Suez Canal closure, since sensitivity of the region to changes in trade patterns is relatively high. Conversely, the region can theoretically enjoy the benefit of the Canal more than other regions if the standard saved distance is set at 4,700 miles. The Study Team would also like to propose that a fixed rebate rate system regarding saved distance be introduced. Although shipping lines are well aware of the Long Haul Rebate, some opt for the route via the Cape because the rebate rates are not fixed. It should be noted, however, that such a fixed rebate rate system should not apply for Container Vessels and Tankers of Crude Oil. This is because Container Ships have no possibility of changing their route, and the reduction for VLCC in ballast coming from America to Arabian Gulf which are main O-D pairs and SUMED integration are already exist for Tankers of Crude Oil.
5 - 28
Two alternatives for applying the fixed rebate rate system regarding saved distance can be set as follows;
Alternative-1: Fixing rebate rates by main O-D pairs Outline of the system:
SCA fixes and announces rebate rates by main O-D pairs like current reduction for VLCC in ballast coming from America to Arabian Gulf. SCA can revise the rebate rates every six months to reflect changes in fuel price. Revising the rebate rates is considered to be easier than revising the tariff. Users can apply current Long Haul Rebate instead of the fixed rebate system, since managing cost for common carriers are also affected by fluctuations in the shipping market.
Merit: Shipping lines or shippers/consignees can know in advance the rebate rates of the main O-D pairs. This is expected to attract vessels which are well aware of the Long Haul Rebate but using the route via the Cape because the rebate rates are not fixed.
Demerit: This system is not for minor O-D pairs, but only for main O-D pairs.
Alternative-2: Using ratio of saved distance for standard one Outline of the system:
Rebate rates are calculated using the following equation by each trip. (Saved distance rebate) = (Toll by tariff) x (1 - Saved distance ratio) (Saved distance ratio) = (Actual saved distance) / (Standard saved distance)
Users can apply current Long Haul Rebate instead of the fixed rebate system, since managing cost for common carriers are also affected by fluctuations in the shipping market.
Merit: Shipping lines or shippers/consignees can calculate in advance the rebate rates of the O-D pairs.
Demerit: Alternative-2 is more complicate than alternative-1. Above equation does not reflect other charges at the Canal. It is possible that opinions of SCA and users regarding saved distance are different. Alternative-2 cannot reflect changes in fuel price.
As a result, the Study Team recommends Alternative-1: fixing rebate rates by main O-D pairs. 5.6.4 Conclusion Current tariff can basically be judged appropriate since the tariff is set based on the idea of
5 - 29
standard saved distance and complemented by discount systems such as Long Haul Rebate for trips where saved distance are less than standard one. The Study Team would like to propose setting the standard saved distance for tariff at 4,700 miles (or between saved distance at maximum relative toll revenue and 4,700 miles) on condition that SCA continues discount systems such as Long Haul Rebate. This is consistent with one of the key toll setting principles:
- Maximizing the net profit to SCA under the conditions that world trade shall not be adversely affected and that trade in the region surrounding the Suez Canal shall be promoted.
The Study Team would also like to propose that fixed rebate rate system regarding saved distance be introduced. Although shipping lines are well aware of the Long Haul Rebate, some opt for the route via the Cape because the rebate rates are not fixed. Such a fixed rebate rate system should not apply for Container Vessels and Tankers of Crude Oil. In applying the fixed rebate system, the Study Team recommends a method in which rebate rates are fixed by main O-D pairs.

5 - 30
5.7 Toll for Tankers of Crude Oil 5.7.1 Current toll for Tankers of Crude Oil For Tankers of Crude Oil, following discount systems are applied in addition to the basic toll as shown in Table 5.7.1.
- Reduction for VLCC in ballast coming from America to Arabian Gulf - Tolls for tankers that lighten part of crude oil in SUMED terminal at Sukhna - Tolls for supertanker (mother) with Suez-max (daughter) - SBT reduction - Volume incentives for crude oil tankers
Table 5.7.1 Current Tariff (Tankers of Crude Oil)
(SDR/SCNT)
SCNT Vessel Type First 5000 Next 5000 Next 10000 Next 20000 Next 30000 Rest 1 (L) 6.49 3.62 3.25 1.40 1.40 1.21 1 (B) 5.52 3.08 2.77 1.19 1.19 1.03
Source) SCA
Current basic toll level is set based on the "World Scale" which shows market conditions of tanker freight. Standard O-D for tariff of Tankers of Crude Oil is set at the Arabian Gulf - NW. Europe. 5.7.2 Evaluation World Scale obtained by multiplying World Scale Flat (or WS100) and World Scale Rate (WSR) together shows tanker freight per MT of crude oil or petroleum products by O-D and route. World Scale Flat is announced every year (1st January) by Worldscale Association (London) Limited and Worldscale Association (NYC) Inc whose members are tanker brokers. World Scale Flat is obtained on the premise of parameters as shown in Table 5.7.2. World Scale Rate is a percentage agreed upon between a charterer and a shipowner considering market conditions of tanker freight at that time. For common carriers, current basic toll level can basically be judged appropriate, since it is set based on the World Scale.

5 - 31
Table 5.7.2 Main Parameters of World Scale Flat Item Assumption
Standard Vessel Total Capacity: 75,000MT Speed: 14.5knots Daily Bunker Consumption: 55MT Fixed Daily Hire Element US$ 12,000 Bunker Price Average during the 1st Oct. to 30th Sept. of the previous
year Voyage Distance Round voyage distance Suez Canal Treated as Fixed Rate Differentials
Source) Worldscale, 1st January 2001
Table 5.7.2 and Table 5.7.4 show shippers/consignees payment for crude oil transport which common carriers receive from them. Observations are as follows;
WSR is high level (case-2) In case that the destination is Europe, using the Canal has great advantages and there may be room to raise the toll, since savings of S/S or S/S+SUMED for C/C exceed 20%. In case that the destination is America, using the Canal still has some advantages, but savings of S/S or S/S+SUMED for C/C are less than 10%.
WSR is low level (case-2) Advantages of using the Canal are less than case-1. In case that destination is America, in particular, there is no advantage to using the Canal. It is necessary to apply the Long Haul Rebate in this case.
On the other hand, common carriers which participate in spot tanker market are said to represent only 20% - 30% of the world fleet, and the remaining 70% - 80% are said to be industrial carriers which are seldom affected by the market conditions of tanker freight in case of Tankers of Crude Oil. For industrial carriers, it is thought to be appropriate to set basic toll level based on savings in shipping cost. Lately, however, some shippers/consignees seem to insist on reflecting the market conditions of tanker freight in long term contracts.

(Case-1: WSR is low level)Unloading Port Cargo Least
via Cape via Suez Savings SCNT DWT MT C/C C/S S/S S/S+ C/S S/S S/S+ Payment
SUMED SUMED Route
Lavera (France) 10,783 4,684 6,099 40,000 79,840 72,335 1,392,455 1,184,306 997,671 85% 72% S/S
70,000 139,721 126,587 2,436,796 2,023,432 1,648,354 83% 68% S/S
110,000 219,561 198,922 1,531,701 1,398,551 1,390,113 91% 91% S/S + SUMED
160,000 319,361 289,341 2,227,928 2,006,459 1,940,595 90% 87% S/S + SUMED
220,000 439,122 397,844 3,063,401 2,725,653 2,536,367 89% 83% S/S + SUMED
Rotterdam (Netherland) 11,169 6,436 4,733 40,000 79,840 72,335 1,388,838 1,258,811 1,149,575 91% 83% S/S
70,000 139,721 126,587 2,430,467 2,153,817 1,914,186 89% 79% S/S
110,000 219,561 198,922 1,527,722 1,480,507 1,557,208 97% 102% C/S
160,000 319,361 289,341 2,222,141 2,125,668 2,183,641 96% 98% C/S
220,000 439,122 397,844 3,055,444 2,889,564 2,870,556 95% 94% S/S + SUMED
New Orleans (USA) 12,299 9,645 2,654 40,000 79,840 72,335 1,493,725 1,484,497 1,496,062 99% 100% C/S
70,000 139,721 126,587 2,614,018 2,548,768 2,520,537 98% 96% S/S
110,000 219,561 198,922 1,643,097 1,628,493 1,838,074 99% 112% C/S
160,000 319,361 289,341 2,389,959 2,356,369 2,607,623 99% 109% C/S
220,000 439,122 397,844 3,286,194 3,219,525 3,520,786 98% 107% C/S
Aruba Island (Aruba) 10,792 8,814 1,978 40,000 79,840 72,335 1,351,224 1,382,504 1,434,577 102% 106% C/C
70,000 139,721 126,587 2,364,642 2,370,280 2,412,938 100% 102% C/C
110,000 219,561 198,922 1,486,346 1,494,019 1,748,158 101% 118% C/C
160,000 319,361 289,341 2,161,958 2,164,204 2,480,270 100% 115% C/C
220,000 439,122 397,844 2,972,693 2,958,129 3,348,508 100% 113% C/S
(Case-2: WSR is high level)Unloading Port Cargo Least
via Cape via Suez Savings SCNT DWT MT C/C C/S S/S S/S+ C/S S/S S/S+ Payment
SUMED SUMED Route
Lavera (France) 10,783 4,684 6,099 40,000 79,840 72,335 2,784,910 2,236,061 1,708,728 80% 61% S/S
70,000 139,721 126,587 4,873,593 3,864,005 2,892,702 79% 59% S/S
110,000 219,561 198,922 3,829,251 3,133,948 2,563,356 82% 67% S/S + SUMED
160,000 319,361 289,341 5,569,820 4,530,673 3,647,130 81% 65% S/S + SUMED
220,000 439,122 397,844 7,658,503 6,196,446 4,882,852 81% 64% S/S + SUMED
Rotterdam (Netherland) 11,169 6,436 4,733 40,000 79,840 72,335 2,777,677 2,385,072 2,012,536 86% 72% S/S
70,000 139,721 126,587 4,860,934 4,124,774 3,424,367 85% 70% S/S
110,000 219,561 198,922 3,819,305 3,338,838 2,981,093 87% 78% S/S + SUMED
160,000 319,361 289,341 5,555,353 4,828,694 4,254,747 87% 77% S/S + SUMED
220,000 439,122 397,844 7,638,611 6,606,226 5,718,325 86% 75% S/S + SUMED
New Orleans (USA) 12,299 9,645 2,654 40,000 79,840 72,335 2,987,449 2,836,445 2,705,508 95% 91% S/S
70,000 139,721 126,587 5,228,036 4,914,676 4,637,068 94% 89% S/S
110,000 219,561 198,922 4,107,743 3,859,206 3,833,661 94% 93% S/S + SUMED
160,000 319,361 289,341 5,974,898 5,601,043 5,510,295 94% 92% S/S + SUMED
220,000 439,122 397,844 8,215,485 7,680,951 7,511,960 93% 91% S/S + SUMED
Aruba Island (Aruba) 10,792 8,814 1,978 40,000 79,840 72,335 2,702,448 2,632,459 2,582,538 97% 96% S/S
70,000 139,721 126,587 4,729,284 4,557,701 4,421,871 96% 93% S/S
110,000 219,561 198,922 3,715,866 3,556,444 3,642,295 96% 98% C/S
160,000 319,361 289,341 5,404,896 5,164,094 5,235,378 96% 97% C/S
220,000 439,122 397,844 7,431,732 7,082,979 7,136,781 95% 96% C/S
Notes) Assumed parameters Loading port = Ras Tanura (Saudi Arabia, Arabian Gulf))
SCNT/DWT = 0.501
Load Factor = 0.906
SUMED Charges (US$) = Cargo(MT) x 1.07 (US$/MT) x 1.1
SC toll in case of SUMED integration = 0.63 (US$/MT)
(Other charges) = (Port dues) + (Agency fee, etc.) + (Escort tug paied by user)
(Port dues) = 0.13US$/SCNT
(Agency fee, etc.) = 4,500US$
(Escort tug paied by user) = 6,600SDR*1.30US$/SCNT*(No. of Tug paied by user)
1 tug for a vessel from 70,000SCNT laden to 90,000SCNT laden
2 tugs for over 90,000SCNT laden
1 tug for a vessel over 130,000SCNT ballast
1 tug for a LNG/LPG over 25,000SCNT (except GF)
5 - 32
Table 5.7.3 Shippers'/Consignees' Payment for Crude Oil Transport (Common Carriers)
O-D Distance (single way) Vessel Size Route Ratio for C/C
O-D Distance (single way) Vessel Size Route Ratio for C/C

(Cas
e-1:
WSR
is lo
w le
vel)
Unl
oadi
ng P
ort
Car
go
via
Cap
evi
a Su
ezSa
ving
sSC
NT
DW
TM
T
Tota
lTo
tal
SUM
EDTo
tal
WS
Flat
WS
Rat
eFr
eigh
tW
S Fl
atW
S R
ate
Frei
ght
Toll
(B)
O. C
arge
sTo
tal
WS
Flat
WS
Rat
eFr
eigh
tTo
ll(L+
B)
O. C
arge
sTo
tal
WS
Flat
WS
Rat
eFr
eigh
tTo
ll(L+
B)
O. C
arge
sTo
tal
Cha
rges
US$
/MT
%U
S$U
S$/M
T%
US$
US$
US$
US$
US$
/MT
%U
S$U
S$U
S$U
S$U
S$/M
T%
US$
US$
US$
US$
US$
Lave
ra (F
ranc
e)10
,783
4,68
46,
099
40,0
0079
,840
72,3
3519
.25
100%
1,39
2,45
514
.54
100%
1,05
1,75
612
2,85
09,
700
132,
550
1,18
4,30
69.
8310
0%71
1,05
626
7,21
519
,400
286,
615
997,
671
70,0
0013
9,72
112
6,58
719
.25
100%
2,43
6,79
614
.54
100%
1,84
0,57
216
9,26
013
,600
182,
860
2,02
3,43
29.
8310
0%1,
244,
349
368,
225
35,7
8040
4,00
51,
648,
354
110,
000
219,
561
198,
922
19.2
540
%1,
531,
701
14.5
440
%1,
156,
931
222,
820
18,8
0024
1,62
01,
398,
551
9.83
40%
782,
162
336,
220
37,6
0037
3,82
023
4,13
11,
390,
113
160,
000
319,
361
289,
341
19.2
540
%2,
227,
928
14.5
440
%1,
682,
809
289,
770
33,8
8032
3,65
02,
006,
459
9.83
40%
1,13
7,69
040
3,17
059
,180
462,
350
340,
555
1,94
0,59
5
220,
000
439,
122
397,
844
19.2
540
%3,
063,
401
14.5
440
%2,
313,
863
370,
110
41,6
8041
1,79
02,
725,
653
9.83
40%
1,56
4,32
442
9,00
074
,780
503,
780
468,
263
2,53
6,36
7
Rot
terd
am (N
ethe
rland
)11
,169
6,43
64,
733
40,0
0079
,840
72,3
3519
.20
100%
1,38
8,83
815
.57
100%
1,12
6,26
112
2,85
09,
700
132,
550
1,25
8,81
111
.93
100%
862,
960
267,
215
19,4
0028
6,61
51,
149,
575
70,0
0013
9,72
112
6,58
719
.20
100%
2,43
0,46
715
.57
100%
1,97
0,95
716
9,26
013
,600
182,
860
2,15
3,81
711
.93
100%
1,51
0,18
136
8,22
535
,780
404,
005
1,91
4,18
6
110,
000
219,
561
198,
922
19.2
040
%1,
527,
722
15.5
740
%1,
238,
887
222,
820
18,8
0024
1,62
01,
480,
507
11.9
340
%94
9,25
733
6,22
037
,600
373,
820
234,
131
1,55
7,20
8
160,
000
319,
361
289,
341
19.2
040
%2,
222,
141
15.5
740
%1,
802,
018
289,
770
33,8
8032
3,65
02,
125,
668
11.9
340
%1,
380,
737
403,
170
59,1
8046
2,35
034
0,55
52,
183,
641
220,
000
439,
122
397,
844
19.2
040
%3,
055,
444
15.5
740
%2,
477,
774
370,
110
41,6
8041
1,79
02,
889,
564
11.9
340
%1,
898,
513
429,
000
74,7
8050
3,78
046
8,26
32,
870,
556
New
Orle
ans
(USA
)12
,299
9,64
52,
654
40,0
0079
,840
72,3
3520
.65
100%
1,49
3,72
518
.69
100%
1,35
1,94
712
2,85
09,
700
132,
550
1,48
4,49
716
.72
100%
1,20
9,44
726
7,21
519
,400
286,
615
1,49
6,06
2
70,0
0013
9,72
112
6,58
720
.65
100%
2,61
4,01
818
.69
100%
2,36
5,90
816
9,26
013
,600
182,
860
2,54
8,76
816
.72
100%
2,11
6,53
236
8,22
535
,780
404,
005
2,52
0,53
7
110,
000
219,
561
198,
922
20.6
540
%1,
643,
097
18.6
940
%1,
487,
142
122,
551
18,8
0014
1,35
11,
628,
493
16.7
240
%1,
330,
391
235,
951
37,6
0027
3,55
123
4,13
11,
838,
074
160,
000
319,
361
289,
341
20.6
540
%2,
389,
959
18.6
940
%2,
163,
116
159,
374
33,8
8019
3,25
42,
356,
369
16.7
240
%1,
935,
115
272,
774
59,1
8033
1,95
434
0,55
52,
607,
623
220,
000
439,
122
397,
844
20.6
540
%3,
286,
194
18.6
940
%2,
974,
284
203,
561
41,6
8024
5,24
13,
219,
525
16.7
240
%2,
660,
783
316,
961
74,7
8039
1,74
146
8,26
33,
520,
786
Aru
ba Is
land
(Aru
ba)
10,7
928,
814
1,97
840
,000
79,8
4072
,335
18.6
810
0%1,
351,
224
17.2
810
0%1,
249,
954
122,
850
9,70
013
2,55
01,
382,
504
15.8
710
0%1,
147,
962
267,
215
19,4
0028
6,61
51,
434,
577
70,0
0013
9,72
112
6,58
718
.68
100%
2,36
4,64
217
.28
100%
2,18
7,42
016
9,26
013
,600
182,
860
2,37
0,28
015
.87
100%
2,00
8,93
336
8,22
535
,780
404,
005
2,41
2,93
8
110,
000
219,
561
198,
922
18.6
840
%1,
486,
346
17.2
840
%1,
374,
950
100,
269
18,8
0011
9,06
91,
494,
019
15.8
740
%1,
262,
758
213,
669
37,6
0025
1,26
923
4,13
11,
748,
158
160,
000
319,
361
289,
341
18.6
840
%2,
161,
958
17.2
840
%1,
999,
927
130,
397
33,8
8016
4,27
72,
164,
204
15.8
740
%1,
836,
739
243,
797
59,1
8030
2,97
734
0,55
52,
480,
270
220,
000
439,
122
397,
844
18.6
840
%2,
972,
693
17.2
840
%2,
749,
900
166,
550
41,6
8020
8,23
02,
958,
129
15.8
740
%2,
525,
516
279,
950
74,7
8035
4,73
046
8,26
33,
348,
508
(Cas
e-2:
WSR
is h
igh
leve
l)U
nloa
ding
Por
tC
argo
via
Cap
evi
a Su
ezSa
ving
sSC
NT
DW
TM
T
Tota
lTo
tal
SUM
EDTo
tal
WS
Flat
WS
Rat
eFr
eigh
tW
S Fl
atW
S R
ate
Frei
ght
Toll
(B)
O. C
arge
sTo
tal
WS
Flat
WS
Rat
eFr
eigh
tTo
ll(L+
B)
O. C
arge
sTo
tal
WS
Flat
WS
Rat
eFr
eigh
tTo
ll(L+
B)
O. C
arge
sTo
tal
Cha
rges
US$
/MT
%U
S$U
S$/M
T%
US$
US$
US$
US$
US$
/MT
%U
S$U
S$U
S$U
S$U
S$/M
T%
US$
US$
US$
US$
US$
Lave
ra (F
ranc
e)10
,783
4,68
46,
099
40,0
0079
,840
72,3
3519
.25
200%
2,78
4,91
014
.54
200%
2,10
3,51
112
2,85
09,
700
132,
550
2,23
6,06
19.
8320
0%1,
422,
113
267,
215
19,4
0028
6,61
51,
708,
728
70,0
0013
9,72
112
6,58
719
.25
200%
4,87
3,59
314
.54
200%
3,68
1,14
516
9,26
013
,600
182,
860
3,86
4,00
59.
8320
0%2,
488,
697
368,
225
35,7
8040
4,00
52,
892,
702
110,
000
219,
561
198,
922
19.2
510
0%3,
829,
251
14.5
410
0%2,
892,
328
222,
820
18,8
0024
1,62
03,
133,
948
9.83
100%
1,95
5,40
533
6,22
037
,600
373,
820
234,
131
2,56
3,35
6
160,
000
319,
361
289,
341
19.2
510
0%5,
569,
820
14.5
410
0%4,
207,
023
289,
770
33,8
8032
3,65
04,
530,
673
9.83
100%
2,84
4,22
540
3,17
059
,180
462,
350
340,
555
3,64
7,13
0
220,
000
439,
122
397,
844
19.2
510
0%7,
658,
503
14.5
410
0%5,
784,
656
370,
110
41,6
8041
1,79
06,
196,
446
9.83
100%
3,91
0,81
042
9,00
074
,780
503,
780
468,
263
4,88
2,85
2
Rot
terd
am (N
ethe
rland
)11
,169
6,43
64,
733
40,0
0079
,840
72,3
3519
.20
200%
2,77
7,67
715
.57
200%
2,25
2,52
212
2,85
09,
700
132,
550
2,38
5,07
211
.93
200%
1,72
5,92
126
7,21
519
,400
286,
615
2,01
2,53
6
70,0
0013
9,72
112
6,58
719
.20
200%
4,86
0,93
415
.57
200%
3,94
1,91
416
9,26
013
,600
182,
860
4,12
4,77
411
.93
200%
3,02
0,36
236
8,22
535
,780
404,
005
3,42
4,36
7
110,
000
219,
561
198,
922
19.2
010
0%3,
819,
305
15.5
710
0%3,
097,
218
222,
820
18,8
0024
1,62
03,
338,
838
11.9
310
0%2,
373,
141
336,
220
37,6
0037
3,82
023
4,13
12,
981,
093
160,
000
319,
361
289,
341
19.2
010
0%5,
555,
353
15.5
710
0%4,
505,
044
289,
770
33,8
8032
3,65
04,
828,
694
11.9
310
0%3,
451,
842
403,
170
59,1
8046
2,35
034
0,55
54,
254,
747
220,
000
439,
122
397,
844
19.2
010
0%7,
638,
611
15.5
710
0%6,
194,
436
370,
110
41,6
8041
1,79
06,
606,
226
11.9
310
0%4,
746,
283
429,
000
74,7
8050
3,78
046
8,26
35,
718,
325
New
Orle
ans
(USA
)12
,299
9,64
52,
654
40,0
0079
,840
72,3
3520
.65
200%
2,98
7,44
918
.69
200%
2,70
3,89
512
2,85
09,
700
132,
550
2,83
6,44
516
.72
200%
2,41
8,89
326
7,21
519
,400
286,
615
2,70
5,50
8
70,0
0013
9,72
112
6,58
720
.65
200%
5,22
8,03
618
.69
200%
4,73
1,81
616
9,26
013
,600
182,
860
4,91
4,67
616
.72
200%
4,23
3,06
336
8,22
535
,780
404,
005
4,63
7,06
8
110,
000
219,
561
198,
922
20.6
510
0%4,
107,
743
18.6
910
0%3,
717,
855
122,
551
18,8
0014
1,35
13,
859,
206
16.7
210
0%3,
325,
978
235,
951
37,6
0027
3,55
123
4,13
13,
833,
661
160,
000
319,
361
289,
341
20.6
510
0%5,
974,
898
18.6
910
0%5,
407,
789
159,
374
33,8
8019
3,25
45,
601,
043
16.7
210
0%4,
837,
787
272,
774
59,1
8033
1,95
434
0,55
55,
510,
295
220,
000
439,
122
397,
844
20.6
510
0%8,
215,
485
18.6
910
0%7,
435,
710
203,
561
41,6
8024
5,24
17,
680,
951
16.7
210
0%6,
651,
957
316,
961
74,7
8039
1,74
146
8,26
37,
511,
960
Aru
ba Is
land
(Aru
ba)
10,7
928,
814
1,97
840
,000
79,8
4072
,335
18.6
820
0%2,
702,
448
17.2
820
0%2,
499,
909
122,
850
9,70
013
2,55
02,
632,
459
15.8
720
0%2,
295,
923
267,
215
19,4
0028
6,61
52,
582,
538
70,0
0013
9,72
112
6,58
718
.68
200%
4,72
9,28
417
.28
200%
4,37
4,84
116
9,26
013
,600
182,
860
4,55
7,70
115
.87
200%
4,01
7,86
636
8,22
535
,780
404,
005
4,42
1,87
1
110,
000
219,
561
198,
922
18.6
810
0%3,
715,
866
17.2
810
0%3,
437,
375
100,
269
18,8
0011
9,06
93,
556,
444
15.8
710
0%3,
156,
895
213,
669
37,6
0025
1,26
923
4,13
13,
642,
295
160,
000
319,
361
289,
341
18.6
810
0%5,
404,
896
17.2
810
0%4,
999,
818
130,
397
33,8
8016
4,27
75,
164,
094
15.8
710
0%4,
591,
847
243,
797
59,1
8030
2,97
734
0,55
55,
235,
378
220,
000
439,
122
397,
844
18.6
810
0%7,
431,
732
17.2
810
0%6,
874,
750
166,
550
41,6
8020
8,23
07,
082,
979
15.8
710
0%6,
313,
789
279,
950
74,7
8035
4,73
046
8,26
37,
136,
781
Not
es)
Ass
umed
par
amet
ers
Load
ing
port
= R
as T
anur
a (S
audi
Ara
bia,
Ara
bian
Gul
f))
SCN
T/D
WT
=0.
501
Load
Fac
tor =
0.90
6
SUM
ED C
harg
es (U
S$) =
Car
go(M
T) x
1.07
(US$
/MT)
x1.
1
SC to
ll in
cas
e of
SU
MED
inte
grat
ion
=0.
63(U
S$/M
T)
(Oth
er c
harg
es) =
(Por
t due
s) +
(Age
ncy
fee,
etc
.) +
(Esc
ort t
ug p
aied
by
user
)1
tug
for a
ves
sel f
rom
70,
000S
CN
T la
den
to 9
0,00
0SC
NT
lade
n
(Por
t due
s) =
0.1
3US$
/SC
NT
2 tu
gs fo
r ove
r 90,
000S
CN
T la
den
(Age
ncy
fee,
etc
.) =
4,50
0US$
1 tu
g fo
r a v
esse
l ove
r 130
,000
SCN
T ba
llast
(Esc
ort t
ug p
aied
by
user
) = 6
,600
SDR
*1.3
0US$
/SC
NT*
(No.
of T
ug p
aied
by
user
)1
tug
for a
LN
G/L
PG o
ver 2
5,00
0SC
NT
(exc
ept G
F)
Suez
Can
al D
ues
Wor
ld S
cale
Suez
Can
al D
ues
5 - 33
Wor
ld S
cale
Wor
ld S
cale
Suez
Can
al D
ues
Wor
ld S
cale
O-D
Dis
tanc
e (s
ingl
e w
ay)
Ves
sel S
ize
Rou
te
C/C
C/S
S/S
S/S
+ SU
MED
Inte
grat
ion
Suez
Can
al D
ues
Wor
ld S
cale
Suez
Can
al D
ues
Wor
ld S
cale
Wor
ld S
cale
Suez
Can
al D
ues
Wor
ld S
cale
C/C
C/S
S/S
S/S
+ SU
MED
Inte
grat
ion
O-D
Dis
tanc
e (s
ingl
e w
ay)
Ves
sel S
ize
Rou
te
Tab
le 5
.7.4
Shi
pper
s'/C
onsi
gnee
s' Pa
ymen
t Cal
cula
tion
for C
rude
Oil
Tra
nspo
rt (C
omm
on C
arrie
rs)

5 - 34
Main O-D pairs for Tankers of Crude Oil transiting the Canal are from the Arabian Gulf for Mediterranean (vessel size: 40,000SCNT - 80,000SCNT) and for NW. Europe (vessel size: VLCC by using SUMED integration). In case of ballast, main O-D pairs are from America, NW. Europe and Mediterranean (vessel size: VLCC) to the Arabian Gulf. (see section A.4 of Appendix A)
Table 5.7.5 Number of Vessel Transiting the Canal (Tankers of Crude Oil) Direction Laden Ballast Total Northbound 71 2 73 Southbound 4 213 217 Total 75 215 290
Source) Analyzed by the Study Team based on the SC transit database of 1999
On the other hand, main O-D pairs for Tankers of Crude Oil using the route via the Cape are from the Arabian Gulf for America and for NW. Europe (vessel size: VLCC)
Table 5.7.6 Crude Oil Transport from Arabian Gulf to America and Europe via Cape
Laden VLCC at full draught cannot transit the Canal because its maximum permissible draught is 62ft (from 2001). Ratio of the canal transit can roughly be estimated at 40% (=213/544) based on the above two Tables. The ratio of 40% is felt to be low, since VLCC in ballast can physically transit the Canal. Current basic toll level for Tankers of Crude Oil can basically be judged appropriate since standard O-D for tariff of Tankers of Crude Oil is set at the Arabian Gulf - NW. Europe, while SCA provides the reduction for VLCC in ballast coming from America to Arabian Gulf where saved distance is less than standard one.
Vessel Size (1000DWT)(up to) US Gulf Carrebian N. Europe & UK S. Europe $ N Africa Others Total
25 0 0 0 0 0 050 0 0 0 0 1 175 1 0 0 0 0 1
100 4 0 0 1 1 6125 1 0 1 0 0 2150 6 0 0 0 1 7175 6 0 1 1 0 8200 0 0 0 0 0 0225 0 0 0 0 0 0250 6 1 0 0 1 8275 39 8 10 0 5 62300 67 4 77 21 15 184325 107 11 15 0 22 155350 8 1 3 0 0 12375 23 5 5 0 0 33400 3 0 3 0 0 6425 28 1 4 0 0 33450 0 0 0 0 0 0475 14 1 0 0 0 15500 0 0 1 0 0 1
Rest 7 2 0 0 1 10
Total Number of Vessels 320 34 120 23 47 544
Total Cargo (1000MT) 94,340 10,404 30,723 3,541 12,500 151,508
Source) JAMRI, based on Lloyd's data of 1999
Destination

5 - 35
Comparing with calculation based on Equation-1 of section 5.1.3 and on certain assumptions (e.g. fuel cost = 100US$/ton, exchange rate = 1.30US$/SDR), the following observations can be made (threshold criteria: plus or minus 10%).
Current toll levels for Tankers of Crude Oil are a little lower for the vessels greater than 10,000SCNT than the calculated level when using standard saved distance of 4,700 miles and almost the same level for the vessels of 5,000SCNT.
Saved distance at maximum relative toll revenue is 2,600 miles. (see section 5.6.2)
Table 5.7.7 Toll Comparison (Tankers of Crude Oil, Laden)
As to the reduction for VLCC in ballast coming from America to Arabian Gulf, current discount rates of 45% for the Mexican Guff and 55% for the Caribbean Zone should be raised since saved cost ratios to standard saved distance of 4,700 miles are calculated as 49% for the Mexican Gulf (saved distance: 2,600 miles) and 35% for the Caribbean Zone (saved distance: 2,000 miles). It should be noted that a limited number of tankers whose size is less than VLCC are also deployed at the O-D of the Arabian Gulf - America, while the target of the current reduction is only VLCC in ballast. 5.7.3 Proposition Current toll levels for Tankers of Crude Oil are a little lower for the vessels greater than 10,000SCNT than the calculated level when using standard saved distance of 4,700 miles and almost the same level for the vessels of 5,000SCNT. Accordingly, it is thought to be possible to increase toll revenue by raising tolls for the vessels more than 10,000SCNT. However, the calculation is based on certain assumptions, so it is thought to be necessary to carefully monitor the shipping market and world trade before and after the revision is made in order to verify whether these assumptions are appropriate or not. The Study Team would like to propose that the tolls for Tankers of Crude Oil be raised by
(US$)Toll Standard Saved
Distance (miles)Average
5,000 10,000 20,000 40,000 70,000 110,000 160,000 220,000Current Toll a 42,185 65,715 107,965 144,365 198,965 261,885 340,535 434,915Calculation 4,700 b 44,863 91,405 159,013 192,328 242,300 295,200 378,486 478,428
2,600 c 19,816 45,106 81,590 98,188 123,082 142,547 184,037 233,8262,000 d 12,660 31,877 59,469 71,290 89,020 98,931 128,481 163,940
Comparison b/a 1.06 1.39 1.47 1.33 1.22 1.13 1.11 1.10 1.23c/a 0.47 0.69 0.76 0.68 0.62 0.54 0.54 0.54 0.60d/a 0.30 0.49 0.55 0.49 0.45 0.38 0.38 0.38 0.43c/b 0.44 0.49 0.51 0.51 0.51 0.48 0.49 0.49 0.49d/b 0.28 0.35 0.37 0.37 0.37 0.34 0.34 0.34 0.35
Note) Exchange rate = 1.30 US$/SDRSource) The Study Team
Vessel Size (SCNT)

5 - 36
3% as the first step. A step-by-step approach to revising the tolls will make it possible to observe the reactions of the shipping market. As to the reduction for VLCC in ballast coming from America to Arabian Gulf, the Study Team would like to propose that discount rates be raised to 51% (=100%-49%) for the Mexican Guff and 65% (=100%-35%) for the Caribbean Zone based on comparison of the cases when the standard saved distance of 4,700 miles, 2,600 miles and 2,000 miles are applied. In addition, discounts should not be limited to VLCC in ballast. 5.7.4 Conclusion Current basic toll level for Tankers of Crude Oil can basically be judged appropriate since standard O-D for tariff of Tankers of Crude Oil is set at the Arabian Gulf - NW. Europe, while SCA provides the reduction for VLCC in ballast coming from America to Arabian Gulf where saved distance is less than standard one. Current toll levels for Tankers of Crude Oil are a little lower for the vessels greater than 10,000SCNT than the calculated level when using standard saved distance of 4,700 miles and almost the same level for the vessels of 5,000SCNT. Accordingly, it is thought to be possible to increase toll revenue by raising tolls for the vessels more than 10,000SCNT. The Study Team would like to propose that the tolls for Tankers of Crude Oil be raised by 3% as the first step. A step-by-step approach to revising the tolls will make it possible to observe the reactions of the shipping market. As to the reduction for VLCC in ballast coming from America to Arabian Gulf, the Study Team would like to propose that discount rates be raised to 51% (=100%-49%) for the Mexican Guff and 65% (=100%-35%) for the Caribbean Zone based on comparison of the cases when the standard saved distance of 4,700 miles, 2,600 miles and 2,000 miles are applied. In addition, discounts should not be limited to VLCC in ballast.

5 - 37
5.8 Toll for Tankers of Petroleum Products 5.8.1 Current toll for Tankers of Petroleum Products Table 5.8.1 shows the current tariff for Tankers of Petroleum Products.
Table 5.8.1 Current Tariff (Tankers of Petroleum Products) (SDR/SCNT)
SCNT Vessel Type First 5000 Next 5000 Next 10000 Next 20000 Next 30000 Rest 2 (L) 6.75 3.77 3.43 1.93 1.93 1.93 2 (B) 5.52 3.08 2.77 1.19 1.19 1.03
Source) SCA
Current basic toll level is set based on the "World Scale" which shows market conditions of tanker freight. 5.8.2 Evaluation For common carriers, current basic toll level can basically be judged appropriate since it is set based on World Scale. On the other hand, common carriers (except VLCC) which participate in spot tanker market are said to represent only 30% of the world fleet, while the remaining 70% are said to be industrial carriers which are seldom affected by market conditions of tanker freight in case of Tankers of Petroleum Products. For industrial carriers, it is thought to be appropriate to set the basic toll level based on savings in shipping cost. As to vessel size of Tankers of Petroleum Products transiting the Canal, vessels under 70,000SCNT and under 40,000SCNT represent 98% and 82% of the total. Main O-D pairs for Tankers of Petroleum Products transiting the Canal are from the Arabian Gulf or SE. Asia for NW. Europe, and southbound from N. Mediterranean. There is no remarkable concentration in O-D pairs. (see section A.4 of Appendix A) On the other hand, according to JAMRI (Japan Maritime Research Institute), there are some Tankers of Petroleum Products using the route via the Cape, but their main O-D pair is from the Arabian Gulf to S. America and thus the cargo on this route is not considered to be potential Canal cargo.
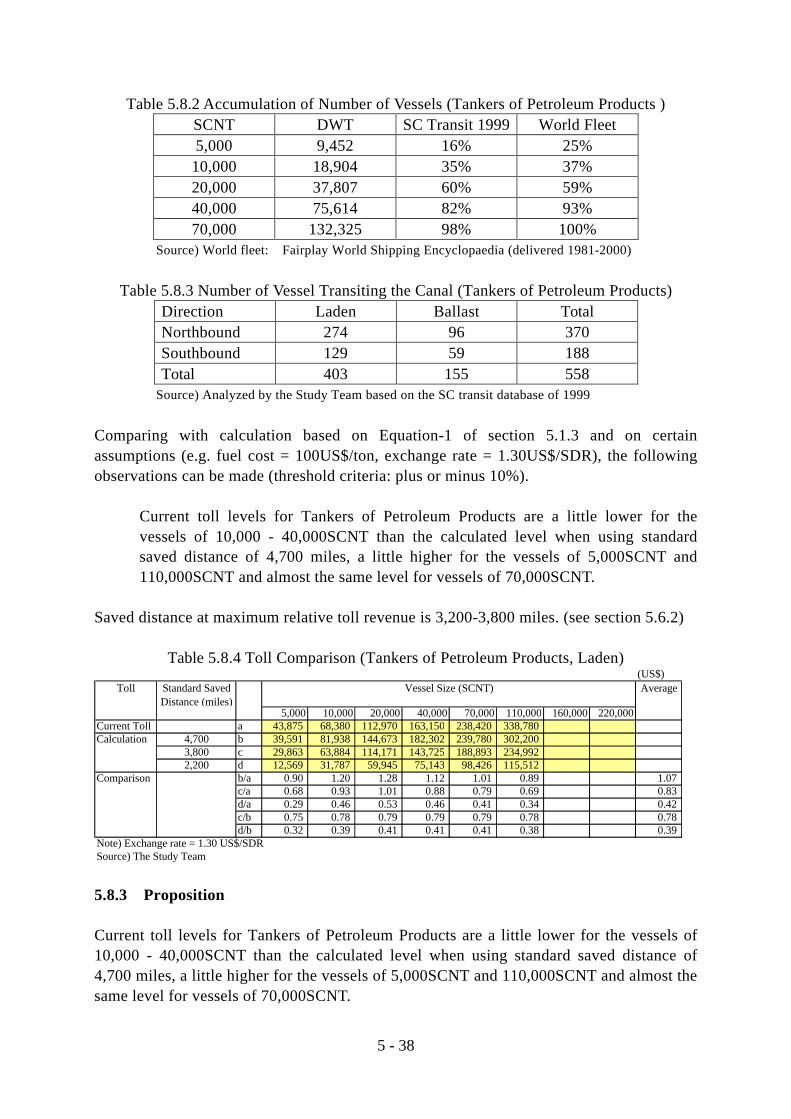
5 - 38
Table 5.8.2 Accumulation of Number of Vessels (Tankers of Petroleum Products ) SCNT DWT SC Transit 1999 World Fleet 5,000 9,452 16% 25% 10,000 18,904 35% 37% 20,000 37,807 60% 59% 40,000 75,614 82% 93% 70,000 132,325 98% 100%
Source) World fleet: Fairplay World Shipping Encyclopaedia (delivered 1981-2000)
Table 5.8.3 Number of Vessel Transiting the Canal (Tankers of Petroleum Products)
Direction Laden Ballast Total Northbound 274 96 370 Southbound 129 59 188 Total 403 155 558
Source) Analyzed by the Study Team based on the SC transit database of 1999
Comparing with calculation based on Equation-1 of section 5.1.3 and on certain assumptions (e.g. fuel cost = 100US$/ton, exchange rate = 1.30US$/SDR), the following observations can be made (threshold criteria: plus or minus 10%).
Current toll levels for Tankers of Petroleum Products are a little lower for the vessels of 10,000 - 40,000SCNT than the calculated level when using standard saved distance of 4,700 miles, a little higher for the vessels of 5,000SCNT and 110,000SCNT and almost the same level for vessels of 70,000SCNT.
Saved distance at maximum relative toll revenue is 3,200-3,800 miles. (see section 5.6.2)
Table 5.8.4 Toll Comparison (Tankers of Petroleum Products, Laden)
5.8.3 Proposition Current toll levels for Tankers of Petroleum Products are a little lower for the vessels of 10,000 - 40,000SCNT than the calculated level when using standard saved distance of 4,700 miles, a little higher for the vessels of 5,000SCNT and 110,000SCNT and almost the same level for vessels of 70,000SCNT.
(US$)Toll Standard Saved
Distance (miles)Average
5,000 10,000 20,000 40,000 70,000 110,000 160,000 220,000Current Toll a 43,875 68,380 112,970 163,150 238,420 338,780Calculation 4,700 b 39,591 81,938 144,673 182,302 239,780 302,200
3,800 c 29,863 63,884 114,171 143,725 188,893 234,9922,200 d 12,569 31,787 59,945 75,143 98,426 115,512
Comparison b/a 0.90 1.20 1.28 1.12 1.01 0.89 1.07c/a 0.68 0.93 1.01 0.88 0.79 0.69 0.83d/a 0.29 0.46 0.53 0.46 0.41 0.34 0.42c/b 0.75 0.78 0.79 0.79 0.79 0.78 0.78d/b 0.32 0.39 0.41 0.41 0.41 0.38 0.39
Note) Exchange rate = 1.30 US$/SDRSource) The Study Team
Vessel Size (SCNT)

5 - 39
Accordingly, it is thought to be possible to increase toll revenue by raising tolls for the vessels of 10,000 - 40,000SCNT. The Study Team would like to propose that the tolls for 10,000 - 40,000SCNT of Tankers of Petroleum Products be raised by 3% as the first step. A step-by-step approach to revising the tolls will make it possible to observe the reactions of the shipping market. As to the vessels of 5,000SCNT and 110,000SCNT of Tankers of Petroleum Products, it is thought to be appropriate to leave the toll as it is since there is no firm evidence that reducing the toll would increase toll revenues, although current toll level is a little higher than the calculated one. 5.8.4 Conclusion Current toll levels for Tankers of Petroleum Products are a little lower for the vessels of 10,000 - 40,000SCNT than the calculated level when using standard saved distance of 4,700 miles, a little higher for the vessels of 5,000SCNT and 110,000SCNT and almost the same level for vessels of 70,000SCNT. Accordingly, it is thought to be possible to increase toll revenue by raising tolls for the vessels of 10,000 - 40,000SCNT. The Study Team would like to propose that the tolls for 10,000 - 40,000SCNT of Tankers of Petroleum Products be raised by 3% as the first step. A step-by-step approach to revising the tolls will make it possible to observe the reactions of the shipping market. As to the vessels of 5,000SCNT and 110,000SCNT of Tankers of Petroleum Products, it is thought to be appropriate to leave the toll as it is since there is no firm evidence that reducing the toll would increase toll revenues.
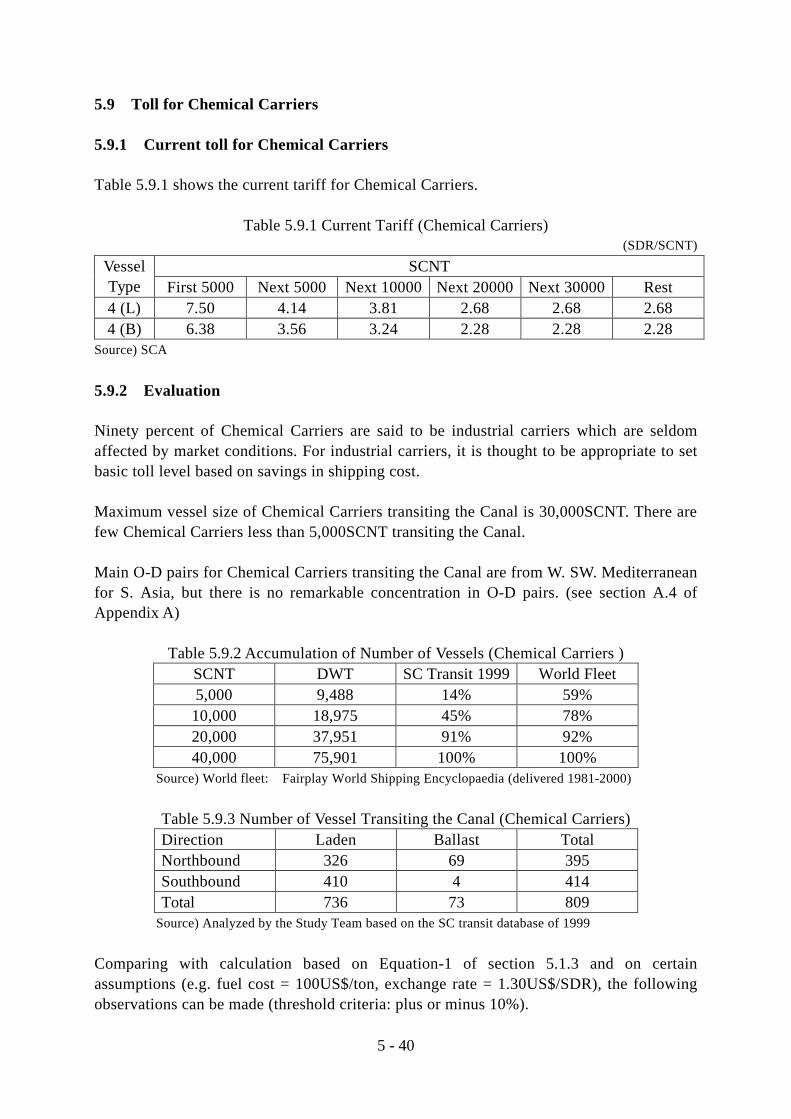
5 - 40
5.9 Toll for Chemical Carriers 5.9.1 Current toll for Chemical Carriers Table 5.9.1 shows the current tariff for Chemical Carriers.
Table 5.9.1 Current Tariff (Chemical Carriers) (SDR/SCNT)
SCNT Vessel Type First 5000 Next 5000 Next 10000 Next 20000 Next 30000 Rest 4 (L) 7.50 4.14 3.81 2.68 2.68 2.68 4 (B) 6.38 3.56 3.24 2.28 2.28 2.28
Source) SCA
5.9.2 Evaluation Ninety percent of Chemical Carriers are said to be industrial carriers which are seldom affected by market conditions. For industrial carriers, it is thought to be appropriate to set basic toll level based on savings in shipping cost. Maximum vessel size of Chemical Carriers transiting the Canal is 30,000SCNT. There are few Chemical Carriers less than 5,000SCNT transiting the Canal. Main O-D pairs for Chemical Carriers transiting the Canal are from W. SW. Mediterranean for S. Asia, but there is no remarkable concentration in O-D pairs. (see section A.4 of Appendix A)
Table 5.9.2 Accumulation of Number of Vessels (Chemical Carriers ) SCNT DWT SC Transit 1999 World Fleet 5,000 9,488 14% 59% 10,000 18,975 45% 78% 20,000 37,951 91% 92% 40,000 75,901 100% 100%
Source) World fleet: Fairplay World Shipping Encyclopaedia (delivered 1981-2000)
Table 5.9.3 Number of Vessel Transiting the Canal (Chemical Carriers) Direction Laden Ballast Total Northbound 326 69 395 Southbound 410 4 414 Total 736 73 809
Source) Analyzed by the Study Team based on the SC transit database of 1999
Comparing with calculation based on Equation-1 of section 5.1.3 and on certain assumptions (e.g. fuel cost = 100US$/ton, exchange rate = 1.30US$/SDR), the following observations can be made (threshold criteria: plus or minus 10%).

5 - 41
Current toll levels for Chemical Carriers are a little lower for the vessels greater than 10,000SCNT than the calculated level when using standard saved distance of 4,700 miles and almost the same level for the vessels of 5,000SCNT.
Saved distance at maximum relative toll revenue is 3,200-3,500 miles. (see section 5.6.2)
Table 5.9.4 Toll Comparison (Chemical Carriers, Laden)
5.9.3 Proposition Current toll levels for Chemical Carriers are a little lower for the vessels greater than 10,000SCNT than the calculated level when using standard saved distance of 4,700 miles and almost the same level for the vessels of 5,000SCNT. Accordingly, it is thought to be possible to increase toll revenue by raising tolls for the vessels greater than 10,000SCNT. The Study Team would like to propose that the tolls for the vessels greater than 10,000SCNT of Chemical Carriers be raised by 3% as the first step. A step-by-step approach to revising the tolls will make it possible to observe the reactions of the shipping market. 5.9.4 Conclusion Current toll levels for Chemical Carriers are a little lower for the vessels greater than 10,000SCNT than the calculated level when using standard saved distance of 4,700 miles and almost the same level for the vessels of 5,000SCNT. Accordingly, it is thought to be possible to increase toll revenue by raising tolls for the vessels greater than 10,000SCNT. The Study Team would like to propose that the tolls for the vessels greater than 10,000SCNT of Chemical Carriers be raised by 3% as the first step. A step-by-step approach to revising the tolls will make it possible to observe the reactions of the shipping market.
(US$)Toll Standard Saved
Distance (miles)Average
5,000 10,000 20,000 40,000 70,000 110,000 160,000 220,000Current Toll a 48,750 75,660 125,190 194,870 299,390 438,750Calculation 4,700 b 48,692 100,293 181,014 252,531 358,873 484,296
3,300 c 30,597 66,335 122,028 170,274 241,989 322,0282,100 d 15,087 37,229 71,468 99,767 141,802 182,942
Comparison b/a 1.00 1.33 1.45 1.30 1.20 1.10 1.23c/a 0.63 0.88 0.97 0.87 0.81 0.73 0.82d/a 0.31 0.49 0.57 0.51 0.47 0.42 0.46c/b 0.63 0.66 0.67 0.67 0.67 0.66 0.66d/b 0.31 0.37 0.39 0.40 0.40 0.38 0.37
Note) Exchange rate = 1.30 US$/SDRSource) The Study Team
Vessel Size (SCNT)

5 - 42
5.10 Toll for LNG Carriers 5.10.1 Current toll for LNG Carriers For LNG Carriers, following discount system is applied in addition to the basic tolls as shown in Table 5.10.1
- Reduction of 35% regardless of destination for ballast and loaded carrier - Volume incentives for LNG Carriers
Table 5.10.1 Current Tariff (LNG Carriers)
(SDR/SCNT)
SCNT Vessel Type First 5000 Next 5000 Next 10000 Next 20000 Next 30000 Rest 4 (L) 7.50 4.14 3.81 2.68 2.68 2.68 4 (B) 6.38 3.56 3.24 2.28 2.28 2.28
Source) SCA
Current tolls including the generous discount of 35% are set to bolster the price competitiveness of Arabian LNG against Algerian LNG in EU market. 5.10.2 Evaluation Vessel size of LNG Carriers transiting the Canal ranges from 40,000SCNT to 80,000SCNT. Main O-D pairs for LNG Carriers transiting the Canal are from the Arabian Gulf for W. Mediterranean (mainly for Spain) and back in ballast. (see section A.4 of Appendix A)
Table 5.10.2 Number of Vessel Transiting the Canal (LNG Carriers) Direction Laden Ballast Total Northbound 29 3 32 Southbound 0 31 31 Total 29 34 63
Source) Analyzed by the Study Team based on the SC transit database of 1999
Almost 100% of LNG Carriers are said to be industrial carriers which are seldom affected by market conditions. There is no market for common carriers since LNG trade itself is conducted based on long-term purchase contracts in order to ensure a long-term stable supply. Table 5.10.3 shows LNG Prices at exporting and importing countries. The exporting price FOB of Qatar LNG tends to be higher than importing price CIF in Spain. This is thought to be caused by lower exporting price FOB of Algerian LNG..

5 - 43
Accordingly, it would be difficult to realize long-term and large quantity contracts between Qatar and Spain, even though the toll is free. LNG Carriers currently transiting the Canal should be seen as exceptional transport in order to partially adjust the balance of LNG trade. In this case, the price of LNG and also the transport cost including the canal toll are to be negotiated among interested parties. Current toll for LNG Carriers can be thought to be appropriate since it is necessary to bolster the price competitiveness of Arabian LNG against Algerian LNG in EU market, and it is set through negotiations with interested parties.
Table 5.10.3 LNG Price at Exporting and Importing Countries
Figure 5.10.1 LNG Price at Exporting and Importing Countries 5.10.3 Conclusion Current toll for LNG Carriers can be thought to be appropriate since it is necessary to bolster the price competitiveness of Arabian LNG against Algerian LNG in EU market, and it is set through negotiations with interested parties.
Country
1992 1993 1994 1995 1996 1997 1998
Algeria (FOB) Quantity (million MT) 15.56 14.97 14.62 10.84 15.07 18.28
Value (million US$) 1,899.5 1,690.0 1,314.6 1,096.7 1,624.9 2,428.3
Price (US$/MT) 122.1 112.9 89.9 101.2 107.8 132.8
Qatar (FOB) Quantity (million MT) 1.39 1.21
Value (million US$) 242.6 178.8
Price (US$/MT) 174.5 147.8
Spain (CIF) Quantity (million MT) 4.58 4.45 5.05 5.64 5.82 4.85 4.67
Value (million US$) 617.4 572.1 600.0 690.1 778.1 733.0 577.1
Price (US$/MT) 134.8 128.6 118.8 122.4 133.7 151.1 123.6
Japan (CIF) Quantity (million MT) 39.06 40.35 41.63 42.92 45.89 47.66 49.15
Value (million US$) 7,297.5 7,163.80 6,940.30 7,679.2 8,643.0 9,560.8 7,783.8
Price (US$/MT) 186.8 177.6 166.7 178.9 188.3 200.6 158.4
Note) Quantities in 1993 & 1994 of Japan are inserted using data of 1992 & 1995 by the Study Team.
Source) International Trade Statistics, UN
Year
0
50
100
150
200
250
1992 1993 1994 1995 1996 1997 1998
Year
Pric
e (U
S$/M
T)
Algeria (FOB) Qatar (FOB) Spain (CIF) Japan (CIF)

5 - 44
5.11 Toll for LPG Carriers 5.11.1 Current toll for LPG Carriers Table 5.11.1 shows the current tariff for LPG Carriers.
Table 5.11.1 Current Tariff (LPG Carriers) (SDR/SCNT)
SCNT Vessel Type First 5000 Next 5000 Next 10000 Next 20000 Next 30000 Rest 5 (L) 6.75 3.77 3.43 2.42 2.42 2.42 5 (B) 5.75 3.21 2.92 2.06 2.06 2.06
Source) SCA
5.11.2 Evaluation Almost 100% of LPG Carriers are said to be industrial carriers which are seldom affected by market conditions. For industrial carriers, it is thought to be appropriate to set basic toll level based on savings in shipping cost. Maximum vessel size of LPG Carriers transiting the Canal is 50,000SCNT. There are few LPG Carriers less than 5,000SCNT transiting the Canal. Main O-D pairs for LPG Carriers transiting the Canal are from the Arabian Gulf for E. SE. Mediterranean and from W. SW. Mediterranean for SE. Asia, but there is no remarkable concentration in O-D pairs. (see section A.4 of Appendix A)
Table 5.11.2 Accumulation of Number of Vessels (LPG Carriers) SCNT DWT SC Transit 1999 World Fleet 5,000 6,766 5% 65% 10,000 13,532 35% 77% 20,000 27,064 63% 85% 40,000 54,127 87% 97%
Source) World fleet: Fairplay World Shipping Encyclopaedia (delivered 1981-2000)
Table 5.11.3 Number of Vessel Transiting the Canal (LPG Carriers)
Direction Laden Ballast Total Northbound 69 101 170 Southbound 81 35 116 Total 150 136 286
Source) Analyzed by the Study Team based on the SC transit database of 1999
Comparing with calculation based on Equation-1 of section 5.1.3 and on certain assumptions (e.g. fuel cost = 100US$/ton, exchange rate = 1.30US$/SDR), the following observations can be made (threshold criteria: plus or minus 10%).

5 - 45
Current toll levels for LPG Carriers are a little lower for the vessels greater than 10,000SCNT than the calculated level when using standard saved distance of 4,700 miles and almost the same level for the vessels of 5,000SCNT.
Saved distance at maximum relative toll revenue is 5,900 miles. (see section 5.6.2)
Table 5.11.4 Toll Comparison (LPG Carriers, Laden)
5.11.3 Proposition Current toll levels for LPG Carriers are a little lower for the vessels greater than 10,000SCNT than the calculated level when using standard saved distance of 4,700 miles and almost the same level for the vessels of 5,000SCNT. Accordingly, it is thought to be possible to increase toll revenue by raising tolls for the vessels greater than 10,000SCNT. The Study Team would like to propose that the tolls for the vessels greater than 10,000SCNT of LPG Carriers be raised by 3% as the first step. A step-by-step approach to revising the tolls will make it possible to observe the reactions of the shipping market. 5.11.4 Conclusion Current toll levels for LPG Carriers are a little lower for the vessels greater than 10,000SCNT than the calculated level when using standard saved distance of 4,700 miles and almost the same level for the vessels of 5,000SCNT. Accordingly, it is thought to be possible to increase toll revenue by raising tolls for the vessels greater than 10,000SCNT. The Study Team would like to propose that the tolls for the vessels greater than 10,000SCNT of LPG Carriers be raised by 3% as the first step. A step-by-step approach to revising the tolls will make it possible to observe the reactions of the shipping market.
(US$)Toll Standard Saved
Distance (miles)Average
5,000 10,000 20,000 40,000 70,000 110,000 160,000 220,000Current Toll a 43,875 68,380 112,970 175,890 270,270 396,110Calculation 4,700 b 46,489 96,218 174,260 237,812 342,247 478,566
2,600 c 20,236 46,903 88,388 117,106 169,820 238,4872,000 d 12,736 32,813 63,854 82,618 120,555 169,894
Comparison b/a 1.06 1.41 1.54 1.35 1.27 1.21 1.31c/a 0.46 0.69 0.78 0.67 0.63 0.60 0.64d/a 0.29 0.48 0.57 0.47 0.45 0.43 0.45c/b 0.44 0.49 0.51 0.49 0.50 0.50 0.49d/b 0.27 0.34 0.37 0.35 0.35 0.36 0.34
Note) Exchange rate = 1.30 US$/SDRSource) The Study Team
Vessel Size (SCNT)
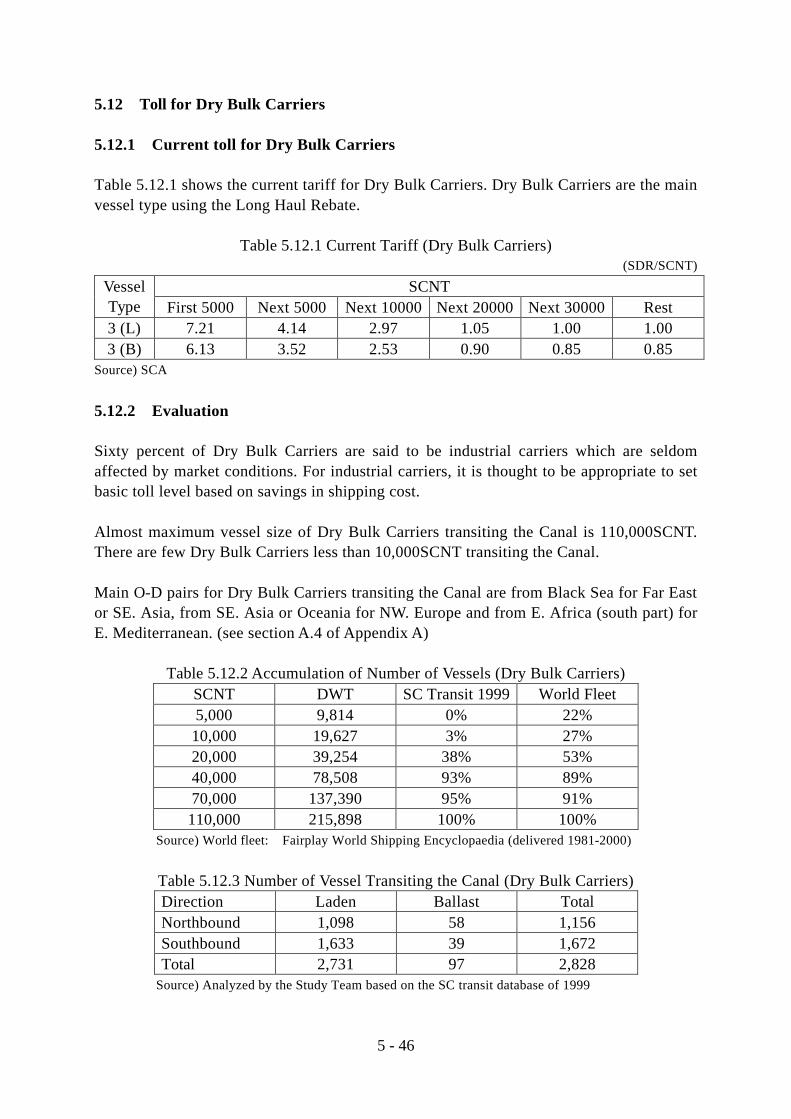
5 - 46
5.12 Toll for Dry Bulk Carriers 5.12.1 Current toll for Dry Bulk Carriers Table 5.12.1 shows the current tariff for Dry Bulk Carriers. Dry Bulk Carriers are the main vessel type using the Long Haul Rebate.
Table 5.12.1 Current Tariff (Dry Bulk Carriers) (SDR/SCNT)
SCNT Vessel Type First 5000 Next 5000 Next 10000 Next 20000 Next 30000 Rest 3 (L) 7.21 4.14 2.97 1.05 1.00 1.00 3 (B) 6.13 3.52 2.53 0.90 0.85 0.85
Source) SCA
5.12.2 Evaluation Sixty percent of Dry Bulk Carriers are said to be industrial carriers which are seldom affected by market conditions. For industrial carriers, it is thought to be appropriate to set basic toll level based on savings in shipping cost. Almost maximum vessel size of Dry Bulk Carriers transiting the Canal is 110,000SCNT. There are few Dry Bulk Carriers less than 10,000SCNT transiting the Canal. Main O-D pairs for Dry Bulk Carriers transiting the Canal are from Black Sea for Far East or SE. Asia, from SE. Asia or Oceania for NW. Europe and from E. Africa (south part) for E. Mediterranean. (see section A.4 of Appendix A)
Table 5.12.2 Accumulation of Number of Vessels (Dry Bulk Carriers) SCNT DWT SC Transit 1999 World Fleet 5,000 9,814 0% 22% 10,000 19,627 3% 27% 20,000 39,254 38% 53% 40,000 78,508 93% 89% 70,000 137,390 95% 91% 110,000 215,898 100% 100%
Source) World fleet: Fairplay World Shipping Encyclopaedia (delivered 1981-2000)
Table 5.12.3 Number of Vessel Transiting the Canal (Dry Bulk Carriers) Direction Laden Ballast Total Northbound 1,098 58 1,156 Southbound 1,633 39 1,672 Total 2,731 97 2,828
Source) Analyzed by the Study Team based on the SC transit database of 1999

5 - 47
Comparing with calculation based on Equation-1 of section 5.1.3 and on certain assumptions (e.g. fuel cost = 100US$/ton, exchange rate = 1.30US$/SDR), the following observations can be made (threshold criteria: plus or minus 10%).
Current toll levels for Dry Bulk Carriers are a little higher for the vessels of 5,000SCNT than the calculated one and almost the same level for the vessels greater than 10,000SCNT.
Saved distance at maximum relative toll revenue is 2,300 miles. (see section 5.6.2)
Table 5.12.4 Toll Comparison (Dry Bulk Carriers, Laden)
Dry Bulk Carriers are main vessel type using the Long Haul Rebate. Main O-D pairs where saved distances are less than 4,700 miles are as follows;
Oceania - NW. Europe (Saved distance = 2,300 miles) SE. Asia - NW. Europe (Saved distance = 3,500 miles) E. Africa(south) - Med. (Saved distance = 2,300 miles)
5.12.3 Proposition Current toll levels for Dry Bulk Carriers are a little higher for the vessels of 5,000SCNT than the calculated one and almost the same level for the vessels greater than 10,000SCNT. On the other hand, it is thought that there is little possibility of increasing toll revenues by reducing tolls for 5,000SCNT Dry Bulk Carriers since the share of the vessels less than 5,000SCNT transiting the Canal is small compared to the world fleet. If there is no increase in transit even after reducing tolls for 5,000SCNT Dry Bulk Carriers by 30%, toll revenue would decrease by around 0.6 million SDR (relating toll revenue in 1999 is estimated 0.2 million SDR for up to 5,000SCNT and 3.5 million SDR for from 5,000SCNT up to 10,000SCNT). However, it is thought to be appropriate to leave the toll for 5,000SCNT of Dry Bulk Carriers as it is since there is no firm evidence that reducing the toll would increase toll revenue, although current toll level is higher than calculated one and there is a little
(US$)Toll Standard Saved
Distance (miles)Average
5,000 10,000 20,000 40,000 70,000 110,000 160,000 220,000Current Toll a 46,865 73,775 112,385 139,685 178,685 230,685Calculation 4,700 b 32,204 66,965 118,323 148,385 193,478 239,876
3,500 c 21,557 47,218 85,013 106,498 138,725 167,9682,300 d 10,911 27,472 51,703 64,611 83,972 96,061
Comparison b/a 0.69 0.91 1.05 1.06 1.08 1.04 0.97c/a 0.46 0.64 0.76 0.76 0.78 0.73 0.69d/a 0.23 0.37 0.46 0.46 0.47 0.42 0.40c/b 0.67 0.71 0.72 0.72 0.72 0.70 0.70d/b 0.34 0.41 0.44 0.44 0.43 0.40 0.41
Note) Exchange rate = 1.30 US$/SDRSource) The Study Team
Vessel Size (SCNT)
5 - 48
possibility of increasing toll revenues by reducing tolls. The Study Team would like to propose that a fixed rebate rate system (see section 5.6.3) be applied to Dry Bulk Carriers, since Dry Bulk Carriers are the main vessel type using the Long Haul Rebate. Fixed rebate rates are obtained by Table 5.12.3 as follows;
Oceania - NW. Europe (Saved distance = 2,300 miles) 59% discount SE. Asia - NW. Europe (Saved distance = 3,500 miles) 30% discount E. Africa(south) - Med. (Saved distance = 2,300 miles) 59% discount
5.12.4 Conclusion Current toll levels for Dry Bulk Carriers are a little higher for the vessels of 5,000SCNT than the calculated one and almost the same level for the vessels greater than 10,000SCNT. As to the vessels of 5,000SCNT, it is thought to be appropriate to leave the tolls as it is since there is no firm evidence that reducing the toll would increase toll revenue. The Study Team would like to propose that a fixed rebate rate system (see section 5.6.3) be applied to Dry Bulk Carriers since Dry Bulk Carriers are the main vessel type using the Long Haul Rebate. Fixed rebate rates given in Table 5.14.4 are as follows:
Oceania - NW. Europe (Saved distance = 2,300 miles) 59% discount SE. Asia - NW. Europe (Saved distance = 3,500 miles) 30% discount E. Africa(south) - Med. (Saved distance = 2,300 miles) 59% discount

5 - 49
5.13 Toll for Container Ships 5.13.1 Current toll for Container Ships Table 5.13.1 shows the current tariff for Container Ships. The Long Haul Rebate is not applied to Container Ships. The weather deck surcharge is applied to Container Ships as follows. Average weighted surcharge rate in 1999 was 9.7% based on the data provided by SCA.
6%: up to 3 tiers of containers 8%: 4 tiers of containers 10%: 5 tiers of containers 14%: more than 5 tiers of containers
Table 5.13.1 Current Tariff (Container Ships)
(SDR/SCNT)
SCNT Vessel Type First 5000 Next 5000 Next 10000 Next 20000 Next 30000 Rest 6 (L) 7.21 4.10 3.37 2.42 2.42 1.83 6 (B) 6.13 3.49 2.87 2.06 2.06 1.56
Source) SCA
5.13.2 Evaluation Container transportation system has the following peculiarities:
- Regular service on specific liner route - Using container boxes - High value cargoes per ton
For Container Ships, it is thought to be appropriate to set basic toll level based on savings in shipping cost since there is almost no time to spare in operation because of regular service. In case that there is enough time to spare until next operation after transiting the Canal, savings perceived by shipping lines are only in fuel cost (variable cost). Savings in managing cost (basically fixed cost) are not perceived. Full savings in managing cost are perceived only when shipping lines can fully utilize days saved by using the Canal for their next operation. In container transportation system accounting, capital cost for each container box is calculated in "US$/day" when each container box is registered with container number into container fleet immediately after the purchase. (see section 1.1.2 (b) of ANNEX 4) Accordingly, the container box capital cost can be counted in the estimation of savings in shipping cost.

5 - 50
Although the container box capital cost varies according to the purchase price and so forth, "Per Diem Charge" is said to be US$ 2 - 2.5 per day. This Per Diem Charge is levied and collected from shippers when they use container boxes over the free use period included in the freight charge. Capital cost of container box in the shipping lines' accounting is thought to be lower than the Per Diem Charge. Accordingly, container box capital cost to be counted in the estimation of savings in shipping cost can be set at around US$ 1. Savings in inventory cost can also be counted in the estimation of savings by using the Canal since commodity value per ton of container cargoes is significantly higher than that transported by Tankers or Dry Bulk Carriers. According to a survey conducted in October 1999 by the Japanese Ministry of Transport, average FOB price of exporting container cargoes was 2,887US$/ton (minimum: Grains & Cereals: 479US$/ton, maximum: Medicines: 10,419US$/ton), and average CIF price of importing container cargoes was 1,663US$/ton (minimum: Crude Minerals: 316US$/ton, Maximum: Medicines: 7,350US$/ton). Average FOB price of exporting container cargoes in Japan is greatly higher than average CIF price of importing container cargoes, reflecting the peculiarity of industrial advanced countries. Average value of container cargoes passing through the Canal is thought to be lower than that of Japanese container cargoes due to the variety of O-D pairs of cargoes passing through the Canal. Accordingly, the inventory cost to be counted in the estimation of savings can be set at around US$ 1,000. On the other hand, according to SCA, the time sensitive cargoes represent around 30% (westbound: 40%, eastbound: 20%) of the total container cargoes, although the definition of "time sensitive cargoes" and their average prices are unknown.

Exp/Imp Commodity Items Item No. Commodity Volume Share Accumulation Commodity Value(1000JP¥) (US$) (Freight-ton) (1000US$)
Export Grains & Cereals 102 56 479 37,729 1% 1% 18,058Export Fertilizer 112 83 709 2,649 0% 1% 1,879Export Gum Products 114 87 744 444,267 9% 10% 330,352Export Fibers 106 104 889 99,218 2% 12% 88,194Export Fossil Fuel 107 107 915 15,455 0% 12% 14,134Export Paper & Paper Products 115 117 1,000 149,787 3% 15% 149,787Export Plastics 113 130 1,111 521,305 10% 25% 579,228Export Fruits & Vegetables 103 136 1,162 8,030 0% 25% 9,334Export Crude Gum 105 136 1,162 56,173 1% 27% 65,295Export Glass etc. 117 136 1,162 176,019 4% 30% 204,603Export Drink & Cigarettes 104 175 1,496 22,249 0% 31% 33,278Export Oils & Fats 108 182 1,556 2,671 0% 31% 4,155Export Steel 118 191 1,632 96,914 2% 33% 158,210Export Chemical Compounds 109 219 1,872 261,286 5% 38% 489,074Export Transport Apparatus 123 260 2,222 946,926 19% 57% 2,104,280Export Nonferrous Metal 119 380 3,248 72,050 1% 58% 234,009Export Fishes & Shellfishes 101 381 3,256 12,313 0% 58% 40,096Export Reexport Cargo 127 395 3,376 52,817 1% 59% 178,314Export Textiles 116 412 3,521 118,692 2% 62% 417,958Export Metal Products 120 424 3,624 67,105 1% 63% 243,184Export Ordinary Machines 121 499 4,265 1,000,533 20% 83% 4,267,230Export Dyestuffs etc. 110 530 4,530 33,786 1% 84% 153,048Export Other Products 126 580 4,957 180,290 4% 87% 893,745Export Precision Instrument 125 627 5,359 152,708 3% 90% 818,358Export Clothes 124 636 5,436 2,796 0% 90% 15,199Export Electrical Products 122 703 6,009 478,131 10% 100% 2,872,873Export Medicines 111 1219 10,419 4,537 0% 100% 47,270 Total Export 5,016,436 14,431,146 Weighted Average 2,877Import Crude Minerals 216 37 316 75,124 1% 1% 23,757Import Fertilizer 207 41 350 321,918 6% 8% 112,809Import Timber 213 58 496 271,523 5% 13% 134,601Import Pulp 214 58 496 68,259 1% 14% 33,838Import Fossil Fuel 219 58 496 27,196 1% 14% 13,482Import Seeds & Nuts for Oil 211 61 521 38,201 1% 15% 19,917Import Grains & Cereals 204 71 607 102,945 2% 17% 62,471Import Wooden Products 228 76 650 137,040 3% 20% 89,017Import Furniture 238 84 718 251,268 5% 25% 180,398Import Nonmetal Mineral Products 231 88 752 196,412 4% 28% 147,729Import Crude Gum 212 96 821 78,622 1% 30% 64,510Import Paper & Paper Products 229 110 940 94,887 2% 32% 89,210Import Fruits & Vegetables 205 117 1,000 352,965 7% 38% 352,965Import Gum Products 227 137 1,171 52,377 1% 39% 61,330Import Other Materials 218 147 1,256 68,909 1% 41% 86,578Import Plastics 225 151 1,291 126,183 2% 43% 162,852Import Oils & Fats 220 161 1,376 13,345 0% 43% 18,364Import Textiles 230 164 1,402 191,848 4% 47% 268,915Import Shoes 240 164 1,402 99,989 2% 49% 140,156Import Other Products 242 168 1,436 375,212 7% 56% 538,766Import Other Foods 208 175 1,496 44,566 1% 57% 66,659Import Metal Products 234 178 1,521 115,933 2% 59% 176,377Import Steel 232 181 1,547 44,472 1% 60% 68,799Import Metal Materials 217 182 1,556 44,713 1% 61% 69,554Import Fibers 215 193 1,650 48,502 1% 61% 80,008Import Other Chemical Products 226 200 1,709 84,879 2% 63% 145,092Import Coffee etc. 206 228 1,949 81,728 2% 65% 159,265Import Drink 209 231 1,974 94,556 2% 66% 186,687Import Transport Apparatus 237 234 2,000 114,519 2% 69% 229,038Import Chemical Compounds 221 276 2,359 167,144 3% 72% 394,288Import Dairy Products 202 282 2,410 17,883 0% 72% 43,103Import Clothes 239 288 2,462 361,381 7% 79% 889,553Import Electrical Products 236 301 2,573 352,386 7% 86% 906,566Import Nonferrous Metal 233 302 2,581 88,816 2% 87% 229,252Import Dyestuffs etc. 222 321 2,744 18,396 0% 88% 50,471Import Precision Instrument 241 335 2,863 45,735 1% 89% 130,951Import Cosmetics etc. 224 349 2,983 26,964 1% 89% 80,431Import Meats 201 375 3,205 175,357 3% 92% 562,042Import Ordinary Machines 235 461 3,940 174,274 3% 96% 686,669Import Reimport Cargo 243 461 3,940 26,874 1% 96% 105,888Import Fishes & Shellfishes 203 515 4,402 149,788 3% 99% 659,323Import Cigarettes 210 528 4,513 41,173 1% 100% 185,806Import Medicines 223 860 7,350 8,436 0% 100% 62,008 Total Import 5,272,698 8,769,492 Weighted Average 1,663 Total Export + Import 10,289,134 23,200,638 Weighted Average 2,255Notes) 1. These data were collected in October 1998 for one month at major Japanese ports.
2. Commodity Values are expressed at FOB in export and CIF in import.3. Currency exchange rate in October 1998: 117 JP¥/US$
Source) Japanese Ministry of Transport
Commodity Value per Freight-ton
Table 5.13.2 Distribution of Commodity Value in Container
Figure 5.13.1 Distribution of Commodity Value in Container
5 - 51
0%
20%
40%
60%
80%
100%
0 1,000 2,000 3,000 4,000 5,000 6,000 7,000Commodity Value (US$/Freight-ton)
Acc
umul
atio
n of
Car
goV
olum
e
Import Export

5 - 52
Vessel size of Container Ships transiting the Canal is less than 90,000SCNT. Main O-D pairs for Container Ships transiting the Canal are SE Asia - NW. Europe, but it should be noted that Container Ships have peculiarity of calling plural ports. (see section A.4 of Appendix A)
Table 5.13.3 Number of Vessel Transiting the Canal (Container Ships) Direction Laden Ballast Total Northbound 2,183 9 2,192 Southbound 2,155 28 2,183 Total 4,338 37 4,375
Source) Analyzed by the Study Team based on the SC transit database of 1999
Comparing with calculation based on Equation-1 of section 5.1.3 and on certain assumptions (e.g. fuel cost = 100US$/ton, exchange rate = 1.30US$/SDR), the following observations can be made (threshold criteria: plus or minus 10%). Case-1: without considering container box capital cost nor inventory cost
Current toll levels (after weather deck surcharge is applied) are a little lower for the vessels of 10,000 - 20,000SCNT than the calculated level when using standard saved distance of 4,700 miles, a little higher for the vessels greater than 70,000SCNT and almost the same level for the vessels of 5,000SCNT and 40,000SCNT.
Case-2: with considering container box capital only
Current toll levels (after weather deck surcharge is applied) are a little lower for the vessels of 10,000 - 40,000SCNT than the calculated level when using standard saved distance of 4,700 miles, a little higher for the vessels of 110,000SCNT and almost the same level for the vessels of 5,000SCNT and 70,000SCNT.
Case-3: with container box capital cost and inventory cost (cargo value: 300US$/ton)
Current toll levels (after weather deck surcharge is applied) are a little lower for the vessels of 10,000 - 40,000SCNT than the calculated level when using standard saved distance of 4,700 miles and almost the same level for the vessels of 5,000SCNT, 70,000SCNT and 110SCNT.
Case-4: with container box capital cost and inventory cost (cargo value: 1,000US$/ton)
Current toll levels (after weather deck surcharge is applied) are a little lower for the vessels of 10,000 - 70,000SCNT than the calculated level when using standard saved distance of 4,700 miles and almost the same level for the vessels of 5,000SCNT and 110,000SCNT.

5 - 53
Table 5.13.4 Toll Comparison (Container Ships, Laden, Case-1)
Table 5.13.5 Toll Comparison (Container Ships, Laden, Case-2)
(US$)Toll Standard Saved
Distance (miles)Average
5,000 10,000 20,000 40,000 70,000 110,000 160,000 220,000Current Toll a 46,865 73,515 117,325 180,245 274,625 369,785
b 51,411 80,646 128,706 197,729 301,264 405,654Calculation 4,700 c 47,227 94,605 165,989 215,099 272,105 312,543
3,500 d 32,484 67,130 119,087 153,484 193,105 216,4843,200 e 28,798 60,261 107,361 138,080 173,355 192,469
Comparison c/a 1.01 1.29 1.41 1.19 0.99 0.85 1.12d/a 0.69 0.91 1.02 0.85 0.70 0.59 0.79e/a 0.61 0.82 0.92 0.77 0.63 0.52 0.71c/b 0.92 1.17 1.29 1.09 0.90 0.77 1.02d/b 0.63 0.83 0.93 0.78 0.64 0.53 0.72e/b 0.56 0.75 0.83 0.70 0.58 0.47 0.65d/c 0.69 0.71 0.72 0.71 0.71 0.69 0.71e/c 0.61 0.64 0.65 0.64 0.64 0.62 0.63
Note) Case-1: without condidering container box capital cost nor inventory cost Current toll (b) show toll after weather-deck surcherge of 9.7%. Exchange rate = 1.30 US$/SDRSource) The Study Team
Vessel Size (SCNT)
(US$)Toll Standard Saved
Distance (miles)Average
5,000 10,000 20,000 40,000 70,000 110,000 160,000 220,000Current Toll a 46,865 73,515 117,325 180,245 274,625 369,785
b 51,411 80,646 128,706 197,729 301,264 405,654Calculation 4,700 c 49,885 99,797 175,877 232,896 301,125 356,043
3,500 d 34,397 70,865 126,187 166,210 213,793 247,4283,200 e 30,525 63,632 113,764 149,538 191,959 220,274
Comparison c/a 1.06 1.36 1.50 1.29 1.10 0.96 1.21d/a 0.73 0.96 1.08 0.92 0.78 0.67 0.86e/a 0.65 0.87 0.97 0.83 0.70 0.60 0.77c/b 0.97 1.24 1.37 1.18 1.00 0.88 1.10d/b 0.67 0.88 0.98 0.84 0.71 0.61 0.78e/b 0.59 0.79 0.88 0.76 0.64 0.54 0.70d/c 0.69 0.71 0.72 0.71 0.71 0.69 0.71e/c 0.61 0.64 0.65 0.64 0.64 0.62 0.63
Note) Case-2: with considering container box capital cost only Current toll (b) show toll after weather-deck surcherge of 9.7%. Exchange rate = 1.30 US$/SDRSource) The Study Team
Vessel Size (SCNT)

5 - 54
Table 5.13.6 Toll Comparison (Container Ships, Laden, Case-3)
Table 5.13.7 Toll Comparison (Container Ships, Laden, Case-4)
Earning capacity is considered to be appropriate for the denominator unit of toll rates for merchant vessels. And the earning capacity of a vessel is expressed in Net Tonnage (SCNT at the Canal) which is obtained by deducting the spaces directly for navigation from Gross Tonnage. As mentioned above, the container box capital cost can be counted in the estimation of savings in shipping cost. In other words, the earning capacity of Container Ships increases as the number of container boxes increases. From this point of view, current weather deck surcharge is thought to be rational since SCNT is set as a basic earning capacity and complemented by an additional earning capacity of container boxes on the weather deck. However, the weather deck surcharge, which is levied based on number of tiers, sometimes forces shipping lines to perform unnecessary container handling for reducing the number of tiers. In addition, shipping lines operating Container Ships are given the impression that they are excessively charged since
(US$)Toll Standard Saved
Distance (miles)Average
5,000 10,000 20,000 40,000 70,000 110,000 160,000 220,000Current Toll a 46,865 73,515 117,325 180,245 274,625 369,785
b 51,411 80,646 128,706 197,729 301,264 405,654Calculation 4,700 c 51,797 103,468 182,602 243,850 316,758 376,134
3,500 d 35,773 73,504 131,016 174,043 224,937 261,7203,200 e 31,766 66,013 118,119 156,591 201,982 233,116
Comparison c/a 1.11 1.41 1.56 1.35 1.15 1.02 1.27d/a 0.76 1.00 1.12 0.97 0.82 0.71 0.90e/a 0.68 0.90 1.01 0.87 0.74 0.63 0.80c/b 1.01 1.28 1.42 1.23 1.05 0.93 1.15d/b 0.70 0.91 1.02 0.88 0.75 0.65 0.82e/b 0.62 0.82 0.92 0.79 0.67 0.57 0.73d/c 0.69 0.71 0.72 0.71 0.71 0.70 0.71e/c 0.61 0.64 0.65 0.64 0.64 0.62 0.63
Note) Case-3: with considering container box capital cost & inventory cost (cargo value: 300US$/ton) Current toll (b) show toll after weather-deck surcherge of 9.7%. Exchange rate = 1.30 US$/SDRSource) The Study Team
Vessel Size (SCNT)
(US$)Toll Standard Saved
Distance (miles)Average
5,000 10,000 20,000 40,000 70,000 110,000 160,000 220,000Current Toll a 46,865 73,515 117,325 180,245 274,625 369,785
b 51,411 80,646 128,706 197,729 301,264 405,654Calculation 4,700 c 56,261 112,036 198,294 269,409 353,235 423,014
3,500 d 38,983 79,664 142,283 192,319 250,941 295,0673,200 e 34,663 71,571 128,280 173,046 225,367 263,080
Comparison c/a 1.20 1.52 1.69 1.49 1.29 1.14 1.39d/a 0.83 1.08 1.21 1.07 0.91 0.80 0.98e/a 0.74 0.97 1.09 0.96 0.82 0.71 0.88c/b 1.09 1.39 1.54 1.36 1.17 1.04 1.27d/b 0.76 0.99 1.11 0.97 0.83 0.73 0.90e/b 0.67 0.89 1.00 0.88 0.75 0.65 0.81d/c 0.69 0.71 0.72 0.71 0.71 0.70 0.71e/c 0.62 0.64 0.65 0.64 0.64 0.62 0.63
Note) Case-4: with considering container box capital cost & inventory cost (cargo value: 1,000US$/ton) Current toll (b) show toll after weather-deck surcherge of 9.7%. Exchange rate = 1.30 US$/SDRSource) The Study Team
Vessel Size (SCNT)

5 - 55
the weather deck surcharge is applied to almost transits of Container Ships (see Table 5.13.8).
Table 5.13.8 Surcharge for Containers over Weather Deck Tier 0 1 2 3 4 5 6 7 Total
Surcharge Rate 0% 6% 6% 6% 8% 10% 14% 14% Share of Loaded Vessels in 1999
0% 0% 1% 10% 29% 41% 15% 4% 100%
Source) Economic Unit of SCA
Distribution of ratio of carried containers (both loaded and empty) in TEUs to nominal capacity of a vessel in 1999 is shown in Table 5.13.9.
Table 5.13.9 Distribution of Ratio of Carried Containers to Nominal Capacity Ratio of Carried Containers to
Nominal Capacity Number of
Container Ships Share
0 70 2% up to 0.1 5 0% up to 0.2 14 0% up to 0.3 17 0% up to 0.4 39 1% up to 0.5 79 2% up to 0.6 194 4% up to 0.7 408 9% up to 0.8 741 17% up to 0.9 1,124 26% up to 1.0 1,058 24% up to 1.1 373 9% up to 1.2 173 4% over 1.2 80 2%
Total 4,375 100% Note) Nominal Capacity (TEU) = 0.088 x SCNT, provided by SCA
Source) Analyzed by the Study Team based on the SC transit database of 1999.
5.13.3 Proposition Current toll levels for Container Ships (after weather deck surcharge is applied) are a little lower for the vessels of 10,000 - 70,000SCNT than the calculated level (case-4) when using standard saved distance of 4,700 miles and almost the same level for the vessels of 5,000SCNT and 110,000SCNT. Accordingly, it is thought to be possible to increase toll revenue by raising tolls for the vessels of 10,000 - 70,000SCNT. The Study Team would like to propose that the tolls for 10,000 - 70,000SCNT of Container

5 - 56
Ships be raised by 3% as the first step. A step-by-step approach to revising the tolls will make it possible to observe the reactions of the shipping market. It should be noted, however, that there are some direct services between Singapore and NW. Europe of which saved distance is 3,500 miles and careful attention should be paid to such services, though the Long Haul Rebate is not applied for Container Ships. Current weather deck surcharge is thought to be rational since SCNT is set as a basic earning capacity and complemented by an additional earning capacity of container boxes on the weather deck. However, the weather deck surcharge, which is levied based on number of tiers, sometimes forces shipping lines to perform unnecessary container handling for reducing the number of tiers. In addition, shipping lines operating Container Ships are given the impression that they are excessively charged since the weather deck surcharge is applied to almost transits of Container Ships. Two alternatives instead of current weather deck surcharge can be set as follows:
Current: surcharge based on number of tiers over weather deck Merit: Checking number of tiers is easy. Demerit: This system sometimes forces shipping lines to perform
unnecessary container handling for reducing the number of tiers. In addition, shipping lines are given the impression that they are excessively charged.
Alternative-1: surcharge based on number of carried TEUs Merit: This system could avoid unnecessary container handling by shipping
lines. Demerit: Shipping lines are given the impression that they are excessively
charged. In addition, there is a problem in checking the number of carried TEUs which will be declared by shipping lines. SCA concerned about false declarations, although checking by the stowage plan is thought to be effective. SCA's concerns will disappear after EDI (electronic data interchange system) is introduced.
Alternative-2: discount based on number of carried TEUs on condition that the basic tolls be raised (see Table 5.13.10).
Table 5.13.10 Image of New Discount System on Container Ships
Discount rates Carried Containers 15% 10% 5%
less than 40% of nominal capacity less than 60% of nominal capacity less than 80% of nominal capacity
The number of carried containers can be verified with the Stowage Plan issued at the previous port. This discount system on Container Ships are estimated to reduce toll revenue from Container Ships by 2% compared with that before discount. Then to maintain toll revenue from Container Ships as at present, the basic tolls should be raised by

5 - 57
12%. Merit: This system could avoid unnecessary container handling by shipping
lines. In addition, shipping lines would no longer feel that they are being excessively charged.
Demerit: There is a problem in checking the number of carried TEUs which will be declared by shipping lines. SCA concerned about false declarations, although checking by the stowage plan is thought to be effective. SCA's concerns will disappear after EDI (electronic data interchange system) is introduced.
As a result, although current weather deck surcharge is not ideal, it should be left as it is since there is no better alternative. However, a discount based on number of carried TEUs on condition that the basic tolls be raised (alternative-2) will be better than the current system after EDI (electronic data exchange system) is introduced. 5.13.4 Conclusion The container box capital cost and also container cargo inventory cost can be counted in the estimation of savings by using the Canal. Current toll levels for Container Ships (after weather deck surcharge is applied) are a little lower for the vessels of 10,000 - 70,000SCNT than the calculated level (case-4) when using standard saved distance of 4,700 miles and almost the same level for the vessels of 5,000SCNT and 110,000SCNT. The Study Team would like to propose that the tolls for 10,000 - 70,000SCNT of Container Ships be raised by 3% as the first step. A step-by-step approach to revising the tolls will make it possible to observe the reactions of the shipping market. It should be noted, however, that there are some direct services between Singapore and NW. Europe of which saved distance is 3,500 miles and careful attention should be paid to such services, though the Long Haul Rebate is not applied for Container Ships. Although current weather deck surcharge is not ideal, it should be left as it is since there is no better alternative. However, a discount based on number of carried TEUs on condition that the basic tolls be raised (alternative-2) will be better than the current system after EDI (electronic data interchange) system is introduced.

5 - 58
5.14 Toll for Vehicle Carriers 5.14.1 Current toll for Vehicle Carriers Table 5.14.1 shows the current tariff for Vehicle Carriers, which is the same as that for Container Ships.
Table 5.14.1 Current Tariff (Vehicle Carriers) (SDR/SCNT)
SCNT Vessel Type First 5000 Next 5000 Next 10000 Next 20000 Next 30000 Rest 6 (L) 7.21 4.10 3.37 2.42 2.42 1.83 6 (B) 6.13 3.49 2.87 2.06 2.06 1.56
Source) SCA
5.14.2 Evaluation Almost 100% of Vehicle Carriers are said to be industrial carriers which are seldom affected by market conditions. There is no market for common carriers since both car manufacturers and operators of Vehicle Carriers are under oligopolistic conditions. For industrial carriers, it is thought to be appropriate to set the basic toll level based on savings in shipping cost. Savings in inventory cost can also be counted in the estimation of savings by using the Canal since car value per ton (average: US$10,000 in FOB per vehicle) is significantly higher than that transported by Tankers or Dry Bulk Carriers. Vessel size of Vehicle Carriers transiting the Canal is less than 70,000SCNT, while vessls over 40,000SCNT represent 82% of the total. Main O-D pairs for Vehicle Carriers is from Far East to N. Mediterranean and NW. Europe. (see section A.4 of Appendix A)
Table 5.14.2 Accumulation of Number of Vessels (Vehicle Carriers) SCNT DWT SC Transit 1999 World Fleet 5,000 1,877 0% 3% 10,000 3,755 1% 16% 20,000 7,509 1% 26% 40,000 15,018 18% 61% 70,000 26,282 100% 97%
Source) World fleet: Fairplay World Shipping Encyclopaedia (delivered 1981-2000)

5 - 59
Table 5.14.3 Number of Vessel Transiting the Canal (Vehicle Carriers) Direction Laden Ballast Total Northbound 540 4 544 Southbound 231 155 386 Total 771 159 930
Source) Analyzed by the Study Team based on the SC transit database of 1999
There are few southbound transits than northbound transits. According to the Japanese shipping lines, the predominant route other than the route via the Canal are as follows:
Case-1: Far East - (laden) - Europe - (laden) - America - (ballast via the Panama Canal) - Far East Case-2: Far East - (laden) - Europe - (laden) - S. Africa - (ballast) - Far East Case-3: Far East - (laden) - Europe - (ballast via the Cape) - Far East
Ballast voyages via the Cape represent only 10% of the total ballast voyages from Europe to Far East. There is no laden voyage via the Cape. In case that there is enough time to spare until next operation after transiting the Canal, savings perceived by shipping lines are only in fuel cost (variable cost). Savings in managing cost (basically fixed cost) are not perceived. Full savings in managing cost are perceived only when shipping lines can fully utilize days saved by using the Canal for their next operation. It is considered that most vessels in ballast using the route via the Cape have enough time to spare until next operation after transiting the Canal. On the other hand, it is considered that there is no time to spare until next operation after transiting the Canal for most vessels in ballast using the Canal. Comparing with calculation based on Equation-1 of section 5.1.3 and on certain assumptions (e.g. fuel cost = 100US$/ton, exchange rate = 1.30US$/SDR), the following observations can be made (threshold criteria: plus or minus 10%). Case-1: without considering inventory cost
Current toll levels are a little lower than the calculated level when using standard saved distance of 4,700 miles.
Case-2: with considering inventory cost (car value: US$10,000 /car in FOB)
Current toll levels are a little lower for the vessels of 20,000 - 40,000SCNT than the calculated level when using standard saved distance of 4,700 miles, a little higher for the vessels of 5,000SCNT and almost the same level for the vessels greater than 70,000SCNT.

5 - 60
Table 5.14.3 Toll Comparison (Vehicle Carriers, Laden, Case-1)
Table 5.14.4 Toll Comparison (Vehicle Carriers, Laden, Case-2)
Saved distance at maximum relative toll revenue is 3,300 miles. (see section 5.6.2). Remarkable peak is observed at this saved distance which O-D is as follows:
Far East - N. Med. (Saved distance = 3,300 miles) 5.14.3 Proposition Current toll levels are a little lower for the vessels of 20,000 - 40,000SCNT than the calculated level when using standard saved distance of 4,700 miles, a little higher for the vessels of 5,000SCNT and almost the same level for the vessels greater than 70,000SCNT. Accordingly, it is thought to be possible to increase toll revenue by raising tolls for the vessels of 20,000 - 40,000SCNT. The Study Team would like to propose that the tolls for 20,000 - 40,000SCNT of Vehicle Carriers be raised by 3% as the first step. A step-by-step approach to revising the tolls will make it possible to observe the reactions of the shipping market. It may be effective to apply a fixed rebate rate system (see section 5.6.3) to Vehicle Carriers since a remarkable peak is observed when saved distance is at maximum relative
(US$)Toll Standard Saved
Distance (miles)Average
5,000 10,000 20,000 40,000 70,000 110,000 160,000 220,000Current Toll a 46,865 73,515 117,325 180,245 274,625Calculation 4,700 b 28,300 59,093 105,371 136,696 184,128
3,300 c 17,218 38,450 70,164 90,600 121,5672,100 d 7,720 20,756 39,987 51,090 67,943
Comparison b/a 0.60 0.80 0.90 0.76 0.67 0.75c/a 0.37 0.52 0.60 0.50 0.44 0.49d/a 0.16 0.28 0.34 0.28 0.25 0.26c/b 0.61 0.65 0.67 0.66 0.66 0.65d/b 0.27 0.35 0.38 0.37 0.37 0.35
Note) Case-1: without considering inventory cost Exchange rate = 1.30 US$/SDRSource) The Study Team
Vessel Size (SCNT)
(US$)Toll Standard Saved
Distance (miles)Average
5,000 10,000 20,000 40,000 70,000 110,000 160,000 220,000Current Toll a 46,865 73,515 117,325 180,245 274,625Calculation 4,700 b 37,054 76,338 138,800 199,313 288,428
3,300 c 23,143 50,113 92,745 132,785 191,6832,100 d 11,218 27,634 53,270 75,761 108,758
Comparison b/a 0.79 1.04 1.18 1.11 1.05 1.03c/a 0.49 0.68 0.79 0.74 0.70 0.68d/a 0.24 0.38 0.45 0.42 0.40 0.38c/b 0.62 0.66 0.67 0.67 0.66 0.66d/b 0.30 0.36 0.38 0.38 0.38 0.36
Note) Case-2: with considering inventory cost Exchange rate = 1.30 US$/SDRSource) The Study Team
Vessel Size (SCNT)

5 - 61
toll revenue. Fixed rebate rate given in Table 5.14.4 is as follows:
Far East - N. Med. (Saved distance = 3,300 miles) 34% discount However, there is no laden voyage via the Cape according to Japanese shipping lines. In addition, vessels which claim 50% - 60% of rebate but only receive a discount of 5% still transit the Canal, according to SCA. Accordingly, applying fixed rebate rate system to Vehicle Carriers may decrease toll revenue. It should be noted, however, that this strange behavior of Vehicle Carriers can be considered as a temporary phenomenon caused by the constraints of available capacity. As to applying the Long Haul Rebate for vessels in ballast, the Study Team would like to propose that rebate rates be set based on savings only in fuel cost in case that there is enough time to spare until next operation after transiting the Canal, while on savings in shipping cost including managing cost in case that there is no time to spare until next operation after transiting the Canal. SCA can verify this by requiring users to submit certificates proving that there was enough time to spare until next operation after transiting the Canal, in case of setting the rebate rates based on savings only in fuel cost. 5.14.4 Conclusion Current toll levels are a little lower for the vessels of 20,000 - 40,000SCNT than the calculated level when using standard saved distance of 4,700 miles, a little higher for the vessels of 5,000SCNT and almost the same level for the vessels greater than 70,000SCNT. Accordingly, it is thought to be possible to increase toll revenue by raising tolls for the vessels of 20,000 - 40,000SCNT. The Study Team would like to propose that the tolls for 20,000 - 40,000SCNT of Vehicle Carriers be raised by 3% as the first step. A step-by-step approach to revising the tolls will make it possible to observe the reactions of the shipping market.

5 - 62
5.15 Toll for General Cargo Ships 5.15.1 Current toll for General Cargo Ships Table 5.15.1 shows the current tariff for General Cargo Ships.
Table 5.15.1 Current Tariff (General Cargo Ships) (SDR/SCNT)
SCNT Vessel Type First 5000 Next 5000 Next 10000 Next 20000 Next 30000 Rest 8 (L) 7.21 4.14 3.77 2.63 2.63 2.63 8 (B) 6.13 3.52 3.21 2.24 2.24 2.24
Source) SCA
5.15.2 Evaluation Vessel size of General Cargo Ships transiting the Canal is generally less than 30,000SCNT. There are few General Cargo Ships less than 5,000SCNT transiting the Canal compared to the world fleet. Main O-D pairs for General Cargo Ships transiting the Canal are Red Sea - Mediterranean, but there is no remarkable concentration in O-D pairs. (see section A.4 of Appendix A)
Table 5.15.2 Accumulation of Number of Vessels (General Cargo Ships) SCNT DWT SC Transit 1999 World Fleet 5,000 7,836 33% 87% 10,000 15,672 59% 96% 20,000 31,343 96% 98% 30,000 47,015 100% 99%
Source) World fleet: Fairplay World Shipping Encyclopaedia (delivered 1981-2000)
Table 5.15.3 Number of Vessel Transiting the Canal (General Cargo Ships)
Direction Laden Ballast Total Northbound 870 100 970 Southbound 1,136 47 1,183 Total 2,006 147 2,153
Source) Analyzed by the Study Team based on the SC transit database of 1999
Comparing with calculation based on Equation-1 of section 5.1.3 and on certain assumptions (e.g. fuel cost = 100US$/ton, exchange rate = 1.30US$/SDR), the following observations can be made (threshold criteria: plus or minus 10%).
Current toll levels are a little lower for the vessels greater than 20,000SCNT than the calculated level when using standard saved distance of 4,700 miles, a little higher for the vessels of 5,000SCNT and almost the same level for the vessels of

5 - 63
10,000SCNT. Saved distance at maximum relative toll revenue is 3,300 miles. (see section 5.6.2)
Table 5.15.4 Toll Comparison (General Cargo Ships, Laden)
5.15.3 Proposition Current toll levels of General Cargo Ships are a little lower for the vessels greater than 20,000SCNT than the calculated level when using standard saved distance of 4,700 miles, a little higher for the vessels of 5,000SCNT and almost the same level for the vessels of 10,000SCNT. Accordingly, it is thought to be possible to increase toll revenue by raising tolls for the vessels greater than 20,000SCNT. The Study Team would like to propose that the tolls for the vessels greater than 20,000SCNT of General Cargo Ships be raised by 3% as the first step. A step-by-step approach to revising the tolls will make it possible to observe the reactions of the shipping market. On the other hand, it is thought that there is a little possibility of increasing toll revenues by reducing tolls for the vessels of 5,000SCNT since the share of vessels less than 5,000SCNT transiting the Canal is small compared to the world fleet. If there is no increase in transit even after reducing tolls for 5,000SCNT General Cargo Ships by 20%, toll revenue would decrease by around 5 million SDR (relating toll revenue in 1999 is estimated 13 million SDR for up to 5,000SCNT and 27 million SDR for from 5,000SCNT up to 10,000SCNT). However, it is thought to be appropriate to leave the toll as it is since there is no firm evidence that reducing the toll would increase toll revenues, although current toll level is a little higher for the vessels of 5,000SCNT than the calculated one and there is a little possibility of toll revenue increase by reducing tolls. 5.15.4 Conclusion Current toll levels of General Cargo Ships are a little lower for the vessels greater than
(US$)Toll Standard Saved
Distance (miles)Average
5,000 10,000 20,000 40,000 70,000 110,000 160,000 220,000Current Toll a 46,865 73,775 122,785 191,165 293,735 430,495Calculation 4,700 b 38,165 79,144 149,115 241,110 374,686 533,740
3,300 c 24,317 52,638 100,866 163,657 254,744 358,732Comparison b/a 0.81 1.07 1.21 1.26 1.28 1.24 1.15
c/a 0.52 0.71 0.82 0.86 0.87 0.83 0.77c/b 0.64 0.67 0.68 0.68 0.68 0.67 0.67
Note) Exchange rate = 1.30 US$/SDRSource) The Study Team
Vessel Size (SCNT)

5 - 64
20,000SCNT than the calculated level when using standard saved distance of 4,700 miles, a little higher for the vessels of 5,000SCNT and almost the same level for the vessels of 10,000SCNT. Accordingly, it is thought to be possible to increase toll revenue by raising tolls for the vessels greater than 20,000SCNT. The Study Team would like to propose that the tolls for the vessels greater than 20,000SCNT of General Cargo Ships be raised by 3% as the first step. A step-by-step approach to revising the tolls will make it possible to observe the reactions of the shipping market. As to 5,000SCNT of General Cargo Ships, it is thought to be appropriate to leave the toll as it is since there is no firm evidence that reducing the toll would increase toll revenues.

5 - 65
5.16 Tariff-setting procedure 5.16.1 Current tariff-setting procedure Tolls are to be revised and announced with SCA circular each year, while those have been remained almost unchanged since 1994. Prime Minister approves transit dues drafted by the Economic Unit and agreed by the tolls committee and board of directors within SCA. 5.16.2 Evaluation Current tariff-setting procedure is thought to basically be conducted appropriate. 5.16.3 Proposition The Study Team would like to proposed that SCA insert the following steps of "step-by-step revising", "public consultation and hearing process" and "monitoring market and trade reaction" into the current tariff-setting procedure. Figure 5.16.1 shows the whole image of proposed tariff-setting procedure (1) "Step-by-step revising" and "monitoring market and trade reaction" "Step-by-step revising" and "monitoring market and trade reaction" are indispensable in revising the tariff, since the "optimal toll calculation" is acquired based on certain assumptions and only "market and trade reaction" could judge whether these assumptions are appropriate or not. SCA should reflect the reaction to the next revising the tariff. (2) Public consultation and hearing process The article 79 of the (Panama) Canal Authority Organic Low prescribes that any revision of the tolls rate or of the admeasurement rules must be subject to a previous consultation and public hearing process, to afford the interested parties an opportunity to participate and to express their opinions and arguments on the subject. The extract of the Panama Canal's regulations are shown in Appendix C. Such process as adopted by the Panama Canal Authority is thought to become more and more important, since securing the transparency and fairness in management and operation of the Canal to sustain the world trade to be in fair and free competitive condition for the consumers to enjoy cheaper consumption goods. And moreover, this process is thought to be one of the marketing process. 5.16.4 Conclusion Current tariff-setting procedure is thought to basically be conducted appropriate. In addition, the Study Team would like to proposed that SCA insert steps of "step-by-step revising", "public consultation and hearing process" and "monitoring market and trade reaction" into the current tariff-setting procedure.
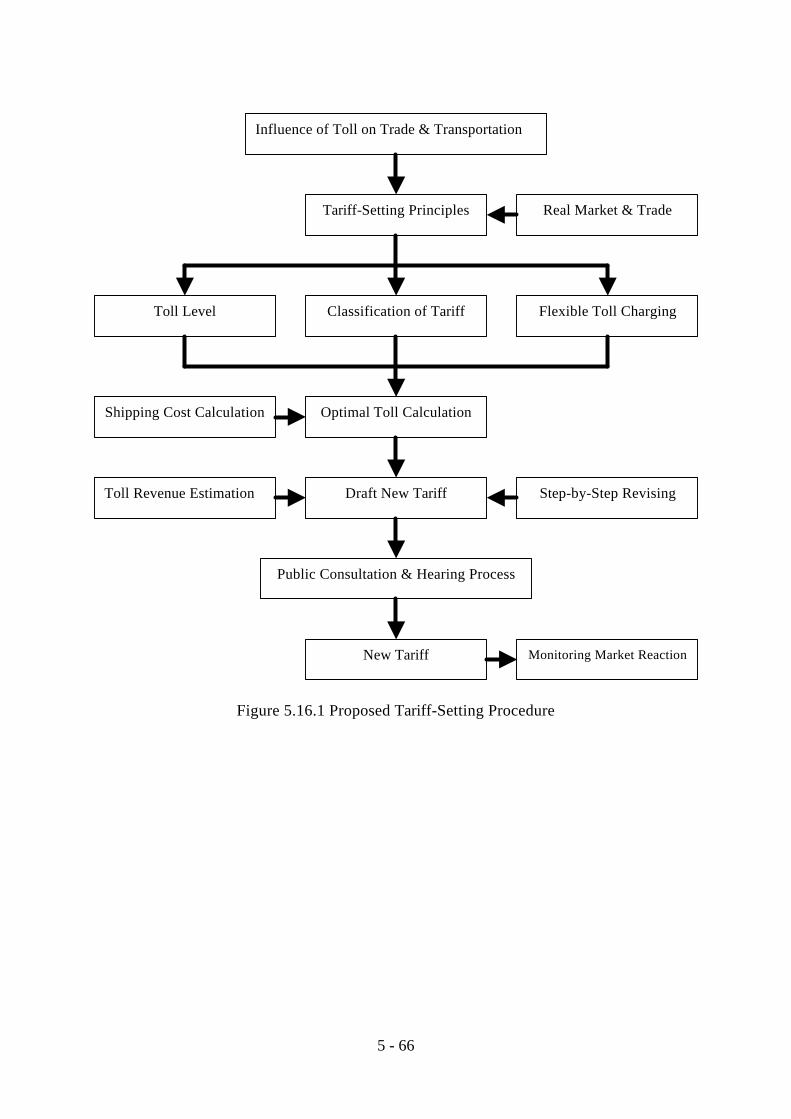
5 - 66
Figure 5.16.1 Proposed Tariff-Setting Procedure
Influence of Toll on Trade & Transportation
Tariff-Setting Principles
Classification of Tariff Toll Level Flexible Toll Charging
Shipping Cost Calculation Optimal Toll Calculation
Step-by-Step Revising Draft New Tariff Toll Revenue Estimation
Public Consultation & Hearing Process
New Tariff Monitoring Market Reaction
Real Market & Trade

A - 1
Appendix A Analysis of the SC Transit Database for Tariff-Setting A.1 Outline of the SC transit database The Study Team was provided the SC transit database by SCA. The main contents of the database are as follows:
- Date of transit - Vessel name - Vessel type - Origin - Destination - Cargo ton - Cargo type - DWT - SCNT - Laden or ballast - TEU
Points of notice in analyzing the SC transit database provided by SCA are as follows:
- Vessel types of the SC transit database are different from those of the tariff. - Tankers in the database consist of Tankers of crude oil, Tankers of petroleum products, Chemical Carriers, LNG and LPG. - Applied tolls including surcharge/discount are not mentioned. - Reliability of information on origin and destination is not high.
Vessel types, regions and countries, and cargo types of the SC transit database are as shown in Table A.1.1, Table A.1.2 and Table A.1.3.
Table A.1.1 Vessel Types of the SC Transit Database Code Vessel Type 1 Tankers 2 Bulk Carriers 3 Combined Carriers 4 General Cargo 5 Container Ships 6 LASH 7 Ro/Ro 8 Car Carriers 9 Passenger Ships 10 War Ships 11 Others
Source) SCA

Code Name Code Name Code Name Code NameN0 E., S.E. Med. N01 Egypt (Med.) S0 Red Sea S01 Egypt (R.S.)
N02 Lebanon S02 JordanN03 Syria S03 Saudi Arabia (R.S.)N04 Turkey S04 SudanN05 Cyprus S05 EthiopiaN07 Israel (Med.) S06 YemenN09 Others S07 Israel (R.S.)
N1 N. Med. N10 Greece S08 DgipoutiN11 Albania S09 OthersN12 Solvenia/Croatia S1 E. Africa & Aden S11 SomaliaN13 Italy S12 KenyaN14 France (Med.) S13 TanzaniaN15 Malta S14 MocambiqueN19 Others S15 Madagascar
N2 W., S.W. Med. N20 Spain S16 South AfricaN21 Libya S17 MauritiusN22 Tunisia S18 SeychellesN23 Algeria S19 OthersN24 Morocco (Med.) S2 Arabian Gulf S20 IranN29 Others S21 Kuwait
N3 Black Sea N30 Russia (Black S.) S22 IraqN31 Romania S23 Saudi Arabia (A.G.)N32 Bulgaria S24 BahrainN33 Ukrania S25 United Arab EmiratesN34 Gorgia S26 QatarN35 Athrbegan S28 OmanN39 Others S29 Others
N4 N., W. Euorpe & U.K. N40 Portugal S3 S. Asia S30 IndiaN41 France (Atlantic) S31 PakistanN42 Belgium S32 BangladeshN43 Netherlands S33 BurmaN44 Germany S34 SrilankaN45 Denmark S35 MaldiveN46 U.K. S39 OthersN47 Norway S4 S.E. Asia S40 MalaysiaN48 Sweden S41 ThailandN49 Others S42 Campodia
N5 Baltic Sea N50 Poland S43 IndonesiaN51 Ireland S44 VietnamN52 Russia (Baltic) S45 SingaporeN54 Finland S49 OthersN55 Letwania S5 Far East S50 TaiwanN56 Latevia S51 PhilippinesN57 Estonia S52 ChinaN58 Icelands S53 JapanN59 Others S54 North Korea
N6 America N60 United States S55 Russia (Sib.)N61 Canada S56 South KoreaN62 Mexico S57 New GuineaN63 Cuba S58 Hong KongN64 Panama S59 OthersN65 Venezuela S6 Australia S60 AustraliaN66 Brazil S61 New ZealandN67 Ecuador S62 Pacific IslandsN68 El Salvador S69 OthersN69 Others S7 Others S70 America
N7 Others N70 Morocco (Atlantic) S79 OthersN71 Canary Is.N72 MauritaniaN73 Guinea BissauN74 SenegalN75 NigeriaN79 Others
Source) SCA
A - 2
Table A.1.2 Regions and Countries of the SC Transit DatabaseRegion Country Region Country
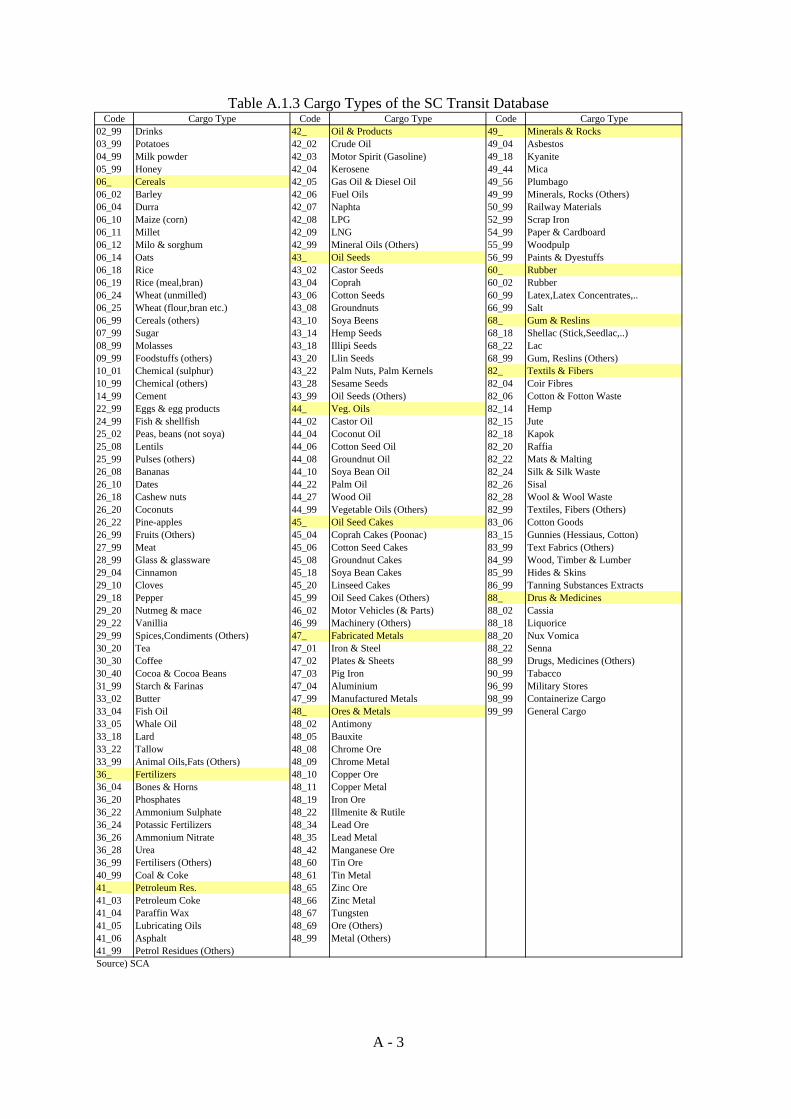
Code Cargo Type Code Cargo Type Code Cargo Type02_99 Drinks 42_ Oil & Products 49_ Minerals & Rocks03_99 Potatoes 42_02 Crude Oil 49_04 Asbestos04_99 Milk powder 42_03 Motor Spirit (Gasoline) 49_18 Kyanite05_99 Honey 42_04 Kerosene 49_44 Mica06_ Cereals 42_05 Gas Oil & Diesel Oil 49_56 Plumbago06_02 Barley 42_06 Fuel Oils 49_99 Minerals, Rocks (Others)06_04 Durra 42_07 Naphta 50_99 Railway Materials06_10 Maize (corn) 42_08 LPG 52_99 Scrap Iron06_11 Millet 42_09 LNG 54_99 Paper & Cardboard06_12 Milo & sorghum 42_99 Mineral Oils (Others) 55_99 Woodpulp06_14 Oats 43_ Oil Seeds 56_99 Paints & Dyestuffs06_18 Rice 43_02 Castor Seeds 60_ Rubber06_19 Rice (meal,bran) 43_04 Coprah 60_02 Rubber06_24 Wheat (unmilled) 43_06 Cotton Seeds 60_99 Latex,Latex Concentrates,..06_25 Wheat (flour,bran etc.) 43_08 Groundnuts 66_99 Salt06_99 Cereals (others) 43_10 Soya Beens 68_ Gum & Reslins07_99 Sugar 43_14 Hemp Seeds 68_18 Shellac (Stick,Seedlac,..)08_99 Molasses 43_18 Illipi Seeds 68_22 Lac09_99 Foodstuffs (others) 43_20 Llin Seeds 68_99 Gum, Reslins (Others)10_01 Chemical (sulphur) 43_22 Palm Nuts, Palm Kernels 82_ Textils & Fibers10_99 Chemical (others) 43_28 Sesame Seeds 82_04 Coir Fibres14_99 Cement 43_99 Oil Seeds (Others) 82_06 Cotton & Fotton Waste22_99 Eggs & egg products 44_ Veg. Oils 82_14 Hemp24_99 Fish & shellfish 44_02 Castor Oil 82_15 Jute25_02 Peas, beans (not soya) 44_04 Coconut Oil 82_18 Kapok25_08 Lentils 44_06 Cotton Seed Oil 82_20 Raffia25_99 Pulses (others) 44_08 Groundnut Oil 82_22 Mats & Malting26_08 Bananas 44_10 Soya Bean Oil 82_24 Silk & Silk Waste26_10 Dates 44_22 Palm Oil 82_26 Sisal26_18 Cashew nuts 44_27 Wood Oil 82_28 Wool & Wool Waste26_20 Coconuts 44_99 Vegetable Oils (Others) 82_99 Textiles, Fibers (Others)26_22 Pine-apples 45_ Oil Seed Cakes 83_06 Cotton Goods26_99 Fruits (Others) 45_04 Coprah Cakes (Poonac) 83_15 Gunnies (Hessiaus, Cotton)27_99 Meat 45_06 Cotton Seed Cakes 83_99 Text Fabrics (Others)28_99 Glass & glassware 45_08 Groundnut Cakes 84_99 Wood, Timber & Lumber29_04 Cinnamon 45_18 Soya Bean Cakes 85_99 Hides & Skins29_10 Cloves 45_20 Linseed Cakes 86_99 Tanning Substances Extracts29_18 Pepper 45_99 Oil Seed Cakes (Others) 88_ Drus & Medicines29_20 Nutmeg & mace 46_02 Motor Vehicles (& Parts) 88_02 Cassia29_22 Vanillia 46_99 Machinery (Others) 88_18 Liquorice29_99 Spices,Condiments (Others) 47_ Fabricated Metals 88_20 Nux Vomica30_20 Tea 47_01 Iron & Steel 88_22 Senna30_30 Coffee 47_02 Plates & Sheets 88_99 Drugs, Medicines (Others)30_40 Cocoa & Cocoa Beans 47_03 Pig Iron 90_99 Tabacco31_99 Starch & Farinas 47_04 Aluminium 96_99 Military Stores33_02 Butter 47_99 Manufactured Metals 98_99 Containerize Cargo33_04 Fish Oil 48_ Ores & Metals 99_99 General Cargo33_05 Whale Oil 48_02 Antimony33_18 Lard 48_05 Bauxite33_22 Tallow 48_08 Chrome Ore33_99 Animal Oils,Fats (Others) 48_09 Chrome Metal36_ Fertilizers 48_10 Copper Ore36_04 Bones & Horns 48_11 Copper Metal36_20 Phosphates 48_19 Iron Ore36_22 Ammonium Sulphate 48_22 Illmenite & Rutile36_24 Potassic Fertilizers 48_34 Lead Ore36_26 Ammonium Nitrate 48_35 Lead Metal36_28 Urea 48_42 Manganese Ore36_99 Fertilisers (Others) 48_60 Tin Ore40_99 Coal & Coke 48_61 Tin Metal41_ Petroleum Res. 48_65 Zinc Ore41_03 Petroleum Coke 48_66 Zinc Metal41_04 Paraffin Wax 48_67 Tungsten41_05 Lubricating Oils 48_69 Ore (Others)41_06 Asphalt 48_99 Metal (Others)41_99 Petrol Residues (Others)Source) SCA
Table A.1.3 Cargo Types of the SC Transit Database
A - 3
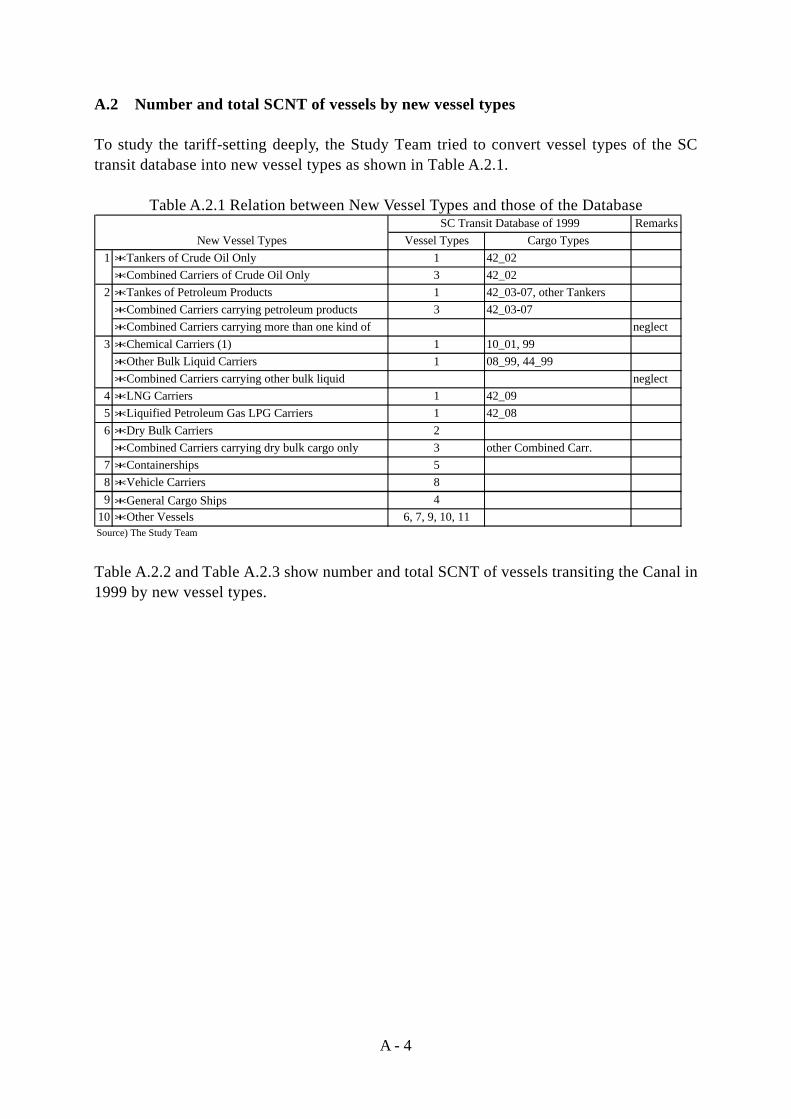
A - 4
A.2 Number and total SCNT of vessels by new vessel types To study the tariff-setting deeply, the Study Team tried to convert vessel types of the SC transit database into new vessel types as shown in Table A.2.1.
Table A.2.1 Relation between New Vessel Types and those of the Database
Table A.2.2 and Table A.2.3 show number and total SCNT of vessels transiting the Canal in 1999 by new vessel types.
RemarksVessel Types Cargo Types
1 *Tankers of Crude Oil Only 1 42_02*Combined Carriers of Crude Oil Only 3 42_02
2 *Tankes of Petroleum Products 1 42_03-07, other Tankers*Combined Carriers carrying petroleum products 3 42_03-07*Combined Carriers carrying more than one kind ofcargo
neglect3 *Chemical Carriers (1) 1 10_01, 99
*Other Bulk Liquid Carriers 1 08_99, 44_99*Combined Carriers carrying other bulk liquid neglect
4 *LNG Carriers 1 42_095 *Liquified Petroleum Gas LPG Carriers 1 42_086 *Dry Bulk Carriers 2
*Combined Carriers carrying dry bulk cargo only 3 other Combined Carr.7 *Containerships 58 *Vehicle Carriers 89 *General Cargo Ships 4
10 *Other Vessels 6, 7, 9, 10, 11Source) The Study Team
SC Transit Database of 1999New Vessel Types

(Num
ber)
1L: Tankers of Crude Oil
2L: Tankers of Petro. Prod.
3L: Chemical Carriers
4L: LNG Carriers
5L: LPG Carriers
6L: Dry Bulk Carriers
7L: Container Ships
8L: Vehicle Carriers
9A: General Cargo Ships
10A: Other Vessels
1B: Tankers of Crude Oil
2B: Tankers of Petro. Prod.
3B: Chemical Carriers
4B: LNG Carriers
5B: LPG Carriers
6B: Dry Bulk Carriers
7B: Container Ships
8B: Vehicle Carriers
9B: General Cargo Ships
10B: Other Vessels
Total
TotalAccumulation
12
34
56
78
910
1112
1314
1516
1718
1920
555
101
103
2762
052
032
134
42
9310
61,
590
11.8
%10
192
238
4666
333
515
196
1614
240
410
437
401,
357
21.8
%15
3215
724
376
193
164
281
116
2323
99
113
341,
635
34.0
%20
164
173
1658
621
52
142
271
2821
1820
41
61,
325
43.8
%25
5062
1064
322
33
4338
71
717
73
13
1,11
852
.1%
3022
41
229
581
3436
817
211
111
1,02
059
.6%
353
833
259
323
714
59
81
52
1,01
067
.1%
401
2318
317
341
501
351
614
52
242
184
173
.4%
454
225
1717
710
149
111
518
22
3299
580
.7%
509
171
71
910
241
23
25
531,
251
90.0
%55
59
667
904
14
1219
891
.5%
609
413
916
01
83
1233
694
.0%
6511
411
7615
110
41
213
595
.0%
706
611
352
16
6795
.5%
756
147
123
31
11
118
496
.8%
8011
18
281
18
5897
.3%
851
3372
53
114
98.1
%90
141
11
1798
.2%
954
22
19
98.3
%10
02
21
16
98.3
%10
50
98.3
%11
01
23
98.4
%11
52
79
98.4
%12
01
198
.4%
125
210
1298
.5%
130
16
798
.6%
135
11
98.6
%14
02
35
98.6
%14
51
12
498
.7%
150
712
1998
.8%
155
273
176
99.4
%16
01
331
136
99.6
%16
51
202
2399
.8%
170
31
499
.8%
175
33
99.8
%18
05
599
.9%
185
099
.9%
190
66
99.9
%19
57
710
0.0%
200
11
100.
0%20
50
100.
0%21
01
110
0.0%
215
11
100.
0%22
00
100.
0%22
50
100.
0%23
00
100.
0%23
50
100.
0%24
00
100.
0%24
50
100.
0%25
00
100.
0%T
otal
7540
373
629
150
2,73
14,
338
771
2,00
61,
004
215
155
7334
136
9737
159
147
194
13,4
90Sh
are
0.6%
3.0%
5.5%
0.2%
1.1%
20.2
%32
.2%
5.7%
14.9
%7.
4%1.
6%1.
1%0.
5%0.
3%1.
0%0.
7%0.
3%1.
2%1.
1%1.
4%10
0.0%
Not
e)Sp
ecia
l flo
atin
g un
its a
re in
clud
ed in
Oth
er v
esse
ls.
Sour
ce)
Ana
lyze
d by
the
Stud
y Te
am b
ased
on
the
SC tr
ansi
t dat
abas
e of
199
9.
Tab
le A
.2.2
Num
ber o
f Ves
sels
Tra
nsiti
ng th
e C
anal
Ship
Siz
e(u
p to
)(1
000
SCN
T)
A - 5

(100
0 SC
NT
)
1L: Tankers of Crude Oil
2L: Tankers of Petro. Prod.
3L: Chemical Carriers
4L: LNG Carriers
5L: LPG Carriers
6L: Dry Bulk Carriers
7L: Container Ships
8L: Vehicle Carriers
9A: General Cargo Ships
10A: Other Vessels
1B: Tankers of Crude Oil
2B: Tankers of Petro. Prod.
3B: Chemical Carriers
4B: LNG Carriers
5B: LPG Carriers
6B: Dry Bulk Carriers
7B: Container Ships
8B: Vehicle Carriers
9B: General Cargo Ships
10B: Other Vessels
Total
TotalAccumulation
12
34
56
78
910
1112
1314
1516
1718
1920
518
236
138
1084
1,70
394
381
4015
127
166
182
3,82
51.
0%10
970
01,
767
319
584
261
284,
198
1,42
610
812
216
281
3680
3024
228
210
,488
3.7%
1540
22,
042
281
4,96
82,
672
117,
797
986
1220
228
027
111
312
315
151
432
20,7
589.
1%20
151,
121
2,99
928
110
,289
3,96
432
2,31
446
715
484
346
318
370
6915
103
23,2
0515
.1%
251,
129
1,32
121
414
,481
4,87
766
959
865
155
2514
739
015
468
2469
24,9
4421
.6%
3059
110
629
6,10
015
,792
929
974
2,31
118
858
297
297
3027
,701
28.8
%35
9725
310
,976
19,5
4375
722
244
816
228
426
732
157
6433
,263
37.5
%40
3889
869
411
,621
12,7
071,
929
361,
303
3823
453
818
877
932
7135
31,3
4045
.6%
4517
391
120
070
770
230
,926
6,35
343
453
200
762
8786
1,34
142
,943
56.7
%50
430
797
4832
045
43,0
8411
,481
9214
296
229
2,50
159
,266
72.1
%55
262
471
321
3,57
84,
720
215
5321
062
410
,454
74.9
%60
507
232
8,07
49,
280
5846
017
470
319
,488
79.9
%65
674
243
677
4,63
590
862
610
245
6012
18,
235
82.1
%70
399
419
744
2,44
213
366
420
4,62
383
.3%
7544
071
3,39
38,
956
223
7071
7475
13,3
7286
.7%
8084
680
636
2,15
179
7563
64,
502
87.9
%85
832,
734
6,02
340
525
29,
496
90.4
%90
1,22
090
9086
1,48
690
.8%
9537
018
518
892
835
91.0
%10
019
019
195
9557
191
.1%
105
091
.1%
110
107
216
323
91.2
%11
522
178
81,
009
91.5
%12
012
012
091
.5%
125
249
1,22
11,
470
91.9
%13
012
876
789
592
.1%
135
131
131
92.1
%14
027
841
369
192
.3%
145
144
144
288
576
92.5
%15
01,
043
1,79
32,
836
93.2
%15
530
611
,107
151
11,5
6396
.2%
160
157
5,19
415
915
75,
666
97.7
%16
516
23,
260
325
3,74
798
.7%
170
507
168
675
98.8
%17
551
151
199
.0%
180
882
882
99.2
%18
50
99.2
%19
01,
128
1,12
899
.5%
195
1,35
81,
358
99.8
%20
019
719
799
.9%
205
099
.9%
210
210
210
99.9
%21
521
121
110
0.0%
220
010
0.0%
225
010
0.0%
230
010
0.0%
235
010
0.0%
240
010
0.0%
245
010
0.0%
250
010
0.0%
Tot
al6,
054
8,12
88,
644
1,83
72,
816
71,9
1716
7,61
536
,494
18,2
049,
579
31,1
014,
130
997
2,18
42,
770
3,16
463
06,
789
670
1,27
138
4,99
4Sh
are
1.6%
2.1%
2.2%
0.5%
0.7%
18.7
%43
.5%
9.5%
4.7%
2.5%
8.1%
1.1%
0.3%
0.6%
0.7%
0.8%
0.2%
1.8%
0.2%
0.3%
100.
0%N
ote)
Spec
ial f
loat
ing
units
are
incl
uded
in O
ther
ves
sels
.So
urce
)A
naly
zed
by th
e St
udy
Team
bas
ed o
n th
e SC
tran
sit d
atab
ase
of 1
999.
Tab
le A
.2.3
Tot
al S
CN
T o
f Ves
sels
Tra
nsiti
ng th
e C
anal
Ship
Siz
e(u
p to
)(1
000
SCN
T)
A - 6

A - 7
A.3 Toll revenue estimation by vessel type and size The Study Team was provided the toll revenue by vessel type by SCA as shown in Table A.3.1. Total toll revenue is 1,813 million US$ or 1,325 million SDR in 1999. Main vessel types are Container Ships (revenue:884 million US$, share:49%), Bulk Carriers (revenue:292 million US$, share:16%), Tankers (revenue:223 million US$, share:12%), Car Carriers (revenue:190 million US$, share:10%) and General Cargo Ships (revenue:142 million US$, share:8%), and the shares of other vessel types are 1% or below in 1999.
Table A.3.1 Toll Revenue by Vessel Type
To study the tariff-setting deeply, the Study Team tried to estimate toll revenue by new vessel type and size. Flowchart of toll estimation, input data on surcharge and discount, and comparison of estimated revenue to real revenue in 1999 (reproduction) are shown in Figure A.3.1, Table A.3.2 and Table A.3.3. This toll revenue estimation can generally be judged to accurately reproduce the real revenue in 1999. Figure A.3.4 shows the estimated toll revenue by vessel type and size in 1999.
(1000 US$)
Revenue Share Revenue ShareTankers 261,369 15% 223,429 12% 85%Bulk Carriers 242,548 14% 291,944 16% 120%Combined Carriers 11,587 1% 6,412 0% 55%General Cargo Ships 157,449 9% 141,673 8% 90%Container Ships 806,569 46% 883,730 49% 110%LASH 4,662 0% 5,540 0% 119%RoRo 32,377 2% 24,810 1% 77%Car Carriers 187,343 11% 189,616 10% 101%Passenger Ships 10,282 1% 10,904 1% 106%War Ships 13,061 1% 10,743 1% 82%Other Vessels 22,323 1% 23,817 1% 107%
Total (US$) 1,749,570 100% 1,812,618 100% 104%Daily Average 4,793 4,966
Total (SDR) 1,289,221 1,325,099 103%SDR Rate (US$) 1.3571 1.3679
Source) SCA
Vessel Type 99/98Jan.-Dec. 1998 Jan.-Dec. 1999

A - 8
Figure A.3.1 Flowchart of Toll Revenue Estimation
Table A.3.2 Input Data on Surcharge & Discount
Table A.3.3 Comparison of Estimated Revenue to Real Revenue in 1999 (Reproduction)
SCA transit data 1999
* by each trip
Current tariff Current surcharge & discount
* by type & size * Container weather-deck surcharge
* War ship surcharge
* Discount for VLCC in ballast from America
* Long haul rebate
* LNG discount
* SUMED integration
Estimated revenue (reproduction)
* with current tariff system
Error check
* within 2% then OK
* over 2% then one more
Item Inputting Method* Container weather-deck surcharge +9.7% = for each trip* War ship surcharge +25% = for each trip* Discount for VLCC in ballast from America -45% = from N60(USA)
-55% = from N63(Cuba) & N65(Venezuera)* Long haul rebate for Bulk carriers of main O-D
-80% = N4(NW Europe) & N5(Baltic Sea) from/to S6(Australia) -50% = N4 & N5 from/to S4(SE Asia) & S5(Far East) -50% = S16(S Africa) from to N0(E&SE Med.) & N1(N Med.)
* LNG discount -35% = for each trip* SUMED integration 0.63US$/MT = for VLCC laden from Ain-Sukhna
assumed to be 180,000MT
Tan
kers
Bul
k C
arr.
Com
bine
d C
arr.
Gen
eral
Car
go
Con
tain
er C
arr.
Las
h
Ro/
Ro
Car
Car
r.
Pas
s. S
hip
War
Shi
p
Oth
ers
Tot
al
1 2 3 4 5 6 7 8 9 10 11Real Revenuein million US$ (R$) 223 292 6 142 884 6 25 190 11 11 24 1,813
SDR($) in 1999=
Estimated Revenuein million SDR
163 216 5 103 643 5 17 140 8 8 16 1,3241.3679 Estimated Revenue
in million US$ (E$) 223 295 7 142 879 6 23 192 11 11 22 1,811E$-R$in million US$
0 3 1 0 -4 1 -1 2 0 0 -2 -1(E$-R$)/R$
0.0% 1.1% 9.6% -0.1% -0.5% 13.0% -5.7% 1.1% -1.3% -0.7% -8.0% -0.1%within 2%
OK

(in m
illio
n SD
R)
1L: Tankers of Crude Oil
2L: Tankers of Petro. Prod.
3L: Chemical Carriers
4L: LNG Carriers
5L: LPG Carriers
6L: Dry Bulk Carriers
7L: Container Ships
8L: Vehicle Carriers
9L: General Cargo Ships
10L: Other Vessels
1B: Tankers of Crude Oil
2B: Tankers of Petro. Prod.
3B: Chemical Carriers
4B: LNG Carriers
5B: LPG Carriers
6B: Dry Bulk Carriers
7B: Container Ships
8B: Vehicle Carriers
9B: General Cargo Ships
10B: Other Vessels
Total
TotalAccumulation
12
34
56
78
910
1112
1314
1516
1718
1920
51.
22.
70.
30.
10.
712
.37.
10.
40.
30.
10.
10.
01.
01.
127
.42.
1%10
0.0
4.0
11.3
1.9
3.3
1.7
0.2
25.3
9.1
0.5
0.6
0.1
1.4
0.2
0.4
0.2
1.3
1.5
63.1
6.8%
152.
010
.91.
423
.214
.70.
141
.65.
30.
00.
81.
31.
10.
50.
50.
10.
71.
910
6.2
14.9
%20
0.1
5.0
14.9
1.3
41.8
20.0
0.2
11.4
2.4
0.1
1.8
1.5
1.2
1.3
0.3
0.1
0.4
103.
722
.7%
254.
66.
20.
949
.623
.20.
34.
34.
00.
50.
10.
51.
30.
60.
20.
10.
396
.730
.0%
302.
20.
50.
118
.268
.63.
74.
19.
70.
60.
20.
91.
00.
110
9.7
38.3
%35
0.3
0.9
28.9
79.1
2.8
0.9
1.8
0.4
0.9
0.7
0.1
0.5
0.2
117.
647
.2%
400.
12.
82.
427
.449
.46.
80.
14.
90.
10.
61.
60.
40.
22.
80.
20.
199
.954
.7%
450.
52.
80.
52.
41.
611
4.7
21.6
0.1
1.1
0.4
2.2
0.2
0.2
3.9
152.
166
.2%
501.
12.
40.
20.
80.
115
6.2
37.9
0.3
0.3
0.2
0.5
7.0
206.
981
.8%
550.
61.
30.
712
.615
.20.
40.
20.
41.
733
.284
.3%
601.
40.
527
.829
.20.
20.
90.
31.
962
.289
.0%
651.
50.
71.
415
.82.
80.
21.
20.
50.
10.
324
.690
.9%
700.
90.
91.
48.
10.
40.
10.
812
.591
.8%
750.
90.
25.
229
.20.
40.
10.
10.
10.
236
.594
.6%
801.
80.
21.
33.
00.
30.
11.
17.
995
.2%
850.
22.
818
.71.
60.
323
.596
.9%
901.
00.
20.
20.
11.
497
.0%
950.
40.
30.
30.
11.
197
.1%
100
0.4
0.3
0.2
0.2
1.1
97.2
%10
50.
097
.2%
110
0.1
0.4
0.5
97.3
%11
50.
30.
91.
297
.3%
120
0.2
0.2
97.4
%12
50.
21.
31.
497
.5%
130
0.1
1.1
1.1
97.6
%13
50.
20.
297
.6%
140
0.2
0.4
0.6
97.6
%14
50.
10.
20.
40.
797
.7%
150
0.6
1.9
2.5
97.8
%15
50.
213
.70.
113
.998
.9%
160
0.3
5.2
0.2
0.2
5.9
99.3
%16
50.
13.
30.
23.
699
.6%
170
0.7
0.2
0.9
99.7
%17
50.
40.
499
.7%
180
1.2
1.2
99.8
%18
50.
099
.8%
190
0.9
0.9
99.9
%19
51.
21.
210
0.0%
200
0.1
0.1
100.
0%20
50.
010
0.0%
210
0.2
0.2
100.
0%21
50.
20.
210
0.0%
220
0.0
100.
0%22
50.
010
0.0%
230
0.0
100.
0%23
50.
010
0.0%
240
0.0
100.
0%24
50.
010
0.0%
250
0.0
100.
0%T
otal
9.7
31.0
46.7
4.0
11.5
211.
064
0.4
120.
510
0.0
47.5
35.4
10.0
4.0
4.0
9.4
7.5
2.4
19.6
3.4
5.9
1,32
4Sh
are
0.7%
2.3%
3.5%
0.3%
0.9%
15.9
%48
.4%
9.1%
7.6%
3.6%
2.7%
0.8%
0.3%
0.3%
0.7%
0.6%
0.2%
1.5%
0.3%
0.4%
100.
0%N
ote)
Spec
ial f
loat
ing
units
are
incl
uded
in O
ther
ves
sels
.So
urce
)A
naly
zed
by th
e St
udy
Team
bas
ed o
n th
e SC
tran
sit d
atab
ase
of 1
999.Fi
gure
A.3
.4 E
stim
ated
Tol
l Rev
enue
by
Ves
sel T
ype
and
Size
in 1
999
Ship
Siz
e(u
p to
)(1
000
SCN
T)
A - 9
A - 10
A.4 Number of vessels transiting the Canal by O-D pairs Table A.4.1 through Table A.4.20 show number of vessels transiting the Canal by O-D pairs.

1L: Tankers of Crude Oil (Laden)Total
10 20 30 40 50 60 70 80 90 100 110 120 130 140 150 160 170 180 190 200 210 220 230 240 250 SN NS TotalS0N0 1 1 1% 1%S0N1 1 4 3 8 11% 11%S0N2 0 0% 0%S0N3 1 1 1% 1%S0N4 1 3 2 8 2 1 17 24% 23%S0N5 0 0% 0%S0N6 0 0% 0%S0N7 0 0% 0%S1N0 0 0% 0%S1N1 0 0% 0%S1N2 0 0% 0%S1N3 0 0% 0%S1N4 0 0% 0%S1N5 0 0% 0%S1N6 0 0% 0%S1N7 0 0% 0%S2N0 0 0% 0%S2N1 6 2 9 7 1 1 26 37% 35%S2N2 1 8 7 16 23% 21%S2N3 0 0% 0%S2N4 1 1 1% 1%S2N5 0 0% 0%S2N6 0 0% 0%S2N7 0 0% 0%S3N0 0 0% 0%S3N1 0 0% 0%S3N2 0 0% 0%S3N3 0 0% 0%S3N4 0 0% 0%S3N5 0 0% 0%S3N6 0 0% 0%S3N7 0 0% 0%S4N0 0 0% 0%S4N1 0 0% 0%S4N2 0 0% 0%S4N3 0 0% 0%S4N4 1 1 1% 1%S4N5 0 0% 0%S4N6 0 0% 0%S4N7 0 0% 0%S5N0 0 0% 0%S5N1 0 0% 0%S5N2 0 0% 0%S5N3 0 0% 0%S5N4 0 0% 0%S5N5 0 0% 0%S5N6 0 0% 0%S5N7 0 0% 0%S6N0 0 0% 0%S6N1 0 0% 0%S6N2 0 0% 0%S6N3 0 0% 0%S6N4 0 0% 0%S6N5 0 0% 0%S6N6 0 0% 0%S6N7 0 0% 0%S7N0 0 0% 0%S7N1 0 0% 0%S7N2 0 0% 0%S7N3 0 0% 0%S7N4 0 0% 0%S7N5 0 0% 0%S7N6 0 0% 0%S7N7 0 0% 0%N0S0 0 0% 0%N1S0 0 0% 0%N2S0 0 0% 0%N3S0 0 0% 0%N4S0 0 0% 0%N5S0 0 0% 0%N6S0 0 0% 0%N7S0 0 0% 0%N0S1 0 0% 0%N1S1 0 0% 0%N2S1 0 0% 0%N3S1 0 0% 0%N4S1 0 0% 0%N5S1 0 0% 0%N6S1 0 0% 0%N7S1 0 0% 0%N0S2 0 0% 0%N1S2 0 0% 0%N2S2 0 0% 0%N3S2 0 0% 0%N4S2 0 0% 0%N5S2 0 0% 0%N6S2 1 1 25% 1%N7S2 0 0% 0%N0S3 0 0% 0%N1S3 0 0% 0%N2S3 0 0% 0%N3S3 0 0% 0%N4S3 0 0% 0%N5S3 0 0% 0%N6S3 0 0% 0%N7S3 0 0% 0%N0S4 0 0% 0%N1S4 0 0% 0%N2S4 0 0% 0%N3S4 0 0% 0%N4S4 0 0% 0%N5S4 0 0% 0%N6S4 1 1 25% 1%N7S4 0 0% 0%N0S5 0 0% 0%N1S5 0 0% 0%N2S5 2 2 50% 3%N3S5 0 0% 0%N4S5 0 0% 0%N5S5 0 0% 0%N6S5 0 0% 0%N7S5 0 0% 0%N0S6 0 0% 0%N1S6 0 0% 0%N2S6 0 0% 0%N3S6 0 0% 0%N4S6 0 0% 0%N5S6 0 0% 0%N6S6 0 0% 0%N7S6 0 0% 0%N0S7 0 0% 0%N1S7 0 0% 0%N2S7 0 0% 0%N3S7 0 0% 0%N4S7 0 0% 0%N5S7 0 0% 0%N6S7 0 0% 0%N7S7 0 0% 0%SN Total 1 1 0 1 12 5 17 15 1 0 0 2 3 2 8 2 1 0 0 0 0 0 0 0 0 71NS Total 0 0 0 0 1 0 0 2 0 0 0 0 0 0 0 1 0 0 0 0 0 0 0 0 0 4Total 1 1 0 1 13 5 17 17 1 0 0 2 3 2 8 3 1 0 0 0 0 0 0 0 0 75Source) Analyzed by the Study Team based on the SC transit database of 1999.
Table A.4.1 Number of Vessels Transiting the Canal
A - 11
O-DVessel Size (up to) (1000 SCNT) Share

2L: Tankers of Petro. Prod. (Laden)Total
10 20 30 40 50 60 70 80 90 100 110 120 130 140 150 160 170 180 190 200 210 220 230 240 250 SN NS TotalS0N0 4 13 2 1 20 7% 5%S0N1 2 4 3 1 10 4% 2%S0N2 5 3 1 9 3% 2%S0N3 2 2 1% 0%S0N4 2 6 3 3 6 20 7% 5%S0N5 0 0% 0%S0N6 5 17 2 1 1 26 9% 6%S0N7 0 0% 0%S1N0 0 0% 0%S1N1 0 0% 0%S1N2 0 0% 0%S1N3 0 0% 0%S1N4 3 3 1% 1%S1N5 0 0% 0%S1N6 0 0% 0%S1N7 0 0% 0%S2N0 2 6 5 1 14 5% 3%S2N1 2 3 2 7 3% 2%S2N2 2 3 2 1 1 2 11 4% 3%S2N3 0 0% 0%S2N4 7 3 11 6 4 5 1 37 14% 9%S2N5 1 1 0% 0%S2N6 1 1 1 3 1% 1%S2N7 1 1 1 3 1% 1%S3N0 0 0% 0%S3N1 6 6 2% 1%S3N2 2 1 3 1% 1%S3N3 0 0% 0%S3N4 3 3 1% 1%S3N5 0 0% 0%S3N6 2 2 1% 0%S3N7 0 0% 0%S4N0 13 6 19 7% 5%S4N1 6 4 3 13 5% 3%S4N2 4 9 1 14 5% 3%S4N3 4 4 1% 1%S4N4 20 14 4 38 14% 9%S4N5 0 0% 0%S4N6 2 2 1% 0%S4N7 0 0% 0%S5N0 0 0% 0%S5N1 1 1 0% 0%S5N2 0 0% 0%S5N3 0 0% 0%S5N4 2 2 1% 0%S5N5 0 0% 0%S5N6 0 0% 0%S5N7 0 0% 0%S6N0 0 0% 0%S6N1 0 0% 0%S6N2 0 0% 0%S6N3 0 0% 0%S6N4 0 0% 0%S6N5 0 0% 0%S6N6 1 1 0% 0%S6N7 0 0% 0%S7N0 0 0% 0%S7N1 0 0% 0%S7N2 0 0% 0%S7N3 0 0% 0%S7N4 0 0% 0%S7N5 0 0% 0%S7N6 0 0% 0%S7N7 0 0% 0%N0S0 1 2 1 1 5 4% 1%N1S0 3 2 2 7 5% 2%N2S0 2 2 1 1 6 5% 1%N3S0 1 1 2 2% 0%N4S0 1 1 2 2% 0%N5S0 0 0% 0%N6S0 2 2 1 5 4% 1%N7S0 0 0% 0%N0S1 0 0% 0%N1S1 5 5 4% 1%N2S1 1 1 1% 0%N3S1 0 0% 0%N4S1 0 0% 0%N5S1 0 0% 0%N6S1 0 0% 0%N7S1 0 0% 0%N0S2 3 1 4 3% 1%N1S2 9 1 1 11 9% 3%N2S2 4 1 5 4% 1%N3S2 1 1 1% 0%N4S2 0 0% 0%N5S2 0 0% 0%N6S2 0 0% 0%N7S2 0 0% 0%N0S3 1 1 1% 0%N1S3 9 1 10 8% 2%N2S3 3 1 2 1 7 5% 2%N3S3 0 0% 0%N4S3 6 1 7 5% 2%N5S3 0 0% 0%N6S3 1 1 2 4 3% 1%N7S3 0 0% 0%N0S4 2 2 4 3% 1%N1S4 6 3 1 1 11 9% 3%N2S4 3 3 1 7 5% 2%N3S4 0 0% 0%N4S4 2 2 1 1 6 5% 1%N5S4 0 0% 0%N6S4 0 0% 0%N7S4 0 0% 0%N0S5 0 0% 0%N1S5 2 1 3 2% 1%N2S5 1 1 3 4 1 10 8% 2%N3S5 0 0% 0%N4S5 2 2 4 3% 1%N5S5 0 0% 0%N6S5 0 0% 0%N7S5 0 0% 0%N0S6 0 0% 0%N1S6 1 1 1% 0%N2S6 0 0% 0%N3S6 0 0% 0%N4S6 0 0% 0%N5S6 0 0% 0%N6S6 0 0% 0%N7S6 0 0% 0%N0S7 0 0% 0%N1S7 0 0% 0%N2S7 0 0% 0%N3S7 0 0% 0%N4S7 0 0% 0%N5S7 0 0% 0%N6S7 0 0% 0%N7S7 0 0% 0%SN Total 92 79 59 13 19 10 2 0 0 0 0 0 0 0 0 0 0 0 0 0 0 0 0 0 0 274 100% 100% 100%NS Total 55 17 13 13 20 8 2 1 0 0 0 0 0 0 0 0 0 0 0 0 0 0 0 0 0 129Total 147 96 72 26 39 18 4 1 0 0 0 0 0 0 0 0 0 0 0 0 0 0 0 0 0 403Source) Analyzed by the Study Team based on the SC transit database of 1999.
Table A.4.2 Number of Vessels Transiting the Canal
A - 12
O-DVessel Size (up to) (1000 SCNT) Share

3L: Chemical Carriers (Laden)Total
10 20 30 40 50 60 70 80 90 100 110 120 130 140 150 160 170 180 190 200 210 220 230 240 250 SN NS TotalS0N0 12 2 14 4% 2%S0N1 10 9 3 22 7% 3%S0N2 6 4 1 11 3% 1%S0N3 0 0% 0%S0N4 7 12 4 23 7% 3%S0N5 0 0% 0%S0N6 1 1 0% 0%S0N7 0 0% 0%S1N0 2 2 1% 0%S1N1 1 1 0% 0%S1N2 0 0% 0%S1N3 0 0% 0%S1N4 0 0% 0%S1N5 0 0% 0%S1N6 0 0% 0%S1N7 0 0% 0%S2N0 9 3 1 13 4% 2%S2N1 18 9 1 28 9% 4%S2N2 2 9 11 3% 1%S2N3 0 0% 0%S2N4 4 5 1 10 3% 1%S2N5 0 0% 0%S2N6 1 16 2 19 6% 3%S2N7 0 0% 0%S3N0 5 5 2% 1%S3N1 8 6 14 4% 2%S3N2 7 7 1 15 5% 2%S3N3 0 0% 0%S3N4 7 21 2 30 9% 4%S3N5 1 1 2 1% 0%S3N6 4 4 1% 1%S3N7 0 0% 0%S4N0 2 10 12 4% 2%S4N1 4 11 1 16 5% 2%S4N2 7 3 10 3% 1%S4N3 1 1 0% 0%S4N4 17 27 12 56 17% 8%S4N5 0 0% 0%S4N6 1 4 5 2% 1%S4N7 0 0% 0%S5N0 0 0% 0%S5N1 0 0% 0%S5N2 0 0% 0%S5N3 0 0% 0%S5N4 0 0% 0%S5N5 0 0% 0%S5N6 1 1 0% 0%S5N7 0 0% 0%S6N0 0 0% 0%S6N1 0 0% 0%S6N2 0 0% 0%S6N3 0 0% 0%S6N4 0 0% 0%S6N5 0 0% 0%S6N6 0 0% 0%S6N7 0 0% 0%S7N0 0 0% 0%S7N1 0 0% 0%S7N2 0 0% 0%S7N3 0 0% 0%S7N4 0 0% 0%S7N5 0 0% 0%S7N6 0 0% 0%S7N7 0 0% 0%N0S0 2 7 9 2% 1%N1S0 9 6 3 18 4% 2%N2S0 4 3 4 11 3% 1%N3S0 1 1 2 0% 0%N4S0 8 3 12 23 6% 3%N5S0 0 0% 0%N6S0 1 5 6 1% 1%N7S0 1 1 0% 0%N0S1 0 0% 0%N1S1 1 1 0% 0%N2S1 0 0% 0%N3S1 0 0% 0%N4S1 2 1 3 1% 0%N5S1 0 0% 0%N6S1 0 0% 0%N7S1 0 0% 0%N0S2 1 1 2 0% 0%N1S2 2 2 1 5 1% 1%N2S2 12 2 14 3% 2%N3S2 0 0% 0%N4S2 1 1 1 3 1% 0%N5S2 0 0% 0%N6S2 0 0% 0%N7S2 2 3 1 6 1% 1%N0S3 16 2 18 4% 2%N1S3 17 5 22 5% 3%N2S3 60 41 1 102 25% 14%N3S3 2 2 0% 0%N4S3 4 10 14 3% 2%N5S3 0 0% 0%N6S3 2 2 4 1% 1%N7S3 17 43 3 63 15% 9%N0S4 4 4 8 2% 1%N1S4 14 3 3 20 5% 3%N2S4 4 3 7 2% 1%N3S4 1 1 0% 0%N4S4 10 12 6 28 7% 4%N5S4 1 1 0% 0%N6S4 0 0% 0%N7S4 0 0% 0%N0S5 1 2 3 1% 0%N1S5 2 2 0% 0%N2S5 1 3 4 1% 1%N3S5 2 1 3 1% 0%N4S5 1 1 0% 0%N5S5 1 1 0% 0%N6S5 0 0% 0%N7S5 1 1 2 0% 0%N0S6 0 0% 0%N1S6 0 0% 0%N2S6 0 0% 0%N3S6 0 0% 0%N4S6 0 0% 0%N5S6 0 0% 0%N6S6 0 0% 0%N7S6 0 0% 0%N0S7 0 0% 0%N1S7 0 0% 0%N2S7 0 0% 0%N3S7 0 0% 0%N4S7 0 0% 0%N5S7 0 0% 0%N6S7 0 0% 0%N7S7 0 0% 0%SN Total 136 161 29 0 0 0 0 0 0 0 0 0 0 0 0 0 0 0 0 0 0 0 0 0 0 326 100% 100% 100%NS Total 203 169 37 0 1 0 0 0 0 0 0 0 0 0 0 0 0 0 0 0 0 0 0 0 0 410Total 339 330 66 0 1 0 0 0 0 0 0 0 0 0 0 0 0 0 0 0 0 0 0 0 0 736Source) Analyzed by the Study Team based on the SC transit database of 1999.
A - 13
Table A.4.3 Number of Vessels Transiting the Canal
O-DVessel Size (up to) (1000 SCNT) Share

4L: LNG Carriers (Laden)Total
10 20 30 40 50 60 70 80 90 100 110 120 130 140 150 160 170 180 190 200 210 220 230 240 250 SN NS TotalS0N0 0 0% 0%S0N1 0 0% 0%S0N2 0 0% 0%S0N3 0 0% 0%S0N4 0 0% 0%S0N5 0 0% 0%S0N6 0 0% 0%S0N7 0 0% 0%S1N0 0 0% 0%S1N1 0 0% 0%S1N2 0 0% 0%S1N3 0 0% 0%S1N4 0 0% 0%S1N5 0 0% 0%S1N6 0 0% 0%S1N7 0 0% 0%S2N0 0 0% 0%S2N1 4 1 5 17% 17%S2N2 7 6 7 20 69% 69%S2N3 1 1 3% 3%S2N4 1 1 3% 3%S2N5 0 0% 0%S2N6 2 2 7% 7%S2N7 0 0% 0%S3N0 0 0% 0%S3N1 0 0% 0%S3N2 0 0% 0%S3N3 0 0% 0%S3N4 0 0% 0%S3N5 0 0% 0%S3N6 0 0% 0%S3N7 0 0% 0%S4N0 0 0% 0%S4N1 0 0% 0%S4N2 0 0% 0%S4N3 0 0% 0%S4N4 0 0% 0%S4N5 0 0% 0%S4N6 0 0% 0%S4N7 0 0% 0%S5N0 0 0% 0%S5N1 0 0% 0%S5N2 0 0% 0%S5N3 0 0% 0%S5N4 0 0% 0%S5N5 0 0% 0%S5N6 0 0% 0%S5N7 0 0% 0%S6N0 0 0% 0%S6N1 0 0% 0%S6N2 0 0% 0%S6N3 0 0% 0%S6N4 0 0% 0%S6N5 0 0% 0%S6N6 0 0% 0%S6N7 0 0% 0%S7N0 0 0% 0%S7N1 0 0% 0%S7N2 0 0% 0%S7N3 0 0% 0%S7N4 0 0% 0%S7N5 0 0% 0%S7N6 0 0% 0%S7N7 0 0% 0%N0S0 0 0%N1S0 0 0%N2S0 0 0%N3S0 0 0%N4S0 0 0%N5S0 0 0%N6S0 0 0%N7S0 0 0%N0S1 0 0%N1S1 0 0%N2S1 0 0%N3S1 0 0%N4S1 0 0%N5S1 0 0%N6S1 0 0%N7S1 0 0%N0S2 0 0%N1S2 0 0%N2S2 0 0%N3S2 0 0%N4S2 0 0%N5S2 0 0%N6S2 0 0%N7S2 0 0%N0S3 0 0%N1S3 0 0%N2S3 0 0%N3S3 0 0%N4S3 0 0%N5S3 0 0%N6S3 0 0%N7S3 0 0%N0S4 0 0%N1S4 0 0%N2S4 0 0%N3S4 0 0%N4S4 0 0%N5S4 0 0%N6S4 0 0%N7S4 0 0%N0S5 0 0%N1S5 0 0%N2S5 0 0%N3S5 0 0%N4S5 0 0%N5S5 0 0%N6S5 0 0%N7S5 0 0%N0S6 0 0%N1S6 0 0%N2S6 0 0%N3S6 0 0%N4S6 0 0%N5S6 0 0%N6S6 0 0%N7S6 0 0%N0S7 0 0%N1S7 0 0%N2S7 0 0%N3S7 0 0%N4S7 0 0%N5S7 0 0%N6S7 0 0%N7S7 0 0%SN Total 0 0 0 0 12 0 6 9 0 2 0 0 0 0 0 0 0 0 0 0 0 0 0 0 0 29 100% 100%NS Total 0 0 0 0 0 0 0 0 0 0 0 0 0 0 0 0 0 0 0 0 0 0 0 0 0 0Total 0 0 0 0 12 0 6 9 0 2 0 0 0 0 0 0 0 0 0 0 0 0 0 0 0 29Source) Analyzed by the Study Team based on the SC transit database of 1999.
A - 14
Table A.4.4 Number of Vessels Transiting the Canal
O-DVessel Size (up to) (1000 SCNT) Share
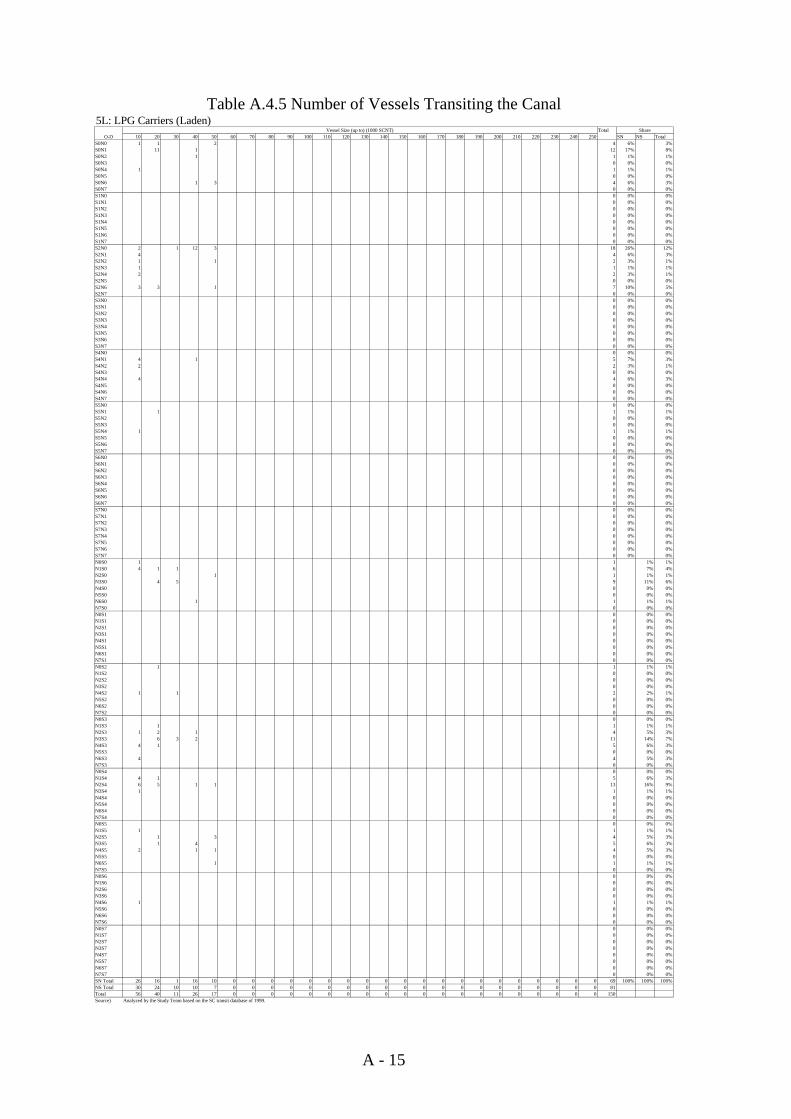
5L: LPG Carriers (Laden)Total
10 20 30 40 50 60 70 80 90 100 110 120 130 140 150 160 170 180 190 200 210 220 230 240 250 SN NS TotalS0N0 1 1 2 4 6% 3%S0N1 11 1 12 17% 8%S0N2 1 1 1% 1%S0N3 0 0% 0%S0N4 1 1 1% 1%S0N5 0 0% 0%S0N6 1 3 4 6% 3%S0N7 0 0% 0%S1N0 0 0% 0%S1N1 0 0% 0%S1N2 0 0% 0%S1N3 0 0% 0%S1N4 0 0% 0%S1N5 0 0% 0%S1N6 0 0% 0%S1N7 0 0% 0%S2N0 2 1 12 3 18 26% 12%S2N1 4 4 6% 3%S2N2 1 1 2 3% 1%S2N3 1 1 1% 1%S2N4 2 2 3% 1%S2N5 0 0% 0%S2N6 3 3 1 7 10% 5%S2N7 0 0% 0%S3N0 0 0% 0%S3N1 0 0% 0%S3N2 0 0% 0%S3N3 0 0% 0%S3N4 0 0% 0%S3N5 0 0% 0%S3N6 0 0% 0%S3N7 0 0% 0%S4N0 0 0% 0%S4N1 4 1 5 7% 3%S4N2 2 2 3% 1%S4N3 0 0% 0%S4N4 4 4 6% 3%S4N5 0 0% 0%S4N6 0 0% 0%S4N7 0 0% 0%S5N0 0 0% 0%S5N1 1 1 1% 1%S5N2 0 0% 0%S5N3 0 0% 0%S5N4 1 1 1% 1%S5N5 0 0% 0%S5N6 0 0% 0%S5N7 0 0% 0%S6N0 0 0% 0%S6N1 0 0% 0%S6N2 0 0% 0%S6N3 0 0% 0%S6N4 0 0% 0%S6N5 0 0% 0%S6N6 0 0% 0%S6N7 0 0% 0%S7N0 0 0% 0%S7N1 0 0% 0%S7N2 0 0% 0%S7N3 0 0% 0%S7N4 0 0% 0%S7N5 0 0% 0%S7N6 0 0% 0%S7N7 0 0% 0%N0S0 1 1 1% 1%N1S0 4 1 1 6 7% 4%N2S0 1 1 1% 1%N3S0 4 5 9 11% 6%N4S0 0 0% 0%N5S0 0 0% 0%N6S0 1 1 1% 1%N7S0 0 0% 0%N0S1 0 0% 0%N1S1 0 0% 0%N2S1 0 0% 0%N3S1 0 0% 0%N4S1 0 0% 0%N5S1 0 0% 0%N6S1 0 0% 0%N7S1 0 0% 0%N0S2 1 1 1% 1%N1S2 0 0% 0%N2S2 0 0% 0%N3S2 0 0% 0%N4S2 1 1 2 2% 1%N5S2 0 0% 0%N6S2 0 0% 0%N7S2 0 0% 0%N0S3 0 0% 0%N1S3 1 1 1% 1%N2S3 1 2 1 4 5% 3%N3S3 6 3 2 11 14% 7%N4S3 4 1 5 6% 3%N5S3 0 0% 0%N6S3 4 4 5% 3%N7S3 0 0% 0%N0S4 0 0% 0%N1S4 4 1 5 6% 3%N2S4 6 5 1 1 13 16% 9%N3S4 1 1 1% 1%N4S4 0 0% 0%N5S4 0 0% 0%N6S4 0 0% 0%N7S4 0 0% 0%N0S5 0 0% 0%N1S5 1 1 1% 1%N2S5 1 3 4 5% 3%N3S5 1 4 5 6% 3%N4S5 2 1 1 4 5% 3%N5S5 0 0% 0%N6S5 1 1 1% 1%N7S5 0 0% 0%N0S6 0 0% 0%N1S6 0 0% 0%N2S6 0 0% 0%N3S6 0 0% 0%N4S6 1 1 1% 1%N5S6 0 0% 0%N6S6 0 0% 0%N7S6 0 0% 0%N0S7 0 0% 0%N1S7 0 0% 0%N2S7 0 0% 0%N3S7 0 0% 0%N4S7 0 0% 0%N5S7 0 0% 0%N6S7 0 0% 0%N7S7 0 0% 0%SN Total 26 16 1 16 10 0 0 0 0 0 0 0 0 0 0 0 0 0 0 0 0 0 0 0 0 69 100% 100% 100%NS Total 30 24 10 10 7 0 0 0 0 0 0 0 0 0 0 0 0 0 0 0 0 0 0 0 0 81Total 56 40 11 26 17 0 0 0 0 0 0 0 0 0 0 0 0 0 0 0 0 0 0 0 0 150Source) Analyzed by the Study Team based on the SC transit database of 1999.
A - 15
Table A.4.5 Number of Vessels Transiting the Canal
O-DVessel Size (up to) (1000 SCNT) Share

6L: Dry Bulk Carriers (Laden)Total
10 20 30 40 50 60 70 80 90 100 110 120 130 140 150 160 170 180 190 200 210 220 230 240 250 SN NS TotalS0N0 2 31 7 1 41 4% 2%S0N1 5 13 3 21 2% 1%S0N2 2 4 5 11 1% 0%S0N3 1 2 2 5 0% 0%S0N4 2 10 6 2 1 21 2% 1%S0N5 1 1 0% 0%S0N6 1 1 0% 0%S0N7 1 1 2 0% 0%S1N0 1 12 10 1 9 7 1 1 42 4% 2%S1N1 1 1 6 8 1% 0%S1N2 0 0% 0%S1N3 1 1 0% 0%S1N4 3 3 0% 0%S1N5 0 0% 0%S1N6 0 0% 0%S1N7 0 0% 0%S2N0 7 1 8 1% 0%S2N1 1 1 2 0% 0%S2N2 23 10 1 34 3% 1%S2N3 0 0% 0%S2N4 2 2 0% 0%S2N5 0 0% 0%S2N6 10 11 21 2% 1%S2N7 4 14 18 2% 1%S3N0 2 2 2 1 1 8 1% 0%S3N1 3 5 2 1 1 12 1% 0%S3N2 1 7 2 10 1% 0%S3N3 1 6 1 3 4 15 1% 1%S3N4 2 6 1 1 1 11 1% 0%S3N5 1 1 0% 0%S3N6 7 3 10 1% 0%S3N7 0 0% 0%S4N0 4 23 26 4 2 2 61 6% 2%S4N1 11 19 22 2 6 1 61 6% 2%S4N2 1 9 14 27 1 52 5% 2%S4N3 9 11 5 25 2% 1%S4N4 1 51 31 28 1 1 113 10% 4%S4N5 1 6 1 8 1% 0%S4N6 2 2 4 0% 0%S4N7 1 1 0% 0%S5N0 1 4 25 6 36 3% 1%S5N1 9 3 10 1 23 2% 1%S5N2 8 13 4 25 2% 1%S5N3 6 6 4 16 1% 1%S5N4 2 16 34 49 3 1 105 10% 4%S5N5 1 2 3 0% 0%S5N6 1 1 2 0% 0%S5N7 1 1 0% 0%S6N0 2 3 23 1 6 12 5 1 53 5% 2%S6N1 8 5 41 7 3 3 67 6% 2%S6N2 1 3 9 2 15 1% 1%S6N3 1 1 15 6 23 2% 1%S6N4 5 23 22 15 23 1 89 8% 3%S6N5 1 1 0% 0%S6N6 4 1 5 0% 0%S6N7 0 0% 0%S7N0 0 0% 0%S7N1 0 0% 0%S7N2 0 0% 0%S7N3 0 0% 0%S7N4 0 0% 0%S7N5 0 0% 0%S7N6 0 0% 0%S7N7 0 0% 0%N0S0 2 12 1 15 1% 1%N1S0 7 17 7 11 1 1 2 1 47 3% 2%N2S0 1 5 1 4 11 1% 0%N3S0 1 43 6 5 1 56 3% 2%N4S0 2 18 5 52 1 1 4 2 85 5% 3%N5S0 11 2 1 1 1 16 1% 1%N6S0 1 18 8 19 2 2 50 3% 2%N7S0 3 1 4 0% 0%N0S1 3 3 0% 0%N1S1 3 3 0% 0%N2S1 1 1 2 0% 0%N3S1 3 3 0% 0%N4S1 1 1 2 0% 0%N5S1 1 1 0% 0%N6S1 1 1 0% 0%N7S1 0 0% 0%N0S2 1 20 17 4 42 3% 2%N1S2 6 2 14 1 23 1% 1%N2S2 7 6 1 14 1% 1%N3S2 1 25 5 6 37 2% 1%N4S2 1 7 5 31 2 1 3 4 1 55 3% 2%N5S2 1 1 0% 0%N6S2 3 1 25 1 1 2 33 2% 1%N7S2 4 2 1 7 0% 0%N0S3 4 34 3 4 45 3% 2%N1S3 1 12 5 2 20 1% 1%N2S3 1 7 3 11 1% 0%N3S3 2 66 18 4 90 6% 3%N4S3 1 30 7 4 42 3% 2%N5S3 16 5 1 22 1% 1%N6S3 20 45 10 75 5% 3%N7S3 10 7 4 21 1% 1%N0S4 13 10 23 1% 1%N1S4 3 9 2 14 1% 1%N2S4 9 7 16 1% 1%N3S4 4 65 99 9 177 11% 6%N4S4 30 50 1 81 5% 3%N5S4 1 15 14 2 32 2% 1%N6S4 2 12 4 1 19 1% 1%N7S4 2 2 0% 0%N0S5 8 2 2 12 1% 0%N1S5 4 5 13 22 1% 1%N2S5 2 2 0% 0%N3S5 1 25 128 42 1 197 12% 7%N4S5 1 21 27 20 69 4% 3%N5S5 1 11 31 56 99 6% 4%N6S5 2 8 2 12 1% 0%N7S5 7 3 5 15 1% 1%N0S6 0 0% 0%N1S6 0 0% 0%N2S6 1 1 0% 0%N3S6 1 1 0% 0%N4S6 1 1 0% 0%N5S6 0 0% 0%N6S6 1 1 0% 0%N7S6 0 0% 0%N0S7 0 0% 0%N1S7 0 0% 0%N2S7 0 0% 0%N3S7 0 0% 0%N4S7 0 0% 0%N5S7 0 0% 0%N6S7 0 0% 0%N7S7 0 0% 0%SN Total 31 332 307 288 8 2 11 67 45 6 1 0 0 0 0 0 0 0 0 0 0 0 0 0 0 1,098 100% 100% 100%NS Total 38 630 565 361 10 8 11 8 2 0 0 0 0 0 0 0 0 0 0 0 0 0 0 0 0 1,633Total 69 962 872 649 18 10 22 75 47 6 1 0 0 0 0 0 0 0 0 0 0 0 0 0 0 2,731Source) Analyzed by the Study Team based on the SC transit database of 1999.
A - 16
Table A.4.6 Number of Vessels Transiting the Canal
O-DVessel Size (up to) (1000 SCNT) Share

7L: Container Ships (Laden)Total
10 20 30 40 50 60 70 80 90 100 110 120 130 140 150 160 170 180 190 200 210 220 230 240 250 SN NS TotalS0N0 1 27 109 1 138 6% 3%S0N1 1 17 44 48 108 2 220 10% 5%S0N2 31 3 36 6 3 79 4% 2%S0N3 0 0% 0%S0N4 1 6 2 1 48 58 3% 1%S0N5 0 0% 0%S0N6 1 1 0% 0%S0N7 0 0% 0%S1N0 19 1 20 1% 0%S1N1 17 17 1% 0%S1N2 1 1 2 0% 0%S1N3 0 0% 0%S1N4 0 0% 0%S1N5 0 0% 0%S1N6 0 0% 0%S1N7 0 0% 0%S2N0 2 1 3 0% 0%S2N1 1 3 38 4 46 2% 1%S2N2 9 2 10 21 1% 0%S2N3 0 0% 0%S2N4 1 1 0% 0%S2N5 0 0% 0%S2N6 1 1 0% 0%S2N7 0 0% 0%S3N0 1 4 73 39 117 5% 3%S3N1 3 23 92 28 4 1 151 7% 3%S3N2 13 36 2 51 2% 1%S3N3 0 0% 0%S3N4 1 126 31 158 7% 4%S3N5 0 0% 0%S3N6 1 1 0% 0%S3N7 0 0% 0%S4N0 4 27 42 53 94 220 10% 5%S4N1 7 12 157 89 12 4 281 13% 6%S4N2 1 1 1 17 31 51 2% 1%S4N3 0 0% 0%S4N4 2 11 67 23 272 85 30 28 518 24% 12%S4N5 0 0% 0%S4N6 0 0% 0%S4N7 0 0% 0%S5N0 1 4 2 7 0% 0%S5N1 3 2 1 1 1 8 0% 0%S5N2 0 0% 0%S5N3 0 0% 0%S5N4 5 2 1 8 0% 0%S5N5 0 0% 0%S5N6 0 0% 0%S5N7 0 0% 0%S6N0 0 0% 0%S6N1 1 3 4 0% 0%S6N2 1 1 0% 0%S6N3 0 0% 0%S6N4 0 0% 0%S6N5 0 0% 0%S6N6 0 0% 0%S6N7 0 0% 0%S7N0 0 0% 0%S7N1 0 0% 0%S7N2 0 0% 0%S7N3 0 0% 0%S7N4 0 0% 0%S7N5 0 0% 0%S7N6 0 0% 0%S7N7 0 0% 0%N0S0 27 53 44 12 136 6% 3%N1S0 3 45 124 136 206 5 7 526 24% 12%N2S0 1 6 1 2 10 0% 0%N3S0 1 3 4 0% 0%N4S0 5 11 10 3 23 46 98 5% 2%N5S0 0 0% 0%N6S0 1 1 2 0% 0%N7S0 0 0% 0%N0S1 1 1 0% 0%N1S1 3 46 49 2% 1%N2S1 1 1 0% 0%N3S1 0 0% 0%N4S1 2 2 4 0% 0%N5S1 0 0% 0%N6S1 0 0% 0%N7S1 0 0% 0%N0S2 1 1 2 4 0% 0%N1S2 2 1 44 15 62 3% 1%N2S2 11 1 11 2 10 23 58 3% 1%N3S2 1 1 2 0% 0%N4S2 32 7 1 2 42 2% 1%N5S2 0 0% 0%N6S2 1 1 0% 0%N7S2 0 0% 0%N0S3 2 12 37 1 52 2% 1%N1S3 9 1 10 0% 0%N2S3 0 0% 0%N3S3 1 1 0% 0%N4S3 15 33 1 159 18 2 228 11% 5%N5S3 0 0% 0%N6S3 0 0% 0%N7S3 0 0% 0%N0S4 1 2 6 67 71 147 7% 3%N1S4 21 12 53 9 2 97 5% 2%N2S4 1 1 3 1 4 13 23 1% 1%N3S4 1 1 2 0% 0%N4S4 2 9 64 32 290 34 45 42 2 520 24% 12%N5S4 0 0% 0%N6S4 1 1 0% 0%N7S4 0 0% 0%N0S5 4 4 0% 0%N1S5 1 2 5 8 0% 0%N2S5 1 1 0% 0%N3S5 0 0% 0%N4S5 1 4 1 1 3 10 0% 0%N5S5 0 0% 0%N6S5 0 0% 0%N7S5 0 0% 0%N0S6 1 8 9 0% 0%N1S6 1 38 39 2% 1%N2S6 1 2 3 0% 0%N3S6 0 0% 0%N4S6 0 0% 0%N5S6 0 0% 0%N6S6 0 0% 0%N7S6 0 0% 0%N0S7 0 0% 0%N1S7 0 0% 0%N2S7 0 0% 0%N3S7 0 0% 0%N4S7 0 0% 0%N5S7 0 0% 0%N6S7 0 0% 0%N7S7 0 0% 0%SN Total 27 196 422 469 816 102 62 55 34 0 0 0 0 0 0 0 0 0 0 0 0 0 0 0 0 2,183 100% 100% 100%NS Total 33 212 382 465 804 104 49 68 38 0 0 0 0 0 0 0 0 0 0 0 0 0 0 0 0 2,155Total 60 408 804 934 1620 206 111 123 72 0 0 0 0 0 0 0 0 0 0 0 0 0 0 0 0 4,338Source) Analyzed by the Study Team based on the SC transit database of 1999.
A - 17
Table A.4.7 Number of Vessels Transiting the Canal
O-DVessel Size (up to) (1000 SCNT) Share
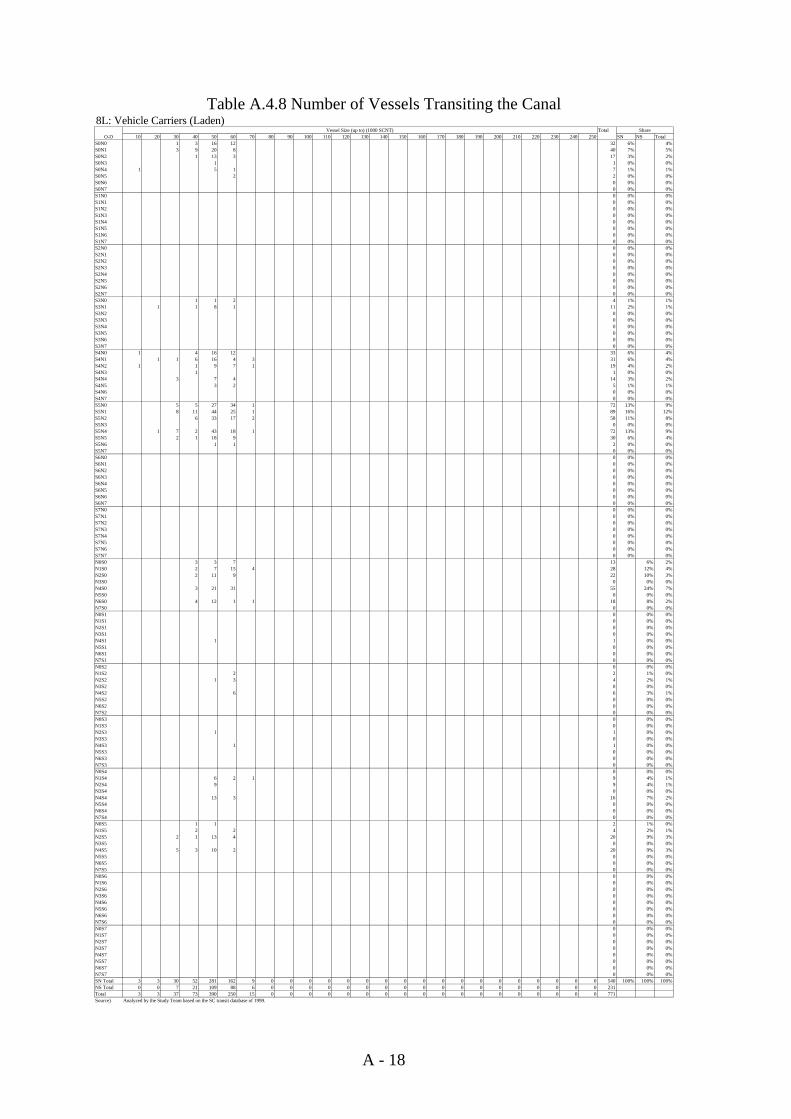
8L: Vehicle Carriers (Laden)Total
10 20 30 40 50 60 70 80 90 100 110 120 130 140 150 160 170 180 190 200 210 220 230 240 250 SN NS TotalS0N0 1 3 16 12 32 6% 4%S0N1 3 9 20 8 40 7% 5%S0N2 1 13 3 17 3% 2%S0N3 1 1 0% 0%S0N4 1 5 1 7 1% 1%S0N5 2 2 0% 0%S0N6 0 0% 0%S0N7 0 0% 0%S1N0 0 0% 0%S1N1 0 0% 0%S1N2 0 0% 0%S1N3 0 0% 0%S1N4 0 0% 0%S1N5 0 0% 0%S1N6 0 0% 0%S1N7 0 0% 0%S2N0 0 0% 0%S2N1 0 0% 0%S2N2 0 0% 0%S2N3 0 0% 0%S2N4 0 0% 0%S2N5 0 0% 0%S2N6 0 0% 0%S2N7 0 0% 0%S3N0 1 1 2 4 1% 1%S3N1 1 1 8 1 11 2% 1%S3N2 0 0% 0%S3N3 0 0% 0%S3N4 0 0% 0%S3N5 0 0% 0%S3N6 0 0% 0%S3N7 0 0% 0%S4N0 1 4 16 12 33 6% 4%S4N1 1 1 6 16 4 3 31 6% 4%S4N2 1 1 9 7 1 19 4% 2%S4N3 1 1 0% 0%S4N4 3 7 4 14 3% 2%S4N5 3 2 5 1% 1%S4N6 0 0% 0%S4N7 0 0% 0%S5N0 5 5 27 34 1 72 13% 9%S5N1 8 11 44 25 1 89 16% 12%S5N2 6 33 17 2 58 11% 8%S5N3 0 0% 0%S5N4 1 7 2 43 18 1 72 13% 9%S5N5 2 1 18 9 30 6% 4%S5N6 1 1 2 0% 0%S5N7 0 0% 0%S6N0 0 0% 0%S6N1 0 0% 0%S6N2 0 0% 0%S6N3 0 0% 0%S6N4 0 0% 0%S6N5 0 0% 0%S6N6 0 0% 0%S6N7 0 0% 0%S7N0 0 0% 0%S7N1 0 0% 0%S7N2 0 0% 0%S7N3 0 0% 0%S7N4 0 0% 0%S7N5 0 0% 0%S7N6 0 0% 0%S7N7 0 0% 0%N0S0 3 3 7 13 6% 2%N1S0 2 7 15 4 28 12% 4%N2S0 2 11 9 22 10% 3%N3S0 0 0% 0%N4S0 3 21 31 55 24% 7%N5S0 0 0% 0%N6S0 4 12 1 1 18 8% 2%N7S0 0 0% 0%N0S1 0 0% 0%N1S1 0 0% 0%N2S1 0 0% 0%N3S1 0 0% 0%N4S1 1 1 0% 0%N5S1 0 0% 0%N6S1 0 0% 0%N7S1 0 0% 0%N0S2 0 0% 0%N1S2 2 2 1% 0%N2S2 1 3 4 2% 1%N3S2 0 0% 0%N4S2 6 6 3% 1%N5S2 0 0% 0%N6S2 0 0% 0%N7S2 0 0% 0%N0S3 0 0% 0%N1S3 0 0% 0%N2S3 1 1 0% 0%N3S3 0 0% 0%N4S3 1 1 0% 0%N5S3 0 0% 0%N6S3 0 0% 0%N7S3 0 0% 0%N0S4 0 0% 0%N1S4 6 2 1 9 4% 1%N2S4 9 9 4% 1%N3S4 0 0% 0%N4S4 13 3 16 7% 2%N5S4 0 0% 0%N6S4 0 0% 0%N7S4 0 0% 0%N0S5 1 1 2 1% 0%N1S5 2 2 4 2% 1%N2S5 2 1 13 4 20 9% 3%N3S5 0 0% 0%N4S5 5 3 10 2 20 9% 3%N5S5 0 0% 0%N6S5 0 0% 0%N7S5 0 0% 0%N0S6 0 0% 0%N1S6 0 0% 0%N2S6 0 0% 0%N3S6 0 0% 0%N4S6 0 0% 0%N5S6 0 0% 0%N6S6 0 0% 0%N7S6 0 0% 0%N0S7 0 0% 0%N1S7 0 0% 0%N2S7 0 0% 0%N3S7 0 0% 0%N4S7 0 0% 0%N5S7 0 0% 0%N6S7 0 0% 0%N7S7 0 0% 0%SN Total 3 3 30 52 281 162 9 0 0 0 0 0 0 0 0 0 0 0 0 0 0 0 0 0 0 540 100% 100% 100%NS Total 0 0 7 21 109 88 6 0 0 0 0 0 0 0 0 0 0 0 0 0 0 0 0 0 0 231Total 3 3 37 73 390 250 15 0 0 0 0 0 0 0 0 0 0 0 0 0 0 0 0 0 0 771Source) Analyzed by the Study Team based on the SC transit database of 1999.
A - 18
Table A.4.8 Number of Vessels Transiting the Canal
O-DVessel Size (up to) (1000 SCNT) Share

9L: General Cargo Ships (Laden)Total
10 20 30 40 50 60 70 80 90 100 110 120 130 140 150 160 170 180 190 200 210 220 230 240 250 SN NS TotalS0N0 104 34 3 141 16% 7%S0N1 86 15 101 12% 5%S0N2 26 26 52 6% 3%S0N3 11 2 1 14 2% 1%S0N4 27 9 36 4% 2%S0N5 0 0% 0%S0N6 3 1 1 5 1% 0%S0N7 3 3 0% 0%S1N0 2 7 9 1% 0%S1N1 5 3 8 1% 0%S1N2 0 0% 0%S1N3 0 0% 0%S1N4 0 0% 0%S1N5 0 0% 0%S1N6 0 0% 0%S1N7 0 0% 0%S2N0 12 15 27 3% 1%S2N1 5 10 2 17 2% 1%S2N2 42 33 75 9% 4%S2N3 0 0% 0%S2N4 4 4 0% 0%S2N5 0 0% 0%S2N6 1 2 1 4 0% 0%S2N7 0 0% 0%S3N0 14 7 21 2% 1%S3N1 24 29 1 54 6% 3%S3N2 6 8 14 2% 1%S3N3 14 14 2% 1%S3N4 5 10 15 2% 1%S3N5 0 0% 0%S3N6 1 14 15 2% 1%S3N7 1 1 0% 0%S4N0 30 35 3 68 8% 3%S4N1 10 13 7 5 35 4% 2%S4N2 10 13 23 3% 1%S4N3 11 1 12 1% 1%S4N4 4 24 28 3% 1%S4N5 2 1 3 0% 0%S4N6 2 12 14 2% 1%S4N7 0 0% 0%S5N0 10 10 20 2% 1%S5N1 1 3 4 0% 0%S5N2 3 7 10 1% 0%S5N3 0 0% 0%S5N4 7 5 1 13 1% 1%S5N5 1 1 0% 0%S5N6 1 1 0% 0%S5N7 0 0% 0%S6N0 0 0% 0%S6N1 2 2 0% 0%S6N2 4 1 5 1% 0%S6N3 0 0% 0%S6N4 1 1 0% 0%S6N5 0 0% 0%S6N6 0 0% 0%S6N7 0 0% 0%S7N0 0 0% 0%S7N1 0 0% 0%S7N2 0 0% 0%S7N3 0 0% 0%S7N4 0 0% 0%S7N5 0 0% 0%S7N6 0 0% 0%S7N7 0 0% 0%N0S0 66 24 90 8% 4%N1S0 99 44 2 145 13% 7%N2S0 20 18 1 39 3% 2%N3S0 107 20 1 128 11% 6%N4S0 30 60 15 1 106 9% 5%N5S0 12 4 16 1% 1%N6S0 9 15 14 38 3% 2%N7S0 3 3 0% 0%N0S1 7 2 9 1% 0%N1S1 7 3 10 1% 0%N2S1 2 2 0% 0%N3S1 9 9 1% 0%N4S1 1 2 3 0% 0%N5S1 2 2 0% 0%N6S1 0 0% 0%N7S1 0 0% 0%N0S2 11 6 1 18 2% 1%N1S2 30 29 59 5% 3%N2S2 15 22 37 3% 2%N3S2 22 1 23 2% 1%N4S2 16 23 4 43 4% 2%N5S2 2 2 0% 0%N6S2 5 5 10 1% 0%N7S2 1 1 0% 0%N0S3 15 16 31 3% 2%N1S3 22 17 39 3% 2%N2S3 3 5 8 1% 0%N3S3 22 15 1 38 3% 2%N4S3 9 13 22 2% 1%N5S3 7 1 8 1% 0%N6S3 4 4 0% 0%N7S3 2 2 0% 0%N0S4 5 7 12 1% 1%N1S4 11 13 2 26 2% 1%N2S4 5 6 11 1% 1%N3S4 20 11 1 32 3% 2%N4S4 8 9 2 19 2% 1%N5S4 6 2 8 1% 0%N6S4 0 0% 0%N7S4 3 3 0% 0%N0S5 1 9 10 1% 0%N1S5 9 8 17 1% 1%N2S5 5 2 7 1% 0%N3S5 3 7 1 11 1% 1%N4S5 10 10 1 21 2% 1%N5S5 1 3 4 0% 0%N6S5 0 0% 0%N7S5 0 0% 0%N0S6 1 1 2 0% 0%N1S6 2 2 0% 0%N2S6 1 1 0% 0%N3S6 0 0% 0%N4S6 3 3 0% 0%N5S6 0 0% 0%N6S6 1 1 0% 0%N7S6 0 0% 0%N0S7 0 0% 0%N1S7 1 1 0% 0%N2S7 0 0% 0%N3S7 0 0% 0%N4S7 0 0% 0%N5S7 0 0% 0%N6S7 0 0% 0%N7S7 0 0% 0%SN Total 488 342 34 6 0 0 0 0 0 0 0 0 0 0 0 0 0 0 0 0 0 0 0 0 0 870 100% 100% 100%NS Total 647 442 45 2 0 0 0 0 0 0 0 0 0 0 0 0 0 0 0 0 0 0 0 0 0 1,136Total 1135 784 79 8 0 0 0 0 0 0 0 0 0 0 0 0 0 0 0 0 0 0 0 0 0 2,006Source) Analyzed by the Study Team based on the SC transit database of 1999.
A - 19
Table A.4.9 Number of Vessels Transiting the Canal
O-DVessel Size (up to) (1000 SCNT) Share

10L: Other Vessels (Laden)Total
10 20 30 40 50 60 70 80 90 100 110 120 130 140 150 160 170 180 190 200 210 220 230 240 250 SN NS TotalS0N0 79 14 13 1 1 1 2 3 114 25% 11%S0N1 49 8 24 17 98 21% 10%S0N2 12 9 21 5% 2%S0N3 0 0% 0%S0N4 7 7 2% 1%S0N5 0 0% 0%S0N6 2 1 1 4 1% 0%S0N7 4 4 1% 0%S1N0 9 1 10 2% 1%S1N1 9 1 10 2% 1%S1N2 17 17 4% 2%S1N3 0 0% 0%S1N4 2 2 0% 0%S1N5 0 0% 0%S1N6 0 0% 0%S1N7 0 0% 0%S2N0 9 2 11 2% 1%S2N1 16 1 1 18 4% 2%S2N2 13 13 3% 1%S2N3 1 1 0% 0%S2N4 11 1 12 3% 1%S2N5 0 0% 0%S2N6 1 1 0% 0%S2N7 0 0% 0%S3N0 2 1 1 4 1% 0%S3N1 2 1 1 4 1% 0%S3N2 5 5 1% 0%S3N3 1 1 0% 0%S3N4 1 3 4 1% 0%S3N5 0 0% 0%S3N6 1 1 2 0% 0%S3N7 0 0% 0%S4N0 10 2 1 13 3% 1%S4N1 12 3 15 3% 1%S4N2 6 1 1 8 2% 1%S4N3 3 1 4 1% 0%S4N4 11 2 1 14 3% 1%S4N5 1 1 0% 0%S4N6 14 1 15 3% 1%S4N7 2 2 0% 0%S5N0 3 1 1 5 1% 0%S5N1 1 1 0% 0%S5N2 6 6 1% 1%S5N3 2 2 0% 0%S5N4 1 1 0% 0%S5N5 0 0% 0%S5N6 2 2 0% 0%S5N7 2 2 0% 0%S6N0 1 1 0% 0%S6N1 3 3 1% 0%S6N2 2 2 0% 0%S6N3 0 0% 0%S6N4 1 1 0% 0%S6N5 0 0% 0%S6N6 0 0% 0%S6N7 0 0% 0%S7N0 0 0% 0%S7N1 0 0% 0%S7N2 0 0% 0%S7N3 0 0% 0%S7N4 0 0% 0%S7N5 0 0% 0%S7N6 0 0% 0%S7N7 0 0% 0%N0S0 70 6 19 1 1 1 1 2 101 19% 10%N1S0 111 9 24 17 161 30% 16%N2S0 14 13 1 28 5% 3%N3S0 8 4 1 13 2% 1%N4S0 11 2 13 2% 1%N5S0 0 0% 0%N6S0 34 2 5 5 46 8% 5%N7S0 3 3 1% 0%N0S1 1 1 0% 0%N1S1 3 4 7 1% 1%N2S1 11 11 2% 1%N3S1 0 0% 0%N4S1 1 1 0% 0%N5S1 0 0% 0%N6S1 0 0% 0%N7S1 0 0% 0%N0S2 7 3 10 2% 1%N1S2 23 1 24 4% 2%N2S2 8 8 1% 1%N3S2 2 1 3 1% 0%N4S2 6 1 7 1% 1%N5S2 0 0% 0%N6S2 3 3 1% 0%N7S2 1 1 2 0% 0%N0S3 4 2 1 7 1% 1%N1S3 2 1 3 1% 0%N2S3 2 1 1 4 1% 0%N3S3 3 1 4 1% 0%N4S3 5 2 7 1% 1%N5S3 0 0% 0%N6S3 2 2 0% 0%N7S3 1 1 0% 0%N0S4 2 1 3 1% 0%N1S4 13 1 14 3% 1%N2S4 6 6 1% 1%N3S4 3 3 1 7 1% 1%N4S4 5 2 7 1% 1%N5S4 1 1 0% 0%N6S4 0 0% 0%N7S4 1 1 0% 0%N0S5 8 8 1% 1%N1S5 2 1 3 1% 0%N2S5 5 5 1% 0%N3S5 2 2 0% 0%N4S5 4 1 5 1% 0%N5S5 2 2 0% 0%N6S5 1 1 0% 0%N7S5 1 1 0% 0%N0S6 0 0% 0%N1S6 1 1 0% 0%N2S6 3 3 1% 0%N3S6 0 0% 0%N4S6 2 2 0% 0%N5S6 0 0% 0%N6S6 1 1 0% 0%N7S6 0 0% 0%N0S7 0 0% 0%N1S7 0 0% 0%N2S7 0 0% 0%N3S7 0 0% 0%N4S7 0 0% 0%N5S7 0 0% 0%N6S7 0 0% 0%N7S7 0 0% 0%SN Total 320 45 64 25 1 1 2 0 3 0 0 0 0 0 0 0 0 0 0 0 0 0 0 0 0 461 100% 100% 100%NS Total 396 63 55 24 1 0 1 1 2 0 0 0 0 0 0 0 0 0 0 0 0 0 0 0 0 543Total 716 108 119 49 2 1 3 1 5 0 0 0 0 0 0 0 0 0 0 0 0 0 0 0 0 1,004Source) Analyzed by the Study Team based on the SC transit database of 1999.
A - 20
Table A.4.10 Number of Vessels Transiting the Canal
O-DVessel Size (up to) (1000 SCNT) Share

1B: Tankers of Crude Oil (Ballast)Total
10 20 30 40 50 60 70 80 90 100 110 120 130 140 150 160 170 180 190 200 210 220 230 240 250 SN NS TotalS0N0 0 0% 0%S0N1 0 0% 0%S0N2 1 1 50% 0%S0N3 0 0% 0%S0N4 0 0% 0%S0N5 0 0% 0%S0N6 0 0% 0%S0N7 0 0% 0%S1N0 0 0% 0%S1N1 0 0% 0%S1N2 0 0% 0%S1N3 0 0% 0%S1N4 0 0% 0%S1N5 0 0% 0%S1N6 0 0% 0%S1N7 0 0% 0%S2N0 0 0% 0%S2N1 0 0% 0%S2N2 0 0% 0%S2N3 0 0% 0%S2N4 0 0% 0%S2N5 0 0% 0%S2N6 0 0% 0%S2N7 0 0% 0%S3N0 0 0% 0%S3N1 0 0% 0%S3N2 0 0% 0%S3N3 0 0% 0%S3N4 0 0% 0%S3N5 0 0% 0%S3N6 0 0% 0%S3N7 0 0% 0%S4N0 0 0% 0%S4N1 0 0% 0%S4N2 0 0% 0%S4N3 0 0% 0%S4N4 0 0% 0%S4N5 0 0% 0%S4N6 0 0% 0%S4N7 0 0% 0%S5N0 0 0% 0%S5N1 0 0% 0%S5N2 0 0% 0%S5N3 1 1 50% 0%S5N4 0 0% 0%S5N5 0 0% 0%S5N6 0 0% 0%S5N7 0 0% 0%S6N0 0 0% 0%S6N1 0 0% 0%S6N2 0 0% 0%S6N3 0 0% 0%S6N4 0 0% 0%S6N5 0 0% 0%S6N6 0 0% 0%S6N7 0 0% 0%S7N0 0 0% 0%S7N1 0 0% 0%S7N2 0 0% 0%S7N3 0 0% 0%S7N4 0 0% 0%S7N5 0 0% 0%S7N6 0 0% 0%S7N7 0 0% 0%N0S0 1 1 0% 0%N1S0 4 1 1 6 3% 3%N2S0 1 1 1 3 1% 1%N3S0 0 0% 0%N4S0 1 1 1 5 4 12 6% 6%N5S0 0 0% 0%N6S0 7 2 9 4% 4%N7S0 0 0% 0%N0S1 0 0% 0%N1S1 0 0% 0%N2S1 0 0% 0%N3S1 0 0% 0%N4S1 0 0% 0%N5S1 0 0% 0%N6S1 0 0% 0%N7S1 0 0% 0%N0S2 1 1 0% 0%N1S2 9 3 1 1 1 1 19 3 1 39 18% 18%N2S2 1 1 0% 0%N3S2 0 0% 0%N4S2 2 6 1 32 4 1 2 48 23% 22%N5S2 0 0% 0%N6S2 4 8 2 9 41 10 5 6 6 1 1 93 44% 43%N7S2 0 0% 0%N0S3 0 0% 0%N1S3 0 0% 0%N2S3 0 0% 0%N3S3 0 0% 0%N4S3 0 0% 0%N5S3 0 0% 0%N6S3 0 0% 0%N7S3 0 0% 0%N0S4 0 0% 0%N1S4 0 0% 0%N2S4 0 0% 0%N3S4 0 0% 0%N4S4 0 0% 0%N5S4 0 0% 0%N6S4 0 0% 0%N7S4 0 0% 0%N0S5 0 0% 0%N1S5 0 0% 0%N2S5 0 0% 0%N3S5 0 0% 0%N4S5 0 0% 0%N5S5 0 0% 0%N6S5 0 0% 0%N7S5 0 0% 0%N0S6 0 0% 0%N1S6 0 0% 0%N2S6 0 0% 0%N3S6 0 0% 0%N4S6 0 0% 0%N5S6 0 0% 0%N6S6 0 0% 0%N7S6 0 0% 0%N0S7 0 0% 0%N1S7 0 0% 0%N2S7 0 0% 0%N3S7 0 0% 0%N4S7 0 0% 0%N5S7 0 0% 0%N6S7 0 0% 0%N7S7 0 0% 0%SN Total 0 1 0 1 0 0 0 0 0 0 0 0 0 0 0 0 0 0 0 0 0 0 0 0 0 2 100% 100% 100%NS Total 0 1 0 0 4 0 10 4 0 0 0 8 16 4 13 106 23 8 6 8 1 1 0 0 0 213Total 0 2 0 1 4 0 10 4 0 0 0 8 16 4 13 106 23 8 6 8 1 1 0 0 0 215Source) Analyzed by the Study Team based on the SC transit database of 1999.
A - 21
Table A.4.11 Number of Vessels Transiting the Canal
O-DVessel Size (up to) (1000 SCNT) Share

2B: Tankers of Petro. Prod. (Ballast)Total
10 20 30 40 50 60 70 80 90 100 110 120 130 140 150 160 170 180 190 200 210 220 230 240 250 SN NS TotalS0N0 8 3 11 11% 7%S0N1 2 1 3 3% 2%S0N2 1 1 2 2% 1%S0N3 2 2 2% 1%S0N4 3 3 3% 2%S0N5 0 0% 0%S0N6 1 1 2 2% 1%S0N7 0 0% 0%S1N0 1 1 2 2% 1%S1N1 2 2 2% 1%S1N2 0 0% 0%S1N3 0 0% 0%S1N4 0 0% 0%S1N5 0 0% 0%S1N6 0 0% 0%S1N7 0 0% 0%S2N0 1 1 1 1 4 4% 3%S2N1 2 1 3 3% 2%S2N2 1 1 1% 1%S2N3 1 1 1% 1%S2N4 1 1 1% 1%S2N5 0 0% 0%S2N6 0 0% 0%S2N7 0 0% 0%S3N0 3 1 4 4% 3%S3N1 1 1 1 1 4 4% 3%S3N2 5 6 1 12 13% 8%S3N3 1 1 2 2% 1%S3N4 1 2 3 3% 2%S3N5 0 0% 0%S3N6 2 2 2% 1%S3N7 3 3 3% 2%S4N0 1 3 1 2 1 8 8% 5%S4N1 5 2 7 7% 5%S4N2 1 1 1 3 3% 2%S4N3 1 1 1% 1%S4N4 2 1 1 1 5 5% 3%S4N5 0 0% 0%S4N6 1 1 1% 1%S4N7 1 1 1% 1%S5N0 0 0% 0%S5N1 2 2 2% 1%S5N2 1 1 1% 1%S5N3 0 0% 0%S5N4 0 0% 0%S5N5 0 0% 0%S5N6 0 0% 0%S5N7 0 0% 0%S6N0 0 0% 0%S6N1 0 0% 0%S6N2 0 0% 0%S6N3 0 0% 0%S6N4 0 0% 0%S6N5 0 0% 0%S6N6 0 0% 0%S6N7 0 0% 0%S7N0 0 0% 0%S7N1 0 0% 0%S7N2 0 0% 0%S7N3 0 0% 0%S7N4 0 0% 0%S7N5 0 0% 0%S7N6 0 0% 0%S7N7 0 0% 0%N0S0 1 5 1 1 1 9 15% 6%N1S0 2 2 4 7% 3%N2S0 1 1 2 3% 1%N3S0 2 1 3 5% 2%N4S0 1 1 2 3% 1%N5S0 0 0% 0%N6S0 1 1 2 3% 1%N7S0 0 0% 0%N0S1 0 0% 0%N1S1 0 0% 0%N2S1 0 0% 0%N3S1 0 0% 0%N4S1 0 0% 0%N5S1 0 0% 0%N6S1 0 0% 0%N7S1 0 0% 0%N0S2 1 2 1 4 7% 3%N1S2 4 1 1 6 10% 4%N2S2 1 1 2 3% 1%N3S2 1 1 2% 1%N4S2 1 1 1 3 5% 2%N5S2 0 0% 0%N6S2 1 1 1 1 4 7% 3%N7S2 0 0% 0%N0S3 1 1 2% 1%N1S3 4 1 2 2 1 10 17% 6%N2S3 1 1 2% 1%N3S3 0 0% 0%N4S3 1 1 2% 1%N5S3 0 0% 0%N6S3 0 0% 0%N7S3 0 0% 0%N0S4 0 0% 0%N1S4 1 1 2 3% 1%N2S4 1 1 2% 1%N3S4 0 0% 0%N4S4 0 0% 0%N5S4 0 0% 0%N6S4 0 0% 0%N7S4 0 0% 0%N0S5 0 0% 0%N1S5 0 0% 0%N2S5 0 0% 0%N3S5 0 0% 0%N4S5 1 1 2% 1%N5S5 0 0% 0%N6S5 0 0% 0%N7S5 0 0% 0%N0S6 0 0% 0%N1S6 0 0% 0%N2S6 0 0% 0%N3S6 0 0% 0%N4S6 0 0% 0%N5S6 0 0% 0%N6S6 0 0% 0%N7S6 0 0% 0%N0S7 0 0% 0%N1S7 0 0% 0%N2S7 0 0% 0%N3S7 0 0% 0%N4S7 0 0% 0%N5S7 0 0% 0%N6S7 0 0% 0%N7S7 0 0% 0%SN Total 38 31 7 6 5 6 1 1 0 1 0 0 0 0 0 0 0 0 0 0 0 0 0 0 0 96 100% 100% 100%NS Total 10 13 7 5 8 6 4 0 1 1 0 0 0 0 0 2 2 0 0 0 0 0 0 0 0 59Total 48 44 14 11 13 12 5 1 1 2 0 0 0 0 0 2 2 0 0 0 0 0 0 0 0 155Source) Analyzed by the Study Team based on the SC transit database of 1999.
A - 22
Table A.4.12 Number of Vessels Transiting the Canal
O-DVessel Size (up to) (1000 SCNT) Share

3B: Chemical Carriers (Ballast)Total
10 20 30 40 50 60 70 80 90 100 110 120 130 140 150 160 170 180 190 200 210 220 230 240 250 SN NS TotalS0N0 2 2 3% 3%S0N1 2 2 3% 3%S0N2 1 2 3 4% 4%S0N3 0 0% 0%S0N4 1 1 1% 1%S0N5 0 0% 0%S0N6 0 0% 0%S0N7 0 0% 0%S1N0 0 0% 0%S1N1 0 0% 0%S1N2 0 0% 0%S1N3 0 0% 0%S1N4 0 0% 0%S1N5 0 0% 0%S1N6 0 0% 0%S1N7 0 0% 0%S2N0 0 0% 0%S2N1 0 0% 0%S2N2 1 1 1% 1%S2N3 0 0% 0%S2N4 1 1 2 3% 3%S2N5 0 0% 0%S2N6 0 0% 0%S2N7 0 0% 0%S3N0 1 2 3 4% 4%S3N1 2 1 3 4% 4%S3N2 16 31 47 68% 64%S3N3 0 0% 0%S3N4 0 0% 0%S3N5 0 0% 0%S3N6 0 0% 0%S3N7 2 2 3% 3%S4N0 0 0% 0%S4N1 0 0% 0%S4N2 1 1 1% 1%S4N3 0 0% 0%S4N4 1 1 1% 1%S4N5 0 0% 0%S4N6 0 0% 0%S4N7 1 1 1% 1%S5N0 0 0% 0%S5N1 0 0% 0%S5N2 0 0% 0%S5N3 0 0% 0%S5N4 0 0% 0%S5N5 0 0% 0%S5N6 0 0% 0%S5N7 0 0% 0%S6N0 0 0% 0%S6N1 0 0% 0%S6N2 0 0% 0%S6N3 0 0% 0%S6N4 0 0% 0%S6N5 0 0% 0%S6N6 0 0% 0%S6N7 0 0% 0%S7N0 0 0% 0%S7N1 0 0% 0%S7N2 0 0% 0%S7N3 0 0% 0%S7N4 0 0% 0%S7N5 0 0% 0%S7N6 0 0% 0%S7N7 0 0% 0%N0S0 1 1 2 50% 3%N1S0 1 1 25% 1%N2S0 0 0% 0%N3S0 0 0% 0%N4S0 0 0% 0%N5S0 0 0% 0%N6S0 0 0% 0%N7S0 0 0% 0%N0S1 0 0% 0%N1S1 0 0% 0%N2S1 0 0% 0%N3S1 0 0% 0%N4S1 0 0% 0%N5S1 0 0% 0%N6S1 0 0% 0%N7S1 0 0% 0%N0S2 0 0% 0%N1S2 0 0% 0%N2S2 0 0% 0%N3S2 0 0% 0%N4S2 0 0% 0%N5S2 0 0% 0%N6S2 1 1 25% 1%N7S2 0 0% 0%N0S3 0 0% 0%N1S3 0 0% 0%N2S3 0 0% 0%N3S3 0 0% 0%N4S3 0 0% 0%N5S3 0 0% 0%N6S3 0 0% 0%N7S3 0 0% 0%N0S4 0 0% 0%N1S4 0 0% 0%N2S4 0 0% 0%N3S4 0 0% 0%N4S4 0 0% 0%N5S4 0 0% 0%N6S4 0 0% 0%N7S4 0 0% 0%N0S5 0 0% 0%N1S5 0 0% 0%N2S5 0 0% 0%N3S5 0 0% 0%N4S5 0 0% 0%N5S5 0 0% 0%N6S5 0 0% 0%N7S5 0 0% 0%N0S6 0 0% 0%N1S6 0 0% 0%N2S6 0 0% 0%N3S6 0 0% 0%N4S6 0 0% 0%N5S6 0 0% 0%N6S6 0 0% 0%N7S6 0 0% 0%N0S7 0 0% 0%N1S7 0 0% 0%N2S7 0 0% 0%N3S7 0 0% 0%N4S7 0 0% 0%N5S7 0 0% 0%N6S7 0 0% 0%N7S7 0 0% 0%SN Total 26 43 0 0 0 0 0 0 0 0 0 0 0 0 0 0 0 0 0 0 0 0 0 0 0 69 100% 100% 100%NS Total 1 1 0 0 0 1 0 0 0 0 0 0 0 0 0 1 0 0 0 0 0 0 0 0 0 4Total 27 44 0 0 0 1 0 0 0 0 0 0 0 0 0 1 0 0 0 0 0 0 0 0 0 73Source) Analyzed by the Study Team based on the SC transit database of 1999.
A - 23
Table A.4.13 Number of Vessels Transiting the Canal
O-DVessel Size (up to) (1000 SCNT) Share

4B: LNG Carriers (Ballast)Total
10 20 30 40 50 60 70 80 90 100 110 120 130 140 150 160 170 180 190 200 210 220 230 240 250 SN NS TotalS0N0 0 0% 0%S0N1 0 0% 0%S0N2 0 0% 0%S0N3 0 0% 0%S0N4 0 0% 0%S0N5 0 0% 0%S0N6 0 0% 0%S0N7 0 0% 0%S1N0 0 0% 0%S1N1 0 0% 0%S1N2 0 0% 0%S1N3 0 0% 0%S1N4 0 0% 0%S1N5 0 0% 0%S1N6 0 0% 0%S1N7 0 0% 0%S2N0 0 0% 0%S2N1 0 0% 0%S2N2 1 1 33% 3%S2N3 0 0% 0%S2N4 0 0% 0%S2N5 0 0% 0%S2N6 0 0% 0%S2N7 0 0% 0%S3N0 0 0% 0%S3N1 0 0% 0%S3N2 0 0% 0%S3N3 0 0% 0%S3N4 0 0% 0%S3N5 0 0% 0%S3N6 0 0% 0%S3N7 0 0% 0%S4N0 0 0% 0%S4N1 0 0% 0%S4N2 0 0% 0%S4N3 0 0% 0%S4N4 2 2 67% 6%S4N5 0 0% 0%S4N6 0 0% 0%S4N7 0 0% 0%S5N0 0 0% 0%S5N1 0 0% 0%S5N2 0 0% 0%S5N3 0 0% 0%S5N4 0 0% 0%S5N5 0 0% 0%S5N6 0 0% 0%S5N7 0 0% 0%S6N0 0 0% 0%S6N1 0 0% 0%S6N2 0 0% 0%S6N3 0 0% 0%S6N4 0 0% 0%S6N5 0 0% 0%S6N6 0 0% 0%S6N7 0 0% 0%S7N0 0 0% 0%S7N1 0 0% 0%S7N2 0 0% 0%S7N3 0 0% 0%S7N4 0 0% 0%S7N5 0 0% 0%S7N6 0 0% 0%S7N7 0 0% 0%N0S0 0 0% 0%N1S0 0 0% 0%N2S0 0 0% 0%N3S0 0 0% 0%N4S0 0 0% 0%N5S0 0 0% 0%N6S0 0 0% 0%N7S0 0 0% 0%N0S1 0 0% 0%N1S1 0 0% 0%N2S1 0 0% 0%N3S1 0 0% 0%N4S1 0 0% 0%N5S1 0 0% 0%N6S1 0 0% 0%N7S1 0 0% 0%N0S2 0 0% 0%N1S2 5 1 6 19% 18%N2S2 5 6 8 1 1 21 68% 62%N3S2 0 0% 0%N4S2 0 0% 0%N5S2 0 0% 0%N6S2 1 2 3 10% 9%N7S2 0 0% 0%N0S3 0 0% 0%N1S3 0 0% 0%N2S3 0 0% 0%N3S3 0 0% 0%N4S3 0 0% 0%N5S3 0 0% 0%N6S3 0 0% 0%N7S3 0 0% 0%N0S4 0 0% 0%N1S4 0 0% 0%N2S4 0 0% 0%N3S4 0 0% 0%N4S4 0 0% 0%N5S4 0 0% 0%N6S4 0 0% 0%N7S4 0 0% 0%N0S5 0 0% 0%N1S5 0 0% 0%N2S5 0 0% 0%N3S5 0 0% 0%N4S5 0 0% 0%N5S5 0 0% 0%N6S5 0 0% 0%N7S5 0 0% 0%N0S6 0 0% 0%N1S6 0 0% 0%N2S6 1 1 3% 3%N3S6 0 0% 0%N4S6 0 0% 0%N5S6 0 0% 0%N6S6 0 0% 0%N7S6 0 0% 0%N0S7 0 0% 0%N1S7 0 0% 0%N2S7 0 0% 0%N3S7 0 0% 0%N4S7 0 0% 0%N5S7 0 0% 0%N6S7 0 0% 0%N7S7 0 0% 0%SN Total 2 0 1 0 0 0 0 0 0 0 0 0 0 0 0 0 0 0 0 0 0 0 0 0 0 3 100% 100% 100%NS Total 0 0 0 0 10 0 6 9 1 3 2 0 0 0 0 0 0 0 0 0 0 0 0 0 0 31Total 2 0 1 0 10 0 6 9 1 3 2 0 0 0 0 0 0 0 0 0 0 0 0 0 0 34Source) Analyzed by the Study Team based on the SC transit database of 1999.
A - 24
Table A.4.14 Number of Vessels Transiting the Canal
O-DVessel Size (up to) (1000 SCNT) Share

5B: LPG Carriers (Ballast)Total
10 20 30 40 50 60 70 80 90 100 110 120 130 140 150 160 170 180 190 200 210 220 230 240 250 SN NS TotalS0N0 1 1 2 2% 1%S0N1 2 1 3 3% 2%S0N2 2 2 1 5 5% 4%S0N3 5 2 7 7% 5%S0N4 1 2 1 4 4% 3%S0N5 0 0% 0%S0N6 0 0% 0%S0N7 0 0% 0%S1N0 0 0% 0%S1N1 1 1 1% 1%S1N2 0 0% 0%S1N3 1 1 2 2% 1%S1N4 0 0% 0%S1N5 0 0% 0%S1N6 0 0% 0%S1N7 0 0% 0%S2N0 1 1 1% 1%S2N1 0 0% 0%S2N2 1 1 1% 1%S2N3 2 1 3 3% 2%S2N4 1 1 1% 1%S2N5 0 0% 0%S2N6 0 0% 0%S2N7 0 0% 0%S3N0 1 1 1% 1%S3N1 6 6 6% 4%S3N2 2 2 4 4% 3%S3N3 1 1 2 2% 1%S3N4 5 2 7 7% 5%S3N5 0 0% 0%S3N6 0 0% 0%S3N7 0 0% 0%S4N0 1 1 1 3 3% 2%S4N1 4 3 7 7% 5%S4N2 10 6 1 2 19 19% 14%S4N3 1 1 1% 1%S4N4 4 1 2 7 7% 5%S4N5 0 0% 0%S4N6 1 1 1% 1%S4N7 0 0% 0%S5N0 1 1 1% 1%S5N1 1 1 1% 1%S5N2 1 1 3 5 5% 4%S5N3 1 1 1% 1%S5N4 1 2 3 3% 2%S5N5 0 0% 0%S5N6 0 0% 0%S5N7 0 0% 0%S6N0 0 0% 0%S6N1 1 1 1% 1%S6N2 1 1 1% 1%S6N3 0 0% 0%S6N4 0 0% 0%S6N5 0 0% 0%S6N6 0 0% 0%S6N7 0 0% 0%S7N0 0 0% 0%S7N1 0 0% 0%S7N2 0 0% 0%S7N3 0 0% 0%S7N4 0 0% 0%S7N5 0 0% 0%S7N6 0 0% 0%S7N7 0 0% 0%N0S0 2 2 4 8 23% 6%N1S0 1 2 3 9% 2%N2S0 1 1 3% 1%N3S0 0 0% 0%N4S0 1 1 3% 1%N5S0 0 0% 0%N6S0 0 0% 0%N7S0 0 0% 0%N0S1 0 0% 0%N1S1 0 0% 0%N2S1 0 0% 0%N3S1 0 0% 0%N4S1 0 0% 0%N5S1 0 0% 0%N6S1 0 0% 0%N7S1 0 0% 0%N0S2 1 9 4 14 40% 10%N1S2 2 1 3 9% 2%N2S2 0 0% 0%N3S2 0 0% 0%N4S2 1 1 3% 1%N5S2 0 0% 0%N6S2 1 1 2 6% 1%N7S2 0 0% 0%N0S3 0 0% 0%N1S3 0 0% 0%N2S3 0 0% 0%N3S3 0 0% 0%N4S3 0 0% 0%N5S3 0 0% 0%N6S3 0 0% 0%N7S3 0 0% 0%N0S4 1 1 3% 1%N1S4 1 1 3% 1%N2S4 0 0% 0%N3S4 0 0% 0%N4S4 0 0% 0%N5S4 0 0% 0%N6S4 0 0% 0%N7S4 0 0% 0%N0S5 0 0% 0%N1S5 0 0% 0%N2S5 0 0% 0%N3S5 0 0% 0%N4S5 0 0% 0%N5S5 0 0% 0%N6S5 0 0% 0%N7S5 0 0% 0%N0S6 0 0% 0%N1S6 0 0% 0%N2S6 0 0% 0%N3S6 0 0% 0%N4S6 0 0% 0%N5S6 0 0% 0%N6S6 0 0% 0%N7S6 0 0% 0%N0S7 0 0% 0%N1S7 0 0% 0%N2S7 0 0% 0%N3S7 0 0% 0%N4S7 0 0% 0%N5S7 0 0% 0%N6S7 0 0% 0%N7S7 0 0% 0%SN Total 36 38 9 11 7 0 0 0 0 0 0 0 0 0 0 0 0 0 0 0 0 0 0 0 0 101 100% 100% 100%NS Total 8 3 0 12 11 0 0 0 0 1 0 0 0 0 0 0 0 0 0 0 0 0 0 0 0 35Total 44 41 9 23 18 0 0 0 0 1 0 0 0 0 0 0 0 0 0 0 0 0 0 0 0 136Source) Analyzed by the Study Team based on the SC transit database of 1999.
A - 25
Table A.4.15 Number of Vessels Transiting the Canal
O-DVessel Size (up to) (1000 SCNT) Share
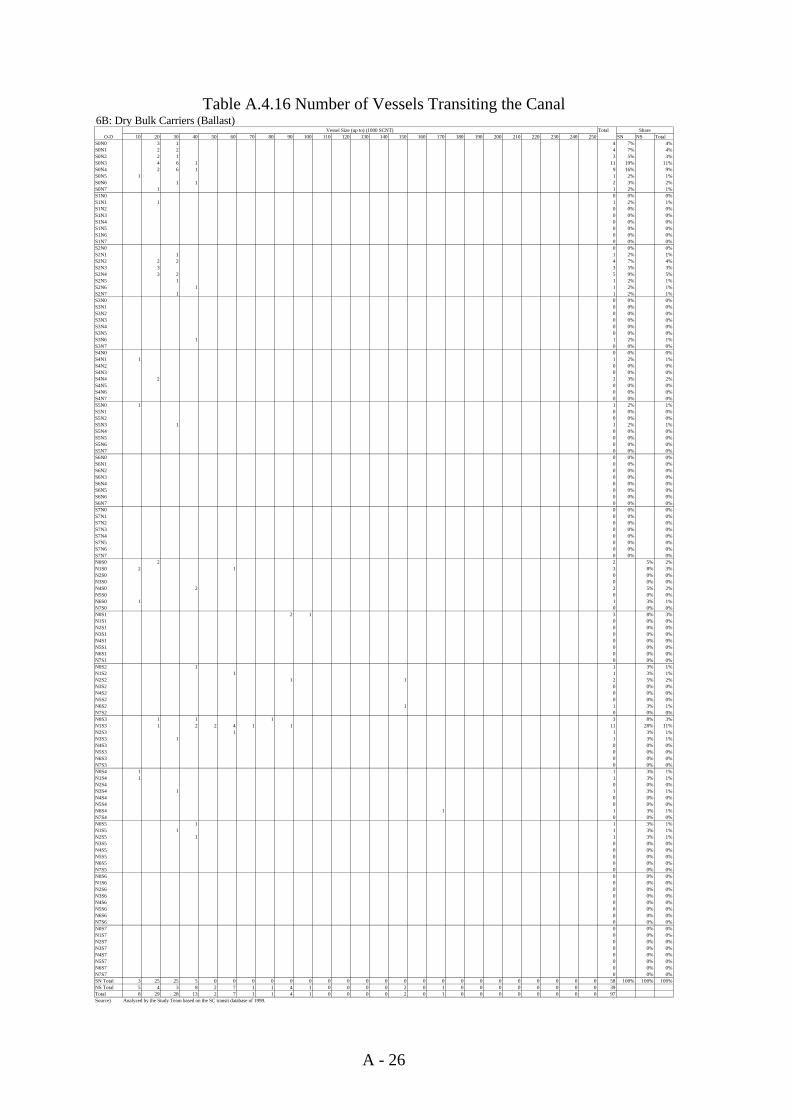
6B: Dry Bulk Carriers (Ballast)Total
10 20 30 40 50 60 70 80 90 100 110 120 130 140 150 160 170 180 190 200 210 220 230 240 250 SN NS TotalS0N0 3 1 4 7% 4%S0N1 2 2 4 7% 4%S0N2 2 1 3 5% 3%S0N3 4 6 1 11 19% 11%S0N4 2 6 1 9 16% 9%S0N5 1 1 2% 1%S0N6 1 1 2 3% 2%S0N7 1 1 2% 1%S1N0 0 0% 0%S1N1 1 1 2% 1%S1N2 0 0% 0%S1N3 0 0% 0%S1N4 0 0% 0%S1N5 0 0% 0%S1N6 0 0% 0%S1N7 0 0% 0%S2N0 0 0% 0%S2N1 1 1 2% 1%S2N2 2 2 4 7% 4%S2N3 3 3 5% 3%S2N4 3 2 5 9% 5%S2N5 1 1 2% 1%S2N6 1 1 2% 1%S2N7 1 1 2% 1%S3N0 0 0% 0%S3N1 0 0% 0%S3N2 0 0% 0%S3N3 0 0% 0%S3N4 0 0% 0%S3N5 0 0% 0%S3N6 1 1 2% 1%S3N7 0 0% 0%S4N0 0 0% 0%S4N1 1 1 2% 1%S4N2 0 0% 0%S4N3 0 0% 0%S4N4 2 2 3% 2%S4N5 0 0% 0%S4N6 0 0% 0%S4N7 0 0% 0%S5N0 1 1 2% 1%S5N1 0 0% 0%S5N2 0 0% 0%S5N3 1 1 2% 1%S5N4 0 0% 0%S5N5 0 0% 0%S5N6 0 0% 0%S5N7 0 0% 0%S6N0 0 0% 0%S6N1 0 0% 0%S6N2 0 0% 0%S6N3 0 0% 0%S6N4 0 0% 0%S6N5 0 0% 0%S6N6 0 0% 0%S6N7 0 0% 0%S7N0 0 0% 0%S7N1 0 0% 0%S7N2 0 0% 0%S7N3 0 0% 0%S7N4 0 0% 0%S7N5 0 0% 0%S7N6 0 0% 0%S7N7 0 0% 0%N0S0 2 2 5% 2%N1S0 2 1 3 8% 3%N2S0 0 0% 0%N3S0 0 0% 0%N4S0 2 2 5% 2%N5S0 0 0% 0%N6S0 1 1 3% 1%N7S0 0 0% 0%N0S1 2 1 3 8% 3%N1S1 0 0% 0%N2S1 0 0% 0%N3S1 0 0% 0%N4S1 0 0% 0%N5S1 0 0% 0%N6S1 0 0% 0%N7S1 0 0% 0%N0S2 1 1 3% 1%N1S2 1 1 3% 1%N2S2 1 1 2 5% 2%N3S2 0 0% 0%N4S2 0 0% 0%N5S2 0 0% 0%N6S2 1 1 3% 1%N7S2 0 0% 0%N0S3 1 1 1 3 8% 3%N1S3 1 2 2 4 1 1 11 28% 11%N2S3 1 1 3% 1%N3S3 1 1 3% 1%N4S3 0 0% 0%N5S3 0 0% 0%N6S3 0 0% 0%N7S3 0 0% 0%N0S4 1 1 3% 1%N1S4 1 1 3% 1%N2S4 0 0% 0%N3S4 1 1 3% 1%N4S4 0 0% 0%N5S4 0 0% 0%N6S4 1 1 3% 1%N7S4 0 0% 0%N0S5 1 1 3% 1%N1S5 1 1 3% 1%N2S5 1 1 3% 1%N3S5 0 0% 0%N4S5 0 0% 0%N5S5 0 0% 0%N6S5 0 0% 0%N7S5 0 0% 0%N0S6 0 0% 0%N1S6 0 0% 0%N2S6 0 0% 0%N3S6 0 0% 0%N4S6 0 0% 0%N5S6 0 0% 0%N6S6 0 0% 0%N7S6 0 0% 0%N0S7 0 0% 0%N1S7 0 0% 0%N2S7 0 0% 0%N3S7 0 0% 0%N4S7 0 0% 0%N5S7 0 0% 0%N6S7 0 0% 0%N7S7 0 0% 0%SN Total 3 25 25 5 0 0 0 0 0 0 0 0 0 0 0 0 0 0 0 0 0 0 0 0 0 58 100% 100% 100%NS Total 5 4 3 8 2 7 1 1 4 1 0 0 0 0 2 0 1 0 0 0 0 0 0 0 0 39Total 8 29 28 13 2 7 1 1 4 1 0 0 0 0 2 0 1 0 0 0 0 0 0 0 0 97Source) Analyzed by the Study Team based on the SC transit database of 1999.
A - 26
Table A.4.16 Number of Vessels Transiting the Canal
O-DVessel Size (up to) (1000 SCNT) Share

7B: Container Ships (Ballast)Total
10 20 30 40 50 60 70 80 90 100 110 120 130 140 150 160 170 180 190 200 210 220 230 240 250 SN NS TotalS0N0 0 0% 0%S0N1 1 1 11% 3%S0N2 0 0% 0%S0N3 0 0% 0%S0N4 0 0% 0%S0N5 0 0% 0%S0N6 0 0% 0%S0N7 0 0% 0%S1N0 0 0% 0%S1N1 0 0% 0%S1N2 0 0% 0%S1N3 0 0% 0%S1N4 0 0% 0%S1N5 0 0% 0%S1N6 0 0% 0%S1N7 0 0% 0%S2N0 0 0% 0%S2N1 0 0% 0%S2N2 1 1 11% 3%S2N3 0 0% 0%S2N4 1 1 2 22% 5%S2N5 0 0% 0%S2N6 0 0% 0%S2N7 0 0% 0%S3N0 1 1 11% 3%S3N1 1 1 11% 3%S3N2 0 0% 0%S3N3 0 0% 0%S3N4 0 0% 0%S3N5 0 0% 0%S3N6 0 0% 0%S3N7 0 0% 0%S4N0 1 1 11% 3%S4N1 2 2 22% 5%S4N2 0 0% 0%S4N3 0 0% 0%S4N4 0 0% 0%S4N5 0 0% 0%S4N6 0 0% 0%S4N7 0 0% 0%S5N0 0 0% 0%S5N1 0 0% 0%S5N2 0 0% 0%S5N3 0 0% 0%S5N4 0 0% 0%S5N5 0 0% 0%S5N6 0 0% 0%S5N7 0 0% 0%S6N0 0 0% 0%S6N1 0 0% 0%S6N2 0 0% 0%S6N3 0 0% 0%S6N4 0 0% 0%S6N5 0 0% 0%S6N6 0 0% 0%S6N7 0 0% 0%S7N0 0 0% 0%S7N1 0 0% 0%S7N2 0 0% 0%S7N3 0 0% 0%S7N4 0 0% 0%S7N5 0 0% 0%S7N6 0 0% 0%S7N7 0 0% 0%N0S0 1 1 2 7% 5%N1S0 1 1 4% 3%N2S0 0 0% 0%N3S0 0 0% 0%N4S0 0 0% 0%N5S0 0 0% 0%N6S0 0 0% 0%N7S0 0 0% 0%N0S1 0 0% 0%N1S1 0 0% 0%N2S1 0 0% 0%N3S1 0 0% 0%N4S1 0 0% 0%N5S1 0 0% 0%N6S1 0 0% 0%N7S1 0 0% 0%N0S2 1 1 4% 3%N1S2 1 1 4% 3%N2S2 0 0% 0%N3S2 1 1 4% 3%N4S2 2 2 7% 5%N5S2 0 0% 0%N6S2 0 0% 0%N7S2 0 0% 0%N0S3 1 1 4% 3%N1S3 1 1 2 7% 5%N2S3 1 1 4% 3%N3S3 0 0% 0%N4S3 0 0% 0%N5S3 0 0% 0%N6S3 0 0% 0%N7S3 0 0% 0%N0S4 1 1 4% 3%N1S4 1 1 2 7% 5%N2S4 1 1 4% 3%N3S4 1 1 4% 3%N4S4 1 1 2 7% 5%N5S4 0 0% 0%N6S4 0 0% 0%N7S4 0 0% 0%N0S5 0 0% 0%N1S5 3 3 11% 8%N2S5 1 1 4% 3%N3S5 0 0% 0%N4S5 3 1 1 5 18% 14%N5S5 0 0% 0%N6S5 0 0% 0%N7S5 0 0% 0%N0S6 0 0% 0%N1S6 0 0% 0%N2S6 0 0% 0%N3S6 0 0% 0%N4S6 0 0% 0%N5S6 0 0% 0%N6S6 0 0% 0%N7S6 0 0% 0%N0S7 0 0% 0%N1S7 0 0% 0%N2S7 0 0% 0%N3S7 0 0% 0%N4S7 0 0% 0%N5S7 0 0% 0%N6S7 0 0% 0%N7S7 0 0% 0%SN Total 3 5 0 1 0 0 0 0 0 0 0 0 0 0 0 0 0 0 0 0 0 0 0 0 0 9 100% 100% 100%NS Total 9 8 7 2 2 0 0 0 0 0 0 0 0 0 0 0 0 0 0 0 0 0 0 0 0 28Total 12 13 7 3 2 0 0 0 0 0 0 0 0 0 0 0 0 0 0 0 0 0 0 0 0 37Source) Analyzed by the Study Team based on the SC transit database of 1999.
A - 27
Table A.4.17 Number of Vessels Transiting the Canal
O-DVessel Size (up to) (1000 SCNT) Share

8B: Vehicle Carriers (Ballast)Total
10 20 30 40 50 60 70 80 90 100 110 120 130 140 150 160 170 180 190 200 210 220 230 240 250 SN NS TotalS0N0 0 0% 0%S0N1 0 0% 0%S0N2 1 1 25% 1%S0N3 0 0% 0%S0N4 0 0% 0%S0N5 0 0% 0%S0N6 0 0% 0%S0N7 0 0% 0%S1N0 0 0% 0%S1N1 1 1 25% 1%S1N2 0 0% 0%S1N3 0 0% 0%S1N4 0 0% 0%S1N5 0 0% 0%S1N6 0 0% 0%S1N7 0 0% 0%S2N0 0 0% 0%S2N1 0 0% 0%S2N2 0 0% 0%S2N3 0 0% 0%S2N4 0 0% 0%S2N5 0 0% 0%S2N6 0 0% 0%S2N7 0 0% 0%S3N0 0 0% 0%S3N1 0 0% 0%S3N2 0 0% 0%S3N3 0 0% 0%S3N4 0 0% 0%S3N5 0 0% 0%S3N6 0 0% 0%S3N7 0 0% 0%S4N0 0 0% 0%S4N1 1 1 25% 1%S4N2 0 0% 0%S4N3 0 0% 0%S4N4 0 0% 0%S4N5 0 0% 0%S4N6 0 0% 0%S4N7 0 0% 0%S5N0 0 0% 0%S5N1 1 1 25% 1%S5N2 0 0% 0%S5N3 0 0% 0%S5N4 0 0% 0%S5N5 0 0% 0%S5N6 0 0% 0%S5N7 0 0% 0%S6N0 0 0% 0%S6N1 0 0% 0%S6N2 0 0% 0%S6N3 0 0% 0%S6N4 0 0% 0%S6N5 0 0% 0%S6N6 0 0% 0%S6N7 0 0% 0%S7N0 0 0% 0%S7N1 0 0% 0%S7N2 0 0% 0%S7N3 0 0% 0%S7N4 0 0% 0%S7N5 0 0% 0%S7N6 0 0% 0%S7N7 0 0% 0%N0S0 0 0% 0%N1S0 1 1 1% 1%N2S0 1 1 1% 1%N3S0 0 0% 0%N4S0 1 1 1% 1%N5S0 0 0% 0%N6S0 0 0% 0%N7S0 0 0% 0%N0S1 0 0% 0%N1S1 0 0% 0%N2S1 0 0% 0%N3S1 0 0% 0%N4S1 0 0% 0%N5S1 0 0% 0%N6S1 0 0% 0%N7S1 0 0% 0%N0S2 0 0% 0%N1S2 0 0% 0%N2S2 0 0% 0%N3S2 0 0% 0%N4S2 0 0% 0%N5S2 0 0% 0%N6S2 0 0% 0%N7S2 0 0% 0%N0S3 0 0% 0%N1S3 0 0% 0%N2S3 0 0% 0%N3S3 0 0% 0%N4S3 0 0% 0%N5S3 0 0% 0%N6S3 0 0% 0%N7S3 0 0% 0%N0S4 1 2 3 2% 2%N1S4 4 2 1 7 5% 4%N2S4 1 1 1% 1%N3S4 0 0% 0%N4S4 3 2 5 3% 3%N5S4 0 0% 0%N6S4 0 0% 0%N7S4 0 0% 0%N0S5 2 3 2 7 5% 4%N1S5 4 3 22 9 38 25% 24%N2S5 2 6 9 7 24 15% 15%N3S5 0 0% 0%N4S5 2 11 44 4 2 63 41% 40%N5S5 1 1 1% 1%N6S5 1 2 3 2% 2%N7S5 0 0% 0%N0S6 0 0% 0%N1S6 0 0% 0%N2S6 0 0% 0%N3S6 0 0% 0%N4S6 0 0% 0%N5S6 0 0% 0%N6S6 0 0% 0%N7S6 0 0% 0%N0S7 0 0% 0%N1S7 0 0% 0%N2S7 0 0% 0%N3S7 0 0% 0%N4S7 0 0% 0%N5S7 0 0% 0%N6S7 0 0% 0%N7S7 0 0% 0%SN Total 3 1 0 0 0 0 0 0 0 0 0 0 0 0 0 0 0 0 0 0 0 0 0 0 0 4 100% 100% 100%NS Total 1 0 14 29 85 24 2 0 0 0 0 0 0 0 0 0 0 0 0 0 0 0 0 0 0 155Total 4 1 14 29 85 24 2 0 0 0 0 0 0 0 0 0 0 0 0 0 0 0 0 0 0 159Source) Analyzed by the Study Team based on the SC transit database of 1999.
A - 28
Table A.4.18 Number of Vessels Transiting the Canal
O-DVessel Size (up to) (1000 SCNT) Share

9B: General Cargo Ships (Ballast)Total
10 20 30 40 50 60 70 80 90 100 110 120 130 140 150 160 170 180 190 200 210 220 230 240 250 SN NS TotalS0N0 18 18 18% 12%S0N1 16 3 19 19% 13%S0N2 10 1 11 11% 7%S0N3 8 1 9 9% 6%S0N4 16 16 16% 11%S0N5 1 1 1% 1%S0N6 2 2 2% 1%S0N7 0 0% 0%S1N0 0 0% 0%S1N1 1 1 1% 1%S1N2 0 0% 0%S1N3 0 0% 0%S1N4 0 0% 0%S1N5 0 0% 0%S1N6 0 0% 0%S1N7 0 0% 0%S2N0 1 1 1% 1%S2N1 4 4 4% 3%S2N2 1 1 1% 1%S2N3 2 2 4 4% 3%S2N4 2 1 3 3% 2%S2N5 0 0% 0%S2N6 0 0% 0%S2N7 0 0% 0%S3N0 1 1 1% 1%S3N1 1 1 1% 1%S3N2 0 0% 0%S3N3 0 0% 0%S3N4 3 1 4 4% 3%S3N5 0 0% 0%S3N6 0 0% 0%S3N7 0 0% 0%S4N0 0 0% 0%S4N1 2 2 2% 1%S4N2 0 0% 0%S4N3 0 0% 0%S4N4 1 1 1% 1%S4N5 0 0% 0%S4N6 0 0% 0%S4N7 0 0% 0%S5N0 0 0% 0%S5N1 0 0% 0%S5N2 0 0% 0%S5N3 0 0% 0%S5N4 1 1 1% 1%S5N5 0 0% 0%S5N6 0 0% 0%S5N7 0 0% 0%S6N0 0 0% 0%S6N1 0 0% 0%S6N2 0 0% 0%S6N3 0 0% 0%S6N4 0 0% 0%S6N5 0 0% 0%S6N6 0 0% 0%S6N7 0 0% 0%S7N0 0 0% 0%S7N1 0 0% 0%S7N2 0 0% 0%S7N3 0 0% 0%S7N4 0 0% 0%S7N5 0 0% 0%S7N6 0 0% 0%S7N7 0 0% 0%N0S0 12 1 13 28% 9%N1S0 4 4 9% 3%N2S0 3 3 6% 2%N3S0 0 0% 0%N4S0 2 2 4% 1%N5S0 0 0% 0%N6S0 0 0% 0%N7S0 0 0% 0%N0S1 7 7 15% 5%N1S1 0 0% 0%N2S1 0 0% 0%N3S1 0 0% 0%N4S1 0 0% 0%N5S1 0 0% 0%N6S1 0 0% 0%N7S1 0 0% 0%N0S2 1 1 2% 1%N1S2 0 0% 0%N2S2 0 0% 0%N3S2 0 0% 0%N4S2 0 0% 0%N5S2 0 0% 0%N6S2 0 0% 0%N7S2 0 0% 0%N0S3 0 0% 0%N1S3 3 3 6% 2%N2S3 0 0% 0%N3S3 0 0% 0%N4S3 1 1 2% 1%N5S3 1 1 2% 1%N6S3 0 0% 0%N7S3 0 0% 0%N0S4 0 0% 0%N1S4 1 1 2% 1%N2S4 0 0% 0%N3S4 0 0% 0%N4S4 1 1 2% 1%N5S4 0 0% 0%N6S4 0 0% 0%N7S4 0 0% 0%N0S5 0 0% 0%N1S5 0 0% 0%N2S5 2 2 4% 1%N3S5 0 0% 0%N4S5 0 0% 0%N5S5 0 0% 0%N6S5 0 0% 0%N7S5 0 0% 0%N0S6 2 1 3 6% 2%N1S6 0 0% 0%N2S6 4 1 5 11% 3%N3S6 0 0% 0%N4S6 0 0% 0%N5S6 0 0% 0%N6S6 0 0% 0%N7S6 0 0% 0%N0S7 0 0% 0%N1S7 0 0% 0%N2S7 0 0% 0%N3S7 0 0% 0%N4S7 0 0% 0%N5S7 0 0% 0%N6S7 0 0% 0%N7S7 0 0% 0%SN Total 87 12 1 0 0 0 0 0 0 0 0 0 0 0 0 0 0 0 0 0 0 0 0 0 0 100 100% 100% 100%NS Total 43 2 0 2 0 0 0 0 0 0 0 0 0 0 0 0 0 0 0 0 0 0 0 0 0 47Total 130 14 1 2 0 0 0 0 0 0 0 0 0 0 0 0 0 0 0 0 0 0 0 0 0 147Source) Analyzed by the Study Team based on the SC transit database of 1999.
A - 29
Table A.4.19 Number of Vessels Transiting the Canal
O-DVessel Size (up to) (1000 SCNT) Share

10B: Other Vessels (Ballast)Total
10 20 30 40 50 60 70 80 90 100 110 120 130 140 150 160 170 180 190 200 210 220 230 240 250 SN NS TotalS0N0 22 22 23% 11%S0N1 27 1 28 29% 14%S0N2 4 8 12 13% 6%S0N3 1 1 1% 1%S0N4 5 1 6 6% 3%S0N5 0 0% 0%S0N6 1 1 1% 1%S0N7 0 0% 0%S1N0 0 0% 0%S1N1 0 0% 0%S1N2 0 0% 0%S1N3 0 0% 0%S1N4 0 0% 0%S1N5 0 0% 0%S1N6 0 0% 0%S1N7 0 0% 0%S2N0 0 0% 0%S2N1 3 3 3% 2%S2N2 2 1 3 3% 2%S2N3 0 0% 0%S2N4 1 1 1% 1%S2N5 0 0% 0%S2N6 1 1 1% 1%S2N7 0 0% 0%S3N0 0 0% 0%S3N1 0 0% 0%S3N2 0 0% 0%S3N3 0 0% 0%S3N4 0 0% 0%S3N5 1 1 1% 1%S3N6 0 0% 0%S3N7 0 0% 0%S4N0 0 0% 0%S4N1 6 1 7 7% 4%S4N2 3 3 3% 2%S4N3 0 0% 0%S4N4 1 1 1% 1%S4N5 0 0% 0%S4N6 1 1 1% 1%S4N7 0 0% 0%S5N0 0 0% 0%S5N1 1 1 2 2% 1%S5N2 2 2 2% 1%S5N3 0 0% 0%S5N4 1 1 1% 1%S5N5 0 0% 0%S5N6 0 0% 0%S5N7 0 0% 0%S6N0 0 0% 0%S6N1 0 0% 0%S6N2 0 0% 0%S6N3 0 0% 0%S6N4 0 0% 0%S6N5 0 0% 0%S6N6 0 0% 0%S6N7 0 0% 0%S7N0 0 0% 0%S7N1 0 0% 0%S7N2 0 0% 0%S7N3 0 0% 0%S7N4 0 0% 0%S7N5 0 0% 0%S7N6 0 0% 0%S7N7 0 0% 0%N0S0 13 2 15 15% 8%N1S0 9 6 2 17 17% 9%N2S0 1 7 8 8% 4%N3S0 0 0% 0%N4S0 1 1 1% 1%N5S0 1 1 1% 1%N6S0 0 0% 0%N7S0 0 0% 0%N0S1 2 1 3 3% 2%N1S1 1 1 2 2% 1%N2S1 1 1 1% 1%N3S1 0 0% 0%N4S1 0 0% 0%N5S1 0 0% 0%N6S1 0 0% 0%N7S1 0 0% 0%N0S2 2 2 2% 1%N1S2 5 1 6 6% 3%N2S2 0 0% 0%N3S2 1 1 1% 1%N4S2 1 1 1% 1%N5S2 0 0% 0%N6S2 0 0% 0%N7S2 0 0% 0%N0S3 4 4 4% 2%N1S3 6 1 7 7% 4%N2S3 0 0% 0%N3S3 1 1 1 3 3% 2%N4S3 1 1 2 2% 1%N5S3 4 4 4% 2%N6S3 0 0% 0%N7S3 0 0% 0%N0S4 1 1 1% 1%N1S4 1 1 2 2% 1%N2S4 0 0% 0%N3S4 1 1 1% 1%N4S4 2 1 1 1 5 5% 3%N5S4 2 2 2% 1%N6S4 0 0% 0%N7S4 0 0% 0%N0S5 0 0% 0%N1S5 1 1 1% 1%N2S5 1 1 1% 1%N3S5 1 1 1% 1%N4S5 1 1 1% 1%N5S5 1 1 1% 1%N6S5 1 1 1% 1%N7S5 1 1 1% 1%N0S6 0 0% 0%N1S6 2 2 2% 1%N2S6 0 0% 0%N3S6 0 0% 0%N4S6 0 0% 0%N5S6 0 0% 0%N6S6 0 0% 0%N7S6 0 0% 0%N0S7 0 0% 0%N1S7 0 0% 0%N2S7 0 0% 0%N3S7 0 0% 0%N4S7 0 0% 0%N5S7 0 0% 0%N6S7 0 0% 0%N7S7 0 0% 0%SN Total 80 13 2 1 0 0 0 0 0 0 0 0 0 0 0 0 0 0 0 0 0 0 0 0 0 96 100% 100% 100%NS Total 66 27 2 2 0 0 0 1 0 0 0 0 0 0 0 0 0 0 0 0 0 0 0 0 0 98Total 146 40 4 3 0 0 0 1 0 0 0 0 0 0 0 0 0 0 0 0 0 0 0 0 0 194Source) Analyzed by the Study Team based on the SC transit database of 1999.
A - 30
Table A.4.20 Number of Vessels Transiting the Canal
O-DVessel Size (up to) (1000 SCNT) Share
B - 1
Appendix B Standard Toll Level Calculation and Draft New Tariff Table B.1.1 shows the calculation method getting standard toll level which is proposed in section 5.1.3 of Chapter 5. Table B.1.2 and Table B.1.3 show the shipping cost at sea per mile and the excess cost at the Suez Canal which are obtained by the shipping cost model which is a key part of the Transit Forecast Model. The shipping cost per mile of 5,000 SCNT and 10,000 SCNT are complemented using those of 20,000 SCNT and 40,000 SCNT. This adjustment is conducted in order to protect the trade by smaller vessels since calculated toll level would become greatly higher than the current level. These smaller vessels were greatly affected by the Suez Canal closure. Table B.1.4 and Table B.1.5 show calculated toll rates and tolls when using the standard saved distance of 4,700 miles. Table B.1.6 and Table B.1.7 show the current toll and the current toll with weather deck surcharge for Container Ships. Table B.1.8 shows the ratio of the calculated toll to the current toll with weather deck surcharge. Table B.1.9 shows the revising ratio for draft new tariff. The revising ratio is set 1.03 (3% increase) when the ratio of the calculated toll to the current toll with weather deck surcharge is equal to or more than 1.1 (threshold criteria: the calculated toll is greater than the current toll by 10%). The revising ratio is set based on following reasons:
- The calculation is based on certain assumptions, so it is thought to be necessary to carefully monitor the shipping market and world trade before and after the revision is made in order to verify whether these assumptions are appropriate or not.
- As to raising tolls, the Study Team would like to propose that the tolls be raised by 3% as the first step. A step-by-step approach to revising the tolls will make it possible to observe the reactions of the shipping market.
-As to reducing tolls, it is thought to be appropriate to leave the toll as it is since there is no firm evidence that reducing the toll would increase toll revenues.
- Tolls for LNG Carriers are kept unchanged. This is because that the current tolls for LNG Carriers can be thought to be appropriate since it is necessary to bolster the price competitiveness of Arabian LNG against Algerian LNG in EU market, and it is set through negotiations with interested parties.
Table B.1.10 through Table B.1.13 show the tolls or rates of the draft new tariff obtained through the above calculations. It should be noted that the draft new tariff depends greatly on the exchange rate of US$/SDR. In this calculation, 1.30US$/SDR is assumed.

B - 2
Table B.1.1 Calculation Method getting Standard Toll Level
Table B.1.2 Shipping Cost at sea per mile (B)
Table B.1.3 Excess Cost at the Suez Canal (Esc)
Vessel Type 5,000 10,000 20,000 40,000 70,000 110,000 160,000 220,000*Tankers of Crude Oil 2.982 2.756 2.304 1.401 1.014 0.826 0.723 0.662*Tankes of Petroleum Products 2.702 2.508 2.118 1.339 1.010 0.849*Chemical Carriers 3.231 3.032 2.633 1.836 1.491 1.317*LNG Carriers 7.276 6.696 5.537 3.220 2.168 1.606*LPG Carriers 3.125 2.935 2.556 1.796 1.466 1.299*Dry Bulk Carriers 2.218 2.057 1.735 1.091 0.815 0.681*Containerships (case-1) 3.072 2.862 2.443 1.605 1.176 0.910*Containerships (case-2) 3.227 3.014 2.588 1.737 1.300 1.029*Containerships (case-3) 3.338 3.121 2.687 1.818 1.366 1.083*Containerships (case-4) 3.600 3.372 2.917 2.008 1.522 1.212*Vehicle Carriers (case-1) 1.979 1.843 1.572 1.029 0.798*Vehicle Carriers (case-2) 2.484 2.342 2.056 1.485 1.234*General Cargo Ships 2.473 2.367 2.154 1.729 1.530 1.421*Other Vessels 2.819 2.640 2.280 1.562 1.241 1.068Note) 1. B of 5,000 and 10,000 SCNT are complemented using B of 20,000 and 40,000 SCNT to protect smaller vessels. 2. Container Ships case-1: without container box capital cost nor commodity inventory cost
case-2: with container box capital cost onlycase-3: with container box capital cost and commodity inventory cost (300US$/ton)case-4: with container box capital cost and commodity inventory cost (1,000US$/ton)
3. Vehicle Carriers case-1: without inventory costcase-2: with inventory cost
4. B of "Other Vessels" are average of other vessel typs (Container Ships: case-3, Vehicle Carriers: case-2) excluding "LNG Carriers". 5. For laden voyage
(US$/SCNT/1000mile)
Vessel Size (SCNT)
Equation Ts = S x Rs = (B x Ds - Esc) x RsParameters Ts (US$/SCNT) Standard Toll Level
S (US$/SCNT) Saved Cost by using the Suez CanalRt Ratio of Supplier's Receipt (= 0.8, deducting Users' Surplus)B (US$/SCNT/mile) Shipping Cost at sea per mileDs (mile) Saved Distance
(=4,700 miles at Standard Saved Distance for Tariff)Esc (US$/SCNT) Excess Cost at the Suez Canal (=Escmo + Escoc)
Escmo= Managing Cost & Bunker Cost by witingEscoc= Other Charges at the Suez Canal
Vessel Type 5,000 10,000 20,000 40,000 70,000 110,000 160,000 220,000*Tankers of Crude Oil 2.799 1.527 0.892 0.574 0.438 0.528 0.443 0.392*Tankes of Petroleum Products 2.803 1.543 0.914 0.599 0.464 0.554*Chemical Carriers 3.014 1.713 1.063 0.738 0.599 0.687*LNG Carriers 6.664 3.564 2.014 1.453 1.029 0.823*LPG Carriers 3.067 1.769 1.121 1.011 0.780 0.668*Dry Bulk Carriers 2.373 1.297 0.759 0.490 0.374 0.475*Containerships (case-1) 2.629 1.626 1.107 0.820 0.666 0.724*Containerships (case-2) 2.694 1.690 1.171 0.884 0.731 0.788*Containerships (case-3) 2.742 1.736 1.215 0.924 0.766 0.818*Containerships (case-4) 2.853 1.844 1.318 1.017 0.847 0.888*Vehicle Carriers (case-1) 2.226 1.276 0.801 0.564 0.462*Vehicle Carriers (case-2) 2.412 1.463 0.988 0.751 0.649*General Cargo Ships 2.081 1.230 0.804 0.591 0.500 0.611*Other Vessels 2.661 1.535 0.969 0.710 0.571 0.620note) 1. B of "Other Vessels" are average of other vessel typs (Container Ships: case-3, Vehicle Carriers: case-2) excluding "LNG Carriers". 2. For laden transit
(US$/SCNT)
Vessel Size (SCNT)
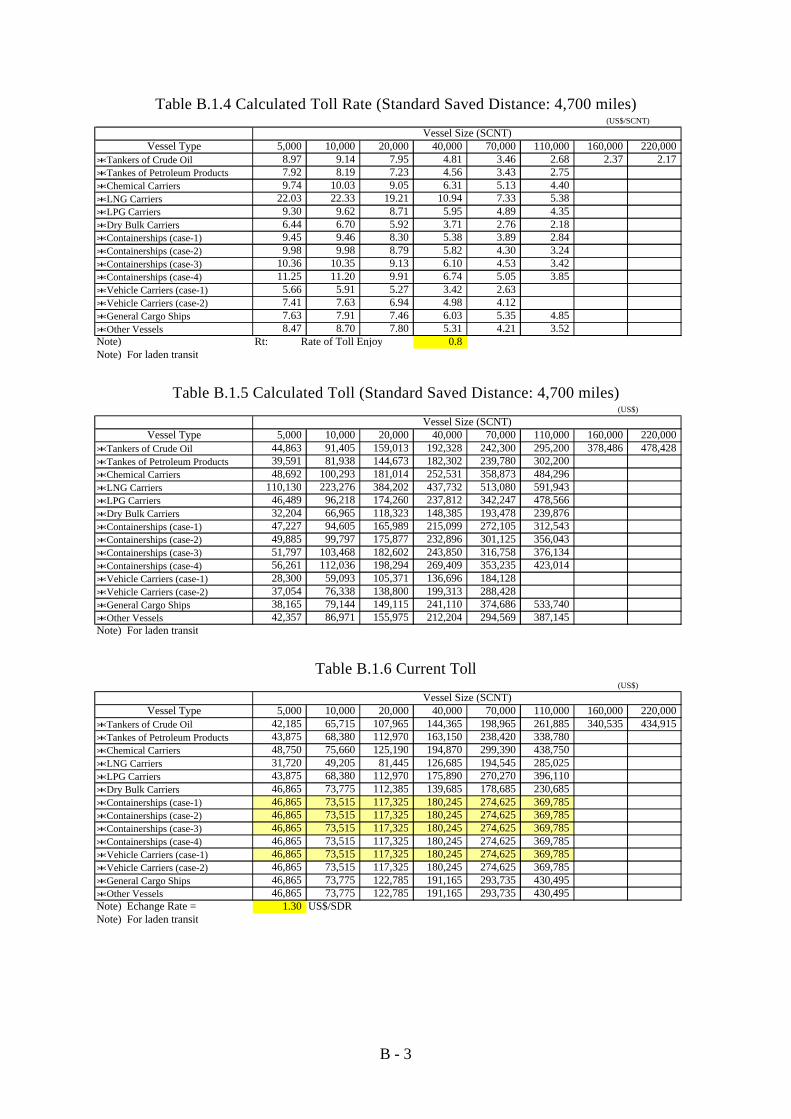
B - 3
Table B.1.4 Calculated Toll Rate (Standard Saved Distance: 4,700 miles)
Table B.1.5 Calculated Toll (Standard Saved Distance: 4,700 miles)
Table B.1.6 Current Toll
Vessel Type 5,000 10,000 20,000 40,000 70,000 110,000 160,000 220,000*Tankers of Crude Oil 8.97 9.14 7.95 4.81 3.46 2.68 2.37 2.17*Tankes of Petroleum Products 7.92 8.19 7.23 4.56 3.43 2.75*Chemical Carriers 9.74 10.03 9.05 6.31 5.13 4.40*LNG Carriers 22.03 22.33 19.21 10.94 7.33 5.38*LPG Carriers 9.30 9.62 8.71 5.95 4.89 4.35*Dry Bulk Carriers 6.44 6.70 5.92 3.71 2.76 2.18*Containerships (case-1) 9.45 9.46 8.30 5.38 3.89 2.84*Containerships (case-2) 9.98 9.98 8.79 5.82 4.30 3.24*Containerships (case-3) 10.36 10.35 9.13 6.10 4.53 3.42*Containerships (case-4) 11.25 11.20 9.91 6.74 5.05 3.85*Vehicle Carriers (case-1) 5.66 5.91 5.27 3.42 2.63*Vehicle Carriers (case-2) 7.41 7.63 6.94 4.98 4.12*General Cargo Ships 7.63 7.91 7.46 6.03 5.35 4.85*Other Vessels 8.47 8.70 7.80 5.31 4.21 3.52Note) Rt: Rate of Toll Enjoy 0.8Note) For laden transit
Vessel Size (SCNT)(US$/SCNT)
Vessel Type 5,000 10,000 20,000 40,000 70,000 110,000 160,000 220,000*Tankers of Crude Oil 44,863 91,405 159,013 192,328 242,300 295,200 378,486 478,428*Tankes of Petroleum Products 39,591 81,938 144,673 182,302 239,780 302,200*Chemical Carriers 48,692 100,293 181,014 252,531 358,873 484,296*LNG Carriers 110,130 223,276 384,202 437,732 513,080 591,943*LPG Carriers 46,489 96,218 174,260 237,812 342,247 478,566*Dry Bulk Carriers 32,204 66,965 118,323 148,385 193,478 239,876*Containerships (case-1) 47,227 94,605 165,989 215,099 272,105 312,543*Containerships (case-2) 49,885 99,797 175,877 232,896 301,125 356,043*Containerships (case-3) 51,797 103,468 182,602 243,850 316,758 376,134*Containerships (case-4) 56,261 112,036 198,294 269,409 353,235 423,014*Vehicle Carriers (case-1) 28,300 59,093 105,371 136,696 184,128*Vehicle Carriers (case-2) 37,054 76,338 138,800 199,313 288,428*General Cargo Ships 38,165 79,144 149,115 241,110 374,686 533,740*Other Vessels 42,357 86,971 155,975 212,204 294,569 387,145Note) For laden transit
(US$)
Vessel Size (SCNT)
Vessel Type 5,000 10,000 20,000 40,000 70,000 110,000 160,000 220,000*Tankers of Crude Oil 42,185 65,715 107,965 144,365 198,965 261,885 340,535 434,915*Tankes of Petroleum Products 43,875 68,380 112,970 163,150 238,420 338,780*Chemical Carriers 48,750 75,660 125,190 194,870 299,390 438,750*LNG Carriers 31,720 49,205 81,445 126,685 194,545 285,025*LPG Carriers 43,875 68,380 112,970 175,890 270,270 396,110*Dry Bulk Carriers 46,865 73,775 112,385 139,685 178,685 230,685*Containerships (case-1) 46,865 73,515 117,325 180,245 274,625 369,785*Containerships (case-2) 46,865 73,515 117,325 180,245 274,625 369,785*Containerships (case-3) 46,865 73,515 117,325 180,245 274,625 369,785*Containerships (case-4) 46,865 73,515 117,325 180,245 274,625 369,785*Vehicle Carriers (case-1) 46,865 73,515 117,325 180,245 274,625 369,785*Vehicle Carriers (case-2) 46,865 73,515 117,325 180,245 274,625 369,785*General Cargo Ships 46,865 73,775 122,785 191,165 293,735 430,495*Other Vessels 46,865 73,775 122,785 191,165 293,735 430,495Note) Echange Rate = 1.30 US$/SDRNote) For laden transit
(US$)
Vessel Size (SCNT)

B - 4
Table B.1.7 Current Toll with Weather Deck Surcharge
Table B.1.8 Ratio of Calculated Toll to Current Toll with Weather Deck Surcharge
Table B.1.9 Revising Ratio for Draft New Tariff
Vessel Type 5,000 10,000 20,000 40,000 70,000 110,000 160,000 220,000*Tankers of Crude Oil 42,185 65,715 107,965 144,365 198,965 261,885 340,535 434,915*Tankes of Petroleum Products 43,875 68,380 112,970 163,150 238,420 338,780*Chemical Carriers 48,750 75,660 125,190 194,870 299,390 438,750*LNG Carriers 31,720 49,205 81,445 126,685 194,545 285,025*LPG Carriers 43,875 68,380 112,970 175,890 270,270 396,110*Dry Bulk Carriers 46,865 73,775 112,385 139,685 178,685 230,685*Containerships (case-1) 51,411 80,646 128,706 197,729 301,264 405,654*Containerships (case-2) 51,411 80,646 128,706 197,729 301,264 405,654*Containerships (case-3) 51,411 80,646 128,706 197,729 301,264 405,654*Containerships (case-4) 51,411 80,646 128,706 197,729 301,264 405,654*Vehicle Carriers (case-1) 46,865 73,515 117,325 180,245 274,625 369,785*Vehicle Carriers (case-2) 46,865 73,515 117,325 180,245 274,625 369,785*General Cargo Ships 46,865 73,775 122,785 191,165 293,735 430,495*Other Vessels 46,865 73,775 122,785 191,165 293,735 430,495Note) Current tolls for Container Ships are applied the weather deck surcharge of 9.7%Note) For laden transit
(US$)
Vessel Size (SCNT)
Vessel Type 5,000 10,000 20,000 40,000 70,000 110,000 160,000 220,000*Tankers of Crude Oil 1.06 1.39 1.47 1.33 1.22 1.13 1.11 1.10*Tankes of Petroleum Products 0.90 1.20 1.28 1.12 1.01 0.89*Chemical Carriers 1.00 1.33 1.45 1.30 1.20 1.10*LNG Carriers 3.47 4.54 4.72 3.46 2.64 2.08*LPG Carriers 1.06 1.41 1.54 1.35 1.27 1.21*Dry Bulk Carriers 0.69 0.91 1.05 1.06 1.08 1.04*Containerships (case-1) 0.92 1.17 1.29 1.09 0.90 0.77*Containerships (case-2) 0.97 1.24 1.37 1.18 1.00 0.88*Containerships (case-3) 1.01 1.28 1.42 1.23 1.05 0.93*Containerships (case-4) 1.09 1.39 1.54 1.36 1.17 1.04*Vehicle Carriers (case-1) 0.60 0.80 0.90 0.76 0.67*Vehicle Carriers (case-2) 0.79 1.04 1.18 1.11 1.05*General Cargo Ships 0.81 1.07 1.21 1.26 1.28 1.24*Other Vessels 0.90 1.18 1.27 1.11 1.00 0.90Note) For laden transit
Vessel Size (SCNT)
Vessel Type 5,000 10,000 20,000 40,000 70,000 110,000 160,000 220,000*Tankers of Crude Oil 1.00 1.03 1.03 1.03 1.03 1.03 1.03 1.03*Tankes of Petroleum Products 1.00 1.03 1.03 1.03 1.00 1.00*Chemical Carriers 1.00 1.03 1.03 1.03 1.03 1.03*LNG Carriers 1.00 1.00 1.00 1.00 1.00 1.00*LPG Carriers 1.00 1.03 1.03 1.03 1.03 1.03*Dry Bulk Carriers 1.00 1.00 1.00 1.00 1.00 1.00*Containerships (case-1) 1.00 1.03 1.03 1.00 1.00 1.00*Containerships (case-2) 1.00 1.03 1.03 1.03 1.00 1.00*Containerships (case-3) 1.00 1.03 1.03 1.03 1.00 1.00*Containerships (case-4) 1.00 1.03 1.03 1.03 1.03 1.00*Vehicle Carriers (case-1) 1.00 1.00 1.00 1.00 1.00*Vehicle Carriers (case-2) 1.00 1.00 1.03 1.03 1.00*General Cargo Ships 1.00 1.00 1.03 1.03 1.03 1.03*Other Vessels 1.00 1.03 1.03 1.03 1.00 1.00Note) Maximum increase 1.03Note) LNG Carriers remain unchangedNote) For laden transit
(US$)
Vessel Size (SCNT)

B - 5
Table B.1.10 Toll for Draft New Tariff
Table B.1.11 Draft New Tariff in US$
Table B.1.12 Draft New Tariff in SDR
Vessel Type 5,000 10,000 20,000 40,000 70,000 110,000 160,000 220,000*Tankers of Crude Oil 42,185 67,686 111,204 148,696 204,934 269,742 350,751 447,962*Tankes of Petroleum Products 43,875 70,431 116,359 168,045 238,420 338,780*Chemical Carriers 48,750 77,930 128,946 200,716 308,372 451,913*LNG Carriers 31,720 49,205 81,445 126,685 194,545 285,025*LPG Carriers 43,875 70,431 116,359 181,167 278,378 407,993*Dry Bulk Carriers 46,865 73,775 112,385 139,685 178,685 230,685*Containerships (case-1) 46,865 75,720 120,845 180,245 274,625 369,785*Containerships (case-2) 46,865 75,720 120,845 185,652 274,625 369,785*Containerships (case-3) 46,865 75,720 120,845 185,652 274,625 369,785*Containerships (case-4) 46,865 75,720 120,845 185,652 282,864 369,785*Vehicle Carriers (case-1) 46,865 73,515 117,325 180,245 274,625*Vehicle Carriers (case-2) 46,865 73,515 120,845 185,652 274,625*General Cargo Ships 46,865 73,775 126,469 196,900 302,547 443,410*Other Vessels 46,865 75,988 126,469 196,900 293,735 430,495Note) Maximum increase 1.03Note) LNG Carriers remain unchangedNote) For laden transit
Vessel Size (SCNT)(US$)
Vessel TypeFirst5000
Next5000
Next10000
Next20000
Next30000
Next40000
Next50000
Rest
*Tankers of Crude Oil 8.44 5.10 4.35 1.87 1.87 1.62 1.62 1.62*Tankes of Petroleum Products 8.78 5.31 4.59 2.58 2.35 2.51*Chemical Carriers 9.75 5.84 5.10 3.59 3.59 3.59*LNG Carriers 6.34 3.50 3.22 2.26 2.26 2.26*LPG Carriers 8.78 5.31 4.59 3.24 3.24 3.24*Dry Bulk Carriers 9.37 5.38 3.86 1.37 1.30 1.30*Containerships (case-1) 9.37 5.77 4.51 2.97 3.15 2.38*Containerships (case-2) 9.37 5.77 4.51 3.24 2.97 2.38*Containerships (case-3) 9.37 5.77 4.51 3.24 2.97 2.38*Containerships (case-4) 9.37 5.77 4.51 3.24 3.24 2.17*Vehicle Carriers (case-1) 9.37 5.33 4.38 3.15 3.15*Vehicle Carriers (case-2) 9.37 5.33 4.73 3.24 2.97*General Cargo Ships 9.37 5.38 5.27 3.52 3.52 3.52*Other Vessels 9.37 5.82 5.05 3.52 3.23 3.42Note) For laden transit
(US$/SCNT)
Vessel Size (SCNT)
Vessel TypeFirst5000
Next5000
Next10000
Next20000
Next30000
Next40000
Next50000
Rest
*Tankers of Crude Oil 6.49 3.92 3.35 1.44 1.44 1.25 1.25 1.25*Tankes of Petroleum Products 6.75 4.09 3.53 1.99 1.80 1.93*Chemical Carriers 7.50 4.49 3.92 2.76 2.76 2.76*LNG Carriers 4.88 2.69 2.48 1.74 1.74 1.74*LPG Carriers 6.75 4.09 3.53 2.49 2.49 2.49*Dry Bulk Carriers 7.21 4.14 2.97 1.05 1.00 1.00*Containerships (case-1) 7.21 4.44 3.47 2.28 2.42 1.83*Containerships (case-2) 7.21 4.44 3.47 2.49 2.28 1.83*Containerships (case-3) 7.21 4.44 3.47 2.49 2.28 1.83*Containerships (case-4) 7.21 4.44 3.47 2.49 2.49 1.67*Vehicle Carriers (case-1) 7.21 4.10 3.37 2.42 2.42*Vehicle Carriers (case-2) 7.21 4.10 3.64 2.49 2.28*General Cargo Ships 7.21 4.14 4.05 2.71 2.71 2.71*Other Vessels 7.21 4.48 3.88 2.71 2.48 2.63Note) Echange Rate = 1.30 US$/SDRNote) For laden transit
Vessel Size (SCNT)(SDR/SCNT)
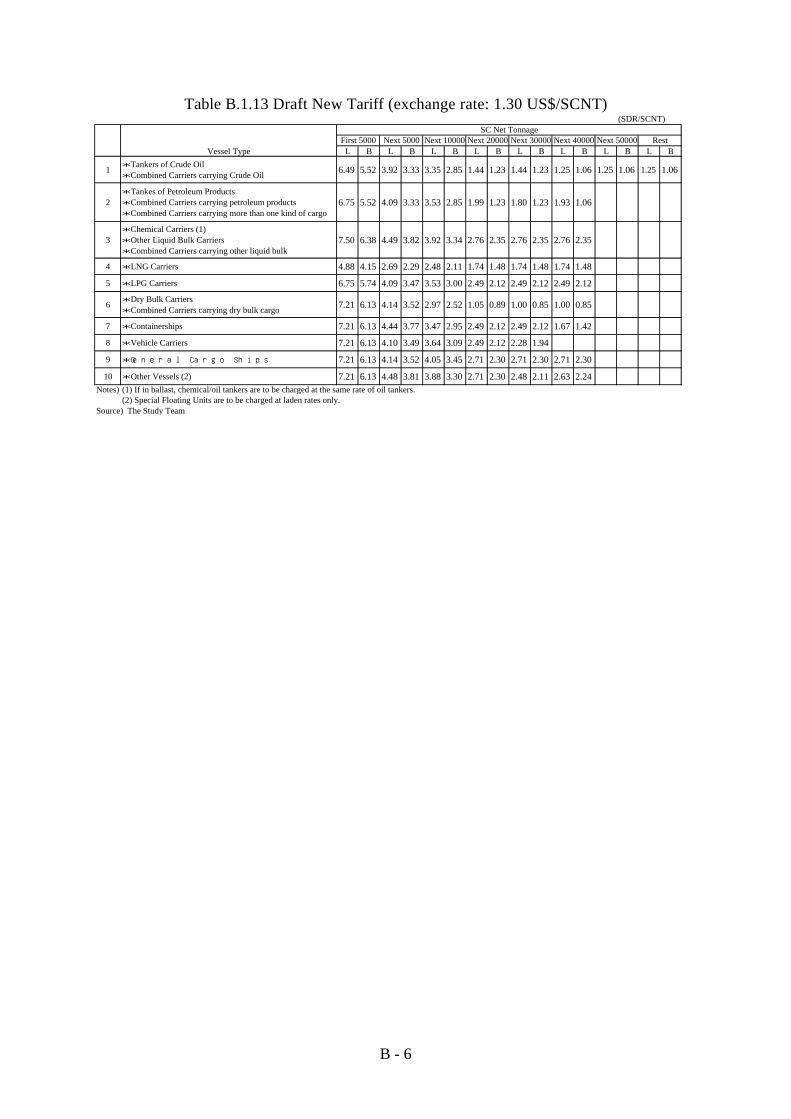
B - 6
Table B.1.13 Draft New Tariff (exchange rate: 1.30 US$/SCNT)
(SDR/SCNT)
Vessel Type L B L B L B L B L B L B L B L B
1*Tankers of Crude Oil*Combined Carriers carrying Crude Oil 6.49 5.52 3.92 3.33 3.35 2.85 1.44 1.23 1.44 1.23 1.25 1.06 1.25 1.06 1.25 1.06
2*Tankes of Petroleum Products*Combined Carriers carrying petroleum products*Combined Carriers carrying more than one kind of cargo
6.75 5.52 4.09 3.33 3.53 2.85 1.99 1.23 1.80 1.23 1.93 1.06
3*Chemical Carriers (1)*Other Liquid Bulk Carriers*Combined Carriers carrying other liquid bulk
7.50 6.38 4.49 3.82 3.92 3.34 2.76 2.35 2.76 2.35 2.76 2.35
4 *LNG Carriers 4.88 4.15 2.69 2.29 2.48 2.11 1.74 1.48 1.74 1.48 1.74 1.48
5 *LPG Carriers 6.75 5.74 4.09 3.47 3.53 3.00 2.49 2.12 2.49 2.12 2.49 2.12
6*Dry Bulk Carriers*Combined Carriers carrying dry bulk cargo 7.21 6.13 4.14 3.52 2.97 2.52 1.05 0.89 1.00 0.85 1.00 0.85
7 *Containerships 7.21 6.13 4.44 3.77 3.47 2.95 2.49 2.12 2.49 2.12 1.67 1.42
8 *Vehicle Carriers 7.21 6.13 4.10 3.49 3.64 3.09 2.49 2.12 2.28 1.94
9 *General Cargo Ships 7.21 6.13 4.14 3.52 4.05 3.45 2.71 2.30 2.71 2.30 2.71 2.30
10 *Other Vessels (2) 7.21 6.13 4.48 3.81 3.88 3.30 2.71 2.30 2.48 2.11 2.63 2.24Notes) (1) If in ballast, chemical/oil tankers are to be charged at the same rate of oil tankers.
(2) Special Floating Units are to be charged at laden rates only.Source) The Study Team
Next 40000 Next 50000 RestSC Net Tonnage
First 5000 Next 5000 Next 10000 Next 20000 Next 30000

C - 1
Appendix C Extract of the Panama Canal's regulations C.1 Organic Law of the Panama Canal Authority (article 75 to 80) ORGANIC LAW PANAMA CANAL AUTHORITY PANAMA LEGISLATIVE ASSEMBLY LAW No. 19 (of June 11, 1997) "WHEREBY THE PANAMA CANAL AUTHORITY IS ORGANIZED" Chapter IV - Vessels and Navigation Section Three - Tolls for use of the Canal and Rates for Services Article 75. Tolls shall be set at rates estimated to cover the costs of operation and modernization of the Canal, and will include at least:
1. The costs of operating the Canal, including depreciation costs, support for water resources protection, working capital, and the required reserves.
2. Payments to the National Treasury, as stipulated in the National Constitution and this Law, estimated according to the bases established in the regulation for this purpose.
3. Capital for plant replacement, expansion, improvements, and modernization of the Canal.
4. Interest on the assessed value of the Canal. 5. Losses carried over from previous years.
The tolls and rates established by the Authority shall take into consideration the conditions of safe, uninterrupted, efficient, competitive, and profitable Canal service. Article 76. Neither the Government nor the Authority may authorize exemption from the payment of tolls, fees, or tariffs for Canal services. Notwithstanding, vessels exempted by virtue of international treaties in effect, ratified by the Republic of Panama, shall not pay tolls for transiting the Canal. Article 77. All Canal users subject to tolls, fees, and tariffs shall make the payment in cash, in the legal currency of the Republic of Panama or the currency established by the Authority before the service requested is rendered, in an amount equivalent to the cost of the service. The above-mentioned payment may be substituted by a surety posted by a bank that meets the requirements of the Authority for such purpose. Article 78. The Authority may require, as a previous condition for transit, that vessels clearly establish the financial responsibility and guarantees for payment of a reasonable and adequate amount, consistent with the rules of international practice, to cover any damages that may result from their transit through the Canal. In the case of a government-owned or government-operated vessel, or for which the government of a country has accepted responsibility, it shall suffice to guarantee such financial responsibility by means of a certification by the respective country stating that it shall comply with its obligations, in accordance with International Law, to pay any damages arising from actions or omissions of such ships during their passage through the Canal.
C - 2
The exception set forth in the previous paragraph will not be applicable when the vessel, property of a State or operated by the same, is engaged in maritime trade. Article 79. The Authority shall give interested parties an opportunity to participate in the consultation processes for the purpose of revising tolls and admeasurement rules by submitting, in writing, data, opinions, or arguments, and participating in a public hearing to be held at least 30 days after the date of publication of a notice in the official publication of the Authority in which said hearing is called. Article 80. The fees and rates established for the rendering of other services will take into consideration at least the corresponding cost of such services, as determined by the Regulations. C.2 Regulation on the Procedure to Revise the Panama Canal Tolls Rate AGREEMENT No. 3 (of November 12, l998) "Whereby the Regulation on the Procedure to Revise the Panama Canal Tolls Rate and Admeasurement Rules is approved" THE BOARD OF DIRECTORS OF THE PANAMA CANAL AUTHORITY WHEREAS: In accordance with article 18.3 of the Canal Authority Organic Law, one of the functions of the Board of Directors is to establish tolls for the use of the Canal, with the approval of the Cabinet Council; Article 79 of the aforementioned law prescribes that any revision of the tolls rate or of the admeasurement rules must be subject to a previous consultation and public hearing process, to afford the interested parties an opportunity to participate and to express their opinions and arguments on the Subject; We have received from the Administrator of the Authority the proposed regulation of the procedure to revise the Panama Canal admeasurement rules and tolls rate. RESOLVES: ARTICLE : To approve the following regulation on the procedure to revise the Panama Canal tolls rate and admeasurement rules: " REGULATION ON THE PROCEDURE TO REVISE THE PANAMA CANAL TOLLS RATE AND ADMEASUREMENT RULES" Article 1. Modifications to the Panama Canal admeasurement rules and the tolls rate shall be subject to a previous consultation and public hearing process, pursuant to this regulation. Article 2. The proposal to revise [the tolls rate and the admeasurement rules] shall be opened to public consultation, and all interested parties may participate. Any proposal must be explained, with the inclusion of all the factors that would have been object of the
C - 3
revision by the Authority, for the effects of its issuance. Article 3. The Authority shall make an official announcement of the proposal by means of its publication in the Panama Canal Register, with at least thirty (30) days in anticipation of the date of the public hearing. Article 4. This Announcement shall contain: 1. The essence of the proposed change; 2. The date, place and procedures for receiving information and opinions, and participation
in the hearing; 3. The date in which the interested parties must submit their notice of attendance to the
public hearing. Article 5. Following publication of the announcement, the Authority shall make available to the public the explained proposal referred to in Article 2 of this regulation. Article 6. The Board of Directors shall designate a minimum of three of its members to form part of the Committee that shall conduct the process of consultation and hearings, and shall appoint one of its members to chair this Committee. Article 7. The Committee shall apply this regulation, and its functions shall include the following: 1. Conduct the process of consultation and bearings; 2. Request or receive opinions, presentations or additional information; 3. Decide on procedural or similar matters; 4. Dispense with any irrelevant, irrmateria1, or excessively repetitive material expounded
by the parties; 5. Dispense with any participant whose behavior interferes with the process of the hearing. The Committee should submit to the Board of Directors the complete file of its activities, with the pertinent recommendation. Article 8. The interested parties shall have the opportunity to participate in the process of the admeasurement rules and tolls rate revision by submitting information, opinions, or statements in writing to the Chairman of the Committee, within the time limits established in the announcement. The opinions, information and oral expositions that this regulation refers to may be in Spanish or English. Article 9. The interested parties that have participated in the process of consultation shall also have the opportunity to participate in the public hearing. The hearing shall be held on the date and place prescribed by the announcement, and the parties in attendance may present additional information in writing on any material they have already incorporated, as well as make any statements or oral presentations concerning the admeasurement rules or the tons rate, as appropriate.

C - 4
Article 10. The hearing may be attended by the interested parties in person or by their representatives. They must give notice of their attendance in writing to the Chairman of the Committee within the time limits prescribed in the announcement of the hearing, and they must include the following information: 1. The names and addresses of the parties, and the condition under which they attend. 2. The place where they wish to make their presentation, if the hearings are scheduled to be held in more than one place. Article 11. After considering the Committee's conclusions and recommendations, the Authority shall analyze the proposed admeasurement rules or tolls rate, as appropriate. However, in the case of tolls, if the rates proposed during the analysis are higher than the original proposal, the process shall be repeated. This requirement shall apply to any subsequent revision in which higher rates than those contemplated in the previous proposal are proposed. Article 12. Any interested party may have access to the transcript of the presentations made in the hearing, provided they submit previous request thereto, and pay the costs established by the Authority. Article 13. Changes to the tolls rate and admeasurement rules shall become effective on the date determined by the Board of Directors. Given in the city of Panama, on November 12, 1998. TO BE PUBLISHED AND ENFORCED Jorge E. Ritter, Minister for Canal Affairs Tomas Paredes, Secretary Ad Hoc


