General Economy Overview• Most of the macroeconomic factors that drive commercial foodservice sales
are quite positive and are mostly forecast to improve in 18 but slow in 19.• The macro forecasts below are from Blue Chip Economic Indicators. • After the disruptions of hurricane season, employment growth rebounded in
Oct. & Nov. sagged in Dec., then accelerated again in Jan. • Wage growth has finally begun to rise that past two months, up 2.9%.• Disposable personal income growth deteriorated in 2017, in part because of
the storms, but is forecast to improve in 2018. • Consumer spending remains moderately strong, forecast at 2.8% real in 18.• Consumer confidence is running at high levels, but remains split• Gasoline prices remain historically low, but have ticked up in recent weeks.
Crude oil prices are on the rise, a worrisome sign.
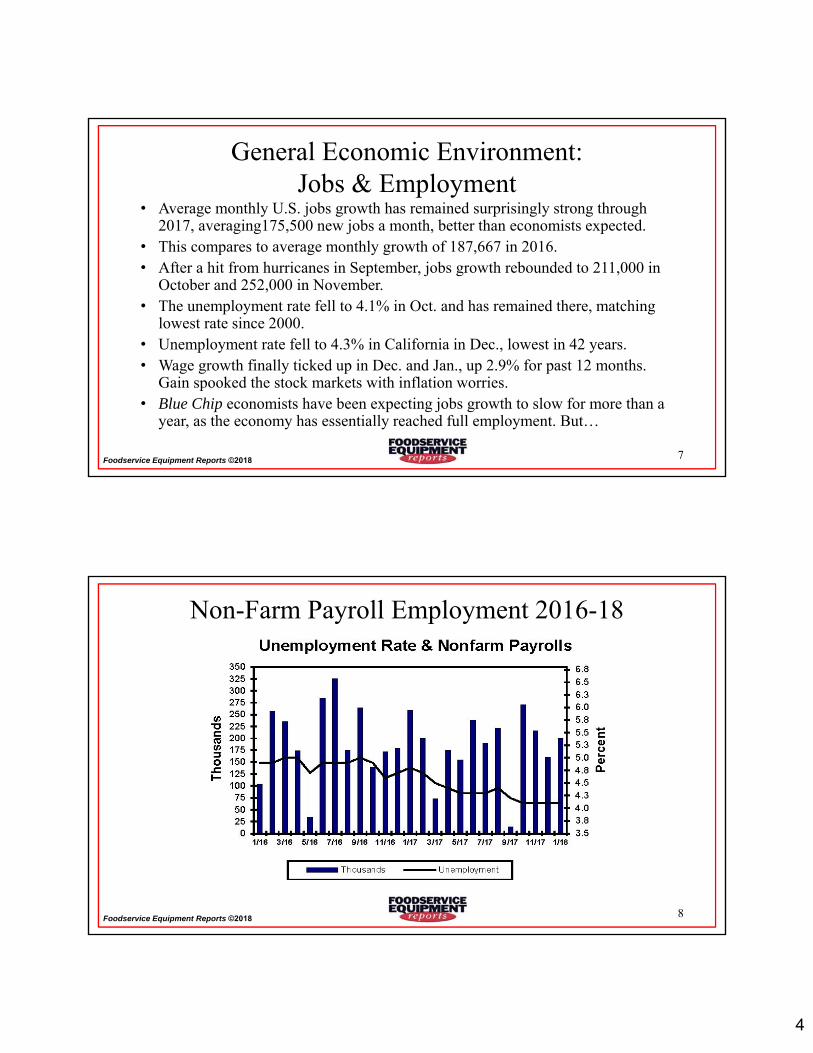
• Average monthly U.S. jobs growth has remained surprisingly strong through 2017, averaging175,500 new jobs a month, better than economists expected.
• This compares to average monthly growth of 187,667 in 2016.• After a hit from hurricanes in September, jobs growth rebounded to 211,000 in
October and 252,000 in November.• The unemployment rate fell to 4.1% in Oct. and has remained there, matching
lowest rate since 2000.• Unemployment rate fell to 4.3% in California in Dec., lowest in 42 years.• Wage growth finally ticked up in Dec. and Jan., up 2.9% for past 12 months.
Gain spooked the stock markets with inflation worries.• Blue Chip economists have been expecting jobs growth to slow for more than a
year, as the economy has essentially reached full employment. But…
• Consumer confidence has been running at its highest levels since 2000, according to both the U. Michigan’s Surveys of Consumers and The Conference Board.
• The UM Consumer Sentiment Index hit a cyclical high in October, declined slightly Nov. through Jan., but shot up again in mid-Feb. reading.
• The Conference Board’s Consumer Confidence Index hit a 17-year high in Nov., fell a bit in Dec. but rose again in Jan.
• There remains an income and political split with Democrats and lower-income households much less optimistic,
• Still, most of those surveyed expect job growth to continue and their personal finances to improve and stock market gyrations have had little effect to date.
• UM expects consumer spending to increase 2.9% real this year, higher than the the Blue Chip consensus forecast.
Gasoline & Energy Price Trends• Gasoline prices fell sharply following the run-up caused by the hurricanes
impact on production in September.• But that changed after the New Year with price of regular gallon rising more
than 30 cents through Feb. 5 to more than $2.61 a gallon regular.• Prices have fallen eight cents since, though decline may be short-lived.• Prices are now running 25 cents higher than 2017 and are at highest prices to
open a year since 2014.• Things are worse in Calif. per usual. Prices stood at $3.33 2-20, up only 15
cents from month ago but 43 cents vs. year ago. • OPEC’s attempts to limit production, and increased demand, have led to an
increase in crude prices. • But Americans continue to increase production, undercutting OPEC.• This leads EIA and AAA to forecast a continuation of moderate energy prices
Tax & Labor Policy Issues• The recently passed Federal tax legislation has three provisions that could
influence foodservice sales and growth rates.• On the plus side, the law allows immediate expensing of capital expenditures,
instead of amortizing over decades.• Could lead to operators increasing capital spending.• Also a plus, maybe: The law cuts business tax rates substantially, including for
LLC and other “pass-throughs.” • On negative side: the law eliminates 50% deduction for business
entertainment. Will probably hurt fine dining, golf and other clubs.• On the labor side, DOL is considering rule change that would allow operators,
etc. to pool tips, but with no provision they distribute them.
Operator Sales & Traffic Recent History• Commercial operator fortunes have moderately improved since summer.• NPD reported 3Q/17 traffic rose 1%, the first increase in six quarters.• Most growth was at the big quick-service and coffee chains, though traffic at
other QSRs improved to flat in the quarter.• Fast-casual concepts continue to see sales slide 3Q with 8 of 11 chains
reporting same-store sales declines, according to Technomic. • But NPD reported 8% traffic gains for segment 3Q.• Traffic and same-store sales declines continued at full-service concepts.• Noncommercial markets still show relative strength.• In mid-January, Technomic lowered its 2018 forecast to 3.6% nominal and
1.2% in May, both down 0.2 point. All the change is in restaurant segments.• Per capita visits continue to fall with flat traffic growth, growing population.
Recent Sales & Traffic Trends• After strong 2015, data from Technomic, NPD and NRA tracked a consistent
decline in sales and in most cases traffic since early 2016.• Until recently, big chain traffic has been consistently negative. Even QSR,
where all the traffic growth has been post-recession, was flat to down. • Full service continues to be particularly affected, both midscale and casual. • Fast-casual numbers were hurt by Chipotle’s dramatic problems, but
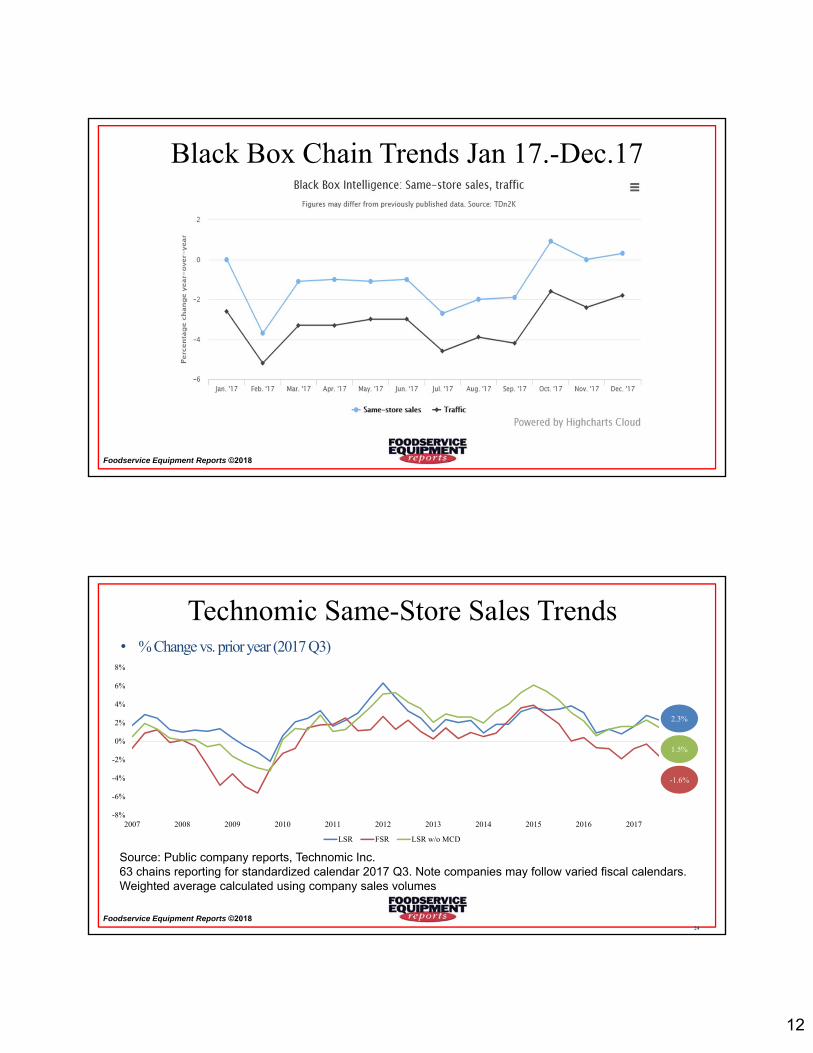
overbuilding also has affected same-store sales growth.• But some big chains saw an uptick in 3Q, led by McDonald’s.• NPD overall traffic went positive 3Q. Black Box shows improvement through
Dec. with surprise: casual, family and fast casual segments all positive 4Q.
Source: Public company reports, Technomic Inc.63 chains reporting for standardized calendar 2017 Q3. Note companies may follow varied fiscal calendars.Weighted average calculated using company sales volumes
Recent Sales & Traffic Trends• NRA’s overall Restaurant Performance Index has remained in expansion
territory since August 2016.• But for most of 2017, it has skimmed along just above the tipping point.• Current traffic index has been remain consistently negative. It fell to 97
in October survey. Same-store sales have been above and below the line.• Federal eating & drinking place sales numbers have ticked up recently.• The RPI rebounded strongly in the December survey; tax effect?• And operator optimism about near-term is quite strong. Expectations for
sales and business conditions in six months are very positive.• The RPI’s capital spending indicators remain positive, as we’ll see later.
Operator Unit Trends Recent History• Slow sales growth continues to have a profound impact on unit growth.• It’s a very mature, highly competitive market with thousands of operations going out
of business each year.• The number of restaurant units in the U.S. fell from 662,315 Fall 2015 to 647,288
Fall 2017, according to revised the NPD’s ReCount census.• That’s a loss of 2.3% of the total restaurants in America.• All the loss has been among independents throughout the period. Chains continue to
add units.• While so-called micro-chains (3-19 units), also called Local Leverage Operators in
urban areas, have been growing, Pentallect says even they saw high-profile closures in second half of 2017.
• Reasons: High rents, higher labor costs, saturation and “me-too”ism.
Operator Segment Trends—Restaurants• Among the restaurant segments, fast-casual continues to post the strongest
growth. But the bloom is off the rose.• Unit growth was down to 4% fall 2016 to Fall 17, per NPD’s ReCount. And
the total unit count is still just over 25,000, out of nearly 650K restaurants.• Traditional QSR—fast food!—is doing better thanks to McDonald’s.• Full service, in all forms, continue to struggle.• Family dining continues in structural decline, causal dining, other than
“polished,” struggles and even fine dining has been off recently.• Still, Technomic forecasts all restaurant segments will show positive real
growth in 2018, other than midscale/family dining.
Beyond Restaurants Operator Trends• Technomic has not revised “beyond restaurants” forecasts since May 2017.• Technomic forecast for slowing growth in retail segments seems to be coming
true. NPD reported retail only QSR sub-segment saw traffic decline 3Q.• C-stores continue to invest in foodservice, but sales growth is just average.• Noncommercial segments show more varied growth rates.• Hospitals and senior living continue to see the strongest growth.• But schools, B&I, colleges/universities and long-term care are all experiencing
below-trend growth rates.• NPD Onsite had traffic up in noncommercial for third consecutive year 2016.• State tax receipts are beginning to recover while local tax growth slowing.
Some Strange Days For Commodities & Metals• All of the key metals used in foodservice continue to move higher.• Stainless steel prices, which had lagged the other industrial metals, have
spiked the past few months as nickel prices have surged.• And Metal Miner sees more upward pressure on the metal.• Aluminum prices particularly have moved higher, hit five-year high in
November; copper prices also continue to rise.• Raw steel prices, after leading surge, paused, but are on the rise again.• Trump Administration has now recommended tariffs on steel and
aluminum imports, creating lots of uncertainty, as have NAFTA talks.• And rising crude oil prices tend to effect all commodity trends.
E&S Market Indicators• The NRA Restaurant Performance Index capital spending indicators have
mostly continued to track at very high historical levels.• Both indicators rose sharply in the October survey, fell sharply in Nov., then
rebounded strongly in Dec.• That kind of extreme “waffling” usually indicates a change in trend.• The big publicly reporting E&S companies continue to post weak results.• Combined sales were barely positive in the 3Q/17, compared to an equally
weak prior year.• Slow chains sales and currency effects of strong dollar, plus structural issues,
are the main reasons.• But there is some sign of improvement between the cracks.
E&S Market Indicators• The 3Q/17 MAFSI Barometer came in at a weak 2.6% sales increase, and rose
only 2.8% 4Q/17, following a 3.3% gain in the 1Q and 3.5% increase 2Q.• Average increase for the four quarters of 2017 is 3%, compared to 4.4%
average in 2016 and 4.9% 2015, so definitely a slowing trend.• On a category basis, 4Q equipment sales rose 2.9 %, while supplies came in at
3.1%, tabletop sales 2.1% and furnishing 2.9%., all better than 3Q.• Sales in the West region have been running even slower., with 4Q gain of only
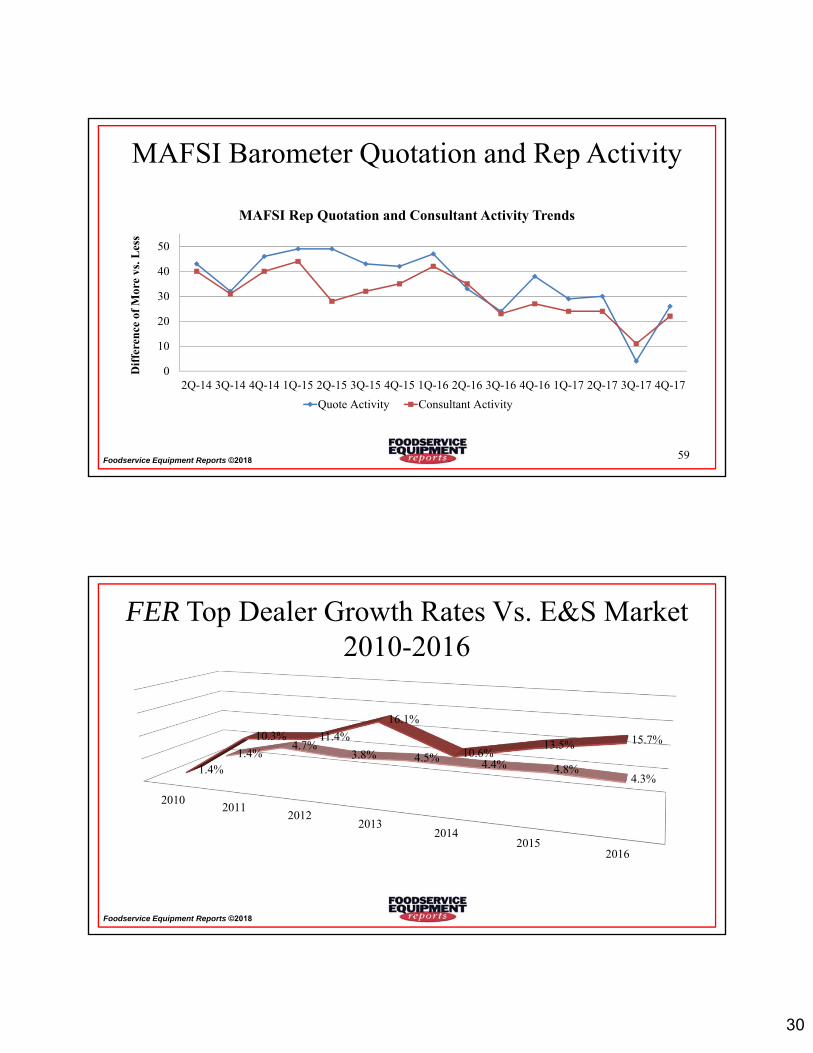
1.7%, driven in part by very weak 1.9% equipment increase.• Sales in the West have been lagging total market for several quarters.• They were only 0.7% higher 3Q/17 as equipment sales fell 0.4% • More dramatic was fall in positive trends for quotation and consultant activity.• After more than a year of running at positive differentials of 25 to 25 points,
E&S Market Indicators• One of the most dramatic trends in the MAFSI data was sharp fall in positive
trends for quotation and consultant activity 3Q• After more than a year of running at positive differentials of 25 to 25 points,
both indicators crashed, with positive for quotation activity down to 4.• Fortunately, both indicators rebounded 4Q, with positive differential now 26
for quotation activity and 22 for consultant activity.• The reps forecast continued sluggish growth for the 1Q/18: 2.7%.• But their forecast for all 2018 is a stronger 3.7%• One other key aspect of E&S market trends in the rapid consolidation and
nationalization of E&S distribution.• Internet E&S sales continue to grow, with most customers smaller operators.
FER E&S Market Estimate—2017• With four quarters of hard data on 2017, it is very clear growth of the E&S market
has slowed substantially. • Both the MAFSI Barometer and public company numbers plot the slowdown.• But it still doesn’t make sense. Macro fundamentals are positive, and NRA cap-ex
indicators are quite positive.• Operator forecasts remain moderately positive though Technomic revised 2018
forecast for restaurant sales down slightly.• We understand the slowdown in chain buying, but the slowdown in the spec markets
was particularly flummoxing.• But at the end of the day, one has to go with the hard numbers.• So, we have cut the nominal estimate for 2017 to 3% nominal (from 3.5% in August),
but increased real growth to 1.1% with lower price increases.
FER E&S Forecast—2018• Given the top line trend, we have also revised down our forecast for 2018 to 3.4%
nominal (from 3.6% in August) and 1.2% real.• In our earlier revision in April it stood at 4.0% nominal and 1.6% real.• Still, we just can’t see the market slowing even more than 2017’s rate.• Fundamentals remain strong across all macroeconomic and many industry indicators. • Big chain sales appear to be recovering and traffic slide has ended. • Noncommercial trends are moderately positive across the segments.• Uncertainty seems to be a major factor; folks just aren’t pulling trigger on projects.• But we do believe 2018 will be slightly stronger than 2017. Let’s hope.• We believe we can all expect real growth during the next few years, but the growth
rates will be quite moderate.• It’s a market of renovation, replacement, and repair, not new construction.
A Note On FER’s E&S Market Forecasts • Foodservice Equipment Reports stages its annual President’s Preview E&S
Market Forecast in early August each year.• The full forecast is presented in a series of webinars and includes multiple
PowerPoint decks and other data.• It includes detailed information and forecasts on macroeconomic, operator,
international operator and material price trends, E&S price trends data from AutoQuotes Inc., rankings of Top Manufacturers and Dealers and our hard-number forecasts of the E&S market
• We also present quarterly updates, also by webinar. The next one tentatively scheduled for Mar. 20, 2018
• For prices and other information, contact Robin Ashton: [email protected].