Page 1
All material and © copyright Demand Driven Institute 2011, all rights reserved
The Formal Planning Revolution - Demand Driven MRP
Presented by Chad Smith, co-authorOrlicky’s Material Requirements Planning, 3/EPartner, Demand Driven Institute
Page 2
Today’s formal planning systems arefundamentally broken!
What is the Problem we are Solving?
DDMRP Sneak Peek All material and © copyright Demand Driven Institute 2011, all rights reserved
2
Page 3
All material and © copyright Demand Driven Institute 2012, all rights reservedDDMRP Intro3
Old Rules, Old Tools, New Pressures
• Forecast error is on the rise• Volatility in supply and demand is increasing• Legacy planning tactics and tools are breaking down
► Inside most modern ERP systems is MRP► 79% of ERP Buyers implement MRP► Conceived in the 1950’s► Codified in the 1960’s► Commercialized in the 1970’s and… ► …it hasn’t changed► What has changed?
Page 4
All material and © copyright Demand Driven Institute 2012, all rights reservedDDMRP Intro4
The “New Normal”
• Pressure for leaner inventories• Inaccurate forecasts• More product variety• Long lead time
parts/components
4DDMRP Sneak Peek All material and © copyright Demand Driven Institute 2011, all rights reserved
• Global sourcing and demand• Shorter product life cycles• Shorter customer tolerance times• More product complexity and/or
customization
Worldwide there are more complex planning and supply
scenarios than ever – the past is NOT an predictor for the future
Page 5
All material and © copyright Demand Driven Institute 2012, all rights reservedDDMRP Intro5
The First Law of Manufacturing
All benefits will be directly related to the speed of FLOW of materials and information.
Materials & Information
Information
Corollary:Materials and Information must be RELEVANT!!!
Page 6
All material and © copyright Demand Driven Institute 2012, all rights reservedDDMRP Intro6
Too Little =stock-outs,
back orders, expedites &
missed sales
Too much = cash, capacity and space tied up in inventory
Effective
Ineffective
Amount of inventory
Effective Materials and Inventory Mgmt –What Should we Strive For?
Page 7
All material and © copyright Demand Driven Institute 2012, all rights reservedDDMRP Intro7
Effective
IneffectiveToo Little =stock-outs,
back orders, expedites &
missed sales
Too much = cash, capacity and space tied up in inventory
Unacceptable Inventory PerformanceUnacceptable Service Level Performance
High Expedite Related Wastes
Oscillation
Page 8
All material and © copyright Demand Driven Institute 2012, all rights reservedDDMRP Intro8
Supply Chains = Islands of MRP
But how can we bring MRP into the highly complex and volatile demand driven world?
Should we abandon MRP?
Page 9
All material and © copyright Demand Driven Institute 2012, all rights reservedDDMRP Intro9
Demand Driven Material Requirements PlanningStrategic Inventory
Positioning
1
Buffer Profiles and Levels
2
Dynamic Adjustments
3
Demand Driven Planning
4
Visible and Collaborative
Execution
5Modeling/Re-modeling the Environment Plan Execute
The Five Components of DDMRP
Page 10
All material and © copyright Demand Driven Institute 2012, all rights reservedDDMRP Intro10
Strategic Inventory Positioning
Where?(Position)
BEFOREHow Much?
(Quantity)When?
(Timing)
Strategic Inventory
Positioning
1
Buffer Profiles and Levels
2
Dynamic Adjustments
3
Demand Driven
Planning
4
Visible and Collaborative
Execution
5
Strategic Inventory
Positioning
1
Strategic Inventory
Positioning
1
Buffer Profiles and Levels
2
Buffer Profiles and Levels
2
Dynamic Adjustments
3
Dynamic Adjustments
3
Demand Driven
Planning
4
Demand Driven
Planning
4
Visible and Collaborative
Execution
5
Visible and Collaborative
Execution
5
Page 11
All material and © copyright Demand Driven Institute 2012, all rights reservedDDMRP Intro11
Answering “Where?”
6 Factors1. Customer Tolerance Time2. Market Potential Lead Time3. Supply and Demand Variability4. Inventory Flexibility and Matrix BOM5. Supply and Distribution Net Structure6. Critical Resource Considerations
Strategic Inventory
Positioning
1
Buffer Profiles and Levels
2
Dynamic Adjustments
3
Demand Driven
Planning
4
Visible and Collaborative
Execution
5
Strategic Inventory
Positioning
1
Strategic Inventory
Positioning
1
Buffer Profiles and Levels
2
Buffer Profiles and Levels
2
Dynamic Adjustments
3
Dynamic Adjustments
3
Demand Driven
Planning
4
Demand Driven
Planning
4
Visible and Collaborative
Execution
5
Visible and Collaborative
Execution
5
Page 12
All material and © copyright Demand Driven Institute 2012, all rights reservedDDMRP Intro12
Machine Assemble
Distribution Centers
Suppliers
Manufacturing
Lead Time and Variability
Page 13
All material and © copyright Demand Driven Institute 2012, all rights reservedDDMRP Intro13
Buffering Materials
Machine Assemble
Distribution Centers
Suppliers
No buffer necessary
Page 14
All material and © copyright Demand Driven Institute 2012, all rights reservedDDMRP Intro14
Mark Parts: New Lead Time Definition
ASR Lead Time = The longest unprotected sequence in the BOM
Matrix Bill of Material depicts relationships between ALL child and parent items
1H01
203 204
305 309P
403P 501P
304P
101
201 203 205
305 307P
403P 501P
301
408P 409
304P
501P
20H1
304
401P 305
403P 501P
20Z1
303
403P 417P
301
408P 305
403P 501P
Strategic Inventory
Positioning
1
Buffer Profiles and Levels
2
Dynamic Adjustments
3
Demand Driven
Planning
4
Visible and Collaborative
Execution
5
Strategic Inventory
Positioning
1
Strategic Inventory
Positioning
1
Buffer Profiles and Levels
2
Buffer Profiles and Levels
2
Dynamic Adjustments
3
Dynamic Adjustments
3
Demand Driven
Planning
4
Demand Driven
Planning
4
Visible and Collaborative
Execution
5
Visible and Collaborative
Execution
5
Problem: MRP uses overestimated (CLT) or underestimated (MLT) lead times for end items and subcomponents
Page 15
All material and © copyright Demand Driven Institute 2012, all rights reservedDDMRP Intro15
Buffering Intermediates
Machine Assemble
Distribution Centers
Suppliers
Page 16
All material and © copyright Demand Driven Institute 2012, all rights reservedDDMRP Intro16
Buffering End Items
Machine Assemble
Distribution Centers
Suppliers
Page 17
All material and © copyright Demand Driven Institute 2012, all rights reservedDDMRP Intro17
Buffering Distributed Items
Machine Aseemble
Distribution Centers
Suppliers
Page 18
All material and © copyright Demand Driven Institute 2012, all rights reservedDDMRP Intro18
Failure to properly position inventory is a huge source of waste for most manufacturing and supply
chain companies.
Position and PullStrategic Inventory
Positioning
1
Buffer Profiles and Levels
2
Dynamic Adjustments
3
Demand Driven
Planning
4
Visible and Collaborative
Execution
5
Strategic Inventory
Positioning
1
Strategic Inventory
Positioning
1
Buffer Profiles and Levels
2
Buffer Profiles and Levels
2
Dynamic Adjustments
3
Dynamic Adjustments
3
Demand Driven
Planning
4
Demand Driven
Planning
4
Visible and Collaborative
Execution
5
Visible and Collaborative
Execution
5
Page 19
All material and © copyright Demand Driven Institute 2012, all rights reservedDDMRP Intro19
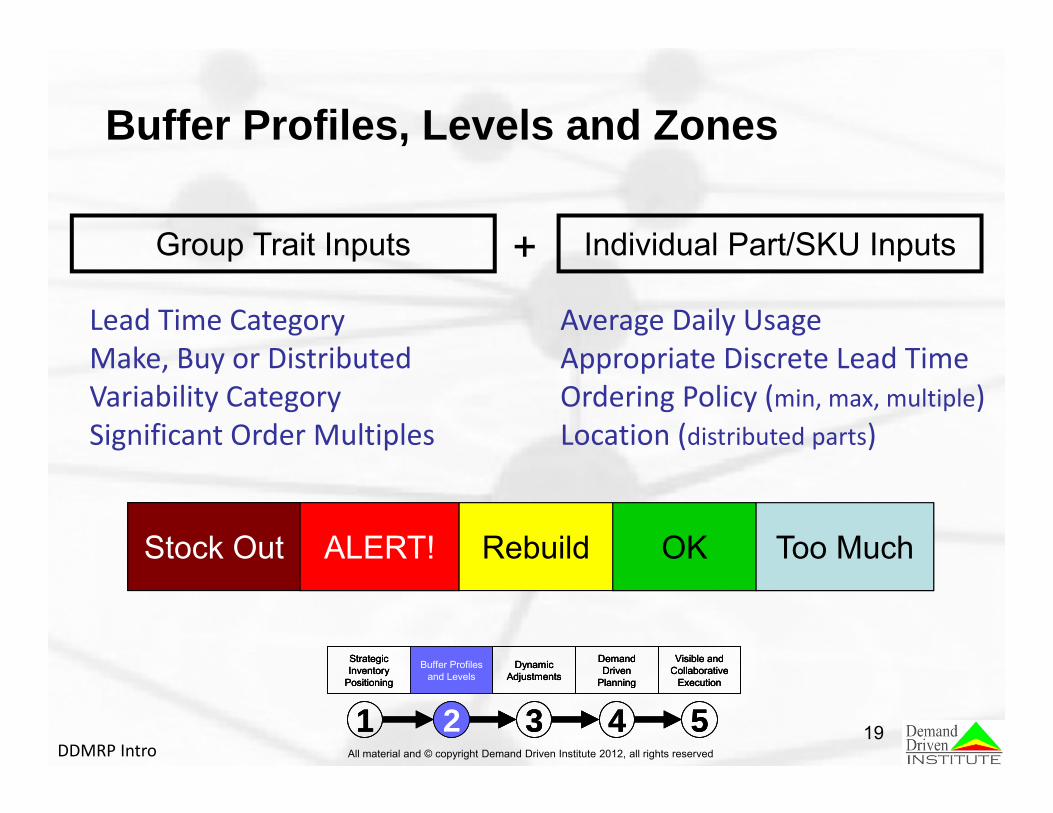
Buffer Profiles, Levels and Zones
Group Trait Inputs
Lead Time CategoryMake, Buy or DistributedVariability CategorySignificant Order Multiples
Individual Part/SKU Inputs
Average Daily UsageAppropriate Discrete Lead TimeOrdering Policy (min, max, multiple)Location (distributed parts)
+
ALERT! Rebuild OK Too MuchStock OutStock Out ALERT! Rebuild OK Too Much
Strategic Inventory
Positioning
1
Buffer Profiles and Levels
2
Dynamic Adjustments
3
Demand Driven
Planning
4
Visible and Collaborative
Execution
5
Strategic Inventory
Positioning
1
Strategic Inventory
Positioning
1
Buffer Profiles and Levels
2
Buffer Profiles and Levels
2
Dynamic Adjustments
3
Dynamic Adjustments
3
Demand Driven
Planning
4
Demand Driven
Planning
4
Visible and Collaborative
Execution
5
Visible and Collaborative
Execution
5
Page 20
All material and © copyright Demand Driven Institute 2012, all rights reservedDDMRP Intro20
Component 3: Dynamic AdjustmentsDynamic Buffer Adjustment
Ava
ilabl
e St
ock
Posi
tion
Aver
age
Dai
ly U
sage
100
200
300
400500
600
700
800
900
1000
10
20
30
4050
60
70
80
90
100Dynamic Buffer Adjustment
Ava
ilabl
e St
ock
Posi
tion
Aver
age
Dai
ly U
sage
100
200
300
400500
600
700
800
900
1000
100
200
300
400500
600
700
800
900
1000
10
20
30
4050
60
70
80
90
100
10
20
30
4050
60
70
80
90
100
100
200
300
400500
600
700
800
900
1000
100
200
300
400500
600
700
800
900
1000
10
20
30
4050
60
70
80
90
100
10
20
30
4050
60
70
80
90
100
Ave
rage
Dai
ly U
sage
Zone
Lev
els
Aver
age
Dai
ly U
sage
Zone
Lev
els
100
200
300
400500
600
700
800
900
1000
100
200
300
400500
600
700
800
900
1000
10
20
30
4050
60
70
80
90
100
10
20
30
4050
60
70
80
90
100
▲Effectivity Date
Zone
Lev
els
100
200
300
400500
600
700
800
900
1000
100
200
300
400500
600
700
800
900
1000
10
20
30
4050
60
70
80
90
100
10
20
30
4050
60
70
80
90
100
Ave
rage
Dai
ly U
sage
▲Effectivity Date
Seasonality Ramp Up Ramp Down
Recalculated Adjustment
Planned Adjustments
Strategic Inventory
Positioning
1
Buffer Profiles and Levels
2
Dynamic Adjustments
3
Demand Driven
Planning
4
Visible and Collaborative
Execution
5
Strategic Inventory
Positioning
1
Strategic Inventory
Positioning
1
Buffer Profiles and Levels
2
Buffer Profiles and Levels
2
Dynamic Adjustments
3
Dynamic Adjustments
3
Demand Driven
Planning
4
Demand Driven
Planning
4
Visible and Collaborative
Execution
5
Visible and Collaborative
Execution
5
Page 21
All material and © copyright Demand Driven Institute 2012, all rights reservedDDMRP Intro21
Demand Driven Planning
10,000
5,000
Part Open Supply
On-hand Demand Available Stock
Recommended Supply Qty
Action
r457 5453 4012 1200 8265 0 No Action
f576 3358 4054 540 6872 3128 Place New Order
h654 530 3721 213 4038 2162 Place New Order
r672 2743 1732 623 3852 0 Expedite Open Supply (Execution)
Order Spike Horizon
Supply generation is based what zone the available stock equationplaces the partAvailable stock = on-hand + on-order – demand (past due, due today and qualified spikes)
Strategic Inventory
Positioning
1
Buffer Profiles and Levels
2
Dynamic Adjustments
3
Demand Driven
Planning
4
Visible and Collaborative
Execution
5
Strategic Inventory
Positioning
1
Strategic Inventory
Positioning
1
Buffer Profiles and Levels
2
Buffer Profiles and Levels
2
Dynamic Adjustments
3
Dynamic Adjustments
3
Demand Driven
Planning
4
Demand Driven
Planning
4
Visible and Collaborative
Execution
5
Visible and Collaborative
Execution
5
Page 22
All material and © copyright Demand Driven Institute 2012, all rights reservedDDMRP Intro22
DDMRP Planning Simulation
Page 23
All material and © copyright Demand Driven Institute 2012, all rights reservedDDMRP Intro23
Highly Visible & Collaborative ExecutionProblem: Priority by DUE DATE
Strategic Inventory
Positioning
1
Buffer Profiles and Levels
2
Dynamic Adjustments
3
Demand Driven
Planning
4
Visible and Collaborative
Execution
5
Strategic Inventory
Positioning
1
Strategic Inventory
Positioning
1
Buffer Profiles and Levels
2
Buffer Profiles and Levels
2
Dynamic Adjustments
3
Dynamic Adjustments
3
Demand Driven
Planning
4
Demand Driven
Planning
4
Visible and Collaborative
Execution
5
Visible and Collaborative
Execution
5
Order # Order Type Due Date CustomerMO 12367 Stock 5/12/2011 InternalMO 12379 MTO 5/12/2011 Super TechMO 12465 Stock 5/12/2011 InternalMO 12401 Stock 5/14/2011 InternalMO 12411 Stock 5/16/2011 Internal
Priority 1:Priority 2:Priority 3:Priority 4:Priority 5:
Would you rather have your suppliers never stock you out or be 100% on time?
Order # Order Type Due Date CustomerMO 12367 Stock Due NOW InternalMO 12379 MTO 5/12/2011 Super TechMO 12465 Stock Due NOW InternalMO 12401 Stock Due NOW InternalMO 12411 Stock Due NOW Internal
Page 24
All material and © copyright Demand Driven Institute 2012, all rights reservedDDMRP Intro24
Highly Visible & Collaborative ExecutionSolution: Priority by Buffer Status
Order # OH Buffer Status Order Type Due Date CustomerMO 12379 MTO 5/12/2011 Super TechMO 12401 12% (RED) Stock 5/14/2011 InternalMO 12465 27% (RED) Stock 5/12/2011 InternalMO 12367 33% (YELLOW) Stock 5/12/2011 InternalMO 12411 41% (YELLOW) Stock 5/16/2011 Internal
Order # OH Buffer Status Order Type Due Date CustomerMO 12379 MTO 5/12/2011 Super TechMO 12401 12% (RED) Stock Due NOW InternalMO 12465 27% (RED) Stock Due NOW InternalMO 12367 33% (YELLOW) Stock Due NOW InternalMO 12411 41% (YELLOW) Stock Due NOW Internal
Priority 1:Priority 2:Priority 3:Priority 4:Priority 5:
Strategic Inventory
Positioning
1
Buffer Profiles and Levels
2
Dynamic Adjustments
3
Demand Driven
Planning
4
Visible and Collaborative
Execution
5
Strategic Inventory
Positioning
1
Strategic Inventory
Positioning
1
Buffer Profiles and Levels
2
Buffer Profiles and Levels
2
Dynamic Adjustments
3
Dynamic Adjustments
3
Demand Driven
Planning
4
Demand Driven
Planning
4
Visible and Collaborative
Execution
5
Visible and Collaborative
Execution
5
Page 25
All material and © copyright Demand Driven Institute 2012, all rights reservedDDMRP Intro25
What Execution Looks Like
FPA
SACICAPPI
PPJ
PPF
SAA
PPE
PPG
PPH
PPB
SAEPPC ICD
ICB
PPA
SAF
SADICCSAB
PPD
Bill of Materials
FPA
FPA
FPA
Region 1
Region 2
Region 3
Supplier 1
Supplier 2
Supplier 3
PPA
PPJ
PPG
PPH
PPF
PPE
PPB
PPD
PPC
PPI
Purchased Parts List
Med 41%05/12/09PO 276-54
Med 39%05/12/09PO 891-84
Critical 13%05/12/09PO 820-89
Buffer StatusDue DateOrder #
Purchased Items
Med 36%Region 3FPA
Med 41%Region 2FPA
Critical 11%Region 1FPA
Buffer StatusLocationItem #
Distributed ItemsManufactured Items
Med 34%ICB05/22/09WO 211-72
Critical 17%SAD05/22/09WO 832-41
Critical 13%FPA05/24/09WO 819-87
Buffer StatusItem #Due DateOrder #
Page 26
All material and © copyright Demand Driven Institute 2012, all rights reservedDDMRP Intro26
The Power of DDMRP
Effective
Ineffective
Amount of inventory
Stock-outs, back orders, missed sales
Too much, cash, capacity and
space tied up in inventory
ALERT! Rebuild OK Too MuchStock Out
Page 27
All material and © copyright Demand Driven Institute 2012, all rights reservedDDMRP Intro27
How is this Different Than Safety Stock?
A supplementary inventory position designed to make up for misalignments between planned orders, actual demand and supply orders
Are strategic and primary inventory position designed to decouple areas in order to compress lead times and dampen variability
Safety Stock Replenishment
Safety Stock =
Page 28
All material and © copyright Demand Driven Institute 2012, all rights reservedDDMRP Intro28
Safety Stock
Open Supply
On-Hand
Green
Red
Yellow
Only this can be dynamic (typically not)
The entire buffer flexes
Directly related to planned orders
Independent of planned orders
Independent of planned orders(no forecast)►avg on hand◄
Supply order signals based directly on the composition of the buffer and typical the size of the green zone
Resupply signal
This picture represents a snapshot of a safety stock position. It looks to have a similar composition as the Replenishment buffer, but…
When on-hand goes below safety stock a supply order is LAUNCHED and EXPEDITED
When on-hand goes below red an EXISTING supply order is EXPEDITED
▲▲
Re: PLANNING EQUATION
Page 29
All material and © copyright Demand Driven Institute 2012, all rights reservedDDMRP Intro29
Replenishment Buffers are Firewalls on both sides
Cumulative Supply Variability
Supplier of Stock Consumer of stock
Cumulative Demand Variability
Reliable AvailabilityAggregated and Steadier Supply Requirements
Green
Yellow
Red
Compressed Lead Time
The win for suppliers The win for consumers
Safety Stock is designed to protect only one side of the equation and may even exacerbate variability.
Re: VARIABILITY ABSORPTION
Page 30
All material and © copyright Demand Driven Institute 2012, all rights reservedDDMRP Intro30
SafetyStock
Supplier Manufacturer
Supplier Consumer
Demand Signals
Supply
Actual Orders/ Consumption
Supply
Lead Time
Lead Time
Forecasted Order
Safety Stock Order
Lead Time
Aggregated Supply Order Signal Based On Actual Consumption and Order Spikes
Safety Stock
Replenishment
Supply
Re: LEAD TIME COMPRESSION
Page 31
All material and © copyright Demand Driven Institute 2012, all rights reservedDDMRP Intro31
DCSupplier Mfg Finished Stock
Raw Stock
IntermediateStock Mfg
Dampened Variability
Compressed Lead Times
Safety Stock
Open Supply
On-Hand
Safety Stock
Open Supply
On-Hand
Safety Stock
Open Supply
On-Hand
Un-Compressed Lead Times
Partially Dampened Variability Safety Stock
DDMRPRe: LEAD TIME IMPACTS
Page 32
All material and © copyright Demand Driven Institute 2012, all rights reservedDDMRP Intro32
Some DDMRP Early Adopters
Page 33
All material and © copyright Demand Driven Institute 2012, all rights reservedDDMRP Intro33
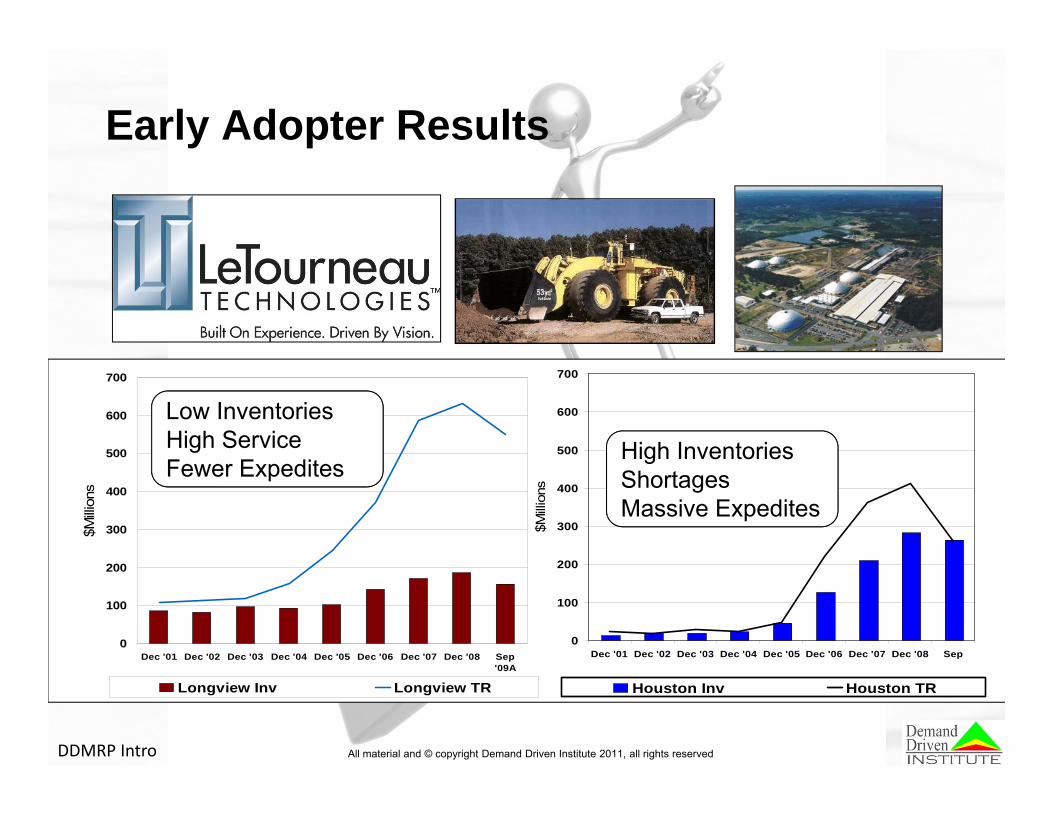
Early Adopter Results
MRP
DDMRP
All material and © copyright Demand Driven Institute 2011, all rights reserved
Page 34
All material and © copyright Demand Driven Institute 2012, all rights reservedDDMRP Intro34
Early Adopter Results
Stock-outs reduced by over 66%!
0
100
200
300
400
500
600
700
Dec '01 Dec '02 Dec '03 Dec '04 Dec '05 Dec '06 Dec '07 Dec '08 Sep'09A
$Milli
ons
Longview Inv Longview TR
0
100
200
300
400
500
600
700
Dec '01 Dec '02 Dec '03 Dec '04 Dec '05 Dec '06 Dec '07 Dec '08 Sep
$Milli
ons
Houston Inv Houston TR
High InventoriesShortagesMassive Expedites
Low InventoriesHigh ServiceFewer Expedites
All material and © copyright Demand Driven Institute 2011, all rights reserved
Page 35
All material and © copyright Demand Driven Institute 2012, all rights reservedDDMRP Intro35
C
SteelProducts
ComponentSupply (H/L)
OffshoreProducts
MiningProducts
C
C
Suppliers
DrillingSystems
ForestryProducts
C
C
Synchronization and Flow Challenge
C = Customer= Remote Location
Supply Variability
Distortions & amplification in
demand requirements reverberate backward
Demand / Information Variability
End Item Assembly inherits the amplifying upstream variability.
Lead Time before DDMRP
Page 36
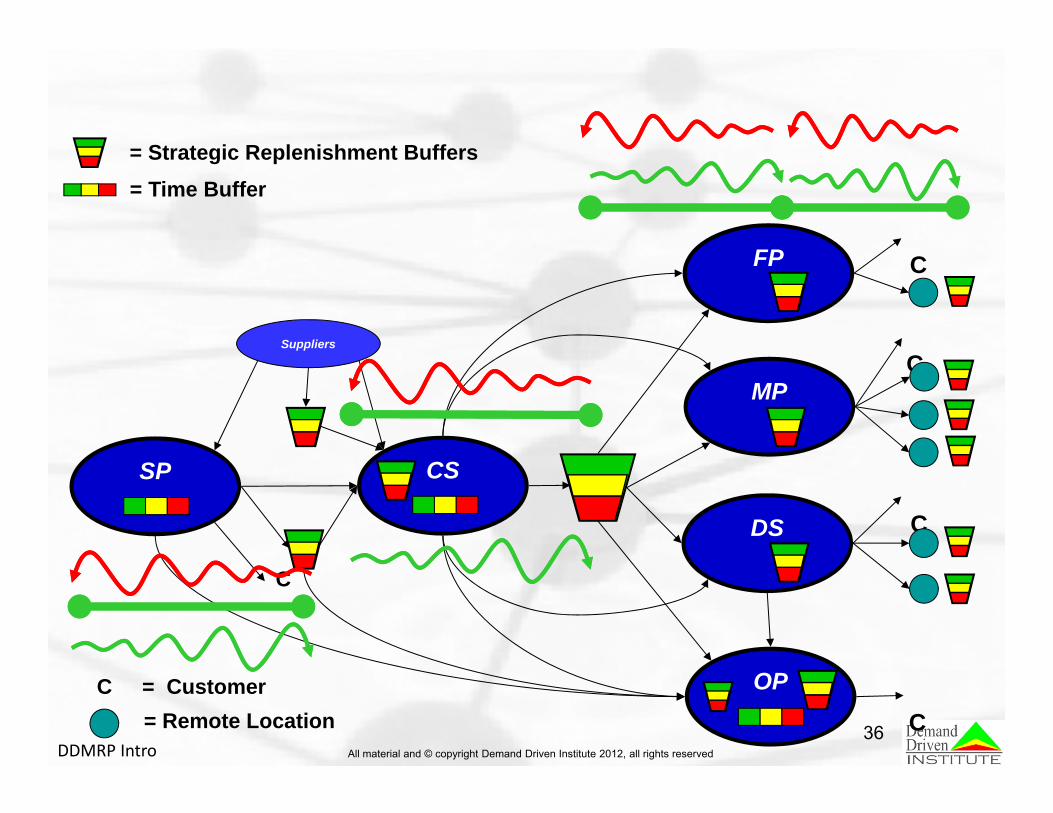
All material and © copyright Demand Driven Institute 2012, all rights reservedDDMRP Intro36 C
SP CS
OP
MPC
C
Suppliers
C = Customer
DS
FP
C
C
= Remote Location
= Time Buffer= Strategic Replenishment Buffers
Page 37
All material and © copyright Demand Driven Institute 2012, all rights reservedDDMRP Intro37
Immediate Results for Materials - FMCG
$-
$200,000
$400,000
$600,000
$800,000
$1,000,000
$1,200,000
$1,400,000
$1,600,000
21-N
ov23
-Nov
25-N
ov29
-Nov
1-D
ec5-
Dec
7-D
ec9-
Dec
13-D
ec15
-Dec
2-Ja
n4-
Jan
6-Ja
n10
-Jan
12-J
an
5-Over ToG 4-Low 3-Medium
300 Materials are buffered without increase in RPW inventory. Lead-times de-coupled
Dampened the bull whip, now operating more effectively, and inventory optimized
Before
After
Replenishment lead time has been reduced 82% to 9 days from 50 days,
becoming Responsive
Page 38
All material and © copyright Demand Driven Institute 2012, all rights reservedDDMRP Intro38
Early Adopter Results
Mountain House Division:• Sales increased 20%• Customer Fill Rate improved from
79% to 99.6%• 60% reduction in inventory
Industrial Ingredient Division:• 60% reduction in make to order
lead time• 100% On-Time-Delivery• 20% reduction in inventory
Raw MaterialNo out of stock
Reduced inventory $2.5M+
All material and © copyright Demand Driven Institute 2011, all rights reserved
Page 39
All material and © copyright Demand Driven Institute 2012, all rights reservedDDMRP Intro39
DDMRP – Tube Forgings of America
“Using this method, we have REDUCED inventory and decreased WIP, while increasing serviceability to customers.”
“Inventory planning adjusts quickly and smoothly, with very visible and easy to understand signals.”
“We have been VERY successful during the recent economic crisis.”
60% of items are make to stock
Supplier lead times are 4-6 months for strategic items
Customers expect shipment of product in 1-3 days
“Our customers have learned to rely on our delivery promises, therefore allowing THEM to change their buying habits, switching to order less more often.”
Tube Forgings of America, Inc. (TFA) has been manufacturing welding fittings since 1955. TFA’s customer base varies from oil refining to chemical and petro-chemical processing, from gas transmission to power generation, including nuclear, and from shipbuilding to a broad assortment of commercial construction applications. Tube Forgings of America is a mid-range closely held manufacturing enterprise.
Page 40
All material and © copyright Demand Driven Institute 2012, all rights reservedDDMRP Intro40
Summary
FLOW
Sales Orders
Decoupling Points
Lead Time
Order Minimums
Lower Inventory
High Service
Fundamental Principal
Fundamental Planning Changes
New Operational Equation Elements and Emphasis
Bottom Line Benefits Without Tradeoffs
DDMRP
Fewer Expedites
Buffer Status
ROCE