28
THE FREAKONOMICS OF PLANT PROTECTION Paul D. Mitchell Agricultural and Applied Economics University of Wisconsin, Madison, WI, USA 2011 APS-IPPC Joint Meeting Honolulu, HI August 7, 2011

THE FREAKONOMICS OF PLANT PROTECTIONPaul D. MitchellAgricultural and Applied EconomicsUniversity of Wisconsin, Madison, WI, USA
2011 APS-IPPC Joint MeetingHonolulu, HI August 7, 2011
FreakonomicsIncentives and Unintended Consequences• Freakonomics presents examples of the “Law of Unintended Consequences” in everyday life, usually with the point being that people respond to incentives in the systems/institutions we create• Sumo wrestlers, school teachers, real estate agents• These lessons apply to agriculture and plant protection
• This special session reviews some examples• Stories for your teaching and/or extension!
• This talk provides examples from economics, with some historical context
Quick Overview• Cornerstones of Freakonomics• 1) Conventional wisdom is often wrong• 2) Experts use their information to their own advantage• 3) Dramatic effects often have distant even subtle causes• Jevon’s Paradox
• Impact of more efficient input technology on input use• Cochrane’s Treadmill
• Impact of more productive output technology on producer profit
• Adverse Selection and Moral Hazard• Crop consultants and IPM
Jevon’s Paradox• Concern about a resource becoming scarce
• Modern examples: energy and water• Development of a new, more input efficient technology
• LED Lights, LEPA (Low Energy Precise Application) Irrigation
• Should reduce use of the resource, right?
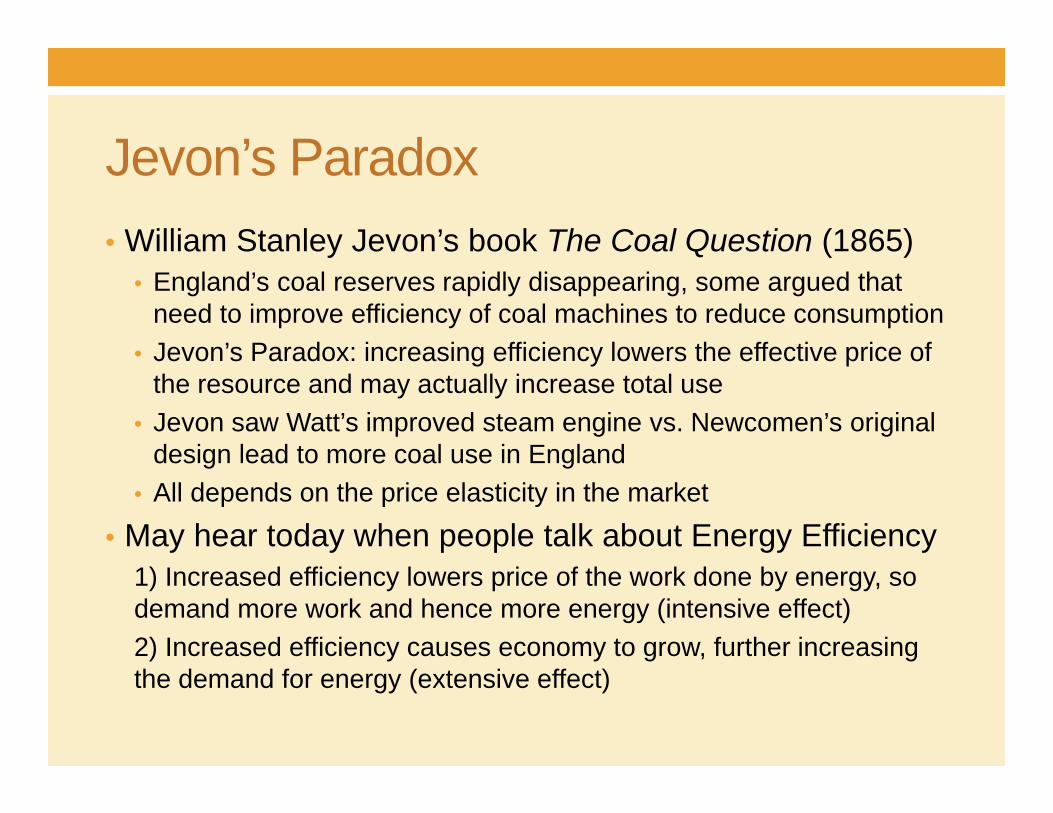
Jevon’s Paradox• William Stanley Jevon’s book The Coal Question (1865)
• England’s coal reserves rapidly disappearing, some argued that need to improve efficiency of coal machines to reduce consumption
• Jevon’s Paradox: increasing efficiency lowers the effective price of the resource and may actually increase total use
• Jevon saw Watt’s improved steam engine vs. Newcomen’s original design lead to more coal use in England
• All depends on the price elasticity in the market
• May hear today when people talk about Energy Efficiency1) Increased efficiency lowers price of the work done by energy, so demand more work and hence more energy (intensive effect)2) Increased efficiency causes economy to grow, further increasing the demand for energy (extensive effect)
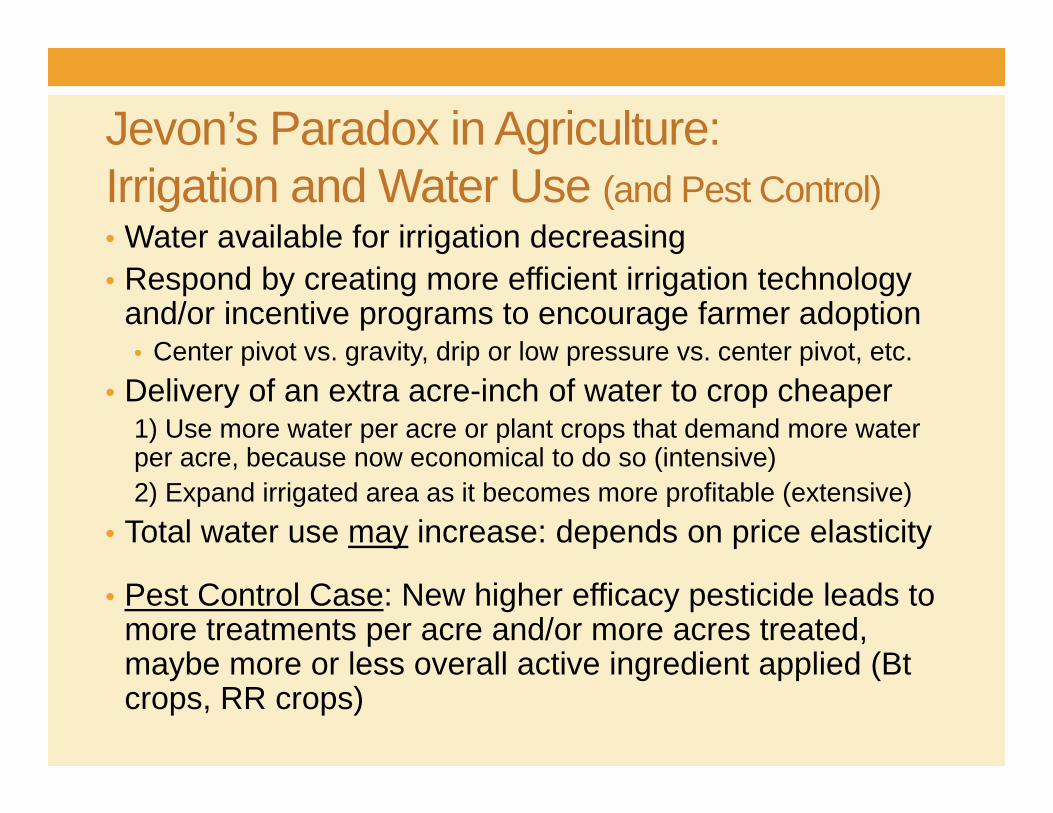
Jevon’s Paradox in Agriculture:Irrigation and Water Use (and Pest Control)• Water available for irrigation decreasing• Respond by creating more efficient irrigation technology
and/or incentive programs to encourage farmer adoption• Center pivot vs. gravity, drip or low pressure vs. center pivot, etc.
• Delivery of an extra acre-inch of water to crop cheaper1) Use more water per acre or plant crops that demand more water per acre, because now economical to do so (intensive)2) Expand irrigated area as it becomes more profitable (extensive)
• Total water use may increase: depends on price elasticity
• Pest Control Case: New higher efficacy pesticide leads to more treatments per acre and/or more acres treated, maybe more or less overall active ingredient applied (Btcrops, RR crops)

Effect of Input Efficiency Improvement on Resource Use• Which effect dominates? • Use less because more efficient technology• Use more because of Intensive and Extensive Effects• Depends on price elasticity in market for effective input• Price elasticity measures how responsive the quantity
demanded is to price changes (%Q/%P)• Determined largely by the slope of the demand curve
• 50% increase in efficiency means 50% price drop, how much does quantity demanded change?• > 50% = Jevon’s paradox occurs• < 50% = Jevon’s Paradox Fails
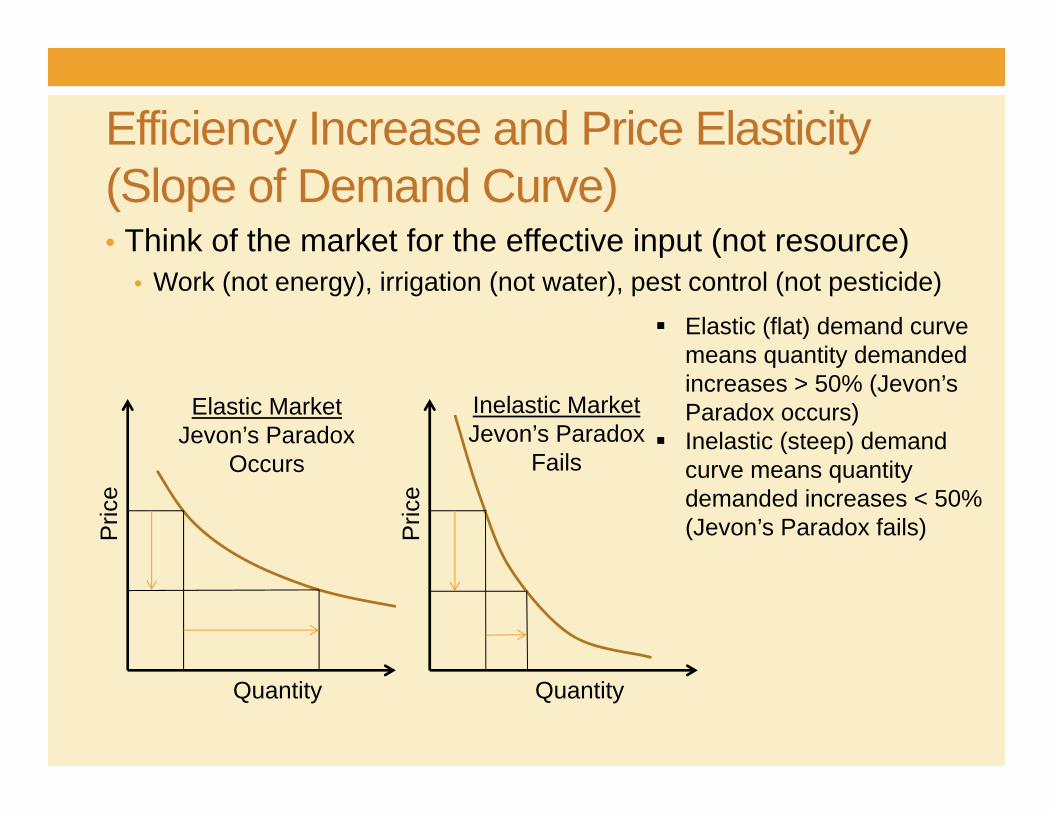
Efficiency Increase and Price Elasticity (Slope of Demand Curve)• Think of the market for the effective input (not resource)
• Work (not energy), irrigation (not water), pest control (not pesticide)
Pric
e
Quantity
Pric
e
Quantity
Elastic (flat) demand curve means quantity demanded increases > 50% (Jevon’sParadox occurs)
Inelastic (steep) demand curve means quantity demanded increases < 50% (Jevon’s Paradox fails)
Elastic MarketJevon’s Paradox
Occurs
Inelastic MarketJevon’s Paradox
Fails
Cochrane’s Treadmill• New technology increases output productivity• Producers adopt the new technology
• More output for same level of input use or lower cost to produce same output
• Think crop yield increases
• Producers should make more money, right?
Cochrane’s Treadmill(Willard Cochrane, Ag Economist, U of MN)• Producers adopt the new technology and make more
money by selling extra output• Problem: price effects offset some, or possibly all, of the
benefits to producers, can even make producers worse off• Supply increase causes output price decrease• How much price falls is driven by price elasticity in output
market (slope of demand curve)• Steep (elastic) demand means large price drop
(Cochrane's Treadmill occurs)• Flat (inelastic) demand means small price drop
• Consumers always win with new technology: lower prices
New Technology and Cochrane’s Treadmill
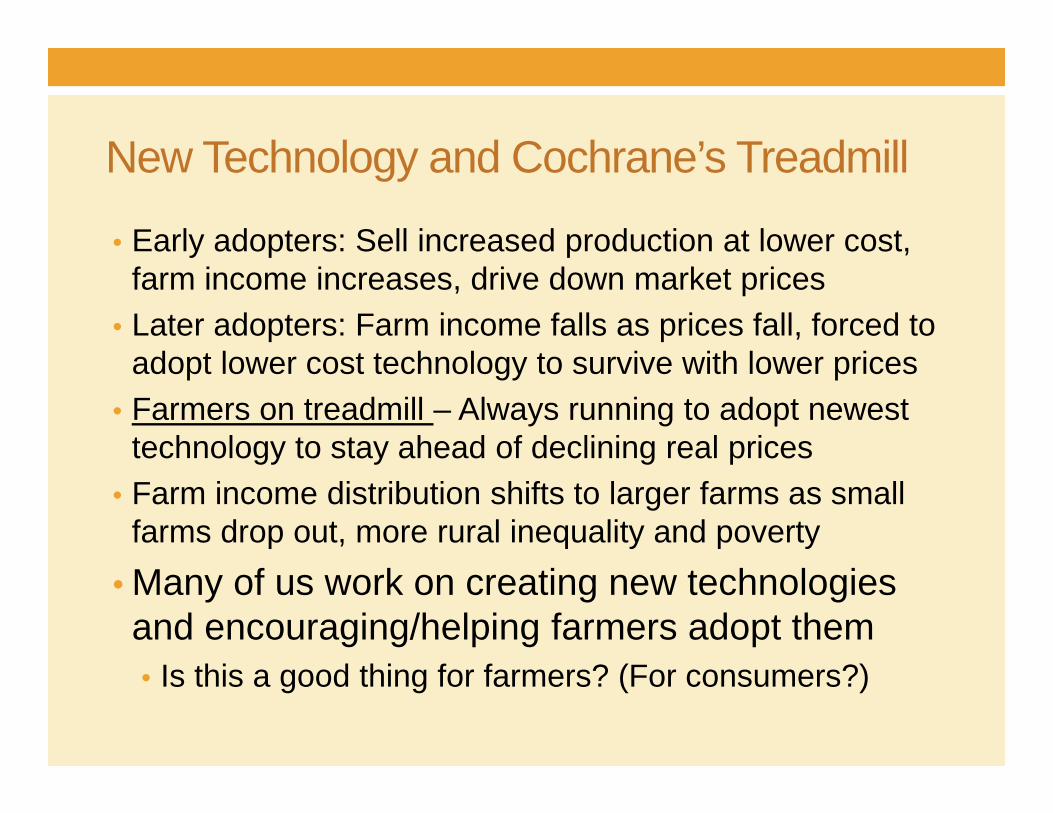
• Early adopters: Sell increased production at lower cost, farm income increases, drive down market prices
• Later adopters: Farm income falls as prices fall, forced to adopt lower cost technology to survive with lower prices
• Farmers on treadmill – Always running to adopt newest technology to stay ahead of declining real prices
• Farm income distribution shifts to larger farms as small farms drop out, more rural inequality and poverty
• Many of us work on creating new technologies and encouraging/helping farmers adopt them• Is this a good thing for farmers? (For consumers?)
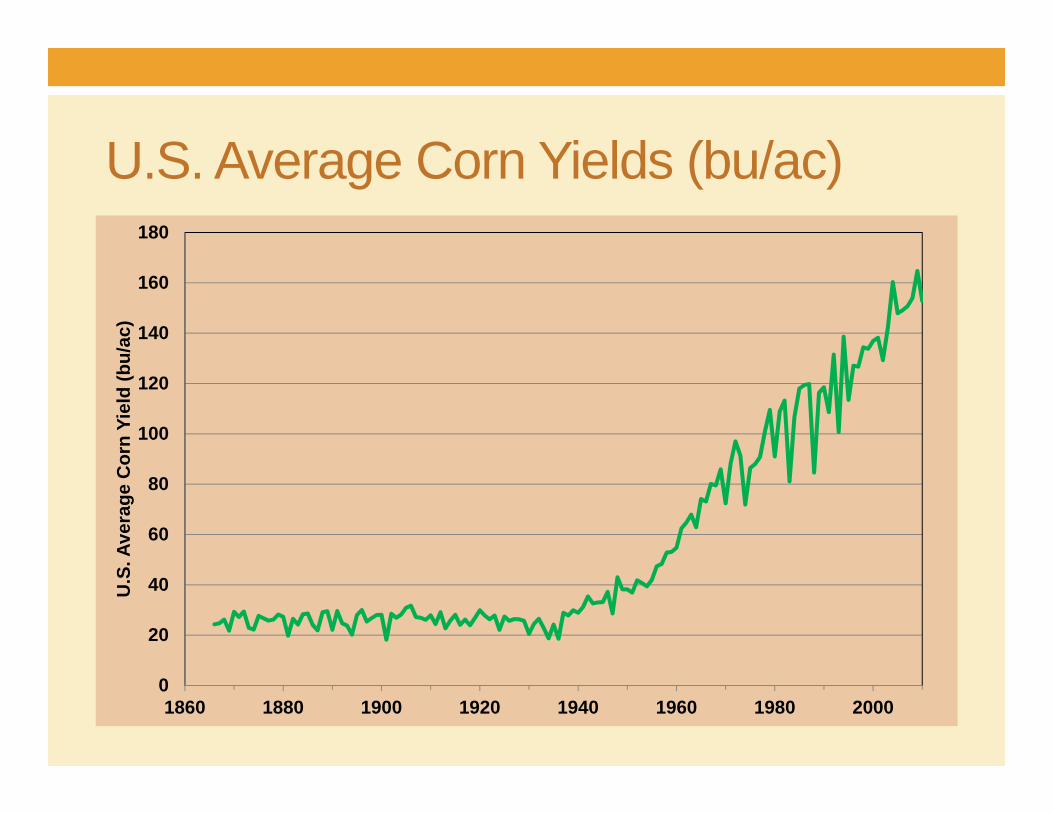
U.S. Average Corn Yields (bu/ac)
0
20
40
60
80
100
120
140
160
180
1860 1880 1900 1920 1940 1960 1980 2000
U.S
. Ave
rage
Cor
n Yi
eld
(bu/
ac)
Technology Change and Consumer Demand
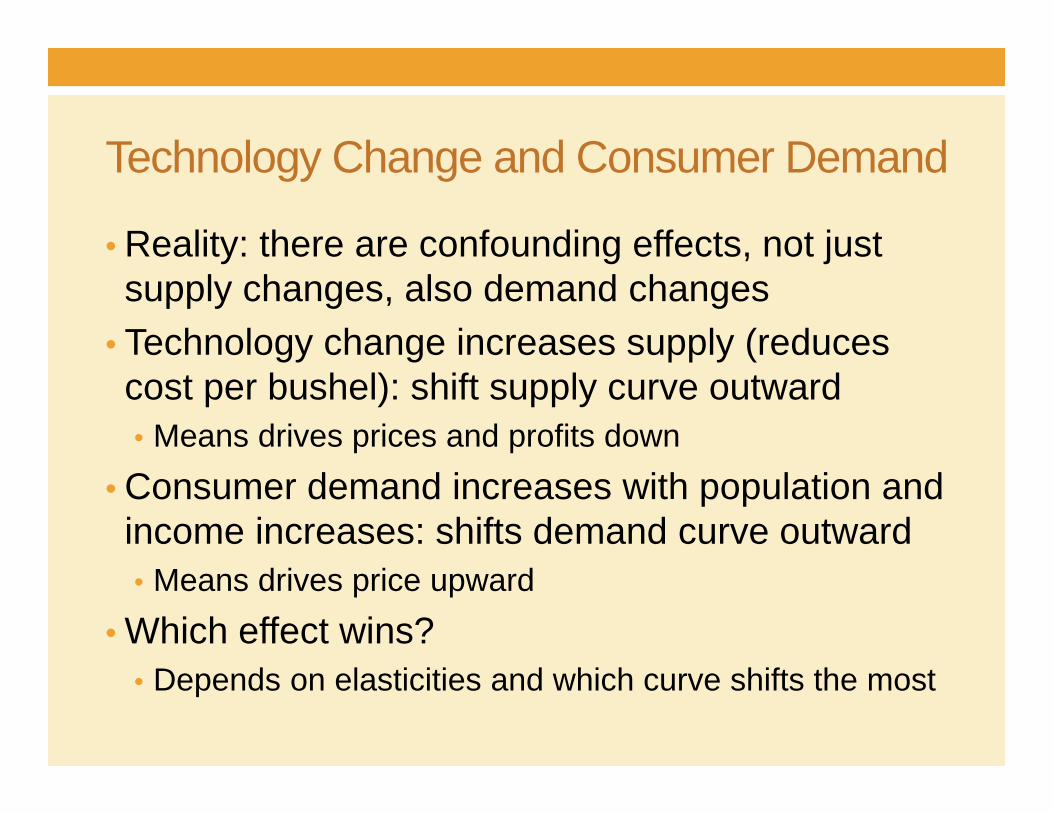
• Reality: there are confounding effects, not just supply changes, also demand changes
• Technology change increases supply (reduces cost per bushel): shift supply curve outward• Means drives prices and profits down
• Consumer demand increases with population and income increases: shifts demand curve outward• Means drives price upward
• Which effect wins? • Depends on elasticities and which curve shifts the most
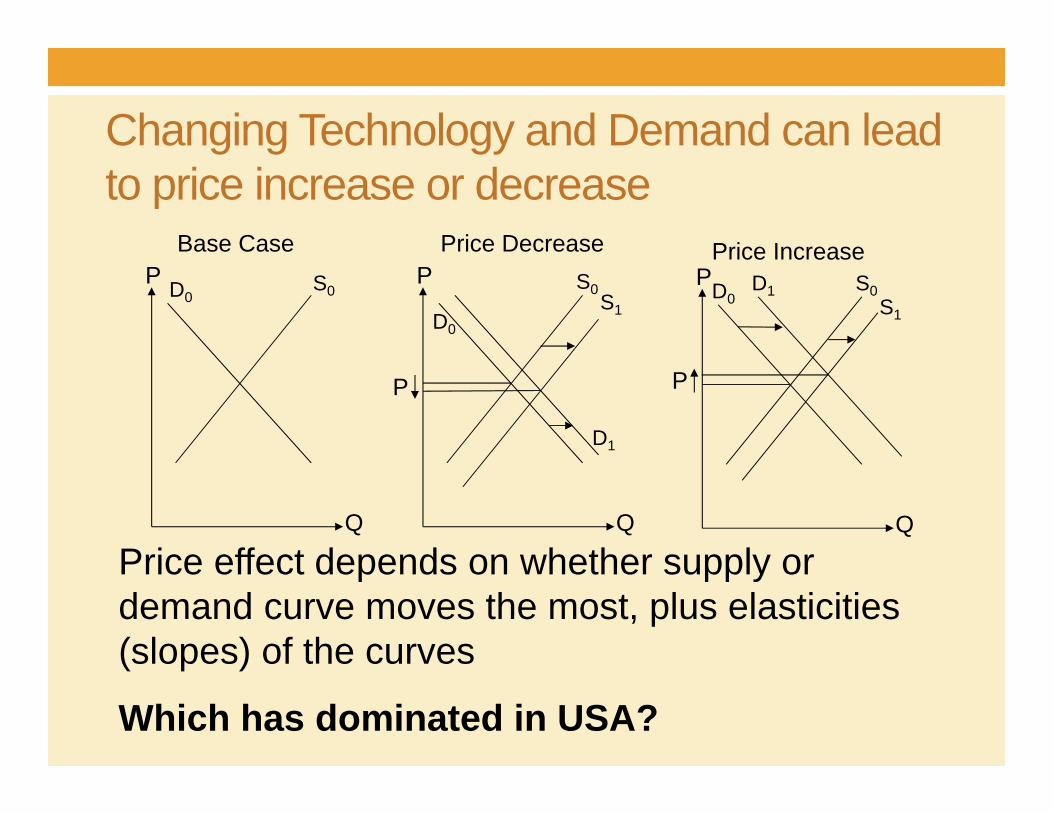
Changing Technology and Demand can lead to price increase or decrease
S0S1D0
D1
P
Q
PS0D0P
Q
P
Q
PS1
S0D0D1
Base Case Price Decrease Price Increase
Price effect depends on whether supply or demand curve moves the most, plus elasticities(slopes) of the curves
Which has dominated in USA?
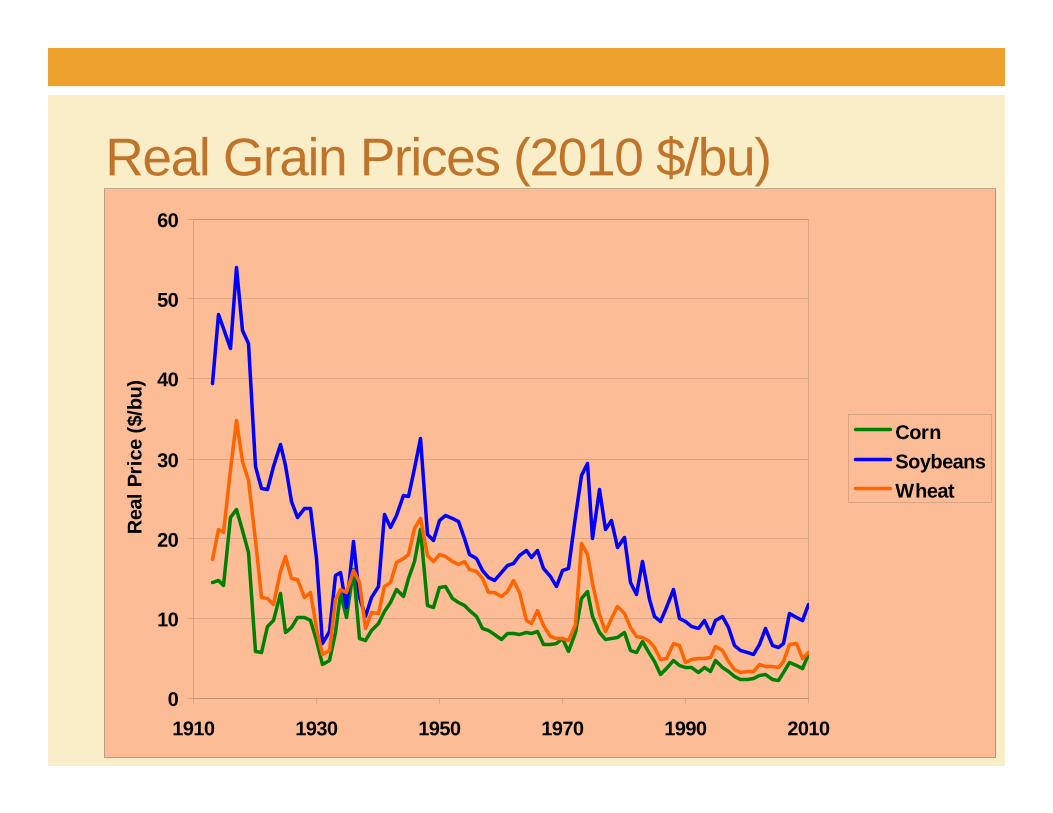
Real Grain Prices (2010 $/bu)
0
10
20
30
40
50
60
1910 1930 1950 1970 1990 2010
Rea
l Pri
ce ($
/bu)
CornSoybeansWheat
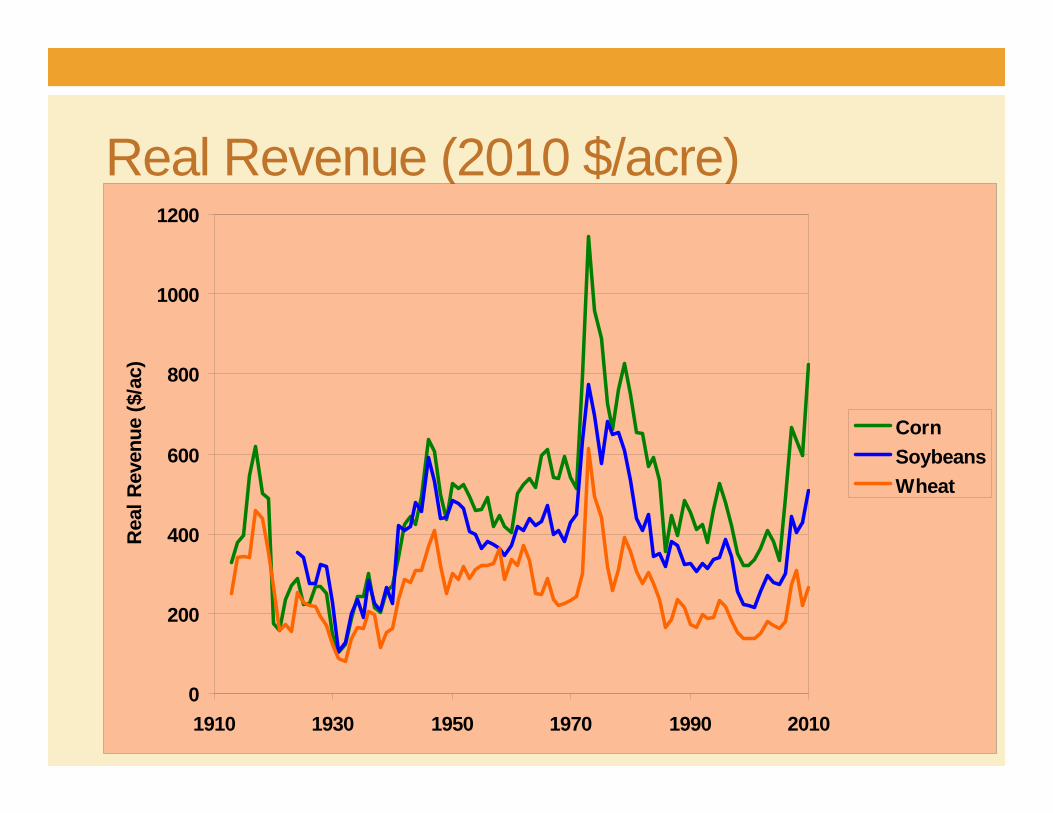
Real Revenue (2010 $/acre)
0
200
400
600
800
1000
1200
1910 1930 1950 1970 1990 2010
Rea
l Rev
enue
($/a
c)
CornSoybeansWheat
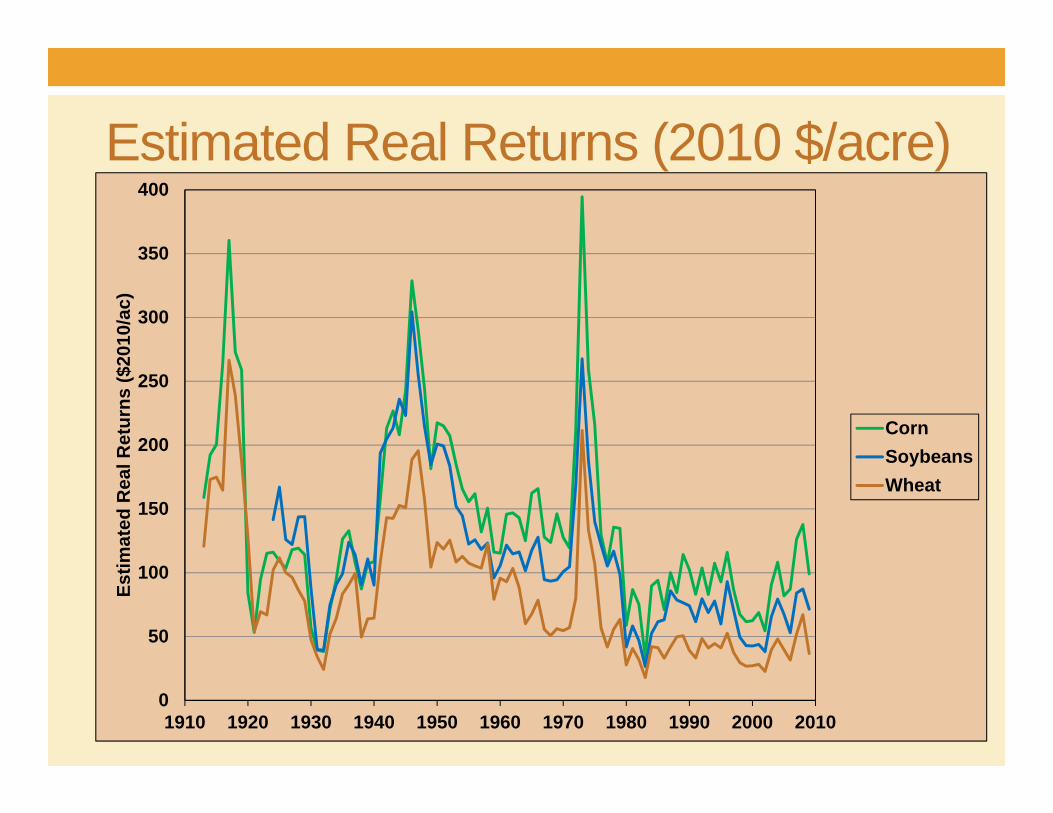
Estimated Real Returns (2010 $/acre)
0
50
100
150
200
250
300
350
400
1910 1920 1930 1940 1950 1960 1970 1980 1990 2000 2010
Estim
ated
Rea
l Ret
urns
($20
10/a
c)
CornSoybeansWheat
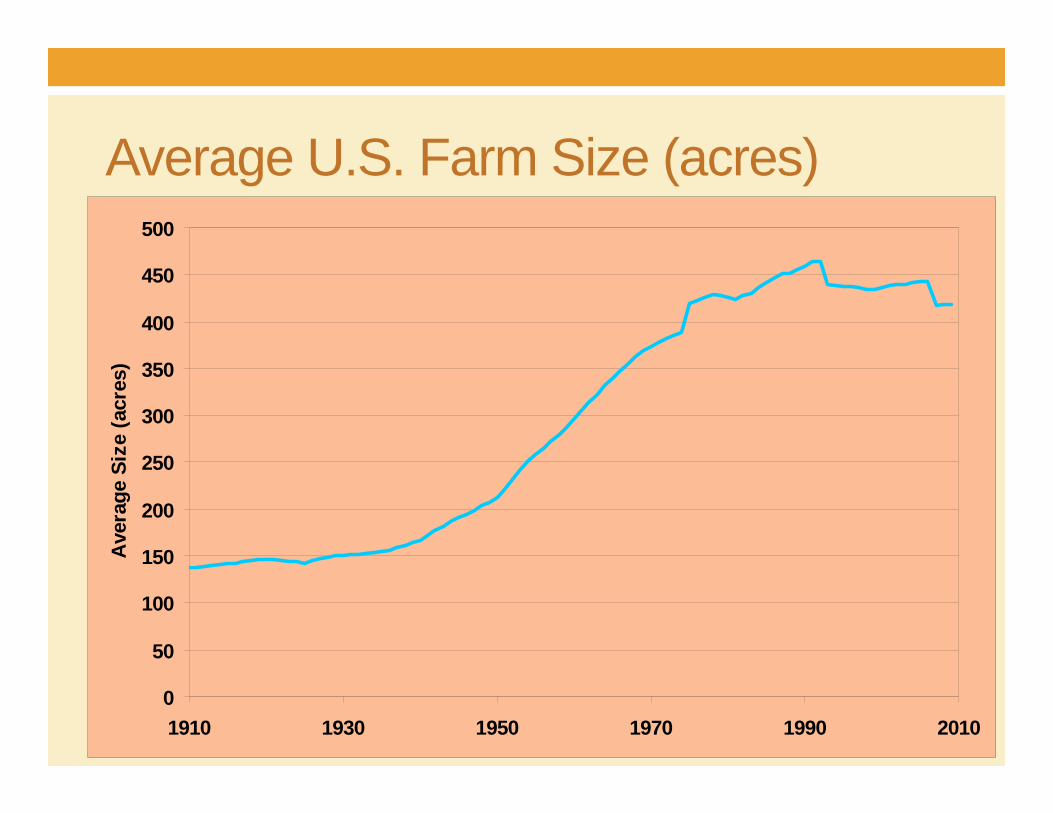
Average U.S. Farm Size (acres)
0
50
100
150
200
250
300
350
400
450
500
1910 1930 1950 1970 1990 2010
Ave
rage
Siz
e (a
cres
)
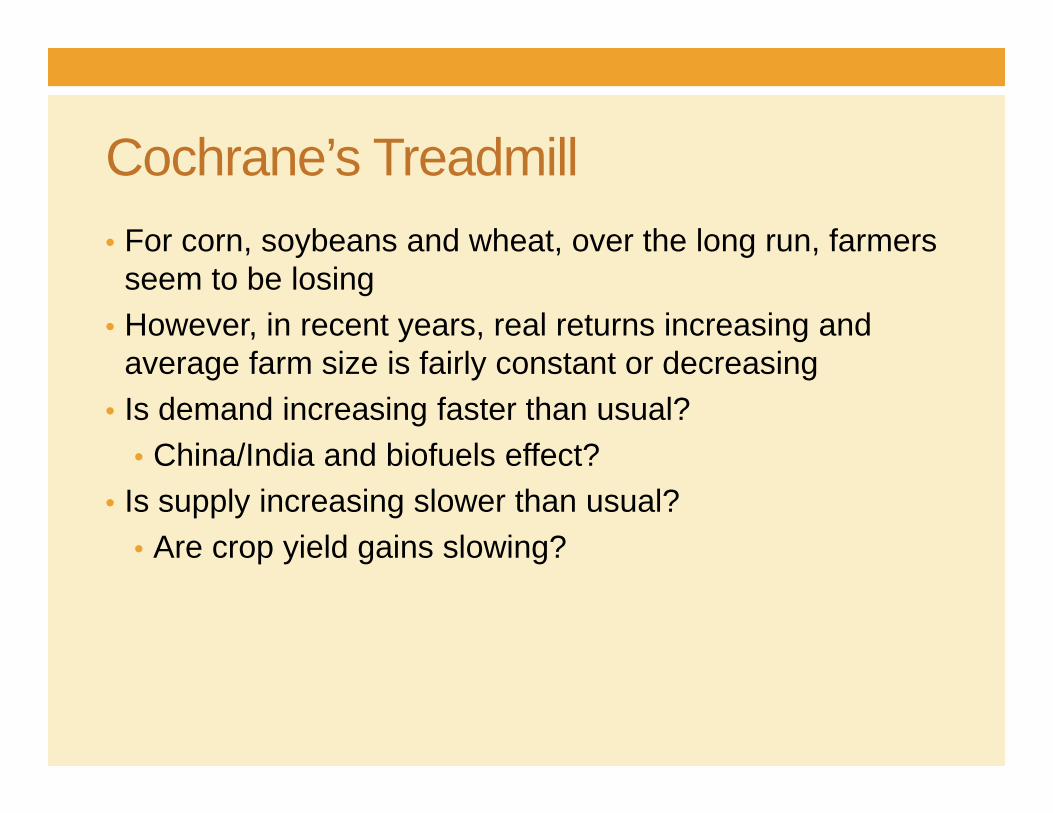
Cochrane’s Treadmill• For corn, soybeans and wheat, over the long run, farmers
seem to be losing• However, in recent years, real returns increasing and
average farm size is fairly constant or decreasing• Is demand increasing faster than usual?
• China/India and biofuels effect?• Is supply increasing slower than usual?
• Are crop yield gains slowing?
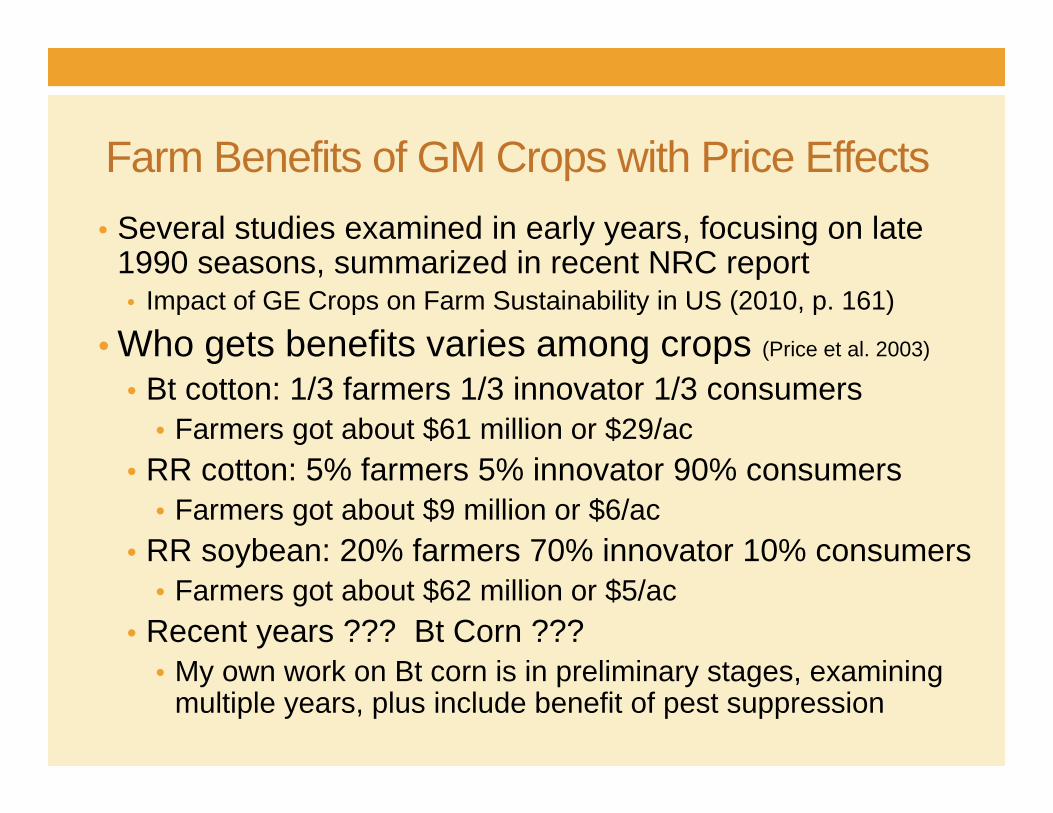
Farm Benefits of GM Crops with Price Effects• Several studies examined in early years, focusing on late
1990 seasons, summarized in recent NRC report• Impact of GE Crops on Farm Sustainability in US (2010, p. 161)
• Who gets benefits varies among crops (Price et al. 2003)
• Bt cotton: 1/3 farmers 1/3 innovator 1/3 consumers• Farmers got about $61 million or $29/ac
• RR cotton: 5% farmers 5% innovator 90% consumers• Farmers got about $9 million or $6/ac
• RR soybean: 20% farmers 70% innovator 10% consumers• Farmers got about $62 million or $5/ac
• Recent years ??? Bt Corn ???• My own work on Bt corn is in preliminary stages, examining
multiple years, plus include benefit of pest suppression
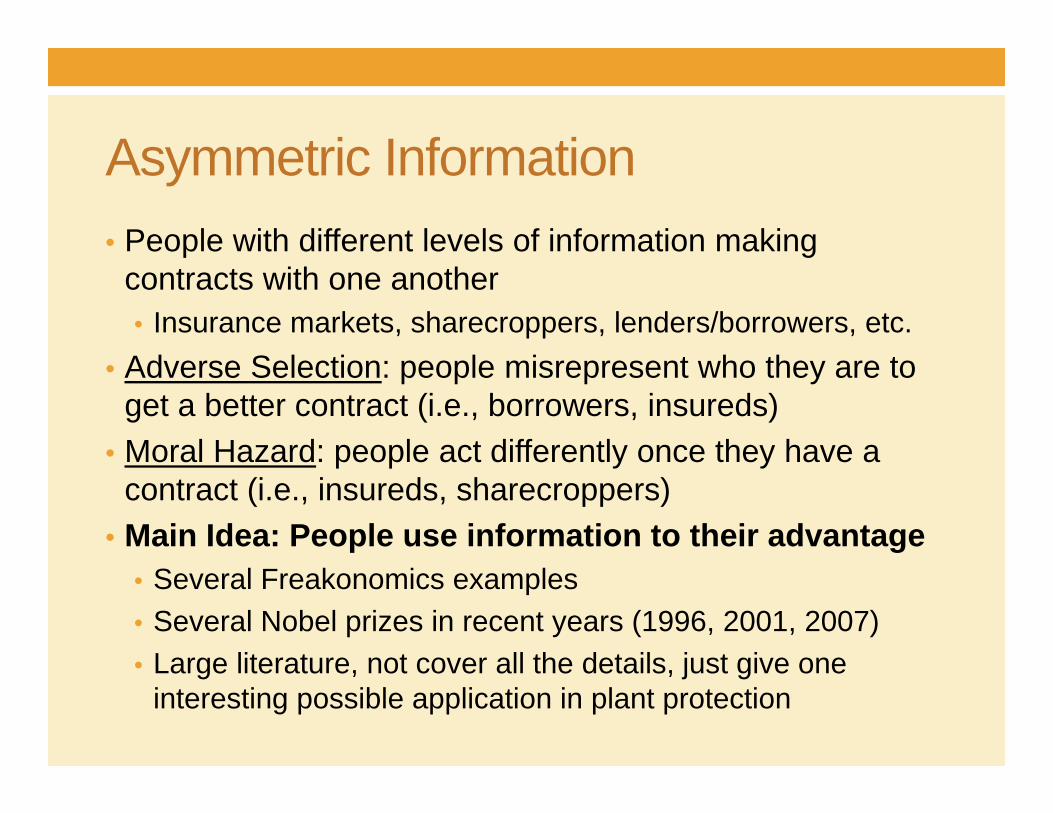
Asymmetric Information• People with different levels of information making
contracts with one another• Insurance markets, sharecroppers, lenders/borrowers, etc.
• Adverse Selection: people misrepresent who they are to get a better contract (i.e., borrowers, insureds)
• Moral Hazard: people act differently once they have a contract (i.e., insureds, sharecroppers)
• Main Idea: People use information to their advantage• Several Freakonomics examples• Several Nobel prizes in recent years (1996, 2001, 2007)• Large literature, not cover all the details, just give one
interesting possible application in plant protection
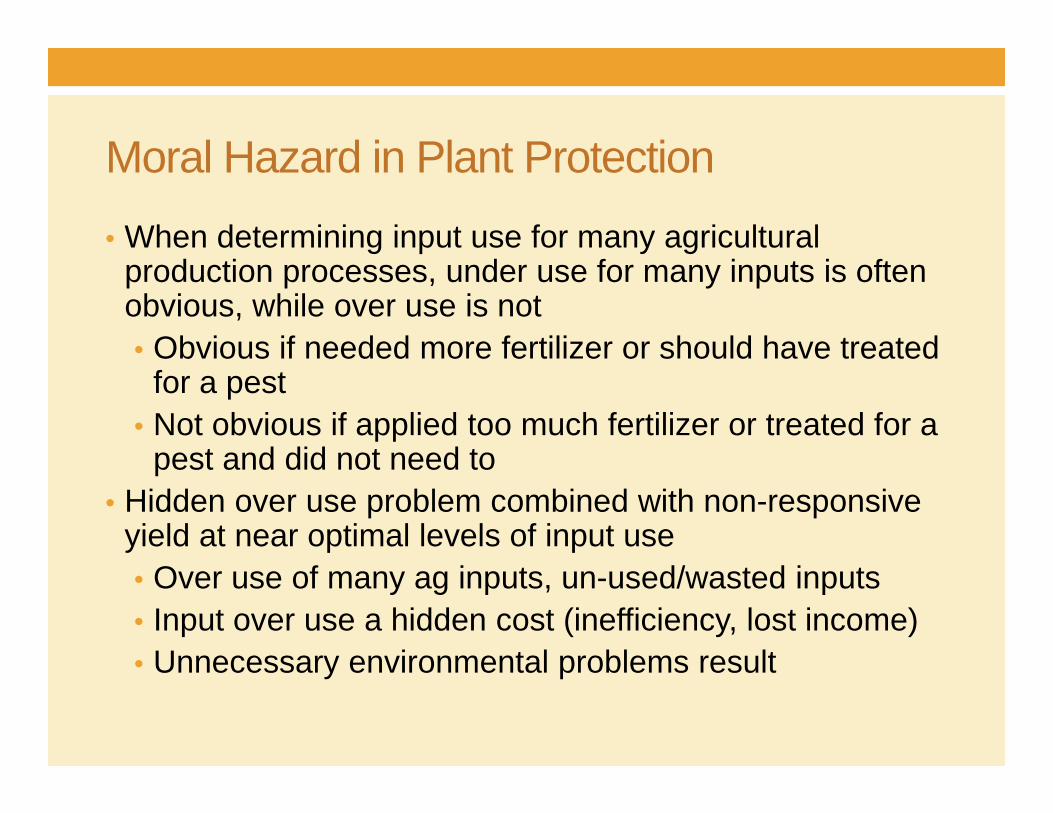
Moral Hazard in Plant Protection• When determining input use for many agricultural
production processes, under use for many inputs is often obvious, while over use is not• Obvious if needed more fertilizer or should have treated
for a pest• Not obvious if applied too much fertilizer or treated for a
pest and did not need to• Hidden over use problem combined with non-responsive
yield at near optimal levels of input use• Over use of many ag inputs, un-used/wasted inputs• Input over use a hidden cost (inefficiency, lost income)• Unnecessary environmental problems result
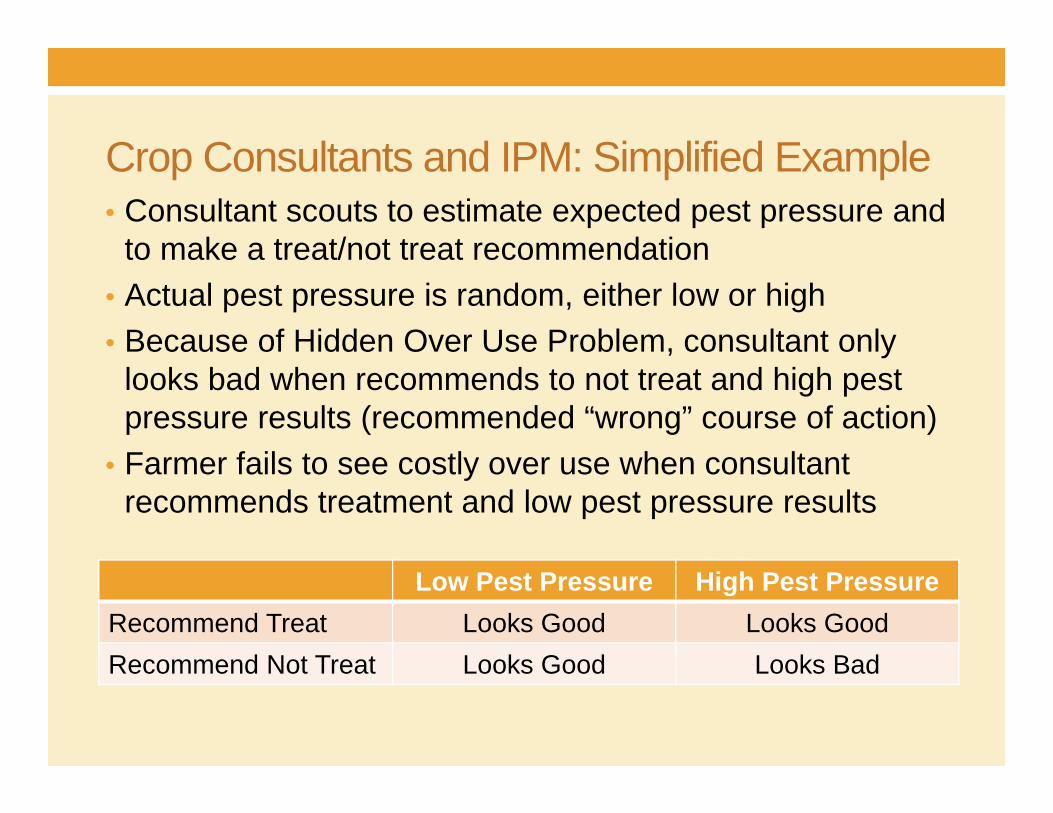
Crop Consultants and IPM: Simplified Example
Low Pest Pressure High Pest PressureRecommend Treat Looks Good Looks GoodRecommend Not Treat Looks Good Looks Bad
• Consultant scouts to estimate expected pest pressure and to make a treat/not treat recommendation
• Actual pest pressure is random, either low or high• Because of Hidden Over Use Problem, consultant only
looks bad when recommends to not treat and high pest pressure results (recommended “wrong” course of action)
• Farmer fails to see costly over use when consultant recommends treatment and low pest pressure results
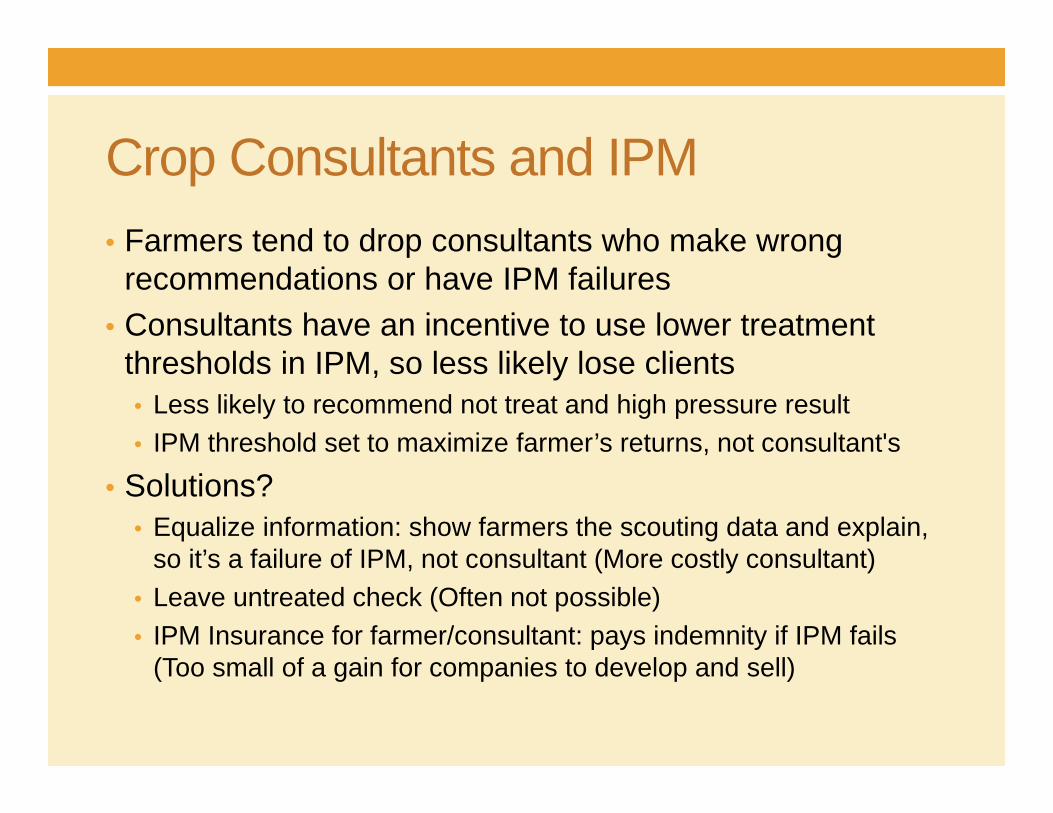
Crop Consultants and IPM• Farmers tend to drop consultants who make wrong
recommendations or have IPM failures• Consultants have an incentive to use lower treatment
thresholds in IPM, so less likely lose clients• Less likely to recommend not treat and high pressure result• IPM threshold set to maximize farmer’s returns, not consultant's
• Solutions?• Equalize information: show farmers the scouting data and explain,
so it’s a failure of IPM, not consultant (More costly consultant)• Leave untreated check (Often not possible)• IPM Insurance for farmer/consultant: pays indemnity if IPM fails
(Too small of a gain for companies to develop and sell)
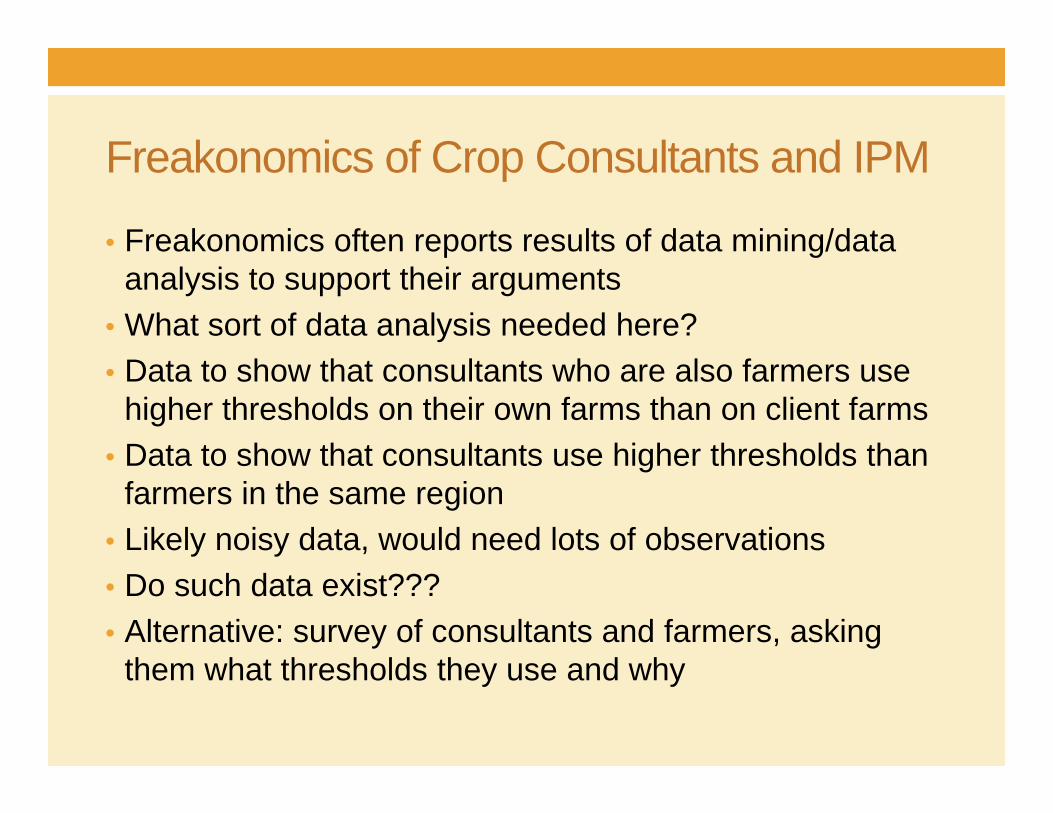
Freakonomics of Crop Consultants and IPM
• Freakonomics often reports results of data mining/data analysis to support their arguments
• What sort of data analysis needed here?• Data to show that consultants who are also farmers use
higher thresholds on their own farms than on client farms• Data to show that consultants use higher thresholds than
farmers in the same region• Likely noisy data, would need lots of observations• Do such data exist???• Alternative: survey of consultants and farmers, asking
them what thresholds they use and why
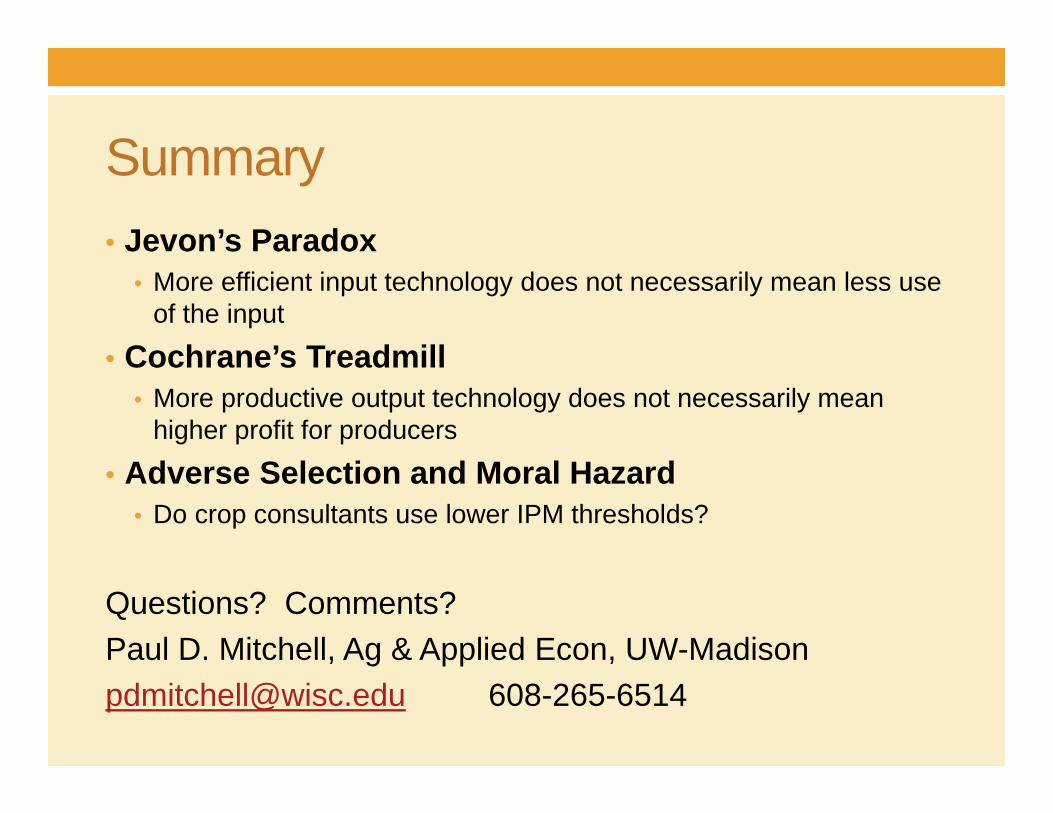
Summary• Jevon’s Paradox
• More efficient input technology does not necessarily mean less use of the input
• Cochrane’s Treadmill• More productive output technology does not necessarily mean
higher profit for producers
• Adverse Selection and Moral Hazard• Do crop consultants use lower IPM thresholds?
Questions? Comments?Paul D. Mitchell, Ag & Applied Econ, [email protected] 608-265-6514

• Atrazine Ban• Increases corn price and corn acres, increases soil erosion
• Bt corn and ECB suppression• Non-adopting acres make more money than adopting acres• Tech companies: need new pest, less effective technology, pest
resistance, lower refuge, and/or bundled technology
• Bt corn and risk (crop insurance and risk)• Technology lowers per acre risk, so growers have an incentive to
expand acres and increase risks


