The Functional Consequences of Changes in the Strength andDuration of Synaptic Inputs to Oscillatory Neurons
Astrid A. Prinz, Vatsala Thirumalai, and Eve MarderVolen Center and Biology Department, Brandeis University, Waltham, Massachusetts 02454-9110
We studied the effect of synaptic inputs of different amplitude and duration on neural oscillators by simulating synaptic conductancepulses in a bursting conductance-based pacemaker model and by injecting artificial synaptic conductance pulses into pyloric pacemakerneurons of the lobster stomatogastric ganglion using the dynamic clamp. In the model and the biological neuron, the change in burstperiod caused by inhibitory and excitatory inputs of increasing strength saturated, such that synaptic inputs above a certain strength allhad the same effect on the firing pattern of the oscillatory neuron. In contrast, increasing the duration of the synaptic conductance pulsesalways led to changes in the burst period, indicating that neural oscillators are sensitive to changes in the duration of synaptic input butare not sensitive to changes in the strength of synaptic inputs above a certain conductance. This saturation of the response to progres-sively stronger synaptic inputs occurs not only in bursting neurons but also in tonically spiking neurons. We identified inward currentsat hyperpolarized potentials as the cause of the saturation in the model neuron. Our findings imply that activity-dependent or modulator-induced changes in synaptic strength are not necessarily accompanied by changes in the functional impact of a synapse on the timing ofpostsynaptic spikes or bursts.
IntroductionUnderstanding the regulation of synaptic strength is a majorquestion in neuroscience, the presumption being that changes insynaptic strength will modify network performance. Despite thelarge body of knowledge that demonstrates that synaptic strengthis regulated in both the short-term and more permanent mannersby patterns of presynaptic activity and chemical signals (Marder,1998; Abbott and Nelson, 2000; Paulsen and Sejnowski, 2000;Song et al., 2000; Poo, 2001; Zucker and Regehr, 2002), there arefewer direct assessments of the functional significance of thesechanges for neuronal or network dynamics.
In some cases, activity or neuromodulation produce modestchanges in synaptic strength. In other cases, they can increase ordecrease the amplitude of recorded synaptic potentials by sever-alfold (Turrigiano et al., 1998; Kandel, 2001). For example, neu-romodulators have been shown to change the strength of a crucialfeedback synapse to the pyloric pacemaker kernel in the lobsterstomatogastric ganglion (STG) by factors of two to five (Ayali etal., 1998; Thirumalai, 2002). Although it is natural to assume thatlarge changes in synaptic strength will produce more dramaticactions on the firing of postsynaptic neurons and the networks inwhich they operate than smaller changes, modeling studies dem-onstrate that some small changes in parameters can be moreeffective than other larger changes in influencing neuronal firing(Goldman et al., 2001). This motivated us to study systematically
how oscillatory neurons respond to changes in the strength andduration of synaptic inputs.
The impact of inputs to biological oscillators depends on theirtiming relative to the oscillator rhythm (Brown and Eccles, 1934).This phase dependence can be described by a phase responsecurve (PRC), which indicates the change in oscillator periodcaused by synaptic inputs occurring at different phases in therhythm (Perkel et al., 1964; Pinsker, 1977a,b). The PRC is a com-pact way of capturing the functional significance of a synapticinput to an oscillator (Abramovich-Sivan and Akselrod, 1998),and therefore we simulated and measured PRCs of model andbiological oscillatory neurons while varying the strength and du-ration of both inhibitory and excitatory synaptic conductancepulses.
In most biological systems, it is not easy to vary systematicallythe strength and duration of a synaptic input. To overcome thisdifficulty, we used the dynamic clamp (Sharp et al., 1993a,b) toimplement artificial synaptic conductances of variable strengthand duration in the pyloric dilator (PD) neuron of the lobster,Homarus americanus. We computed PRCs by applying these in-puts at different times during the cycle of the oscillator. Usingsynaptic conductance pulses to assess the phase response ofmodel and biological oscillators in our view generates function-ally more meaningful PRCs than the ones obtained with the tra-ditionally used current pulses, which can take the membranepotential to unphysiological levels. Surprisingly, in both modeland biological neurons, the effect of altering synaptic strengthsaturates; relatively small changes in the strength of weak syn-apses may be more functionally significant than other largechanges. We then used our computational model of an oscillatoryneuron to obtain insight into the mechanisms by which this sat-
Received Sept. 10, 2002; revised Oct. 22, 2002; accepted Oct. 29, 2002.This work was supported by Deutsche Forschungsgemeinschaft Grant PR 649/1-1 and National Institute of
Mental Health Grant MH46742.Correspondence should be addressed to Dr. Astrid Prinz, Volen Center MS013, Brandeis University, 415 South
The Journal of Neuroscience, February 1, 2003 • 23(3):943–954 • 943
uration occurs in bursting neurons and to generalize the results tospiking neurons.
Parts of this work has been published previously in abstractform (Prinz et al., 2002).
Materials and MethodsModel neuron. We used a single compartment model neuron with eightHodgkin-Huxley type membrane currents and an intracellular calciumbuffer. Similar model neurons have been described in detail previously(Liu et al., 1998; Goldman et al., 2001). The membrane currents are basedon experiments on lobster neurons (Turrigiano et al., 1995) and consistof the following: a fast sodium current, INa; a fast and a slow transientcalcium current, ICaT and ICaS; a fast transient potassium current, IA; acalcium-dependent potassium current, IKCa; a delayed rectifier potas-sium current, IKd; a hyperpolarization-activated inward current, IH; anda voltage-independent leak current, Ileak.
Each current Ii is described by Ii � gimipihi(V � Ei)A, where gi is the
maximal specific conductance, Ei is the reversal potential, and A �0.628 � 10 �3 cm 2 is the membrane area of the model neuron. Unlessotherwise mentioned, values for the individual conductances are as fol-lows (in mS/cm 2): INa, 200; ICaT, 2.5; ICaS, 4; IA, 50; IKCa, 5; IKd, 100; IH,0.01; and Ileak, 0.01 for the bursting version of the model neuron. In thecourse of the paper, we seek to generalize our results for bursting neuronsto tonically spiking neurons. For this purpose, we use a spiking version ofthe model neuron with the following maximal conductances (in mS/cm 2): INa, 200; ICaT, 0; ICaS, 4; IA, 10; IKCa, 10; IKd, 125; IH, 0.05; and Ileak,0.04. The reversal potential is �50 mV for Na �, �80 mV for the threepotassium currents, �20 mV for IH, and �50 mV for Ileak. The calciumreversal potential is determined by the momentary intracellular calciumconcentration and an extracellular calcium concentration of 3 mM usingthe Nernst equation. The values for the integer exponents pi are given inTable 1. The activation and inactivation variables mi and hi change ac-cording to the following:
�m
dm
dt� m� � m and �h
dh
dt� h� � h
with time constants �m and �h and steady-state values m� and h� as listedin Table 1. The voltage dependence and dynamics of IH are based onHuguenard and McCormick (1992), and those of all other currents were
taken from Liu et al. (1998); all activation and inactivation time constantswere multiplied by a factor of two to account for the temperature differ-ence between our experiments with STG neurons, which were performedat 9 –14°C, and the experiments on STG neurons from which the timeconstants were determined, which were done at room temperature (Tur-rigiano et al., 1995).
The instantaneous synaptic current Isyn � gsyn(V � Esyn) reverses atEsyn � �65 mV for inhibitory input to the bursting model. In the spikingversion of the model, we lowered Esyn to �70 mV to ensure that theresulting synaptic current was still inhibitory during most of the veryhyperpolarized part of the voltage trace. In both models, Esyn � 0 mV forexcitatory input. Together with this synaptic current, the membranecurrents govern the membrane potential V according to the following:
CdV
dt� ��
i
Ii � Isyn
where C � 0.628 nF is the capacitance of the 0.628 � 10 �3 cm 2 mem-brane area.
The intracellular calcium concentration [Ca 2�] that controls IKCa andECa changes according to the following:
�Ca
d�Ca2��
dt� �f�ICaT � ICaS � �Ca2�� � �Ca2��0
where �Ca � 200 msec is the calcium removal time constant, f � 14.96�M/nA is a factor that translates the total calcium current into a calciumconcentration change inside the cell (Liu et al., 1998), and [Ca 2�]0 �0.05 �M is the steady-state intracellular calcium concentration when nocalcium ions flow across the membrane.
All differential equations were integrated with Euler’s method at a timeresolution of 25 �sec. Without synaptic input, the model neuron gener-ated bursts of action potentials with a burst period of P � 1.06 sec and aburst duration (which we define as time between the first and last spike ina burst) of 0.25 sec. The free-running spiking model had a spike fre-quency of 4 Hz.
Phase response curves. To obtain PRCs of the bursting model pace-maker neuron, we simulated square pulses of synaptic conductance gsyn
at different times during the ongoing simulated rhythm with gsyn � 0 atall times before and after the pulse (Demir et al., 1997). We assign phase
Table 1. Voltage dependence of model neuron currents
p m� h� �m �h
INa 31
1 � exp�V � 25.5
�5.29 �1
1 � exp�V � 48.9
5.18 � 2.64 �2.52
1 � exp�V � 120
�25 �1.34
1 � exp�V � 62.9
�10 � ��1.5 �1
1 � exp�V � 34.9
3.6 ��ICaT 3
1
1 � exp�V � 27.1
�7.2 �1
1 � exp�V � 32.1
5.5 � 43.4 �42.6
1 � exp�V � 68.1
�20.5 �210 �
179.6
1 � exp�V � 55
�16.9�ICaS 3
1
1 � exp�V � 33
�8.1 �1
1 � exp�V � 60
6.2 � 2.8 �14
exp�V � 27
10 �� exp�V � 70
�13 �120 �
300
exp�V � 55
9 �� exp�V � 65
�16 �IA 3
1
1 � exp�V � 27.2
�8.7 �1
1 � exp�V � 56.9
4.9 � 23.2 �20.8
1 � exp�V � 32.9
�15.2 �77.2 �
58.4
1 � exp�V � 38.9
�26.5 �IKCa 4
[Ca]
[Ca]�3�
1
1 � exp�V � 28.3
�12.6 �180.6 �
150.2
1 � exp�V � 46
�22.7�IKd 4
1
1 � exp�V � 12.3
�11.8 �14.4 �
12.8
1 � exp�V � 28.3
�19.2 �IH 1
1
1 � exp�V � 75
5.5 �2
exp�V � 169.7
�11.6 �� exp�V � 26.7
14.3 �
944 • J. Neurosci., February 1, 2003 • 23(3):943–954 Prinz et al. • Neural Oscillator Sensitivity to Synapse Strength
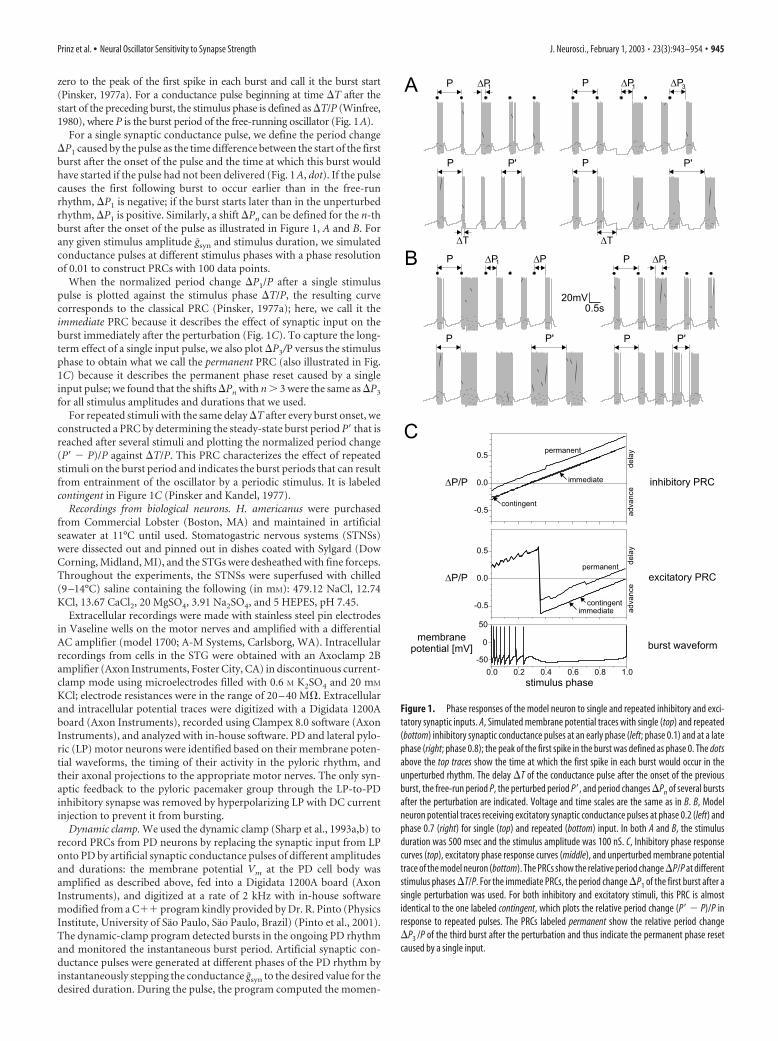
zero to the peak of the first spike in each burst and call it the burst start(Pinsker, 1977a). For a conductance pulse beginning at time T after thestart of the preceding burst, the stimulus phase is defined as T/P (Winfree,1980), where P is the burst period of the free-running oscillator (Fig. 1A).
For a single synaptic conductance pulse, we define the period changeP1 caused by the pulse as the time difference between the start of the firstburst after the onset of the pulse and the time at which this burst wouldhave started if the pulse had not been delivered (Fig. 1 A, dot). If the pulsecauses the first following burst to occur earlier than in the free-runrhythm, P1 is negative; if the burst starts later than in the unperturbedrhythm, P1 is positive. Similarly, a shift Pn can be defined for the n-thburst after the onset of the pulse as illustrated in Figure 1, A and B. Forany given stimulus amplitude gsyn and stimulus duration, we simulatedconductance pulses at different stimulus phases with a phase resolutionof 0.01 to construct PRCs with 100 data points.
When the normalized period change P1/P after a single stimuluspulse is plotted against the stimulus phase T/P, the resulting curvecorresponds to the classical PRC (Pinsker, 1977a); here, we call it theimmediate PRC because it describes the effect of synaptic input on theburst immediately after the perturbation (Fig. 1C). To capture the long-term effect of a single input pulse, we also plot P3/P versus the stimulusphase to obtain what we call the permanent PRC (also illustrated in Fig.1C) because it describes the permanent phase reset caused by a singleinput pulse; we found that the shifts Pn with n � 3 were the same as P3
for all stimulus amplitudes and durations that we used.For repeated stimuli with the same delay T after every burst onset, we
constructed a PRC by determining the steady-state burst period P� that isreached after several stimuli and plotting the normalized period change(P� � P)/P against T/P. This PRC characterizes the effect of repeatedstimuli on the burst period and indicates the burst periods that can resultfrom entrainment of the oscillator by a periodic stimulus. It is labeledcontingent in Figure 1C (Pinsker and Kandel, 1977).
Recordings from biological neurons. H. americanus were purchasedfrom Commercial Lobster (Boston, MA) and maintained in artificialseawater at 11°C until used. Stomatogastric nervous systems (STNSs)were dissected out and pinned out in dishes coated with Sylgard (DowCorning, Midland, MI), and the STGs were desheathed with fine forceps.Throughout the experiments, the STNSs were superfused with chilled(9 –14°C) saline containing the following (in mM): 479.12 NaCl, 12.74KCl, 13.67 CaCl2, 20 MgSO4, 3.91 Na2SO4, and 5 HEPES, pH 7.45.
Extracellular recordings were made with stainless steel pin electrodesin Vaseline wells on the motor nerves and amplified with a differentialAC amplifier (model 1700; A-M Systems, Carlsborg, WA). Intracellularrecordings from cells in the STG were obtained with an Axoclamp 2Bamplifier (Axon Instruments, Foster City, CA) in discontinuous current-clamp mode using microelectrodes filled with 0.6 M K2SO4 and 20 mM
KCl; electrode resistances were in the range of 20 – 40 M . Extracellularand intracellular potential traces were digitized with a Digidata 1200Aboard (Axon Instruments), recorded using Clampex 8.0 software (AxonInstruments), and analyzed with in-house software. PD and lateral pylo-ric (LP) motor neurons were identified based on their membrane poten-tial waveforms, the timing of their activity in the pyloric rhythm, andtheir axonal projections to the appropriate motor nerves. The only syn-aptic feedback to the pyloric pacemaker group through the LP-to-PDinhibitory synapse was removed by hyperpolarizing LP with DC currentinjection to prevent it from bursting.
Dynamic clamp. We used the dynamic clamp (Sharp et al., 1993a,b) torecord PRCs from PD neurons by replacing the synaptic input from LPonto PD by artificial synaptic conductance pulses of different amplitudesand durations: the membrane potential Vm at the PD cell body wasamplified as described above, fed into a Digidata 1200A board (AxonInstruments), and digitized at a rate of 2 kHz with in-house softwaremodified from a C�� program kindly provided by Dr. R. Pinto (PhysicsInstitute, University of Sao Paulo, Sao Paulo, Brazil) (Pinto et al., 2001).The dynamic-clamp program detected bursts in the ongoing PD rhythmand monitored the instantaneous burst period. Artificial synaptic con-ductance pulses were generated at different phases of the PD rhythm byinstantaneously stepping the conductance gsyn to the desired value for thedesired duration. During the pulse, the program computed the momen-
Figure 1. Phase responses of the model neuron to single and repeated inhibitory and exci-tatory synaptic inputs. A, Simulated membrane potential traces with single (top) and repeated(bottom) inhibitory synaptic conductance pulses at an early phase (left; phase 0.1) and at a latephase (right; phase 0.8); the peak of the first spike in the burst was defined as phase 0. The dotsabove the top traces show the time at which the first spike in each burst would occur in theunperturbed rhythm. The delay T of the conductance pulse after the onset of the previousburst, the free-run period P, the perturbed period P�, and period changes Pn of several burstsafter the perturbation are indicated. Voltage and time scales are the same as in B. B, Modelneuron potential traces receiving excitatory synaptic conductance pulses at phase 0.2 (left) andphase 0.7 (right) for single (top) and repeated (bottom) input. In both A and B, the stimulusduration was 500 msec and the stimulus amplitude was 100 nS. C, Inhibitory phase responsecurves (top), excitatory phase response curves (middle), and unperturbed membrane potentialtrace of the model neuron (bottom). The PRCs show the relative period changeP/P at differentstimulus phases T/P. For the immediate PRCs, the period change P1 of the first burst after asingle perturbation was used. For both inhibitory and excitatory stimuli, this PRC is almostidentical to the one labeled contingent, which plots the relative period change (P� � P)/P inresponse to repeated pulses. The PRCs labeled permanent show the relative period changeP3 /P of the third burst after the perturbation and thus indicate the permanent phase resetcaused by a single input.
Prinz et al. • Neural Oscillator Sensitivity to Synapse Strength J. Neurosci., February 1, 2003 • 23(3):943–954 • 945
tary synaptic current according to Isyn � gsyn(V � Esyn), where the syn-aptic reversal potential Esyn was 0 mV for excitatory pulses and �90 mVfor inhibitory pulses based on voltage-clamp experiments on the LP-to-PD synapse (Thirumalai, 2002). To inject this synaptic current intothe PD neuron, the program computed the corresponding commandvoltage, which was turned into an analog voltage by the Digidata boardand sent to the electrode amplifier. The PD neuron returned to its un-perturbed burst pattern after each pulse before the next pulse was in-jected; this was ensured by spacing single conductance pulses at least fourburst periods apart. The PD membrane potential and injected currentwere saved by the dynamic-clamp program and analyzed off-line to com-pute PRCs as described for the model neuron above but using an averageof several unperturbed periods instead of the period immediately preced-ing the injection for P to compensate for variability in the pyloric burstperiod. The phase resolution for each experimental PRC was 0.05, cor-responding to 20 data points per PRC. In some experiments, PRC record-ings for a given amplitude and duration were repeated four to five timesand pooled to produce PRCs with up to 100 data points.
ResultsInhibitory and excitatory model neuron PRCsWe simulated synaptic conductance pulses in a bursting modelneuron to study the effect of synaptic inputs of different ampli-tudes and durations on oscillatory neurons. Figure 1A showsexample traces with inhibitory conductance pulses injected once(top traces) or injected in every cycle of the rhythmic burst pattern(bottom traces). In Figure 1B, excitatory conductance pulses wereinjected once (top traces) or in every cycle (bottom traces). Theeffect of these inputs on the oscillator period is described by phaseresponse curves (Pinsker, 1977a,b). These curves plot the relativeperiod change P/P against the stimulus phase T/P (Winfree,1980), where P is the difference between the perturbed periodand the free-run period P. T is the delay of the stimulus onsetafter phase 0, which we define as the peak of the first spike in eachburst. If a conductance pulse shortens the burst period, the valueof the PRC is negative, and if a stimulus increases the period, thePRC has a positive value.
Depending on the questions one wants to study, differentphase response curves can be constructed from traces like theones in Figure 1, A and B: the immediate effect of a single stimuluson the following burst is described by the classical PRC, whichuses the shift P1 of the first burst onset after the start of thestimulus as a measure for the period change caused by the pulse(Pinsker, 1977a,b). This PRC is labeled immediate in Figure 1C,and it is the kind of PRC we use in the rest of the figures.
As can be seen from the traces in Figure 1, the effect of a singlestimulus pulse on later bursts is not necessarily the same as theeffect on the first burst after the stimulus. The long-term phasereset caused by a single pulse is therefore better described by aPRC that uses Pn with n � 3 as the measure for the shift; wefound that, in all of our simulations, the shift of the third burstafter the stimulus was indistinguishable from the shifts of laterbursts. We label this PRC permanent in Figure 1C.
Because neuronal pacemakers often receive periodic synapticinput in every cycle of their rhythm, another PRC of interest is theone that describes the period change P � P� � P in response torepeated inputs. Here, P� is the steady-state perturbed period thatis reached after several perturbations with the same delay T afterthe preceding burst (Fig. 1A,B, bottom traces). For historical rea-sons, this PRC is labeled contingent in Figure 1C (Pinsker andKandel, 1977).
As Figure 1C shows, the immediate, permanent, and contin-gent PRCs in response to inhibitory conductance pulses have thesame general shape. Inhibition at early phases disrupts the burstand advances the following bursts, whereas inhibition at late
phases prolongs the hyperpolarized part of the waveform andonly allows the bursting pacemaker neuron to burst after the endof the inhibition, thus causing a delay of the following bursts(Ayers and Selverston, 1979). The inhibitory conductance pulsesalso cause the next burst to be longer than the unperturbed bursts(Fig. 1A) because they activate the rebound mechanisms of theneuron. This longer burst duration additionally delays laterbursts, which is why the permanent PRC constructed from thethird burst is shifted to larger delays at all phases with respect tothe immediate PRC.
The different excitatory PRCs also have the same generalshape (Fig. 1C) and exhibit both advances and delays, a propertythat identifies them as type II PRCs according to Ermentrout(1996): a PRC is defined as type I if it is strictly non-negative andas type II if it has a negative regimen. At early phases, an excitatoryconductance pulse prolongs the burst and delays the followingbursts, resulting in a positive value of the PRC. Excitatory synap-tic input that occurs after the burst is over can depolarize theneural oscillator enough to generate an early burst, so the PRC atlate phases is negative (Ayers and Selverston, 1979). If this earlyburst is long (as is the case for long stimulus durations), theadvance of the later bursts is smaller than that of the first burstafter stimulus onset, which explains that the permanent PRC isshifted up with respect to the immediate delay at these late phases.
For both inhibitory and excitatory PRCs, we found that theimmediate and the contingent PRC are almost identical. Thismeans that the immediate PRC, which is computed from theeffect of a single stimulus on the following burst, predicts howperiodic synaptic input onto the bursting pacemaker neuronchanges the pacemaker period. We found that this holds for allstimulus amplitudes and durations in the range we tested in oursimulations and experiments (data not shown).
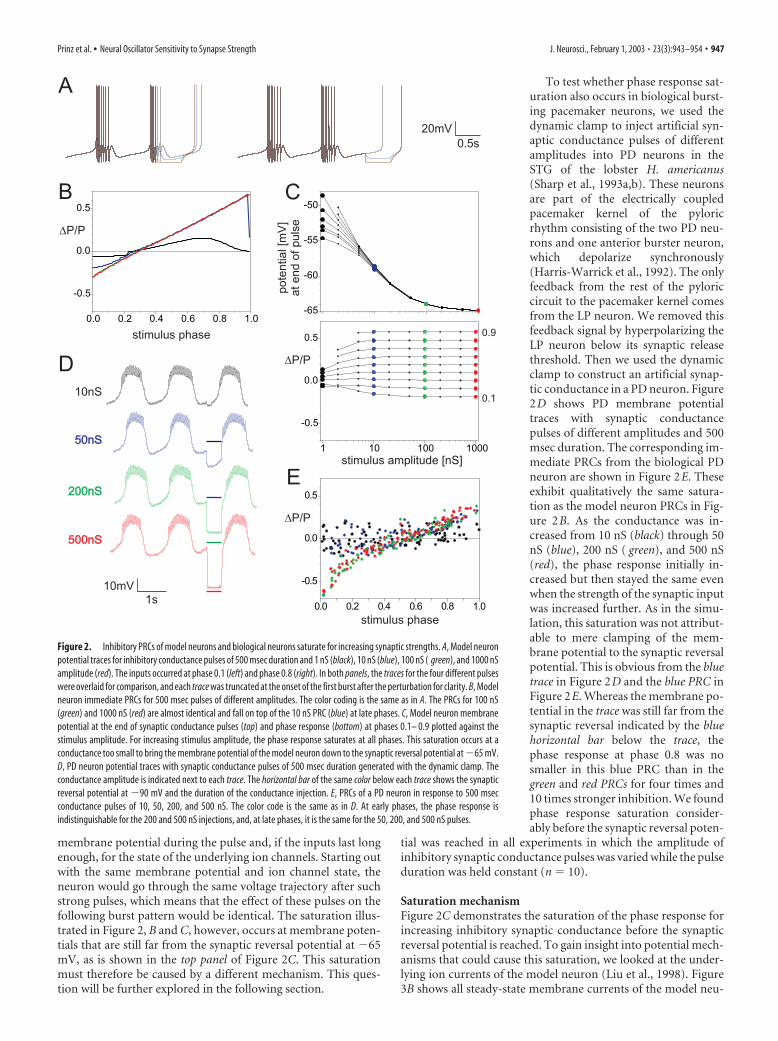
Inhibitory PRCs for inputs of increasing amplitude saturateFigure 2A shows model neuron voltage traces with inhibitorysynaptic pulses of 500 msec duration but different conductanceamplitudes. The immediate PRCs for these four stimulus ampli-tudes are shown in Figure 2B. The oscillator period change at-tributable to synaptic inputs of progressively larger amplitudesaturates. For small synapse strength (1 nS; black), the inputcauses a small advance at early phases and a small delay at latephases. For a 10 nS input (blue), both the advance and the delayare larger. However, a 100 nS synapse causes the same delay at latephases and an only slightly larger advance at early phases, and thePRC for 1000 nS (red) is indistinguishable from the one for 100nS. This saturation is also illustrated by Figure 2C, which showsthe phase response P/P at phases 0.1– 0.9 plotted against thestimulus amplitude: the response saturates at all phases.
The contingent PRCs in response to the same inputs repeatedin every cycle are virtually identical to the immediate PRCs shownin Figure 2B and therefore show the same saturation (Fig. 1C),and we found a similar saturation effect in the permanent PRCsconstructed from later bursts (data not shown). This means that,for both single and for repeated stimulation, all inhibitory synap-tic inputs above a certain strength have the same effect on burst-ing pacemaker neurons or, in other words, that the period ofthese oscillators is not sensitive to changes in synaptic inputstrength above that threshold strength.
A trivial mechanism by which the functional impact of aninhibitory synapse can saturate is if the synapse gets so strong thatit clamps the membrane potential of the neuron to the synapticreversal potential. In this eventuality, increasing the synapsestrength beyond this point would not make any difference for the
946 • J. Neurosci., February 1, 2003 • 23(3):943–954 Prinz et al. • Neural Oscillator Sensitivity to Synapse Strength
membrane potential during the pulse and, if the inputs last longenough, for the state of the underlying ion channels. Starting outwith the same membrane potential and ion channel state, theneuron would go through the same voltage trajectory after suchstrong pulses, which means that the effect of these pulses on thefollowing burst pattern would be identical. The saturation illus-trated in Figure 2, B and C, however, occurs at membrane poten-tials that are still far from the synaptic reversal potential at �65mV, as is shown in the top panel of Figure 2C. This saturationmust therefore be caused by a different mechanism. This ques-tion will be further explored in the following section.
To test whether phase response sat-uration also occurs in biological burst-ing pacemaker neurons, we used thedynamic clamp to inject artificial syn-aptic conductance pulses of differentamplitudes into PD neurons in theSTG of the lobster H. americanus(Sharp et al., 1993a,b). These neuronsare part of the electrically coupledpacemaker kernel of the pyloricrhythm consisting of the two PD neu-rons and one anterior burster neuron,which depolarize synchronously(Harris-Warrick et al., 1992). The onlyfeedback from the rest of the pyloriccircuit to the pacemaker kernel comesfrom the LP neuron. We removed thisfeedback signal by hyperpolarizing theLP neuron below its synaptic releasethreshold. Then we used the dynamicclamp to construct an artificial synap-tic conductance in a PD neuron. Figure2D shows PD membrane potentialtraces with synaptic conductancepulses of different amplitudes and 500msec duration. The corresponding im-mediate PRCs from the biological PDneuron are shown in Figure 2E. Theseexhibit qualitatively the same satura-tion as the model neuron PRCs in Fig-ure 2B. As the conductance was in-creased from 10 nS (black) through 50nS (blue), 200 nS ( green), and 500 nS(red), the phase response initially in-creased but then stayed the same evenwhen the strength of the synaptic inputwas increased further. As in the simu-lation, this saturation was not attribut-able to mere clamping of the mem-brane potential to the synaptic reversalpotential. This is obvious from the bluetrace in Figure 2D and the blue PRC inFigure 2E. Whereas the membrane po-tential in the trace was still far from thesynaptic reversal indicated by the bluehorizontal bar below the trace, thephase response at phase 0.8 was nosmaller in this blue PRC than in thegreen and red PRCs for four times and10 times stronger inhibition. We foundphase response saturation consider-ably before the synaptic reversal poten-
tial was reached in all experiments in which the amplitude ofinhibitory synaptic conductance pulses was varied while the pulseduration was held constant (n � 10).
Saturation mechanismFigure 2C demonstrates the saturation of the phase response forincreasing inhibitory synaptic conductance before the synapticreversal potential is reached. To gain insight into potential mech-anisms that could cause this saturation, we looked at the under-lying ion currents of the model neuron (Liu et al., 1998). Figure3B shows all steady-state membrane currents of the model neu-
Figure 2. Inhibitory PRCs of model neurons and biological neurons saturate for increasing synaptic strengths. A, Model neuronpotential traces for inhibitory conductance pulses of 500 msec duration and 1 nS (black), 10 nS (blue), 100 nS ( green), and 1000 nSamplitude (red). The inputs occurred at phase 0.1 (left) and phase 0.8 (right). In both panels, the traces for the four different pulseswere overlaid for comparison, and each trace was truncated at the onset of the first burst after the perturbation for clarity. B, Modelneuron immediate PRCs for 500 msec pulses of different amplitudes. The color coding is the same as in A. The PRCs for 100 nS(green) and 1000 nS (red) are almost identical and fall on top of the 10 nS PRC (blue) at late phases. C, Model neuron membranepotential at the end of synaptic conductance pulses (top) and phase response (bottom) at phases 0.1– 0.9 plotted against thestimulus amplitude. For increasing stimulus amplitude, the phase response saturates at all phases. This saturation occurs at aconductance too small to bring the membrane potential of the model neuron down to the synaptic reversal potential at �65 mV.D, PD neuron potential traces with synaptic conductance pulses of 500 msec duration generated with the dynamic clamp. Theconductance amplitude is indicated next to each trace. The horizontal bar of the same color below each trace shows the synapticreversal potential at �90 mV and the duration of the conductance injection. E, PRCs of a PD neuron in response to 500 msecconductance pulses of 10, 50, 200, and 500 nS. The color code is the same as in D. At early phases, the phase response isindistinguishable for the 200 and 500 nS injections, and, at late phases, it is the same for the 50, 200, and 500 nS pulses.
Prinz et al. • Neural Oscillator Sensitivity to Synapse Strength J. Neurosci., February 1, 2003 • 23(3):943–954 • 947
ron and their sum, the total steady-state current of the burstingpacemaker model. These steady-state currents are an approxima-tion of the membrane currents flowing immediately after the endof a synaptic conductance pulse that is long enough for most ofthe gating variables of the model to reach their steady state. Thefigure shows that the total current changes from inward to out-ward at �45 mV and back at �47 mV. At membrane potentialsbelow �47 mV, the total steady-state membrane current is in-ward, and its amplitude increases as the membrane potential goesto more hyperpolarized values. This means that, the lower themembrane potential at the end of a synaptic conductance pulse,the more inward current is flowing and the faster the potentialwill return to more depolarized levels after the end of the pulse.This can also be seen in the voltage traces in Figure 3A, in whichpulses that strongly hyperpolarize the membrane potential arefollowed by steep voltage trajectories. The initial slope after theend of the stimulus is (in mV/sec): 52 for 2 nS (blue trace), 66 for5 nS (dark cyan), 90 for 10 nS ( green), 112 for 20 nS ( yellow), 144for 100 nS (orange), and 154 for 1000 nS (red). Figure 2, A and B,suggests that it is the larger inward currents for more hyperpolar-
ized membrane potentials that favor the convergence of the po-tential traces and therefore the saturation of the phase response.
The inward current at potentials below approximately �50mV is carried by the hyperpolarization-activated IH and by Ileak. Ifthese two currents are in fact responsible for the phase responsesaturation described in the previous section, the saturation beforereversal potential is reached should not be present in a neuronwithout these currents. Figure 3C shows voltage traces of thesame model neuron as in Figure 3A but without IH and Ileak. Inresponse to the same synaptic conductance pulses as in Figure 3A,this model burster also shows phase response saturation, whichcan be seen from the fact that the orange and red traces (for 100and 1000 nS) exhibit indistinguishable first spike times after thestimulus. However, without IH and Ileak, this saturation occursonly when the synaptic conductance is large enough to effectivelyclamp the membrane potential to the synaptic reversal potentialat �65 mV. This is illustrated by the green and yellow traces inFigure 3C, which are very close to synaptic reversal at the end ofthe synaptic input but still result in first spikes that occur earlierthan in the red trace for 1000 nS.
To investigate whether IH alone or Ileak alone can producephase response saturation away from the synaptic reversal poten-tial, we performed additional simulations in which only one ofthe two candidate currents was removed from the otherwise un-changed model neuron. The fact that the model neuron is stillbursting when either one of the two currents or both are removedindicates that neither of the currents is essential for the burstingpacemaker activity of the model. The presence of either of the twocurrents alone was sufficient for the saturation effect (data notshown), but saturation occurred at somewhat higher synapticconductances and lower membrane potentials if only IH but notIleak was present, indicating that Ileak (at least at the maximalconductances we used in our model) is contributing more to theeffect than IH.
How do the voltage dependence and dynamics of IH and Ileak
affect their ability to cause phase response saturation? IH has abell-shaped activation time constant with a maximum of almost 2sec at �80 mV; in the voltage range relevant here, the time con-stant ranges from 0.43 sec at �50mV to 1.15 sec at �65 mV. Totest whether these dynamics play a role in the ability of IH to causephase response saturation, we ran two more simulations of themodel burster without leak current: one with the IH activationtime constant fixed at 0.75 sec (which is the average value in therange from �50 mV to �65 mV) and one with an instantaneousversion of IH (data not shown). In both cases, IH produced satu-ration, indicating that the particular dynamics of the underlyingcurrent were not crucial for the effect. When the time constantwas fixed at 0.75 sec, the saturation occurred at synaptic conduc-tances and membrane potentials very similar to the ones in thesimulation with the bell-shaped time constant, whereas the in-stantaneous IH produced saturation at lower synaptic conduc-tances and more depolarized membrane potentials, showing thatinstantaneous IH is more efficient at generating phase responsesaturation than IH with a slow activation time constant.
Another parameter one might expect to be critical for phaseresponse saturation is the leak reversal potential, which in ourmodel was at �50 mV. We varied the leak reversal potential inour bursting model without IH between �40 and �56 mV (thelowest leak reversal potential that allows bursting in our model)and simulated phase responses as in Figure 3 (data not shown).We found phase response saturation over the entire range ofreversal potentials, but Ileak proved to be more efficient at gener-ating saturation for more depolarized reversal potentials.
Figure 3. Membrane currents underlying the phase response saturation for inhibitory inputsof increasing strength. A, Potential traces of the model neuron in response to inhibitory synapticpulses of 500 msec duration and 1 nS (purple), 2 nS (blue), 5 nS (dark cyan), 10 nS (green), 20 nS(yellow), 100 nS (orange), and 1000 nS (red). The traces are overlaid for comparison and trun-cated at the peak of the first spike after stimulation onset for clarity. The more hyperpolarizedthe membrane potential is at the end of the stimulus, the steeper the trajectory after the end ofthe input. All conductances above 5 nS lead to the same time of first spike and therefore resultin the same phase response. B, Model neuron steady-state membrane current densities. Thehyperpolarization-activated IH is shown in blue, Ileak in green, the total membrane current in red,and all other currents in black. At membrane potentials below �50 mV, there is a net inwardcurrent whose amplitude increases for decreasing membrane potential. This is attributable to IH
and Ileak. C, Membrane potential traces of a model neuron without IH and Ileak but with all otherconductances identical to the values in A. The color code and time scale are the same as in A.Even traces that are very close to the synaptic reversal potential at �65 mV, like the green tracefor 10 nS and the yellow trace for 20 nS, result in a time of first spike that is earlier than that of thered trace for 1000 nS. The phase response thus does not saturate before the synaptic reversalpotential is reached.
948 • J. Neurosci., February 1, 2003 • 23(3):943–954 Prinz et al. • Neural Oscillator Sensitivity to Synapse Strength
In summary, Figure 3 shows that the impact of any synapticinput on an oscillatory neuron saturates at some point if thesynaptic conductance increases. In cells without effective inwardcurrents at hyperpolarized potentials, this saturation occurs onlywhen the synaptic conductance is large enough to clamp themembrane potential to the synaptic reversal potential, but, inneurons with IH or Ileak (or currents with similar voltage depen-dence), functional saturation can already occur at synapsestrengths much too weak to bring the membrane potential tosynaptic reversal.
No PRC saturation for inhibitory inputs ofincreasing durationFigure 4 explores the effect of inhibitory synaptic inputs of dif-ferent durations on the period of the model oscillatory neuron.Stimuli at early phases whose duration is on the order of theinterspike interval during the burst (�20 msec) or shorter do notdisrupt the ongoing burst (Fig. 4, black trace in A, black PRC in C).The effect of such short, early stimuli on the oscillator period isdependent on the exact timing of the stimulus onset with respectto the spikes within the burst and can change from advance todelay and back over a short phase range. At late phases, stimuli ofsuch short duration cause only a small delay (Fig. 4, black trace in
B, black PRC in C). As the duration is increased, the PRC withadvances at early phases and delays at late phases emerges. If thestimulus duration is increased even further, the immediate PRCgets shifted to larger and larger delays at all phases (Fig. 4C,D).This finding is consistent with results from a previous study on abursting model neuron (Demir et al., 1997). Not surprisingly, thetraces in Figure 4, A and B, show that longer inhibitory pulseskeep the model oscillator from bursting for a longer time,allowing it to return to more depolarized potentials only afterthe end of the stimulus. Unlike with the stimuli of differentamplitudes described above, any increase in stimulus durationtherefore results in an increased effect on the rhythmic pace-maker pattern.
Figure 4D shows that, after an initial nonlinear part, the plotof the phase response P/P against the stimulus duration be-comes linear at all phases. In this linear range, any increase instimulus duration simply adds to the delay of the following burst,because the state of the membrane at the end of the pulse (andthus the time it takes from there to the next burst) is similar overthe entire range. For early phases, the stimulus starts during theburst, when all membrane currents other than IH are active.Given the activation and inactivation time constants of thesemembrane currents, which are all around or below 300 msec inthe relevant voltage range, one would expect the membrane stateafter the pulse to be similar for all stimulus durations above 300msec. This is approximately where the linear range in Figure 4Dstarts for early phases.
The membrane potential at stimulus onset for late phases isbetween �50 and �60 mV (Fig. 1C), and the currents that con-tribute most to the total current in this range are Ileak, ICaS, and IA
(Fig. 3B). The leak current is instantaneous, and ICaS and IA de-activate with time constants between 20 and 40 msec in therelevant voltage range, which explains why the linear range inFigure 4 D starts at fairly short stimulus durations for latephases.
In the previous section, we showed that IH and Ileak are pri-marily responsible for the repolarization of the membrane poten-tial after the end of inhibitory synaptic conductance pulses.Whereas the activation of Ileak is voltage independent, the activa-tion time constant of IH varies considerably in the voltage rangerelevant here. To ask whether the activation dynamics of IH areresponsible for the duration sensitivity of the phase response atshort inhibitory input durations, we simulated inhibitory synap-tic conductance pulses of 100 nS amplitude and 1–100 msec du-ration in three different model bursters without Ileak: the firstcontained IH with normal activation dynamics, the second had afixed IH activation time constant of 0.75 sec, and, in the third, IH
activated instantaneously. In all three models, the phase responsesensitivity to inhibitory input durations between 1 and 100 msecwas comparable (data not shown), leading us to the conclusionthat the activation dynamics of IH are not critical for the sensitiv-ity of the model neuron to short inhibitory inputs.
Figure 4E shows immediate PRCs recorded from a PD neuronin the lobster stomatogastric ganglion with inhibitory conduc-tance pulses of 100 nS amplitude and different durations. Thephase responses of the biological neuron show the same behavioras the simulated PRCs of the model bursting pacemaker: for pro-gressively longer stimulus durations, the immediate PRC getsshifted to larger and larger delays. We found all PD neurons thatreceived artificial synaptic conductance pulses of varying dura-tion to show this behavior (n � 12).
Figure 4. PRCs in response to inhibitory inputs of increasing duration show no saturation. A,Model burster voltage traces with inhibitory synaptic conductance pulses of 100 nS amplitudeand the durations given to the left of each trace. All inputs started at phase 0.1. The voltage andtime scale are the same as in B. B, Overlaid voltage traces in response to the same inputs as in A,but delivered at phase 0.8. The traces are truncated at the peak of the first spike after stimulusonset. The color code is the same as in A. C, Immediate PRCs for 5 msec (black), 50 msec (blue),500 msec (green), and 1000 msec (red ) stimulus duration. The longer the stimulus, the more thePRC is shifted toward larger delays. D, Phase response at phases between 0.1 and 0.9 plottedagainst the stimulus duration. The response saturates at none of the phases. E, PRCs recordedfrom a PD neuron using dynamic clamp generated conductance pulses of 100 nS amplitude and200 msec (black), 500 msec (blue), and 1000 msec (green) duration. The phase response doesnot saturate for progressively longer stimulus duration.
Prinz et al. • Neural Oscillator Sensitivity to Synapse Strength J. Neurosci., February 1, 2003 • 23(3):943–954 • 949
PRCs for excitatory inputs of increasing amplitudealso saturateOur finding that the effect of inhibitory inputs of increasing am-plitude on the oscillator period saturates made us wonderwhether a similar effect can also be seen for excitatory synapticinputs. Figure 5, A and B, shows simulated bursting pacemakervoltage traces with excitatory synaptic conductance pulses of 500msec duration and different amplitudes at an early and a latephase in the ongoing rhythm. When the excitation arrives duringthe burst, it prolongs it and thereby delays the next burst. When itarrives during the hyperpolarized part of the bursting pacemakerwaveform, it can advance the next burst by contributing to thepreburst depolarization or can (if strong enough) trigger the nextburst almost immediately. The resulting immediate PRCs areshown in Figure 5C; they show delays at early phases and ad-vances at late phases.
As the amplitude of the excitatory synaptic input is increased,the PRC saturates just as in the inhibitory case (Fig. 2). Thissaturation is illustrated by Figure 5D, which shows the phaseresponse at phases between 0.1 and 0.9 as a function of the stim-ulus amplitude. The response saturates at all phases, with theexception of very strong inputs at early phases, which showslightly less delay than inputs in the range between 10 and 100 nS.
Inspection of the red trace for 1000 nS in Figure 5A suggests thatthis is attributable to the vigorous spiking of the model neuronduring very strong excitation. This massive activity leads to in-creased calcium influx into the model neuron, which in turncauses a lot of calcium-dependent potassium efflux, rapid hyper-polarization, and activation of rebound-promoting IH that con-tributes to a shortening of the interburst interval. Again, wefound similar saturation effects in the contingent and permanentPRCs (data not shown), meaning that, for single as well as re-peated excitatory synaptic inputs, all synapse strengths above acertain conductance will have similar effects on the bursterperiod.
We used the dynamic clamp to inject excitatory synaptic con-ductance pulses into PD neurons and constructed immediatePRCs for different amplitude inputs. PRCs from one experimentare plotted in Figure 5E and show qualitatively the same behavioras the simulated PRCs in Figure 5C. In all experiments in whichthe amplitude of excitatory synaptic conductance pulses was var-ied, we found that the phase response to inputs of increasingamplitude saturated over the entire phase range (n � 3).
Figure 5. Phase responses of model and biological neurons to excitatory synaptic inputs ofdifferent amplitudes. A, Model neuron potential traces with excitatory conductance pulses of500 msec duration and the amplitudes indicated next to each trace. The excitation started atphase 0.2. B, Potential traces for excitatory conductance pulses at phase 0.7 in the modelneuron. The color code is the same as in A. The four traces were overlaid, and each was truncatedat the onset of the first burst after the start of the stimulation. C, Excitatory model neuron PRCsfor inputs of different amplitude. The color code is the same as in A and B. D, Phase response atphases 0.1– 0.9 plotted against the excitatory stimulus amplitude. At all phases, the responsesaturates at �10 nS. At early phases, the response decreases again at high conductances. E,Immediate PRCs of a PD neuron in response to excitatory dynamic clamp conductance pulses of500 msec duration and amplitudes of 10 nS (black), 100 nS (blue), 500 nS (green), and 1000 nS(red ).
Figure 6. Excitatory PRCs of biological and model neurons for different input durations. A,Model neuron potential traces with excitatory synaptic conductance pulses of 100 nS amplitudeand the durations given to the left of each trace. The conductance pulse arrived at phase 0.2 in allfour traces. B, Overlaid model neuron traces in response to conductance pulses at phase 0.7. Thetraces are truncated at the peak of the first spike after stimulus onset for clarity. The 1 msec pulse(black) advances the next burst only slightly, but the 5 msec pulse (blue) is long enough totrigger a burst almost immediately after stimulus onset. So are the 500 msec (green) and 1000msec pulses (red), which is why they fall on top of the blue trace and are not visible in this figure.C, PRCs for different excitatory stimulus durations. The color code is the same as in A. The PRCsshow no saturation at early phases. At late phases, all immediate PRCs for stimuli above a fewmilliseconds duration are identical because they trigger a new burst right after stimulus onset.D, Phase response at phases between 0.1 and 0.9 plotted against stimulus duration. E, Excita-tory PRCs recorded from a PD neuron in response to stimuli of 1000 nS amplitude and 10 msec(black), 100 msec (blue), 500 msec (green), and 750 msec (red ) duration.
950 • J. Neurosci., February 1, 2003 • 23(3):943–954 Prinz et al. • Neural Oscillator Sensitivity to Synapse Strength
Excitatory PRCs for inputs of increasing duration donot saturateWe also simulated PRCs for excitatory synaptic conductancepulses of different durations. Example traces at phase 0.2 andphase 0.7 are shown in Figure 6, A and B, and Figure 6C shows thecorresponding immediate PRCs. At early phases, longer excita-tory pulses lead to longer delays because they prolong the ongo-ing burst; the PRCs show no saturation in this phase range. Exci-tatory inputs arriving at late phases trigger the next burst almostinstantaneously if they are more than a few milliseconds long, sothe immediate PRCs are virtually identical at these late phases.Figure 6D shows the phase responses at phases between 0.1 and0.9, plotted against the stimulus duration, and again illustratesthat no saturation occurs at early phases, whereas the response isalmost independent of the stimulus duration at late phases. Thecontingent PRCs for the same stimuli in every cycle are againvirtually identical to the immediate PRCs shown in Figure 6D, sorepeated stimulation with the same conductance pulse in everyburst cycle also leads to nonsaturating period changes at earlyphases and almost duration-independent changes at late phases.
However, the permanent PRCs that describe the long-term phaseshift in response to a single excitatory stimulus of increasing du-ration are not duration independent at late phases. Instead, thelonger the single input, the more the permanent PRC is shiftedupward at late phases (data not shown). This shift happens be-cause the duration of the stimulus adds to the shift of later bursts.
Experimental PRCs recorded from a PD neuron using excita-tory conductance pulses of different durations are shown in Fig-ure 6E. As in the simulations, these immediate PRCs are almostidentical at late phases. At early phases, the delays caused by theexcitatory stimuli are larger for longer input pulses (n � 3).
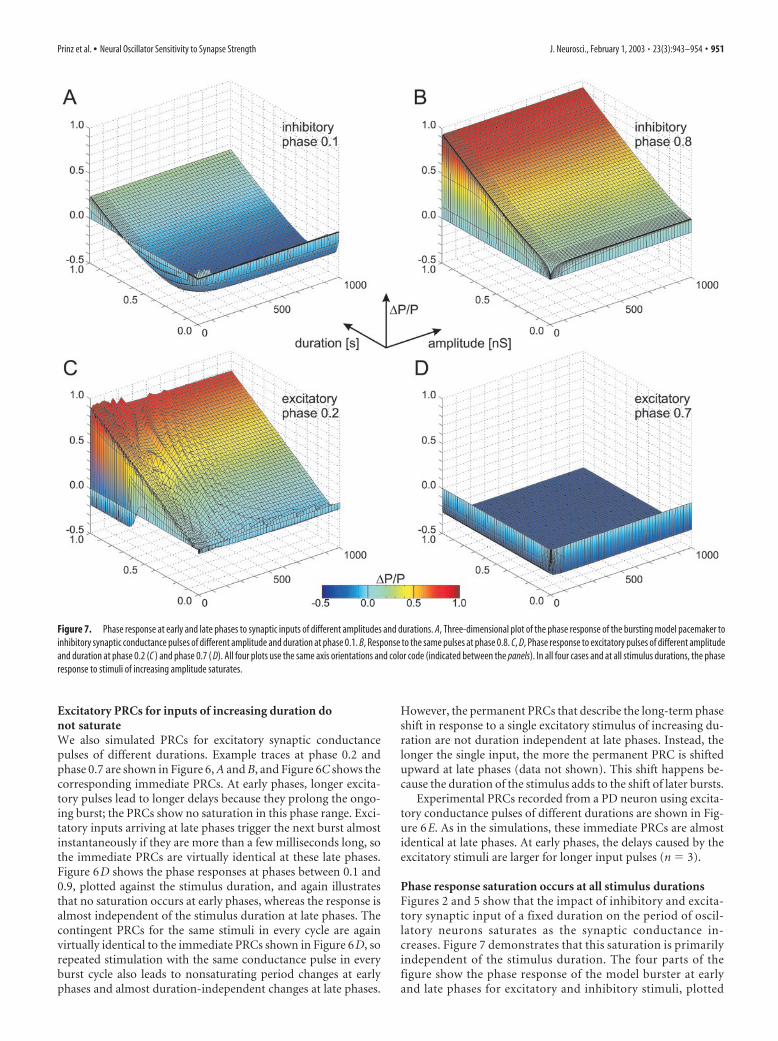
Phase response saturation occurs at all stimulus durationsFigures 2 and 5 show that the impact of inhibitory and excita-tory synaptic input of a fixed duration on the period of oscil-latory neurons saturates as the synaptic conductance in-creases. Figure 7 demonstrates that this saturation is primarilyindependent of the stimulus duration. The four parts of thefigure show the phase response of the model burster at earlyand late phases for excitatory and inhibitory stimuli, plotted
Figure 7. Phase response at early and late phases to synaptic inputs of different amplitudes and durations. A, Three-dimensional plot of the phase response of the bursting model pacemaker toinhibitory synaptic conductance pulses of different amplitude and duration at phase 0.1. B, Response to the same pulses at phase 0.8. C, D, Phase response to excitatory pulses of different amplitudeand duration at phase 0.2 (C ) and phase 0.7 ( D). All four plots use the same axis orientations and color code (indicated between the panels). In all four cases and at all stimulus durations, the phaseresponse to stimuli of increasing amplitude saturates.
Prinz et al. • Neural Oscillator Sensitivity to Synapse Strength J. Neurosci., February 1, 2003 • 23(3):943–954 • 951
against the stimulus duration and amplitude. In all cases,holding the input duration fixed and increasing the stimulusamplitude initially leads to larger phase responses, but, if thestimulus amplitude exceeds a certain conductance, the phaseresponse saturates. This saturation occurs at higher conduc-tances for short stimuli than for long stimuli, but it is presentthroughout the physiologically meaningful range of stimulus du-rations. In contrast, holding the stimulus amplitude fixed andchanging the duration of the stimulus in most cases leads to achange in phase response. Thus, the period of a bursting neuronalpacemaker can be more reliably regulated via the duration ofsynaptic input to the pacemaker than via its strength. Changes insynapse strength will only be effective in changing the period ofthe neuronal oscillator if they occur in the range of weak synapsestrengths below the saturation conductance.
Generalization to nonbursting neuronal oscillatorsNone of the mechanisms that lead to a saturation of the phaseresponse to increasing synaptic input conductance describedabove is unique to bursting neurons. For example, the increasinginward current at hyperpolarized potentials that was identified asthe reason for phase response saturation in Figure 3 is present inany neuron that contains currents active at hyperpolarized po-tentials. We therefore wondered if synaptic inputs of constantduration but increasing amplitude could lead to a similar satura-tion effect in nonbursting neurons. Figure 8 shows simulations ofinhibitory synaptic inputs to a tonically spiking model neuronthat, among other currents, contains IH and Ileak; the parametersof all of the currents in the model are listed in Materials andMethods. The traces in A show that such inputs at early and latephases of the interspike interval can lead to the same timing of thenext spike, even if they cause different and nonsaturating voltagedeflections. This finding is also illustrated by the phase responsesat phases between 0.1 and 0.9 that are plotted against the stimulus
amplitude in Figure 8B. Consistent with previous studies, theinhibitory inputs to the tonically spiking model neuron producedelays at all phases (Perkel et al., 1964; Foss and Milton, 2000). Inall of the curves in Figure 8B, the phase response saturates anddoes so even before the postsynaptic potential reaches the synap-tic reversal potential at �70 mV. The lack of sensitivity of dis-charge frequency to different synapse strengths above a certainconductance may therefore be a widespread phenomenon thatoccurs in all oscillatory neurons with the appropriate membranecurrents.
DiscussionIn biological systems, there are numerous processes that varysynaptic strength. On rapid time scales, the impulse activity of thepresynaptic neuron may result in facilitation and/or depression(Marder, 1998; Zucker and Regehr, 2002), either short term orlong term. Neuromodulatory substances can alter synapticstrengths (Johnson and Harris-Warrick, 1990; Lessmann, 1998;Vogt and Regehr, 2001; Kamiya, 2002), and changes in synapticstrength occur during development. Despite the many biologicalmechanisms that can alter synaptic strength in virtually everynervous system studied, it is often more difficult to assess theconsequences of these changes for the function of the networks inwhich they are occurring.
Indeed, the very difficulty of making the connection betweenchanges in synaptic strength studied at the cellular level andchanges in circuit dynamics and resulting behavior has rein-forced the assumption, on the part of many, that all demonstrablechanges in synaptic strength must be functionally significant.Here we show that the effect of altering the strength of a synapticinput to neural oscillators saturates. Beyond the saturation point,additional increases produce no additional changes in the dy-namics of the oscillators receiving those inputs. This saturationoccurs in both bursting pacemaker neurons and regularly spikingneurons.
Previous studiesIn this work, we used PRCs as an assay for the functional strengthof a synaptic input to an oscillator. PRCs for biological oscillatorshave been measured before with biological synaptic inputs (Pin-sker, 1977a,b; Ayers and Selverston, 1979, 1984; Ayali and Harris-Warrick, 1999). Nonetheless, because in these previous studiesthe effects of a biological synapse were studied by depolarizing thepresynaptic neuron or stimulating an afferent nerve, it was notpossible to study systematically the effects of varying the ampli-tude of the synaptic conductance. In a previous study on a modelof the bursting neuron R15 in Aplysia, PRCs in response to pre-defined synaptic transmitter waveforms of varying duration weresimulated (Demir et al., 1997). In the same study, the effect ofcurrent pulses of different amplitude on the PRC of the modelR15 neuron was explored, and a study on neuronal oscillators inthe cardiac ganglion of the crab recorded experimental PRCs inresponse to excitatory and inhibitory current pulses of differentamplitudes (Benson, 1979). In both cases, the general shape of thePRC was similar for all currents tested, with PRCs for signifi-cantly larger current pulse amplitudes only slightly shifted withrespect to the PRCs for small currents. However, the significanceof PRCs measured with current pulses rather than conductancechanges to mimic synaptic inputs is hard to interpret. This isbecause the current flowing into a neuron through a synapticconductance depends on the postsynaptic membrane potential,whereas a current pulse does not depend on the momentary stateof the postsynaptic cell and can take the membrane potential to
Figure 8. An example of phase response saturation for increasing synaptic conductance in aspiking model neuron. A, Simulated voltage traces from a tonically spiking model neuron inresponse to inhibitory synaptic conductance pulses of 20 msec duration and 1 nS (black), 10 nS(blue), 100 nS (green), and 1000 nS (red) amplitude. The inputs occurred at phase 0.1 (top) orphase 0.8 (bottom) after the spike. In each panel, the traces were overlaid for comparison andtruncated at the peak of the first spike after the stimulus for clarity. B, Model spiker membranepotential at the end of the synaptic conductance pulse (top) and phase response at phasesbetween 0.1 and 0.9 (bottom) plotted against the stimulus amplitude. The phase response ofthe spiking neuron to inputs of increasing conductance saturates at all phases, and this satura-tion occurs before the synaptic reversal potential at �70 mV is reached.
952 • J. Neurosci., February 1, 2003 • 23(3):943–954 Prinz et al. • Neural Oscillator Sensitivity to Synapse Strength
unrealistic values beyond the synaptic reversal potential. To ourknowledge, our study therefore is the first to explore systemati-cally the phase response of neuronal oscillators to synaptic inputsof varying strength.
Phase response saturation in the context of neuromodulationThe saturation of the phase response of neural oscillators forsynaptic inputs of increasing strength has implications for theregulation of neural pacemaker period. A neuromodulatory sub-stance that changes the strength of a feedback synapse onto apacemaker can only effectively regulate the pacemaker period ifthe synapse strength is below the saturation threshold. In con-trast, neuromodulators that alter the duration of the synapticsignal to a pacemaker can more reliably influence the period of abiological rhythm regardless of the strength of the synapse. Suchmodulators are frequently found in the stomatogastric ganglion(Hooper and Marder, 1987; Weimann et al., 1997).
The insensitivity of neuronal pacemaker period to increases ofsynaptic input strength beyond the saturation conductance couldserve to prevent overmodulation of the pacemaker period. Likeall cellular and synaptic components of neural networks, feed-back synapses to pacemakers are potentially targeted by multipleneuromodulators (Johnson et al., 1994; Johnson and Harris-Warrick, 1997). The saturation effect we describe effectively putsa ceiling on the period change that a single modulator or a com-bination of modulators can cause by regulating the strength of thefeedback synapse. In that sense, saturation of the functional im-pact of increasing synapse strength could serve to promote ro-bustness of the pacemaker output in the face of multiple modu-latory influences.
In the STG, a number of different neuromodulators can acti-vate the same low-threshold inward current in neurons of thepyloric pattern-generating circuit (Swensen and Marder, 2000).This current is active in the voltage range relevant for repolariza-tion after inhibitory synaptic inputs and could thus potentiallyact as a third contributor to the total inward current establishedby IH and Ileak in this range. We showed that the total inwardcurrent at hyperpolarized potential is responsible for saturationof the phase response to inhibitory inputs of progressively largeramplitude. We therefore speculate that neuromodulators, by ac-tivating this additional inward current, could affect the thresholdsynaptic conductance beyond which the phase response saturatesand thus the sensitivity of the neural oscillator to changes insynaptic input strength.
The role of input durationThe sensitivity of the firing or bursting pattern of neuronal oscil-lators to the duration of synaptic inputs demonstrated by ourresults is consistent with the findings of a recent study on syn-chronization of bursting neurons by mutual inhibition (Elson etal., 2002). This study shows that the synaptic time constant andtherefore the duration of synaptic inputs to neural oscillators canbe a crucial determinant for the phase relationship and period ofcoupled oscillators in a mutually inhibitory circuit.
Figure 4 indicates why the phase response of our model oscil-latory neuron to inhibitory inputs of sufficient strength is sensi-tive to the stimulus duration. The membrane potential remainshyperpolarized for the entire duration of the pulse, and the de-polarization leading up to the next burst starts only after the endof the inhibition. Thus the duration of the inhibitory pulse deter-mines the delay of the following burst. In mutually inhibitorynetworks, this mode of oscillation is called “release” as opposedto the “escape” mode in which the rebound mechanism of the
oscillator is strong enough to overcome the ongoing synapticinhibition and initiate the next burst, which in turn inhibits thesource of the input and thus terminates the inhibition (Wang andRinzel, 1992; Skinner et al., 1994). In the release mode, stablepacemaker activity is most likely in a configuration in which thesource of inhibition is itself an endogenous oscillator whose bursttermination mechanism limits the duration of inhibition (Skin-ner et al., 1994). An example for a biological pacemaker circuitthat appears to be operating in release mode is the swimmingcentral pattern generator in the marine mollusk Clione limacina(Marder and Calabrese, 1996; Arshavsky et al., 1998).
One of the currents identified in Figure 3 as underlying phaseresponse saturation before the membrane potential is brought tothe synaptic reversal potential, IH, has been shown recently tosupport duration sensitivity in model neurons because of its slowdynamics (Hooper et al., 2002). Thus, this current enhances du-ration sensitivity by two different mechanisms.
Implications for network functionPhase response saturation in the model neuron suggests that thissaturation phenomenon is not unique to bursting pacemakerneurons but can occur in any periodic neuron with the appropri-ate inward current at hyperpolarized membrane potentials. Thisincludes a wide class of nerve cells, among them vertebrate neu-rons that receive their synaptic inputs from thousands of presyn-aptic neurons rather than from one or a few neurons as is typicalfor pacemakers in invertebrate motor systems. Taken at facevalue, our results would predict that a vertebrate neuron thatreceives a large number of input synapses might be less sensitiveto increases in the number of inputs if these are simultaneous butvery sensitive to changes in the number of inputs if these aretemporally spaced. Similarly, our findings support the predictionby S. Oprisan, V. Thirumalai, and C. C. Canavier (unpublishedobservations) that the effect of multiple strong inhibitory pulsesthat arrive at an oscillator at the same time will be no larger thanthe effect of one such input alone.
A remark on synaptic plasticityAnother implication that follows from our results concerns thefunctional significance of changes in synaptic strength caused byshort- or long-term facilitation and depression. Our simulationsand experiments suggest that increases or decreases in thestrength of a subset of synapses onto a neuron will not necessarilytranslate into changes in the firing pattern of that neuron. If thetotal synaptic input is strong enough to exceed the saturationconductance, increasing that strength even further or decreasingit without falling below the saturation threshold will not modifythe functional impact of the input signals on the discharge timingof the postsynaptic neuron. Activity-dependent or modulatorychanges in the temporal dynamics of postsynaptic conductancetransients that result in a change in the duration of IPSPs orEPSPs, however, would in most cases be effective in modifyingthe timing of postsynaptic spikes or bursts.
Taken together, our finding of an insensitivity of oscillatory neu-rons to changes in synapse strength above a saturation thresholdimply that the demonstration of activity-dependent or modulatorymodifications of synaptic efficacy may not always be sufficient toprove actual functional changes in the impact of a synaptic input onthe firing of the postsynaptic neuron and the network output.Rather, the activity patterns generated by neural networks are a resultof interactions between the synaptic and the cellular components ofa network. Activity-dependent or modulator-induced changes in
Prinz et al. • Neural Oscillator Sensitivity to Synapse Strength J. Neurosci., February 1, 2003 • 23(3):943–954 • 953
neural network output can therefore not necessarily be understoodby examining either synaptic or cellular components alone.
ReferencesAbbott LF, Nelson SB (2000) Synaptic plasticity: taming the beast. Nat Neu-
rosci [Suppl] 3:1178 –1183.Abramovich-Sivan S, Akselrod S (1998) A single pacemaker cell model
based on the phase response curve. Biol Cybern 79:67–76.Arshavsky YI, Deliagina TG, Orlovsky GN, Panchin YV, Popova LB, Sadreyev
RI (1998) Analysis of the central pattern generator for swimming in themollusk Clione. In: Neuronal mechanisms for generating locomotor ac-tivity, pp 51– 69. New York: New York Academy of Sciences.
Ayali A, Harris-Warrick RM (1999) Monoamine control of the pacemakerkernel and cycle frequency in the lobster pyloric network. J Neurosci19:6712– 6722.
Ayali A, Johnson BR, Harris-Warrick RM (1998) Dopamine modulatesgraded and spike-evoked synaptic inhibition independently at single syn-apses in pyloric network of lobster. J Neurophysiol 79:2063–2069.
Ayers J, Selverston AI (1984) Synaptic perturbation and entrainment of gas-tric mill rhythm of the spiny lobster. J Neurophysiol 51:113–125.
Ayers JL, Selverston AI (1979) Monosynaptic entrainment of an endoge-nous pacemaker network: a cellular mechanism for von Holt’s magneteffect. J Comp Physiol 129:5–17.
Benson JA (1979) Burst reset and frequency control of the neuronal oscilla-tors in the cardiac ganglion of the crab, Portunus sanguinolentus. J ExpBiol 87:285–313.
Brown G, Eccles J (1934) The action of a single vagal volley on the rhythm ofthe heart beat. J Physiol (Lond) 82:211–241.
Demir SS, Butera Jr RJ, DeFranceschi AA, Clark Jr JW, Byrne JH (1997)Phase sensitivity and entrainment in a modeled bursting neuron. BiophysJ 72:579 –594.
Elson RC, Selverston AI, Abarbanel HDI, Rabinovich MI (2002) Inhibitorysynchronization of bursting in biological neurons: dependence on synap-tic time constant. J Neurophysiol 88:1166 –1176.
Ermentrout B (1996) Type I membranes, phase resetting curves, and syn-chrony. Neural Comput 8:979 –1001.
Goldman MS, Golowasch J, Marder E, Abbott LF (2001) Global structure,robustness, and modulation of neuronal models. J Neurosci21:5229 –5238.
Harris-Warrick RM, Marder E, Selverston AI, Moulins M (1992) Dynamicbiological networks. The stomatogastric nervous system. Cambridge,MA: MIT.
Hooper SL, Marder E (1987) Modulation of the lobster pyloric rhythm bythe peptide proctolin. J Neurosci 7:2097–2112.
Hooper SL, Buchman E, Hobbs KH (2002) A computational role for slowconductances: single-neuron models that measure duration. Nat Neuro-sci 5:552–556.
Huguenard JR, McCormick DA (1992) Simulation of the currents involvedin rhythmic oscillations in thalamic relay neurons. J Neurophysiol 68:1373–1383.
Johnson BR, Harris-Warrick RM (1990) Aminergic modulation of gradedsynaptic transmission in the lobster stomatogastric ganglion. J Neurosci10:2066 –2076.
Johnson BR, Harris-Warrick RM (1997) Amine modulation of glutamateresponses from pyloric motor neurons in lobster stomatogastric ganglion.J Neurophysiol 78:3210 –3221.
Johnson BR, Peck JH, Harris-Warrick RM (1994) Differential modulationof chemical and electrical components of mixed synapses in the lobsterstomatogastric ganglion. J Comp Physiol [A] 175:233–249.
Kamiya H (2002) Kainate receptor-dependent presynaptic modulation andplasticity. Neurosci Res 42:1– 6.
Kandel ER (2001) The molecular biology of memory storage: a dialoguebetween genes and synapses. Science 294:1030 –1038.
Lessmann V (1998) Neurotrophin-dependent modulation of glutamatergic
synaptic transmission in the mammalian CNS. Gen Pharmacol31:667– 674.
Liu Z, Golowasch J, Marder E, Abbott LF (1998) A model neuron withactivity-dependent conductances regulated by multiple calcium sensors.J Neurosci 18:2309 –2320.
Marder E (1998) From biophysics to models of network function. Annu RevNeurosci 21:25– 45.
Marder E, Calabrese RL (1996) Principles of rhythmic motor pattern gen-eration. Physiol Rev 76:687–717.
Paulsen O, Sejnowski TJ (2000) Natural patterns of activity and long-termsynaptic plasticity. Curr Opin Neurobiol 10:172–179.
Perkel DH, Schulman JH, Bullock TH, Moore GP, Segundo JP (1964) Pace-maker neurons: effects of regularly spaced synaptic input. Science145:61– 63.
Pinsker HM (1977a) Aplysia bursting neurons as endogenous oscillators. I.Phase-response curves for pulsed inhibitory synaptic input. J Neuro-physiol 40:527–543.
Pinsker HM (1977b) Aplysia bursting neurons as endogenous oscillators. II.Synchronization and entrainment by pulsed inhibitory synaptic input.J Neurophysiol 40:544 –556.
Pinsker HM, Kandel ER (1977) Short-term modulation of endogenousbursting rhythms by monosynaptic inhibition in Aplysia neurons: effectsof contingent stimulation. Brain Res 125:51– 64.
Pinto RD, Elson RC, Szucs A, Rabinovich MI, Selverston AI, Abarbanel HD(2001) Extended dynamic clamp: controlling up to four neurons using asingle desktop computer and interface. J Neurosci Methods 108:39 – 48.
Poo MM (2001) Neurotrophins as synaptic modulators. Nat Rev Neurosci2:24 –32.
Prinz AA, Thirumalai V, Marder E (2002) Changes in synaptic strengthdon’t always change functional synaptic efficacy: dynamic clamp andmodeling show that the phase response curve (PRC) of pacemaker neu-rons in the stomatogastric ganglion is more sensitive to input durationthan strength. FENS Abstr 1:A146.119.
Sharp AA, O’Neil MB, Abbott LF, Marder E (1993a) The dynamic clamp:artificial conductances in biological neurons. Trends Neurosci16:389 –394.
Sharp AA, O’Neil MB, Abbott LF, Marder E (1993b) Dynamic clamp:computer-generated conductances in real neurons. J Neurophysiol69:992–995.
Skinner FK, Kopell N, Marder E (1994) Mechanisms for oscillation andfrequency control in reciprocal inhibitory model neural networks. J Com-put Neurosci 1:69 – 87.
Song S, Miller KD, Abbott LF (2000) Competitive Hebbian learningthrough spike-timing-dependent synaptic plasticity. Nat Neurosci3:919 –926.
Swensen AM, Marder E (2000) Multiple peptides converge to activate thesame voltage-dependent current in a central pattern-generating circuit.J Neurosci 20:6752– 6759.
Thirumalai V (2002) Implications of cotransmission and neuromodulationfor neural network function. PhD thesis, Brandeis University.
Turrigiano GG, LeMasson G, Marder E (1995) Selective regulation of cur-rent densities underlies spontaneous changes in the activity of culturedneurons. J Neurosci 15:3640 –3652.
Turrigiano GG, Leslie KR, Desai NS, Rutherford LC, Nelson SB (1998)Activity-dependent scaling of quantal amplitude in neocortical neurons.Nature 391:892– 896.
Vogt KE, Regehr WG (2001) Cholinergic modulation of excitatory synaptictransmission in the CA3 area of the hippocampus. J Neurosci 21:75– 83.
Wang X-J, Rinzel J (1992) Alternating and synchronous rhythms in recip-rocally inhibitory model neurons. Neural Comp 4:84 –97.
Weimann JM, Skiebe P, Heinzel H-G, Soto C, Kopell N, Jorge-Rivera JC,Marder E (1997) Modulation of oscillator interactions in the crab sto-matogastric ganglion by crustacean cardioactive peptide. J Neurosci17:1748 –1760.
Winfree AT (1980) The geometry of biological time, Ch 30. New York:Springer.
Zucker RS, Regehr WG (2002) Short-term synaptic plasticity. Annu RevPhysiol 64:355– 405.
954 • J. Neurosci., February 1, 2003 • 23(3):943–954 Prinz et al. • Neural Oscillator Sensitivity to Synapse Strength