30
Discussion Papers no. 115 • Statistics Norway, April 1994
Leif Andreassen,Dennis Fredriksen and Olav Ljones
The Future Burden of PublicPension BenefitsA Microsimulation Study
AbstractThe microsimulation model MOSART is used to analyse the long run development in disabilityand old-age pensions covered by the Norwegian National Insurance System. The number ofpensioners will increase relative to the number of workers, leading to a growing tax burden onfuture generations. It is found that among those bom before the year 2000, early generationspossess a larger pension wealth (the discounted value of payments and received benefits) as aper cent of life time labour income than later generations. The paper discusses changes in therules for determining pension benefits and the consequences of going from a pay-as-you-gosystem to a funded system.
Keywords: Disability, demography, microsimulation, pension benefits.
JEL classification: HS, J1
Acknowledgement We a re grateful to Marie W. Ameberg for valuable comments and to theNational Insurance Administration for letting us use their registers on pension entitlements.Financial support from Norges Råd for Anvendt Forskning (NORAS) is acknowledged.
Correspondence: Leif Andreassen, Statistics Norway, Research Department,P.O.Box 8131 Dep., 0033 Oslo. E-mail: [email protected]

1. Introduction
In many countries there is an ongoing debate about the modern welfare state. In a welfarestate the government takes explicit responsibility for creating social justice, reducingpoverty and creating a stable economic environment. This usually entails active govern-ment intervention in the economy, a large government sector providing goods and serv-ices and comprehensive redistributive programs. To some extent the welfare statesdeveloped in the Scandinavian countries have achieved these aims. However, the recentpast has also revealed some of the negative effects of a comprehensive welfare state. Itnecessitates relatively high taxes (and/or large public sector deficits) and leads tonegative supply effects. It has also been argued that the total redistribution effects of thewelfare state are in reality fairly small.
An effect of the welfare state is to divide the population into receivers and contributorsof government funds. If the number of receivers or the value of the transfers to the re-ceivers grows rapidly, the tax-burden on the contributors can become politically un-acceptable. In particular, social security systems in countries facing low fertility rates andan ageing population represent a growing burden on government budgets.
This paper analyzes the future burden of public pension benefits in Norway. It focuseson the public pensions received by the disabled and the retired in relation to the contri-butions to the social security system from those in the labour force. The pension systemis formally a pay-as-you-go system, where pensions are determined by legal rules basedon each individual's income history. The pension system also has some built-in in-dexation.
The analysis is based on the microsimulation model MOSART 1 . One of the advantagesof using a microsimulation model in the present context is that it produces individual lifehistories which are important when calculating pension benefits and entitlements. Thepaper discusses how different immigration rates, labour force participation rates and dis-ability propensities in the long run influence the labour force and the soci al securitysystem. The paper also considers how the social security system redistributes incomeacross generations (cohorts).
1. MOSART is a Norwegian acronym for Model for Microsimulation of Schooling, Labour Supply and Pensions(MOdell for mikrosimulering av Skolegang, ARbeidstilbud og Trygd).
2

Figure 1. Simulation modelIncludeCurrent year = Base year (1989)Simulation parametersTransition probabilitiesInitial population
Current year = Current year + 1
Simulate this year
Changes in population sizeInclude new 16-years oldInclude new immigrantsSimulate emigrationsSimulate mortality
Simulate births and mar riage/divorce
Simulate educational activities
Simulate disability and retirement
Labour force par ticipationProject labour force and man-hours workedAdjust individual probabilities of workingSimulate labour force participationSimulate labour market earnings
I Compute pension benefits
I Model population 1967/1990-2050
2. Model description
The MOSART model is a dynamic cross-sectionalstochastic microsimulation model which projectspopulation size and composition, labour force,educational level and future pension benefits. Itincludes the events immigration and emigration,death, births, marriage, divorce, education, dis-ability, retirement, labour force participation andlabour market earnings. An overview of theMOSART model is given in figure 1, while table 1lists the events which are simulated along with thevariables that each event depends on.
The present version of the model simulates lifehistories for a 1 per cent sample of the Norwegianpopulation 16 years and older. This gives us amodel population of 30 000-35 000 individuals ineach simulation year. It is possible to simulate alarger sample, but we have chosen this level toachieve acceptable computing times (a total ofabout 4.5 hours of CPU-time). This version of themodel is an expanded version of the model pre-sented in Andreassen (1993) and Andreassen et al.(1993).
The MOSART model is a discrete time model, with one year intervals and has a re-cursive structure. The simulation proceeds one year at a time, simulating all events whichoccur for all individuals during that year. This procedure enables us to keep track of thelink between spouses and to set constraints on some aggregate totals for each year. Ascan be seen from figure 1 and table 1, the simulation is sequential with later events to alarge degree depending on earlier events. Transition probabilities are estimated as con-ditional probabilities, dependent on the events which are simulated earlier. This enablesus, to a certain degree, to take into account competing risk.
For each year the model first supplements the model population with new 16-years-oldand immigrants, and simulates emigration and mortality. Then births are simulated,followed by marriage and divorce. After the above demographic events are simulated,the model simulates educational activity, disability and retirement. Finally labour forceparticipation and labour incomes are simulated depending on most of the events simu-lated earlier that year.
The simulation in the present version of the model goes from 1990 to 2050, withhistorical data going back to 1967. This results in a very large output which is sorted andorganized ontor indvidual life histories after the simulation is finished. These post-
3
Table 1: Processes represented in the MOSART modelProcess or Event Conditional Upon
Death
Age, sex, disability
Fertility (women)
Marriage (female dominant)
Age, parity, age of youngest child,
Women's age and marital status (unmarried, divorced orwidow) and whether the woman has children
Husband's age depends upon woman's age
Wife's age
Age, sex, educational attainment, current educational activity
Age, sex, educational attainment, marital status, labour forceparticipation in the preceding year
Happens at age 67 for all individuals (approximately)
Age, sex, educational attainment, whether an individual is astudent, disability, labour force status in the preceding year,labour force attachment (a measure of the stability of labourforce participation in the preceding years), ma rital status.In addition for women: the number of children and age ofyoungest child
Matching with a husband
Divorce (female dominant)
Education
Entry into disability
Retirement
Labour force participationLabour market earnings
simulation routines also include calculation of pension benefits and production of tableswith aggregate figures.
The MOSART model is mainly a demographic model where educational transition prob-abilities, the transition into disability, labour force participation rates and labour marketearnings only depend on demographic variables. An important feature of the model is thelarge initial population with no synthetically generated (simulated) variables.
A model which has many similarities with the MOSART model is the Dutch dynamiccross-sectional model NEDYMAS, described in Nelissen and Vossen (1989) andNelissen (1991).
2.1. The initial populationThe initial population is a 1 per cent random sample of the Norwegian population 16years and older in the base year 1989, and includes about 33 000 individuals. The sampleis drawn stratified by age, sex and marital status. Married couples are drawn together andare linked together during the simulation. We have produced ten disjunct initial popu-lations each covering 1Ør cent of the total population. We thus have access to a 10 percent sample when we estimate transition probabilities. To avoid estimation bias, thissample includes 10 per cent of all individuals who have died or emigrated since 1967.
The initial population and the larger 10 per cent sample are the result of mergingdifferent data registers. From the Central Population Register we get female birthhistories and information on each individual's sex, age, marital status, and for immigrantsyear of entry into Norway. From the Educational Register in Statistics Norway we get
4
educational attainment and activities since 1985. Data from registers in the National In-surance Administration show whether a person is a recipient of old age-, disability- orwidow pension for each year since 1985 and also existing pension entitlements based onannual labour market earnings since 1967 (first year of the National Insurance System).
2.2. Demographic transitionsThe number of new 16-year-olds added to the model population each simulation year canØ determined in two ways. One can use the number of births simulated in the model,and thus make an endogenous population projection. Or one can use an exogenousnumber of new 16-year-olds, for example from the official population projection fromStatistics Norway. New 16-year-olds are assigned the starting-values of unmarried,childless, non-disabled, non-working and just left primary school.
The total number of net immigrants is specified exogenously in the model and dividedinto groups by age and sex. We also simulate womens birth histories and marriageamong immigrants using probabilities which characterize the Norwegian population as awhole. This reflects the fact that immigrants in the model are assumed to exhibit be-haviour with the same probability structure as non-immigrants. This is done for simplici-ties sake, since data on immigrants at present is limited. The educational attainment forimmigrants is set to "unknown", as in the educational statistics. If we are faced with netemigration in some age groups, the model draw individuals from the sample who thenare assumed to emigrate.
Mortality is simulated dependent on age and sex. If a married person dies, the survivingspouse is made a widow or widower. Disability pensioners have substantially highermortality rates than others, and we have as an option the possibility of increasing theirmortality by a fixed per cent. The mortality of non-disabled is in this case reduced en-dogenously to make aggregate mortality unchanged. Mortality is in the present versionindependent of marital status and educational attainment, assumptions that are open forimprovements.
After mortality and migration, the model simulates births and changes in marital status.Giving birth is simulated using probabilities which depend on the women's age, thenumber of children and the age of the youngest child. These fertility probabilities aremainly independent of marital status, but unwed mothers are exposed to increased prob-abilities of marrying. This assumption is to some extent a reflection of the large pro-portion of couples cohabitating without being married.
Simulation of marriage and divorce is female dominated based on marriage and divorceprobabilities for females. Marriage is simulated with probabilities that depend on thewoman's age, whether she recently has born a child and on her marital status (unmarried,divorced or widow). If a woman marries, the model draws the age of her spouse withprobabilities depending on the woman's own age and then randomly draws a spouseamong all unmarried males of this age. This implies that the marriage probability of aman will be the same whether he is unmarried, divorced or widower. If a woman is
5

drawn to divorce, her husband will also be divorced. We assume that it is only possibleto change marital status once a year.
2.3. EducationThe MOSART model simulates for each individual year by year educational activitiesand the resulting influence on educational attainment. The transition probabilitiesthrough the educational system depend only on age, sex, educational attainment andeducational activity in the previous year. Education is described by level and subject.Educational level is divided into one-year steps and educational subjects are gathered inrelatively large groups, where we separate between health subjects, technical subjectsand administrative subjects at all levels. The transition probabilities have been estimatedon all educational transitions in Norway between the school years 1986/87 and 1987/88.The number of pupils and students in Norway has increased dramatically since 1988,perhaps related to the rise in unemployment. To take this into account we have adjustedthe estimated probabilities so that the model simulates the observed number of pupilsand students in 1991.
About 90 per cent of those leaving primary school continue directly into secondaryschool, with 40 per cent choosing gymnasium. The flow through the educational systemis seemingly slow, characterized by movements across subjects and fairly low pro-gression. This is especially the case for higher education and vocational training. Lowprogression in vocational training is caused by a combination of good capacity in basiccourses and low capacity in final courses. On the basis of estimated transition prob-abilities for education from 1987, about 40 per cent of all individuals experiencing theseprobabilities will attain an higher education (post-secondary) during their lifetime, andabout 40 per cent will end up with a three-year vocational training. The increase in thenumber of pupils and students since 1987 will probably lead to a substantially higherproportion of the population attaining higher education.
2.4. Old age and disability pensionsPublic old age pensions, disability pensions and pensions for widows and widowers arein Norway organized through the National Insurance System. This version of theMOSART model simulates the number of recipients under these three programmes andalso calculates the corresponding pension benefits. The intention of these programmes isboth to secure a minimum level of income and ensure pensions which are related to pre-vious labour market earnings. The calculation of these benefits is rather complex and ispresented in more detail in appendix A.
The key to understanding the National Insurance System is the socalled basic pensionunit (BPU), an amount of nominal Norwegian Krone. The BPU is increased every yearto compensate for inflation and to some degree real income growth. The BPU is alsoused to calculate the upper limit for earning pension entitlements.
The main features of the pension system are that all pensioners are guaranteed a mini-mum pension, which is about one-third of average full time labour market earnings.Most pensioners also receive an additional pension depending on average labour market
6

earnings during their working years. These pension entitlements are roughly calculatedby dividing labour income each year by the BPU that year. As pensioners, the additionalpension is calculated by multiplying a predetermined fraction of the current pensionentitlements by the current BPU.
The after tax pension/wage-ratio decreases with income, and is with stable labour marketearnings around 80 per cent with an income of 100 000 Nkr and 50 per cent with an in-come of 300 000 Nkr. The National Insurance System was established in 1967 and it isonly earnings obtained after this year which qualify for the additional pension. Thisimplies that average entitlements will keep on growing well into the next century.People 70 years and older receive old age pensions independent of other sources of in-come, while people of age from 67 to 69 have their pensions means-tested against labourmarket earnings. The fact that 90 per cent retire at the age of 67 simplifies the simulationof retirement2 . Widow pensions cover mainly widows with low labour market earnings 3 .The simulation of such pensions is therefore closely connected with the simulation ofmarital status and labour force participation.
Disability pensions are granted to all people with a permanently reduced working abilityof at least 50 per cent caused by disease or accident. Once a person is granted disabilitypension, it is common to remain a disability pensioner until she or he reaches the age of67 (and is transferred to old age pension) or dies. Working ability is measured relative toa person's opportunities in the labour market. At the end of the eighties the medicalclaims had become rather open and included more or less any kind of long termproblems in the labour market. This included problems such as alcoholism, stress syn-dromes and long term unemployment. In many c ases disability pension has been(mis)used to enable elderly workers to retire earlier than the official retirement age of 67.In 1990 about 8.5 per cent of the population in the age group of 16 to 66 years received adisability pension, and by the age of 65 to 66 years about 45 per cent received a dis-ability pension. During the very last years there has been a tightening of the criteria forbeing disabled and a reduction in the number of new disability pensioners. It is too earlyto see the long term effects of this, since there has been an increase in the number ofpersons in situations which commonly lead to disability pension (for example work re-habilitation and long term unemployment).
The transitions into disability depend on sex, age, educational attainment, marital statusand labour force participation. The probabilities are represented by a logit function andare estimated on the same 10 per cent sample of the population as the initial population isbased on. Data on transitions into disability pensioner is here available for the years 1986to 1989.
2. Certain occupational groups have a lower retirement age, but not through the National Insurance System. Duringthe last years there has been established a scheme for general retirement at 64 for members of the main labourmarket organisations.
3. In principle men can also receive this type of pension, but few men become widowers before the age of 67.Additionally the widow and widowers pension is means-tested, and most men earn more than the maximum limit.
7

2.5. Labour force participationSimulation of yearly labour force participation is intended to both give a projection ofthe labour force and of the pension entitlements earned in the future. Lack of good datacovering both the labour force and labour market earnings has lead us to use twodifferent types of simulation of labour force participation based on two differentdefinitions of labour force pa rticipation. One definition is the one usually used by labourforce surveys, namely the yearly average number of persons in the labour force. Theother definition is the total number of persons who have been in the labour force at anypoint of time during the year. This last definition corresponds to the data we have forlabour income4 in the data registers of the National Insurance System.
These two definitions of labour force participation are related by the probability that aperson with labour income during the year also will be a pa rt of the labour force at anygiven time during that same years. This probability can be interpreted as the share of theyear a person works. The two definitions vary in the extent to which they capture pupils,students and pensioners participating only in seasonal work during holidays and va-cations.
The first type of simulation is based on data from the Norwegian Labour Force Surveys.The model computes the expected labour force pa rticipation rate and working hours ofeach individual. By adding across all individuals in the model population, the modelproduces a projection of the labour force and man-hours worked. The labour force par-ticipation rates and average working hours are estimated from the Labour Force Surveysin 1991, and depend on sex, age, educational activities and attainments, disability,marital status, number of children and age of youngest child. Labour force participationrates are in the present version assumed constant throughout the simulation period. Theprojection thus shows the effect on the labour force of changes in the size and corn-position of the population.
The second type of simulation simulates exits from and entries into the state of havingpositive labour income during the year. These transition probabilities are dependent onage, sex, educational activities and attainments, disability, stability of labour force par-ticipation in preceding years, marital status, number of children and age of youngestchild. They are estimated using a logit function on our 10 per cent sample of theNorwegian population for the years 1985-1988. Consistency between the two types ofsimulation is ensured by letting the first type determine the level of the total labour forceand man-hours worked, while the second type determines the distribution of labour forceparticipation across the population. The transition probabilities used in the second simu-lation are adjusted to make the expected number of individuals with labour income con-sistent with the projected labour force of the first simulation. This is done using analgorithm ensuring that the individual differences in the probability of having labour in-come during the year are maintained.
4. This is the sum of wages, income of the self-employed, sick leave benefits, unemployment benefits and maternityleave benefits during each year.
5. We have excluded the possibility of a person without labour income being a part of the labour force, for exampleyoung unemployed without previous work experience and therefore no unemployment benefits.
8

Distribution of labour incomeSimulation of labour income is based on the distribution of income among individualsand is estimated by using OLS on our 10 per cent sample of the Norwegian populationduring the years 1985-1988. Our estimates are based only on persons with positivelabour income during the year (i.e. more than 1 000 Nkr). The model can be written:
log Yit = XitR + Uit, (1)
where Yit represents labour income during year t for individual i and Uit is a disturbanceterm. The vector of explanatory variables, Xit, includes age, sex, educational activity andattainment, disability, whether an individual the same year has entered or left 6 the stateof having labour income, stability of labour force participation in the preceding years,marital status, number of children and the age of the youngest child. Labour income issimulated by using (1) and an adjustment term k in the following manner:
Y t =k • EXP(XiØ+ i) ,
(2)
where ci is a fixed residual spesific for each individual and is the OLS estimate fromequation (1). Ei does not vary over time, but has the same distribution across individualsas the disturbance term U it. The chosen specification of the residual ei gives an incomedistribution similar to the observed income distrubution in our 10 per cent sample of theNorwegian population over the years 1967-1989. The adjustment term k is set so that thefollowing condition is satisfied:
EiYsit = Wt • He (3)
where Wt is an exogenous given wage level and H t is projected man-hours from thesimulation. This implies that (2) only gives a description of the income distribution, andthat the average full-time labour income is set outside the model.
3. The National Insurance System in the long run
In our analysis we use a base line projection together with several alternative projections.These alternative projections are simulations using different levels of the most importanttransition rates and of other exogenous variables such as net immigration. This gives anindication of how sensitive our results are to changes in current behaviour.
3.1. The base line projectionIn table 2 we have summarized the main assumptions underlying the b ase line projection.The most important demographic assumptions concern immigration, death, and fertility.
6. We assume that an individual leaves the state of having labour income in the year before labour income becomezero.
9
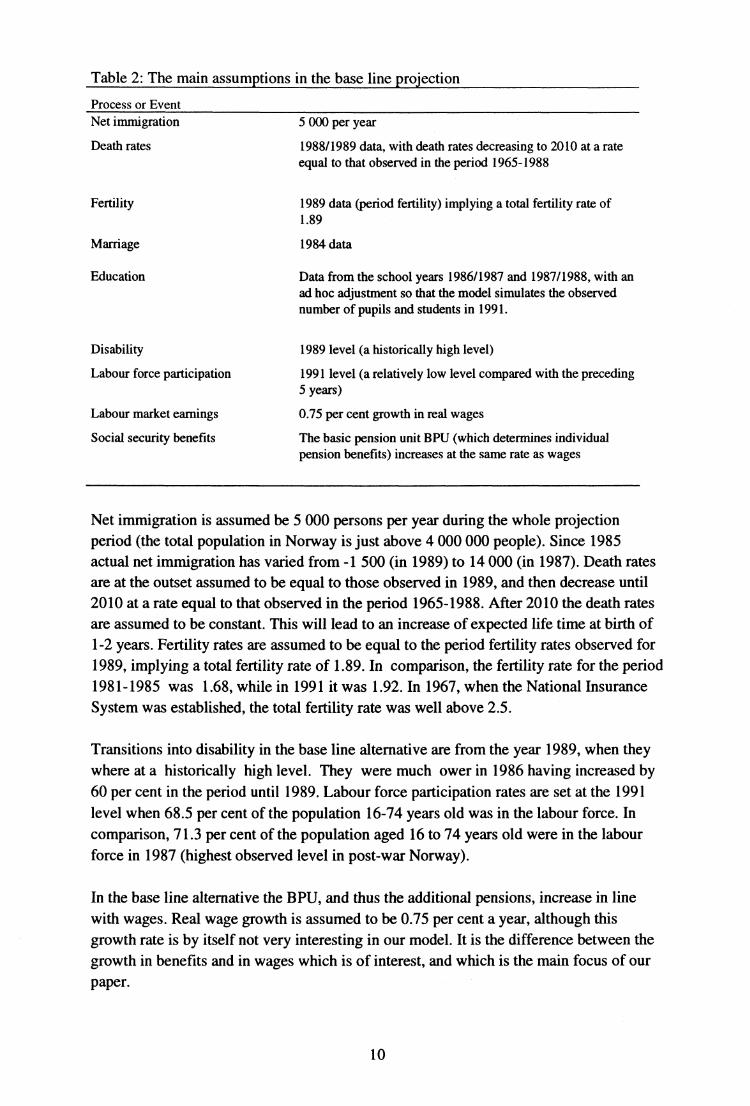
Table 2: The main assumptions in the base line projection
Process or EventNet immigration
Death rates
Fertility
5 000 per year
1988/1989 data, with death rates decreasing to 2010 at a rateequal to that observed in the period 1965-1988
1989 data (period fertility) implying a total fertility rate of1.89
Marriage
1984 data
Education
Disability
Labour force participation
Labour market earnings
Social security benefits
Data from the school years 1986/1987 and 1987/1988, with anad hoc adjustment so that the model simulates the observednumber of pupils and students in 1991.
1989 level (a historically high level)
1991 level (a relatively low level compared with the preceding5 years)
0.75 per cent growth in real wages
The basic pension unit BPU (which determines individualpension benefits) increases at the same rate as wages
Net immigration is assumed be 5 000 persons per year during the whole projectionperiod (the total population in Norway is just above 4 000 000 people). Since 1985actual net immigration has varied from -1 500 (in 1989) to 14 000 (in 1987). Death ratesare at the outset assumed to be equal to those observed in 1989, and then decrease until2010 at a rate equal to that observed in the period 1965-1988. After 2010 the death ratesare assumed to be constant. This will lead to an increase of expected life time at birth of1-2 years. Fertility rates are assumed to be equal to the period fertility rates observed for1989, implying a total fertility rate of 1.89. In comparison, the fertility rate for the period1981-1985 was 1.68, while in 1991 it was 1.92. In 1967, when the National InsuranceSystem was established, the total fertility rate was well above 2.5.
Transitions into disability in the base line alternative are from the year 1989, when theywhere at a historically high level. They were much ower in 1986 having increased by60 per cent in the period until 1989. Labour force participation rates are set at the 1991level when 68.5 per cent of the population 16-74 years old was in the labour force. Incomparison, 71.3 per cent of the population aged 16 to 74 years old were in the labourforce in 1987 (highest observed level in post-war Norway).
In the base line alternative the BPU, and thus the additional pensions, increase in linewith wages. Real wage growth is assumed to be 0.75 per cent a year, although thisgrowth rate is by itself not very interesting in our model. It is the difference between thegrowth in benefits and in wages which is of interest, and which is the main focus of our
paper.
10
E 4,5
a 4,6c
ô 4,7
o
Figure 2. Population projectionsunder different demographic assumptions
5,2
4,9
4,8
5,1
4,4
4,3
4,2
4,1
5
41990
-
_
_
_
Net irnmigratiorl=10000II
. . . • 4. , ^,
,•^-•,^•^' i
',...,/ Totali
.^
„ r..-•^- ••- ••-
fertility
_.- "' -'"• - •.-••- ••-
Pate=2.06
.^. • 'i,•
-..
-
,^..,„'/'^
•. •,i/
Base line altemative: />-
Total fertility rate=1.68 • ''•_ ♦ ^ ••.
♦ '••.
_♦ '
,
2000 2010 2020Year
2030 2040 2050
Figure 3. Labour force projectionsunder different demographic assumptions
2,6
2,5
2,4
2,1
1,91990
2
-
_
-.'
^
. . . •
,,•-,
^ ^”'
'
Net ir•^migration10000...
^..• ..r^ 1^^
To......••.
_
,^,
^'•
al fertility
-^^,.-•'/
-• ^
'/
/
rate=2.06
-. ;
Base line alternative
_ .'s •^^^ ^
' ^ ■ i' ..... ........ .• ^ ♦ •^ .._ • #i,;■♦ ,,..^
. ,..••••.::•
•• •...,,
,.••••' Net.
mmigration=0^•• '''•
^' ^'•. •; N'••
^.•.,4
- '44,(44..
•. .
-
Total fertility rate=1.68♦ ^ • "••..,•
•■,
•
2000 2010 2020Year
2030 2040 2050
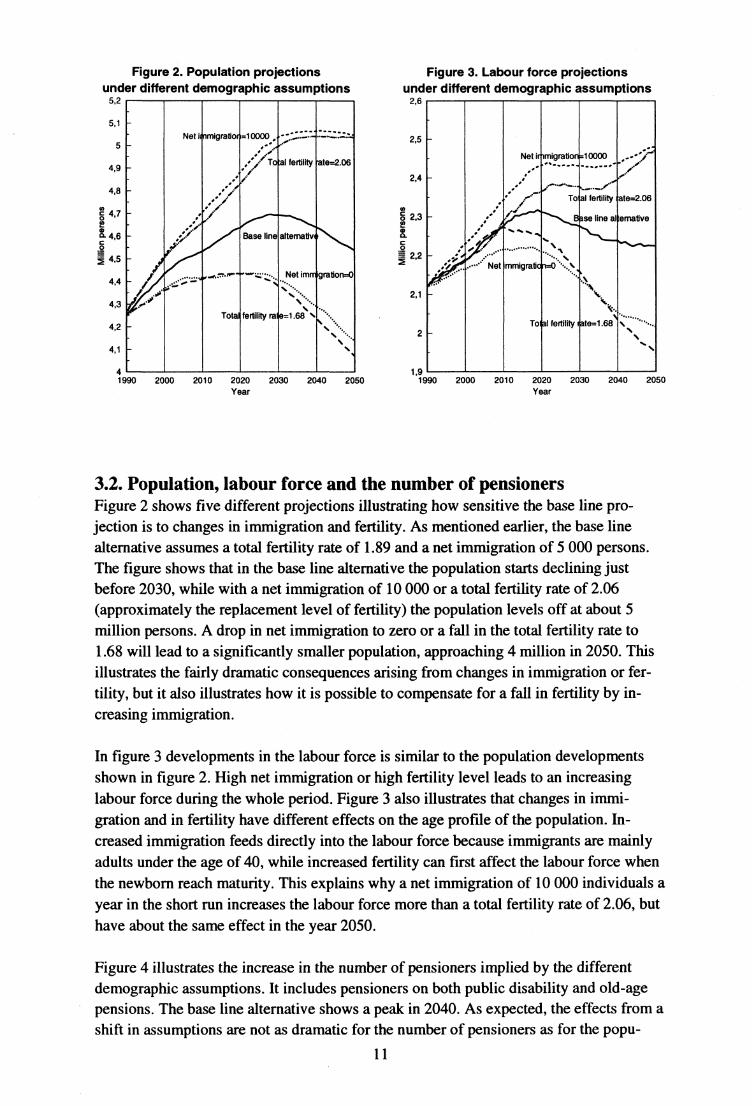
3.2. Population, labour force and the number of pensionersFigure 2 shows five different projections illustrating how sensitive the base line pro-jection is to changes in immigration and fertility. As mentioned earlier, the base linealternative assumes a total fertility rate of 1.89 and a net immigration of 5 000 persons.The figure shows that in the base line alte rnative the population starts declining justbefore 2030, while with a net immigration of 10 000 or a total fertility rate of 2.06(approximately the replacement level of fertility) the population levels off at about 5million persons. A drop in net immigration to zero or a fall in the total fertility rate to1.68 will lead to a significantly smaller population, approaching 4 million in 2050. Thisillustrates the fairly dramatic consequences arising from changes in immigration or fer-tility, but it also illustrates how it is possible to compensate for a fall in fertility by in-creasing immigration.
In figure 3 developments in the labour force is similar to the population developmentsshown in figure 2. High net immigration or high fertility level leads to an increasinglabour force during the whole period. Figure 3 also illustrates that changes in immi-gration and in fertility have different effects on the age profile of the population. In-creased immigration feeds directly into the labour force because immigrants are mainlyadults under the age of 40, while increased fertility can first affect the labour force whenthe newborn reach maturity. This explains why a net immigration of 10 000 individuals ayear in the short run increases the labour force more than a total fertility rate of 2.06, buthave about the same effect in the year 2050.
Figure 4 illustrates the increase in the number of pensioners implied by the differentdemographic assumptions. It includes pensioners on both public disability and old-agepensions. The base line alternative shows a peak in 2040. As expected, the effects from ashift in assumptions are not as dramatic for the number of pensioners as for the popu-
11

1,3
1,2
0,9
0,7
A
BCD
E
0,6
0,5
;) 0,4mcocå 0,3
0,2
0,1
0
Figure 4. The number of pensionersunder different demographic assumptions
1,4
0,81990
....
-
_.
.....':S
: ^.
• ...
••`
.••'•
: ^.,...i^^..^. •
^•
••,--•.....
.,• • .
•.
` ^ ^■^N ••r
^. ^. ••,.•,'' '.
- • . ••..
- •:
_ ..•
.e"
.•
Figure 5. The number of pensionersper worker
-
-
^
er^. ^•••^r,,,,,,"..r---.
..^,^.,..i •• •',..
f--^...,•
• ••
B ■
'••••. •••..
• •-.^ .^r `.•`"' 1
^..^.... ,++ ^
.....'• . -'"
,..,;; ...._- ..__.
A
CDE
2000 2010 2020Year
2030 2040 2050 1990 2000 2010 2020Year
2030 2040 2050
A. Net immigration = 10000
A. Total fertility rate = 1.68B. Total fertility rate = 2.06
B. Net immigration = 0C. Base line alternative
C. Base line alternativeD. Total fertility rate = 1.68
D. Net immigration = 10000E. Net immigration = 0
E. Total fertility rate = 2.06
lation as a whole. This is in large part because of fertility assumptions to a very limiteddegree will affect the number of pensioners before the year 2050. Changes in immi-gration have larger consequences, because, as mentioned earlier, most immigr ants arrivein the country as adults. In 2050 the difference between the alte rnative with high and lowimmigration is almost 200 000 persons.
One of the main determinants of the burden of pension benefits is the number ofpensioners compared with the number of workers. Figure 5 gives the number ofpensioners per person in the labour force under different assumptions and shows littlechange in this dependency ratio until the year 2010. It then starts increasing about 2010and reaches a peak around 2040. In the case of a total fertility rate of 1.68 it peaks at alevel 51 per cent higher than in 1990, in the base line alternative it is 39 per cent higher,and in the case with high participation rates and low disability rates it is 23 per centhigher. If we disregard the two most extreme cases, we see that this dependency ratio in2040 lies between 43 per cent (if we have a net immigration of 0) and 31 per cent (with atotal fertility rate of 2.06) higher than in 1990. It is therefore a fairly robust conclusionthat in the first half of the next century Norway will experience a very large increase inthe number of pensioners in relationship to the number of workers.
We also see from figure 5 that changes in fertility have a greater effect on the de-pendency ratio than immigration, because fertility mainly affects the labour force and notthe number of pensioners in the period until 2050. Toward the end of the period in-creased immigration will both have increased the labour force and the number ofpensioners leading to a relatively small decrease in the number of pensioners per worker.During the later part of the century increased fertility will also lead to an increasingnumber of pensioners.
12
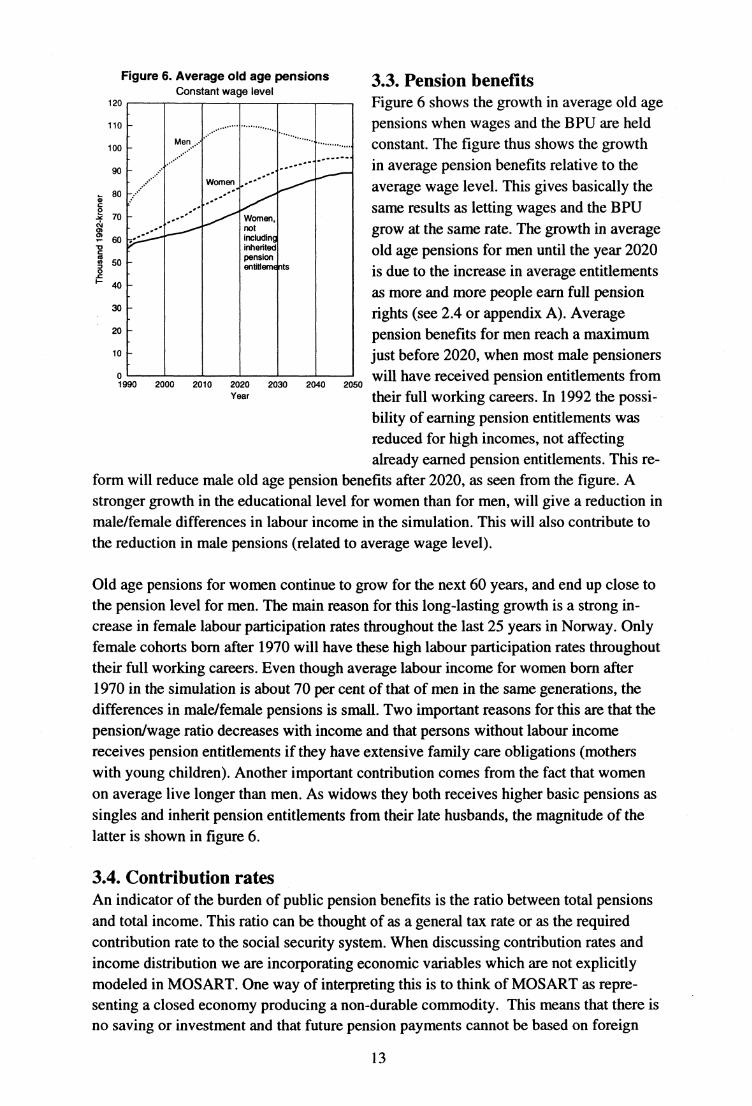
Figure 6. Average old age pensionsConstant wage level
120 -
110 -.................
Men-' ........ .• ••...100 - .•' ' ........,
90 ` '-Women ^, •'
80 ' ^
70 - ,•• Women.(NJ '' not
•cn
sp V•' includingtic inheritedal pensionc 50 - entitlements
40 -
30 -
20 -
10 -
o 1990 2000 2010 2020 2030 2040 2050
Year
3.3. Pension benefitsFigure 6 shows the growth in average old agepensions when wages and the BPU are heldconstant. The figure thus shows the growthin average pension benefits relative to theaverage wage level. This gives basically thesame results as letting wages and the BPUgrow at the same rate. The growth in averageold age pensions for men until the year 2020is due to the increase in average entitlementsas more and more people earn full pensionrights (see 2.4 or appendix A). Averagepension benefits for men reach a maximumjust before 2020, when most male pensionerswill have received pension entitlements fromtheir full working careers. In 1992 the possi-bility of earning pension entitlements wasreduced for high incomes, not affectingalready earned pension entitlements. This re-
form will reduce male old age pension benefits after 2020, as seen from the figure. Astronger growth in the educational level for women than for men, will give a reduction inmale/female differences in labour income in the simulation. This will also contribute tothe reduction in male pensions (related to average wage level).
Old age pensions for women continue to grow for the next 60 years, and end up close tothe pension level for men. The main reason for this long-lasting growth is a strong in-crease in female labour participation rates throughout the last 25 years in Norway. Onlyfemale cohorts born after 1970 will have these high labour participation rates throughouttheir full working careers. Even though average labour income for women bom after1970 in the simulation is about 70 per cent of that of men in the same generations, thedifferences in male/female pensions is small. Two important reasons for this are that thepension/wage ratio decreases with income and that persons without labour incomereceives pension entitlements if they have extensive family care obligations (motherswith young children). Another import ant contribution comes from the fact that womenon average live longer than men. As widows they both receives higher b asic pensions assingles and inherit pension entitlements from their late husbands, the magnitude of thelatter is shown in figure 6.
3.4. Contribution ratesAn indicator of the burden of public pension benefits is the ratio between total pensionsand total income. This ratio can be thought of as a general tax rate or as the requiredcontribution rate to the social security system. When discussing con tribution rates andincome distribution we are incorporating economic variables which are not explicitlymodeled in MOSART. One way of interpreting this is to think of MOSART as repre-senting a closed economy producing a non-durable commodity. This means that there isno saving or investment and that future pension payments cannot be based on foreign
13

capital income. Labour is the only production factor and labour income is the onlysource of income. Total income in the model will then be equal to the sum of labour in-come while consumption will be equal to yearly output. This leads to an interpretation ofthe MOSART model close to the overlapping generations model in Samuelson (1958).
The elderly are in this type of model completely dependent on sharing a pa rt of theworkers income. Old-age pensions represent an implicit contract where those in thelabour force (the young) care for the elderly in return for being cared for by the nextgeneration when they themselves become old. If we assume that the government is onlyconcerned with this type of redistribution, the government budget constraint will be
Pi = t Ei Wihi , (4)
where pi is the pension, wi is the wage, and hi is the number of hours worked by in-dividual i. The variable t is the contribution rate (tax rate) which is necessary for thesocial security system to be able to honor its obligations. If pensions are also taxed thisrelationship becomes
Ei pi = t (w ihi+pi). (5)
This budget balance can be interpreted as an implicit social contract. The con tributionrate t will vary over time depending on variations in average income, the size of thelabour force, and the number of old-age and disability pensioners. The future develop-ments in the number of pensioners per worker shown earlier in figure 5 and in average
Figure 7. Contribution rates Figure 8. Contribution rates
35 - 35
Base line30 - t30 - alternative
- - LM
25- 25- #-'.. ∎,.
.' ''' ' . •• M:0.75 *• -.
'.• ,.• i
-- 20 .•'^^ Equal taxes on ^, 20 - •,.-••' i^
E q sm .••• pensioners and •' # •.. ...,.,
U -••'' the employed m • ••••....,,,,^^...,........... .......... .................,...... •..
- , M:2.0
a 15 - .•'' 15 r^
10 - 10 -
5 - 5 -
0 1990 2000 2010 2020 2030 2040 20501990 2000 2010 ..2020 2030 2040 2050
Year Year
LM: Entry into disability pension reduced by one-third,1987 labour force pa rticipation rates.
M:0.75,M:2.0: BPU increases at a rate which is 0.75 and 2.0 %lower than that of wages.
14

old-age pensions in figure 6 are thereby impo rtant factors in determining the contributionrate. Figure 7 shows that the contribution rate in the base line alternative will growdramatically for the next 50 years. From a level of 17-18 per cent today, the contributionlevel will stabilize at a level just below 30 per cent.
The growth in the contribution rate during the first 20 years is caused by the maturing ofthe National Insurance system and a major increase in the number of disabilitypensioners. In this period we expect an increase in the labour force and a (slight) re-duction in the number of people older than 67 years. These sosio-demographic changeswill isolated reduce the con tribution rate. Just after 2010 the first cohorts of the post-warbaby-boom reach retirement age, and this will lead to a strong growth in the contributionrate.
Pensioners in Norway pay a premium into the National Insurance System, but at a muchlower rate than the employed 7 . This difference has to some degree been reduced since1967. Figure 7 shows the effect of equal taxation of labour income and pension benefits.This tax rate is estimated as the ratio between total pensions and the sum of totalpensions and total wages each year. The reduction related to the contribution rate islarge, especially after 2010 when pension benefit expenses increase fast.
The contribution rate is sensitive to changes in the underlying assumptions, and we canonly outline the effect of changes in a few of these assumptions. Historically, the basicpension unit (BPU) has been increased at a lower rate than the increase in wages. TheBPU, and thus the additional pensions, have mainly been increased with the general in-flation rate, while the minimum pension has increased at a slightly higher rate than wagegrowth. Figure 8 shows the development in the contribution rate if this policy is con-tinued. The BPU is increased at a rate respectively 0.75 and 2 per cent lower than wagegrowth, while minimum pensions are held constant relative to the wage level. With a realincome growth of 0.75 per cent, the first alternative is quite realistic since all pensionersat least maintain their purchasing power. Compared to the base line alternative, whereadditional pensions are increased at the same rate as wages, the impact on the con-tribution rate is considerable.
The number of new disability pensioners has been reduced since 1989, probably becausethe government has made it more difficult to be diagnosed as disabled. Compared withthe base line alternative this shows the effect if the entry rate of new disabled is held atthis lower level combined with an increase in labour participation rates to the 1987-level.Decreased entry into disability may be regarded as a policy option, and shows anotherpossibility of substantially reducing the growth in the contribution rate. The number ofdisability pensioners is reduced by one-third in the long run, showing what largevariation there has been in the entry of new disability pensioners over the last years.
7. The differences in the direct social security tax is low, but employers also pay a tax directly into the NationalInsurance System that is related to wage expenses.
15

3.5. Income transfers between generationsSocial justice is one of the basic ideas behind the welfare state. Social justice concernsboth income dis tribution and legal principles about fair and equal treatment by thegovernment.
The welfare state consists of a complex set of rules and laws that cover the concerns of avery heterogeneous population. Some of the effects of welfare state institutions arevisible immediately, but others have to be judged in a life cycle perspective. In a socialinsurance system we have to use a life cycle perspective to compare the contributionspaid with the transfers gained. Such comparisons can be made for different socio-demo-graphic groups by comparing high versus low income, male versus female or differentbirth cohorts. Comparing the contributions and gains of different birth cohorts is to someextent also the aim of the generational accounting approach such as the study done forNorway in Auerbach et al. (1993).
The complexity of the welfare state and the heterogeneity of the population makesdynamic microsimulation a very effective tool for analyzing how different populationgroups are treated by the welfare state. The microsimulation approach allows us to takeinto account in great detail the socio-demographic structure of the population and use analmost precise description of the laws and rules which apply. The weak point in ourpresent model is the modeling of economic behaviour.
In the following we try to analyse how life cycle income is influenced by a transfersystem, such as the National Insurance System, based on a pay-as-you-go social contract.We also look at whether the present system has any redistributive effects across gen-erations.
In the closed economy interpretation of MOSART discussed earlier, we have that net in-come yi for individual i in a given year will be
Yi = w;h; + p; - t(w;h;+pi). (6)
For most people either pi or wihi equals zero. The distribution of net income over eachindividuals life time depends on gross income, the tax structure and of course the ruleswhich apply in the pension system.
In the simple economy with only a non-durable good, life time income can be seen assimply the sum of yearly incomes. This is similar assumption to that used in calculatinglife-cycle earnings in Wolfsen (1988). If we leave the this simple interpretation ofMOSART and assume that there are financial markets, where it is possible to save at agiven interest rate, it is natural to discount income. A certain income earned today is ofgreater value than income earned later. The interest rate is an exogenous variable inMOSART in the same manner as average wages. These variables were in the base-lineprojection determined in a separate macroeconomic model.
16
10
5
-25
Discount rate = 0.75 %
• Discount rate = 4.0 %
_ ..^•^r•-, •
In the following we try to analyse the effect the National Insurance System has on thedistribution of income both between generations and within each generation. The keyconcept is individual pension wealth calculated as the difference between the discountedvalue of pension benefits and payments into the National Insurance System (pensionpremiums) over the life course:
Pension wealth = E t(pension benefit - pension promium)•(l +r)-t, (7)
wheret - the number of years since this person was 16 years old,
r - the discount rate.
We assume that the discount rate is equal to the real interest rate. We further assume thatthe pension premium is the estimated contribution rate discussed earlier multiplied byeach individuals labour income. This probably gives a reasonable representation of howthe National Insurance System actually has been financed. We only have full life timeincome series for persons born after 1950, making it difficult compare the pensionwealth of those born before 1950 with those born after this year. An extra complicationis the fact that there was some public pension schemes prior to 1967.
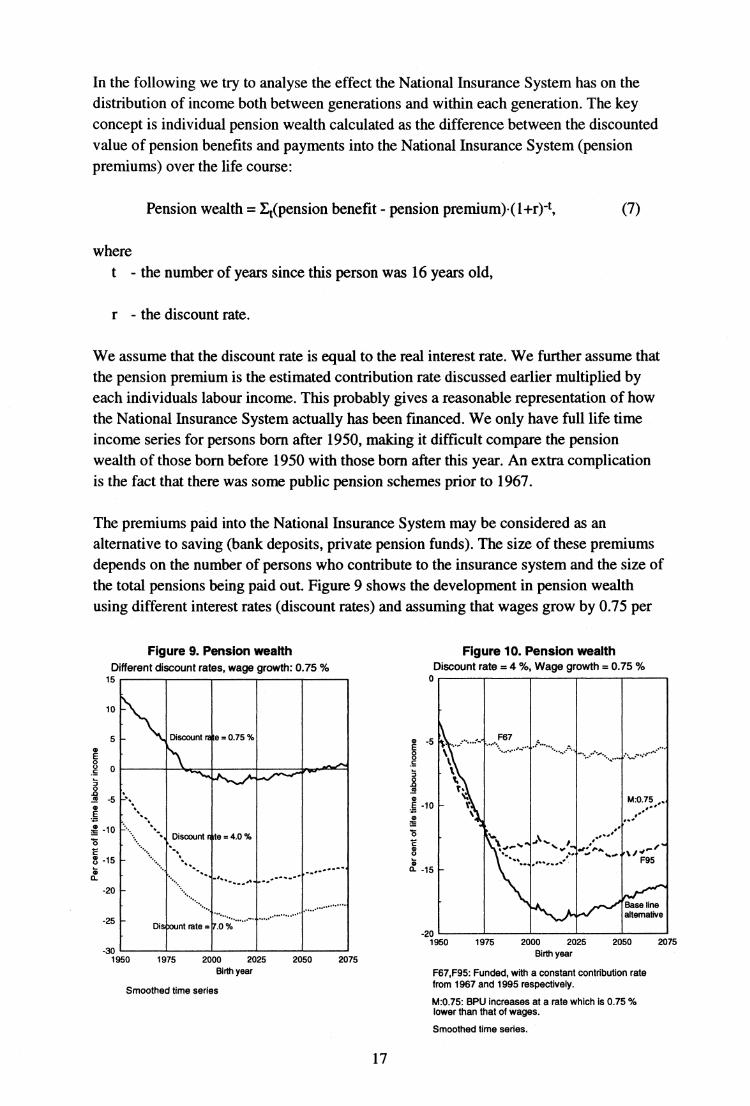
The premiums paid into the National Insurance System may be considered as analternative to saving (bank deposits, private pension funds). The size of these premiumsdepends on the number of persons who contribute to the insurance system and the size ofthe total pensions being paid out. Figure 9 shows the development in pension wealthusing different interest rates (discount rates) and assuming that wages grow by 0.75 per
Figure 9. Pension wealth Figure 10. Pension wealthDifferent discount rates, wage growth: 0.75 % Discount rate = 4 %, Wage growth = 0.75 %
15 0
Discount rate = 7.0 %-20
1950
1975
2000 2025
2050
2075Birth year F67,F95: Funded, with a constant contribution rate
Smoothed time series from 1967 and 1995 respectively.
M:0.75: BPU increases at a rate which is 0.75 %lower than that of wages.
Smoothed time series.
-301950
^...` .•.:
%_ l
t.
F67, .•• ;
i••^.•.• .•N ,._,. ... ...
.•^^ N,' •^ ;..^•^ • •.^•.,.•
,..... ti1^^••'.,..
T.V._ ^^
%M :0.75 „,,,•
.••..•
- \z:' ....•..'
^.^,......^
' Base linealtemative
1975
2000 2025
2050 2075
Birth year
17
mô 4000-0C^
.c 3000^
5000
6000
Figure 11. Life time incomeDiscount rate = 4 %, Wage growth = 0.7 %
7000
2000
1000
0
-
-..••
,• '-
•• •
Labourincome r;
Labourincome
=
•f +`,.-' Pension•-•* wealth
1950 1975 2000 2025Birth year
2050 2075
Smoothed time series
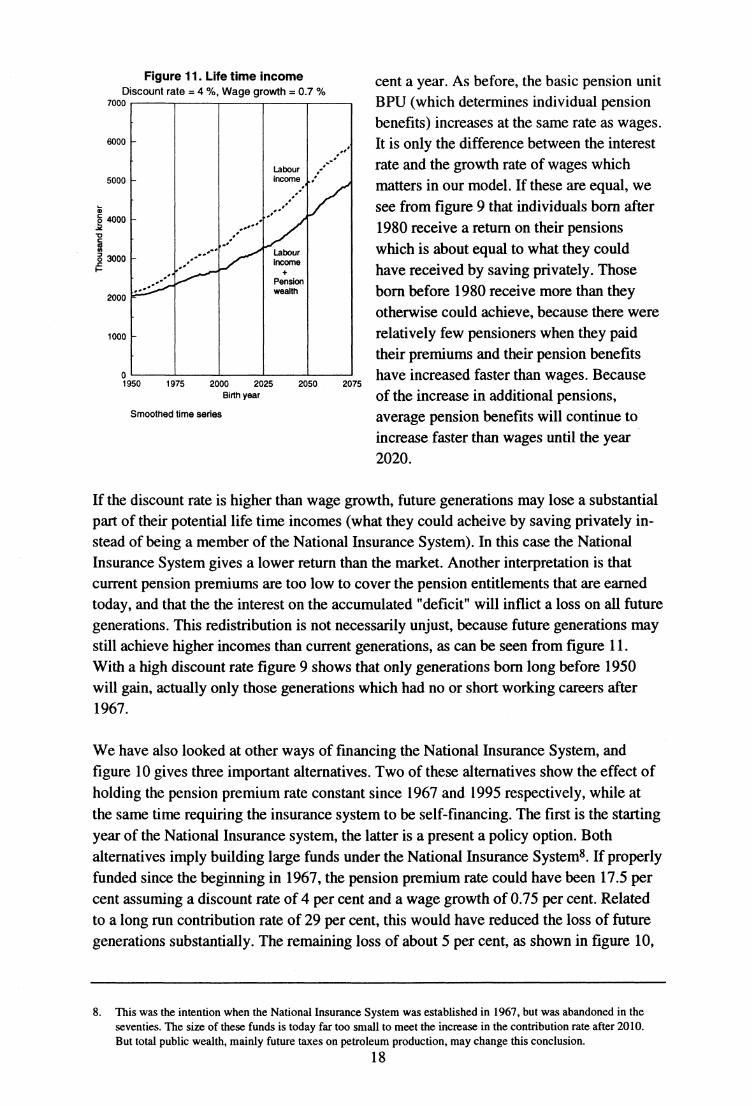
cent a year. As before, the b as ic pension unitBPU (which determines individual pensionbenefits) increases at the same rate as wages.It is only the difference between the interestrate and the growth rate of wages whichmatters in our model. If these are equal, wesee from figure 9 that individuals born after1980 receive a return on their pensionswhich is about equal to what they couldhave received by saving privately. Thoseborn before 1980 receive more than theyotherwise could achieve, because there wererelatively few pensioners when they paidtheir premiums and their pension benefitshave increased faster than wages. Becauseof the increase in additional pensions,average pension benefits will continue toincrease faster than wages until the year2020.
If the discount rate is higher than wage growth, future generations may lose a substantialpart of their potential life time incomes (what they could acheive by saving privately in-stead of being a member of the National Insurance System). In this case the NationalInsurance System gives a lower return than the market. Another interpretation is thatcurrent pension premiums are too low to cover the pension entitlements that are earnedtoday, and that the the interest on the accumulated "deficit" will inflict a loss on all futuregenerations. This redistribution is not necessarily unjust, because future generations maystill achieve higher incomes than current generations, as can be seen from figure 11.With a high discount rate figure 9 shows that only generations born long before 1950will gain, actually only those generations which had no or short working careers after1967.
We have also looked at other ways of financing the National Insurance System, andfigure 10 gives three important alternatives. Two of these alternatives show the effect ofholding the pension premium rate constant since 1967 and 1995 respectively, while atthe same time requiring the insurance system to be self-financing. The first is the startingyear of the National Insurance system, the latter is a present a policy option. Bothalternatives imply building large funds under the National Insurance Systemg. If properlyfunded since the beginning in 1967, the pension premium rate could have been 17.5 percent assuming a discount rate of 4 per cent and a wage growth of 0.75 per cent. Relatedto a long run contribution rate of 29 per cent, this would have reduced the loss of futuregenerations substantially. The remaining loss of about 5 per cent, as shown in figure 10,
8. This was the intention when the National Insurance System was established in 1967, but was abandoned in theseventies. The size of these funds is today far too small to meet the increase in the contribution rate after 2010.But total public wealth, mainly future taxes on petroleum production, may change this conclusion.
18

is mainly a result of paying the pensions of generations that in 1967 had few or no yearsleft of their working careers.
If the National Insurance System were to be funded starting in 1995, the pensionpremium rate would have to be 25 per cent. Related to a current contribution rate of justbelow 20 per cent, this only leads to small reductions in future losses. Anotheralternative is to reduce future benefits by letting the BPU, and thus the additionalpensions, be increased at a lower rate than wage growth, without changing the minimumpension. Letting additional pensions grow 0.75 per cent less than wages will slightly re-duce the pension wealth of generations born before 1975, and increase that of all futuregenerations.
3.6. Further distribution analysisIncome distribution within generations is a more complicated matter, since the re-distributive effects of pension wealth depend both on differences in purely actuarialelements (how long one lives and the probability of being disabled) and on income in-equalities. It would be most appropriate to measure expected pension wealth, while themodel generates actual pension wealth. With this reservation in mind, we have looked atthe latter, and found that the redistributive effects are large. Gini-coefficients for dis-counted life time income for a syntethic generation, is reduced by 15 per cent in the baseline alternative. High discount rates reduce the redistributive effects, because pensionbenefits are received late in life. The present system with additional pensions has moreredistributive effect than a system with an equal pension to everyone (at todays low levelof the minimum pension). The reason for this is that additional pensions increase theaverage pension, and this is more important than the differences in pension benefits.Looking at pension wealth, the National Insurance System benefits women (at the cost ofmen). One important reason is that women receive higher pensions related to previousincome. Two other important aspects are that women become pensioners at a lower age(through disability pension) and live longer.
19

Appendix A: Calculating pension benefits
Old age, disability and widow pensions from the National Insurance System are based onentitlements each individual achieves through his or her working years. These entitle-ments are guaranteed by the government and cannot be abandoned, even though theirworth can be changed through adjustments of the basic pension unit (see below). For thisreason existing pension benefit rules will have an impact on the Norwegian economywell into the next century. The rules for calculating benefits have been slightly changedover the years and since existing entitlements cannot be reduced, this has producedcomplicated transition rules. In the following, we only discuss the rules used today. Wealso omit discussing residency requirements which apply when calculating benefits. TheNational Insurance System was established in 1967, and labour income previous to 1967are not included in the calculation of benefits. The transition rules which apply to peopleborn too early to achieve full pension entitlements are not discussed in detail.
Measuring unitThe main key to understanding the National Insurance System is the so-called BasicPension Unit (BPU), a certain amount of nominal Norwegian kroner (Nkr). BPU is usedin both computing new pension entitlements and current benefits. We will later outlinehow BPU may be increased according to inflation and income growth and what effectthis has on the National Insurance System. In 1992 BPU had an average value of 36 200Nkr (approximately 5 000 Usd 9).
Pension entitlementsPension entitlements are calculated using two variables measuring respectively averagelabour incomes during the working years with highest income, Final Pension Point(FPP) and number of working years, Pension Point Years (PPY). Labour income in-cludes wages, income of the self-employed, sick leave benefits, unemployment benefitsand maternity leave benefits. For the ages 17 to 69, labour income of each tax-year istranslated into Pension Points as follows:
Pension Point = (Income-BPU)BPU (8)
Incomes above 6 BPU are divided by tree times BPU, and incomes above 12 BPU arenot included into the calculation of the pension point. Thus small incomes give nopension entitlements while high incomes give progressively less pension entitlements.Some people are granted pension points for other reasons than own labour income. Dis-ability pensioners are granted a Computed Pension Point (CPP) for each year this personis disabled until he or she is transferred to old age pension. CPP can be computed inseveral ways, but is normally the average of the last three Pension Points before dis-ability occurred. In this sense CPP is a replacement of the pension entitlements the in-dividual would have achieved if he or she had not become disabled. People who aredisabled before the age of 24, are granted a CPP of minimum 3.3. After 1991 women(and men) with children below 7 years, or other extensive family-care obligations, are
9. We have used the exchange rate of june 1993, approximately 7.20 Nkr for each US Dollar.
20

granted a Pension Point of minimum 3. This is also the average Pension Point of non-skilled females working full-time.
Pension Point Years is the number of positive Pension Points, or the number of yearswith labour income above one BPU. If the number of Pension Point Years is larger than40, the Pension Point Year is set to 40. The Final Pension Point is the average of the 20best positive Pension Points.
Pension benefitsOld age, disability and widow/widower pensions under the National insurance systemare mainly composed of three components, a Basic Pension, a Spesial Allowance and anAdditional Pension. The total pension can be written as:
Total Pension = Basic Pension +Max(Special Allowance,Additional Pension) (9)
Pensioners married to another pensioner are granted a Basic Pension of 0.75 BPU and aSpecial Allowance of 0.55 BPU (in 1992). Other pensioners are granted a Basic Pensionof 1 BPU and a Special Allowance of 0.61 BPU (in 1992). The Basic Pension plus theSpecial Allowance constitute the Minimum Pension that every pensioner is guaranteed.By increasing the Special Allowance, the government is able to increase the income ofthose with Minimum Pension, without increasing the income of those with (high)Additional Pensions. The Additional Pension is computed as:
Additional Pension = BPUxAPRxFPPx(PPY/MaxPPY), (10)
where
APR: Additional Pension Rate, with a value of 42 per cent in 1992.FPP: Final Pension Point, defined above.PPY: Pension Point Years, defined above.MaxPPY: Maximum number of Pension Point Years.
For people born after 1936, the maximum number of Pension Point Years (MaxPPY) is40. People born before 1937 cannot achieve 40 Pension Point Years from the year theNational Insurance System was established (1967) until the year they become 70 yearsold. People born before 1937 are for this reason given a lower MaxPPY, but not fullycompensating for the lack of sufficient Pension Point Years. Widow/widower pensionersreceive 55 per cent of the Additional Pension the late spouse would have receivedl0. Oldage pensioners who are widows/widowers receive either their own Additional Pension or55 per cent of the sum of their own Additional Pension and the Additional Pension thelate spouse would have received.If BPU follows income growth, the level of pension benefits can be divided into threegroups. The first group consists of persons with low incomes during their working years
10. If the late spouse died before he (or she) reached the age of 67, the pension is calculated as if the late spouse hadbecome a disability pensioner the same year he (or she) died.
21

or "few" working years. These persons will only receive the Minimum Pension, in 1992worth 58 000 Nkr for single pensioners (8 000 Usd). Tax rules for pensioners are quitefavourable and especially pensioners living only on a Minimum Pension do not paytaxes. An average full-time labour income in manufacturing was in 1992 about 180 000Nkr and after tax 100-150 000 Nkr. The second group consists of persons with longworking careers and normal incomes, roughly between 100 000 and 300 000 Nkr(15 000-45 000 Usd). These persons will after tax receive approximately 50-80 per centof average labour income during their 20 best working years. The third group consists ofpersons with incomes above 12 BPU, in 1992 above 435 000 Nkr (60 000 Usd). Thesepersons will receive the Maximum Pension of about 4 BPU, in 1992 worth 145 000 Nkr(20 000 Usd). If BPU had been adjusted according to income growth since 1967, and thecalculation rules had been the same today as in 1967, the Maximum Pension would havebeen worth about 210 000 Nkr in 1992 (29 000 Usd).
Adjustments of the BPUDue to inflation and real income growth it is necessary to adjust the BPU and the SpecialAllowances, if the National Insurance System is to keep up with the income level ofsociety in general. Adjustment of BPU has an effect both on new pension entitlementsand current pension benefits. Additionally, BPU is used to determine several other publicand non-public benefits. For example private insurance companies often write insurancecontracts based on BPU. For these reasons adjustment of BPU is an important part of theincome negotiations 11 between government and pensioners under the National InsuranceSystem. Two possible political strategies for adjusting BPU are worthwhile mentioning:
(i) BPU is increased with the income growth rate and the Special Allowance is heldconstant (measured in BPU).
(ii) BPU is increased with the general inflation rate and the Special Allowance is in-creased so as to keep growth in the Minimum Pensions in line with general incomegrowth.
Strategy (i) maintains the intentions of the National Insurance System in the sense thatthe level of the Additional Pensions are fixed relative to the income level of society ingeneral. Each existing pensioner will with this strategy receive an income growth in linewith the rest of society. Strategy (ii) maintains the purchasing power 12 of all existingpensioners and lets pensioners with a Minimum Pension participate in the general in-come growth.
Strategy (ii) will in the long run change the contents of the National Insurance System. Inthe short run the benefits will be reduced, but this reduction will to some degree beneutralized by higher pension entitlements in the future. However, the pension/wageratio decreases with income level (measured in BPU), and this aspect will become moreapparent if strategy (ii) is followed for several decades. With sufficient real income
11. The BPU is set unilaterally by Parliament, but the result from the negotiations are normally respected.12. This will be the case given that the general inflation rate reflects the prices of the goods and services older people
buy.
22

growth, for instance 2 per cent per year for 45 years, the Maximum Pension will be assmall as the Minimum Pension. At this stage the Additional Pensions of the National In-surance System will in practice have ceased to exist. Historically BPU has increasedmainly in accordance with the inflation rate and the Minimum Pension with the incomegrowth.
Future pensionsThe Additional Pensions are determined by labour income earned after 1967, implyingthat average benefits will continue to grow for several decades ahead. New pensionerswill gradually have more Pension Point Years and more Pension Points to choose fromwhen computing the Final Pension Point. These effects will be strong until the year of2007, when we get the first new pensioners who had the possibility of earning a full setof Pension Point Years (40 years). Average pensions will keep on growing until 2020,when we get the first new pensioners who had the opportunity to earn pension entitle-ments throughout their whole working life (they were 17 years old in 1967). Additionallythe historically under-adjustment of BPU will generate a growth in Additional Pensionsfor several decades if BPU suddenly is adjusted in accordance with income growth.Another important effect is the increase in female labour force participation over the twolast decades which will contribute to increased average female pensions as late as 2030-2Ø0.
23

Appendix B: The computer programmes
Merging files, estimating probabilities and drawing the initial population is done usingSAS on an IBM-compatible mainframe. The simulation program itself is written inSIMULA which is an object oriented language developed in Norway in the sixties. Themodel is now run on a SUN SparcII work station 10 model 20, and requires approxi-mately 1 Gigabyte free hard-disk. Using an object oriented language makes it fairly easyto take into account interdependencies between individuals. An object oriented languagedefines objects and links them through the use of pointers. Two married individuals inour model are thereby two objects with pointers directed at each other. When somethinghappens to one spouse, the other spouse can immediately be updated. Such linkages areespecially important when simulating complex interdependencies between individualssuch as those encountered in household dynamics. We are at present working on ahousehold model based on two types of objects, individuals and households, where inter-dependencies are modeled through the use of a large set of pointers. The use of an objectoriented language is one of the main features which distinguishes the MOSART modelfrom other models. A more detailed description of the use of an object oriented languageto model household formation is given in Andreassen, Spurkland and Vogt (1992).
A simulation of 1 per cent of the population from 1990 to 2050 takes just below 2 hoursof CPU-time. This includes the preparation of a few aggregate output tables which canbe directly used in a spread sheet. During a simulation the model writes out all events toa sequential log file. After a simulation is done this file is sorted so that all records foreach individual are grouped chronologically. The sorted file is read by a SAS programwhich produces a SAS data set of life histories. The sorting of the log file and productionof the life histories takes about 40 minutes of CPU-time. Another SAS-program com-putes pension benefits from this data set of life histories requiring i hour of CPU-time.From the SAS data set of life histories it is easy to produce detailed output tables. Astandard set of tables covering all important aspects of the model takes about 1 hour ofCPU-time. Summing the above together we get that a simulation and preparation of out-put uses about 4.5 hours of CPU-time.
24
References
Andreassen, L. (1993): Demographic Forecasting with a Dynamic Stochastic Micro-simulation Model, Discussion Paper no.85, Statistics Norway, Oslo.
Andreassen, L. T. Andreassen, D. Fredriksen, G. Spurkland and Y. Vogt (1993):Framskriving av arbeidsstyrke og utdanning. Mikrosimuleringmodellen MOSART 1.Rapporter 93/6, Statistics Norway, Oslo.
Andreassen, T., G. Spurktand and Y. Vogt (1992): MOSART, a microsimulationmodel. Paper prepared for the 1992 Conference on Computing for the Social Sciences,May 4-7, 1992, University of Michigan Ann Arbor. Statistics Norway, Oslo.
Auerbach, Alan J., Jagadeesh Gokhale, Laurence J.Kotlikoff, Erling Steigum Jr.(1993): Generational Accounting in Norway, Is Norway Overconsuming Its PetroleumWealth?, unpublished paper presented at the conference Qu antitative AggregateEconomics at Norwegian School of Economics and Business, Bergen 18.-20.august1993.
Nelissen, J.H.M. (1991): Household and Education Projections by Means of a Micro-simulation Model. Economic Modelling 9, 480-510.
Nelissen, J.H.M. and A.P. Vossen (1989): Projecting Household Dynamics - AScenario-Based Microsimulation Approach. European Journal of Population 5, 253-279.
Samuelson, Paul A. (1958): An exact consumption-loan model of interest with or with-out the social contrivance of money. The Journal of Political Economy 66, 467-482.
Wolfson, M.C. (1988): Homemaker Pensions and Lifetime Redistribution. Review of In-come and Wealth 34, 221-250.
25
Issued in the series Discussion Papers
No. 1 1. Aslaksen and O. Bjerkholt (1985): Certainty Equiva-lence Procedures in the Macroeconomic Planning of anOil Economy
No. 3 E. Biørn (1985): On the Prediction of Population Totalsfrom Sample surveys Based on Rotating Panels
No. 4 P. Frenger (1985): A Short Run Dynamic EquilibriumModel of the Norwegian Production Sectors
No. 5 1. Aslaksen and O. Bjerkholt (1985): Certainty Equiva-lence Procedures in Decision-Making under Uncertain-ty: An Empirical Application
No. 6 E. Biørn (1985): Depreciation Profiles and the UserCost of Capital
No. 7 P. Frenger (1985): A Directional Shadow Elasticity ofSubstitution
No. 8 S. Longva, L Lorentsen and Ø. Olsen (1985): TheMulti-Sectoral Model MSG-4, Formal Structure andEmpirical Characteristics
No. 9 J. Fagerberg and G. Sollie (1985): The Method ofConstant Market Shares Revisited
No. 10 E. Biørn (1985): Specification of Consumer DemandModels with Stochastic Elements in the Utility Func-tion and the first Order Conditions
No. 11 E. Biørn, E. Holmøy and Ø. Olsen (1985): Gross andNet Capital, Productivity and the form of the SurvivalFunction. Some Norwegi an Evidence
No. 12 J.K. Dagsvik (1985): Markov Chains Generated byMaximizing Components of Multidimensional ExtremalProcesses
No. 13 E. Biørn, M. Jensen and M. Reymert (1985): KVARTS- A Quarterly Model of the Norwegian Economy
No. 14 R. Aaberge (1986): On the Problem of Measuring In-equality
No. 15 A.-M. Jensen and T. Schweder (1986): The Engine ofFertility - Influenced by Interbirth Employment
No. 16 E. Biørn (1986): Energy Price Changes, and InducedScrapping and Revaluation of Capital - A Putty-ClayModel
No. 17
No. 18
No. 19
E. Bjørn and P. Frenger (1986): Expectations, Substi-tution, and Scrapping in a Putty -Clay Model
R. Bergan, Å. Cappelen, S. Longva and N.M. Stølen(1986): MODAG A - A Medium Term Annual Macro-economic Model of the Norwegian Economy
E. Biørn and H. Olsen (1986): A Generalized SingleEquation Error Correction Model and its Application toQuarterly Data
No. 20 K.H. Alfsen, D.A. Hanson and S. Glomsrød (1986):Direct and Indirect Effects of reducing SO 2 Emissions:Experimental Calculations of the MSG-4E Model
No. 21 J.K. Dagsvik (1987): Econometric Analysis of LaborSupply in a Life Cycle Context with Uncertainty
No. 22 K.A. Brekke, E. Gjelsvik and B.H. Vatne (1987): ADynamic Supply Side Game Applied to the EuropeanGas Market
No. 23 S. Bartlett, J.K. Dagsvik, Ø. Olsen and S. Strøm(1987): Fuel Choice and the Demand for Natural Gasin Western European Households
No. 24 J.K. Dagsvik and R. Aaberge (1987): Stochastic Prop-erties and Functional Forms of Life Cycle Models forTransitions into and out of Employment
No. 25 T.J. Klette (1987): Taxing or Subsidising an ExportingIndustry
No. 26 K.J. Berger, O. Bjerkholt and Ø. Olsen (1987): Whatare the Options for non-OPEC Countries
No. 27 A. Aaheim (1987): Depletion of Large Gas Fieldswith Thin Oil Layers and Uncertain Stocks
No. 28 J.K. Dagsvik (1987): A Modification of Heckman'sTwo Stage Estimation Procedure that is Applicablewhen the Budget Set is Convex
No. 29 K. Berger, Å. Cappelen and I. Svendsen (1988): In-vestment Booms in an Oil Economy - The Norwegi anCase
No. 30 A. Rygh Swensen (1988): Estimating Change in a Pro-portion by Combining Measurements from a True anda Fallible Classifier
No. 31 J.K. Dagsvik (1988): The Continuous GeneralizedExtreme Value Model with Special Reference to StaticModels of Labor Supply
No. 32 K. Berger, M. Hoel, S. Holden and Ø. Olsen (1988):The Oil Market as an Oligopoly
No. 33 I.A.K. Anderson, J.K. Dagsvik, S. Strøm and T.Wennemo (1988): Non-Convex Budget Set, HoursRestrictions and Labor Supply in Sweden
No. 34 E. Holmøy and Ø. Olsen (1988): A Note on MyopicDecision Rules in the Neoclassical Theory of ProducerBehaviour, 1988
No. 35 E. Biørn and H. Olsen (1988): Production - DemandAdjustment in Norwegian Manufacturing: A QuarterlyError Correction Model, 1988
No. 36 J.K. Dagsvik and S. Strøm (1988): A Labor SupplyModel for Married Couples with Non-Convex BudgetSets and Latent Rationing, 1988
No. 37 T. Skoglund and A. Stokka (1988): Problems of Link-ing Single-Region and Multiregional EconomicModels, 1988
No. 38 T.J. Klette (1988): The Norwegi an Aluminium Indu-stry, Electricity prices and Welfare, 1988
No. 39 I. Aslaksen, O. Bjerkholt and K.A. Brekke (1988): Opti-mal Sequencing of Hydroelectric and Thermal PowerGeneration under Energy Price Uncertainty and De-mand Fluctuations, 1988
No. 40 O. Bjerkholt and K.A. Brekke (1988): Optimal Startingand Stopping Rules for Resource Depletion when Priceis Exogenous and Stochastic, 1988
No. 41 J. Aasness, E. Biørn and T. Skjerpen (1988): EngelFunctions, Panel Data and Latent Variables, 1988
No. 42 R. Aaberge, Ø. Kravdal and T. Wennemo (1989): Un-observed Heterogeneity in Models of Marriage Dis-solution, 1989
No. 43 K.A. Mork, H.T. Mysen and Ø. Olsen (1989): BusinessCycles and Oil Price Fluctuations: Some evidence forsix OECD countries. 1989
26
No. 44 B. Bye, T Bye and L. Lorentsen (1989): SIMEN. Stud-ies of Industry, Environment and Energy towards 2000,1989
No. 45 O. Bjerkholt, E. Gjelsvik and Ø. Olsen (1989): GasTrade and Demand in Northwest Europe: Regulation,Bargaining and Competition
No. 46 L.S. Stambøl and K.Ø. Sørensen (1989): MigrationAnalysis and Regional Population Projections, 1989
No. 47
No. 48
V. Christiansen (1990): A Note on the Short Run Ver-sus Long Run Welfare Gain from a Tax Reform, 1990
S. Glomsrød; H. Vennemo and T Johnsen (1990):Stabilization of Emissions of CO 2: A ComputableGeneral Equilibrium Assessment, 1990
No. 49 J. Aasness (1990): Properties of Demand Functions forLinear Consumption Aggregates, 1990
No. 50 J.G. de Leon (1990): Empirical EDA Models to Fit andProject Time Series of Age-Specific Mortality Rates,1990
No. 51 J.G. de Leon (1990): Recent Developments in ParityProgression Intensities in Norway. An Analysis Basedon Population Register Data
No. 52 R. Aaberge and T Wennemo (1990): Non-StationaryInflow and Duration of Unemployment
R. Aaberge, J.K. Dagsvik and S. Strøm (1990): LaborSupply, Income Distribution and Excess Burden ofPersonal Income Taxation in Sweden
R. Aaberge, J.K. Dagsvik and S. Strøm (1990): LaborSupply, Income Distribution and Excess Burden ofPersonal Income Taxation in Norway
No. 55 H. Vennemo (1990): Optimal Taxation in AppliedGeneral Equilibrium Models Adopting the ArmingtonAssumption
No. 56 N.M. Stølen (1990): Is there a NAIRU in Norway?
No. 57 Å. Cappelen (1991): Macroeconomic Modelling: TheNorwegian Experience
No. 58 J. Dagsvik and R. Aaberge (1991): Household Pro-duction, Consumption and Time Allocation in Peru
No. 59 R. Aaberge and J. Dagsvik (1991): Inequality in Dis-tribution of Hours of Work and Consumption in Peru
T.J. Klette (1991): On the Importance of R&D andOwnership for Productivity Growth. Evidence fromNorwegian Micro-Data 1976-85
K.H. Alfsen (1991): Use of Macroeconomic Models inAnalysis of Environmental Problems in Norway andConsequences for Environmental Statistics
No. 62 H. Vennemo (1991): An Applied General EquilibriumAssessment of the Marginal Cost of Public Funds inNorway
No. 63 H. Vennemo (1991): The Marginal Cost of PublicFunds: A Comment on the Literature
No. 64 A. Brendemoen and H. Vennemo (1991): A climateconvention and the Norwegian economy: A CGEassessment
No. 65 K. A. Brekke (1991): Net National Product as a WelfareIndicator
No. 66 E. Bowitz and E. Storm (1991): Will Restrictive De-mand Policy Improve Public Sector Balance?
No. 67 Å. Cappelen (1991): MODAG. A Medium TermMacroeconomic Model of the Norwegian Economy
No. 68 B. Bye (1992): Modelling Consumers' Energy Demand
No. 69 K. H. Alfsen, A. Brendemoen and S. Glomsrød (1992):Benefits of Climate Policies: Some Tentative Calcula-tions
No. 70 R. Aaberge, Xiaojie Chen, Jing Li and Xuezeng Li(1992): The Structure of Economic Inequality amongHouseholds Living in Urban Sichuan and Liaoning,1990
No. 71 K.H. Alfsen, K.A. Brekke, F. Brunvoll, H. Lurås, K.Nyborg and H. W. Sæbø (1992): Environmental Indi-cators
No. 72 B. Bye and E. Holmøy (1992): Dynamic EquilibriumAdjustments to a Terms of Trade Disturbance
No. 73 O. Aukrust (1992): The Scandinavian Cont ribution toNational Accounting
No. 74 J. Aasness, E, Eide and T Skjerpen (1992): A Crimi-nometric Study Using Panel Data and Latent Variables
No. 75 R. Aaberge and Xuezeng Li (1992): The Trend inIncome Inequality in Urban Sichuan and Liaoning,1986-1990
No. 76 J.K. Dagsvik and Steinar Strøm (1992): Labor Supplywith Non-convex Budget Sets, Hours Restriction andNon-pecuniary Job-attributes
No. 77 J.K. Dagsvik (1992): Intertemporal Discrete Choice,Random Tastes and Functional Form
No. 78 H. Vennemo (1993): Tax Reforms when Utility isComposed of Additive Functions
No. 79 J. K. Dagsvik (1993): Discrete and Continuous Choice,Max-stable Processes and Independence from IrrelevantAttributes
No. 80 J. K. Dagsvik (1993): How Large is the Class of Gen-eralized Extreme Value Random Utility Models?
No. 81 H. Birkelund, E. Gjelsvik, M. Aaserud (1993): Carbon/energy Taxes and the Energy Market in WesternEurope
No. 82 E. Bowitz (1993): Unemployment and the Growth inthe Number of Recipients of Disability Benefits inNorway
L Andreassen (1993): Theoretical and EconometricModeling of Disequilibrium
K.A. Brekke (1993): Do Cost-Benefit Analyses favourEnvironmentalists?
L. Andreassen (1993): Demographic Forecasting with aDynamic Stochastic Microsimulation Model
G.B. Asheim and K.A. Brekke (1993): Sustainabilitywhen Resource Management has Stochastic Conse-quences
O. Bjerkholt and Yu Zhu (1993): Living Conditions ofUrban Chinese Households around 1990
R. Aaberge (1993): Theoretical Foundations of LorenzCurve Orderings
J. Aasness, E. Biørn and T Skjerpen (1993): EngelFunctions, Panel Data, and Latent Variables - withDetailed Results
No. 53
No. 54
No. 60
No. 61
No. 83
No. 84
No. 85
No. 86
No. 87
No. 88
No. 89
27

No. 90 Ingvild Svendsen (1993): Testing the Rational Expec-tations Hypothesis Using Norwegian MicroeconomicDataTesting the REH. Using Norwegian Micro-economic Data
No. 91 Einar Bowitz, Asbjørn Rødseth and Erik Storm (1993):Fiscal Expansion, the Budget Deficit and the Economy:Norway 1988-91
No. 92 Rolf Aaberge, Ugo Colombia and Steinar Strøm(1993): Labor Supply in Italy
No. 93 Tor Jakob Klette (1993): Is Price Equal to MarginalCosts? An Integrated Study of Price-Cost Margins andScale Economies among Norwegian ManufacturingEstablishments 1975-90
No. 94 John K. Dagsvik (1993): Choice Probabilities andEquilibrium Conditions in a Matching Market withFlexible Contracts
No. 95 Tom Kornstad (1993): Empirical Approaches for Ana-lysing Consumption and Labour Supply in a Life CyclePerspective
No. 96 Tom Kornstad (1993): An Empirical Life Cycle Modelof Savings, Labour Supply and Consumption withoutIntertemporal Separability
No. 97 Snorre Kverndokk (1993): Coalitions and Side Pay-ments in International CO2 Treaties
No. 98 Torbjørn Eika (1993): Wage Equations in MacroModels. Phillips Curve versus Error Correction ModelDetermination of Wages in Large-Scale UK MacroModels
No. 99 Anne Brendemoen and Haakon Vennemo (1993): TheMarginal Cost of Funds in the Presence of ExternalEffects
No. 100 Kjersti-Gro Lindquist (1993): Empirical Modelling ofNorwegian Exports: A Disaggregated Approach
No. 101 Anne Sofie Jore, Terje Skjerpen and Anders RyghSwensen (1993): Testing for Purchasing Power Parityand Interest Rate Parities on Norwegian Data
No. 102 Runa Nesbakken and Steinar Strøm (1993): The Choiceof Space Heating System and Energy Consumption inNorwegian Households (Will be issued later)
No. 103 Asbjørn Aaheim and Karine Nyborg (1993): "GreenNational Product": Good Intentions, Poor Device?
No. 104 Knut H. Alfsen, Hugo Birkelund and Morten Aaserud(1993): Secondary benefits of the EC Carbon/ EnergyTax
No. 105 Jørgen Aasness and Bjart Holtsmark (1993): ConsumerDemand in a General Equilibrium Model for Environ-mental Analysis
No. 106 Kjersti-Gro Lindquist (1993): The Existence of FactorSubstitution in the Primary Aluminium Industry: AMultivariate Error Correction Approach on Norwegi anPanel Data
No. 107 Snorre Kverndokk (1994): Depletion of Fossil Fuelsand the Impacts of Global Warming
No. 108 Knut A. Magnussen (1994): Precautionary Saving andOld-Age Pensions
No. 109 Frode Johansen (1994): Investment and FinancialConstraints: An Empirical Analysis of NorwegianFirms
No. 110 Kjell Arne Brekke and Pål Børing (1994): TheVolatility of Oil Wealth under Uncertainty about Para-meter Values
No. 111 Margaret J. Simpson (1994): Foreign Control andNorwegian Manufacturing Performance
No .112 Yngve Willassen and Tor Jakob Klette (1994):Correlated Measurement Errors, Bound on Parameters,and a Model of Producer Behavior
No. 113 Dag Westerwald (1994): Car ownership and private caruse. A microeconometric analysis based on Norwegi andata
No. 114 Knut Einar Rosendahl (1994): Does ImprovedEnvironmental Policy Enhance Economic Growth?Endogenous Growth Theory Applied to DevelopingCountries
No. 115 Leif Andreassen, Dennis Fredriksen and Olav Ljones(1994): The Future Burden of Public Pension Benefits.A Microsimulation Study
28

Statistics NorwayResearch DepartmentP.O.B. 8131 Dep.N-0033 Oslo
Tel.: +47-22 86 45 00Fax: +47-22 11 12 38
OW40 Statistics NorwayResearch Department


