20
Date: 29-04-2016
| Date post: | 22-May-2018 |
| Category: |
Documents |
| Upload: | truongcong |
| View: | 214 times |
| Download: | 1 times |
Date: 29-04-2016

City of Kwinana – Indian Ocean Gateway Terminal
29-04-2016
REV C memo 2 / 20
Index
1. Starting points and main assumptions .................................................. 3
1.1 Cargo Forecast for the Indian Ocean Gateway (IOG) Terminal ...................... 3
1.2 Design vessel .................................................................................................... 4
1.3 Average call size ................................................................................................ 5
1.4 Berth productivity .............................................................................................. 5
1.5 Required number of berths ............................................................................... 5
2. Preliminary layout design Indian Ocean Gateway project .................... 7
2.1 First phase ......................................................................................................... 7
2.2 Second phase .................................................................................................... 8
2.3 Facilities for tugs, pilots and mooring boats ................................................. 10
2.4 Existing intakes and outtakes ........................................................................ 10
2.5 Hinterland connections ................................................................................... 10
3. Environmental Conditions ..................................................................... 11
3.1 Water level variations ...................................................................................... 11
3.2 Currents in the Cockburn Sound .................................................................... 12
3.3 Wave climate .................................................................................................... 12
4. Navigation ............................................................................................... 15
5. Mooring aspects ..................................................................................... 16
6. Breakwater requirements ...................................................................... 18
7. Next steps ............................................................................................... 20

City of Kwinana – Indian Ocean Gateway Terminal
29-04-2016
REV C memo 3 / 20
1. Starting points and main assumptions
This high level master plan has been designed based on available information as received from previous studies (by others), new information gathered from public sources and from high-level numerical modeling exercises. In this memo the information used is summarized and methodology and considerations to arrive at the preliminary master plan are further explained.
1.1 Cargo Forecast for the Indian Ocean Gateway (IOG) Terminal The design throughput of the IOG (see Table 1-1) is based on the existing throughput of the Fremantle Inner Harbour (at present and including future growth) and an additional container handling capacity resulting in a minimum container handling capacity of 3 million TEU and maximum of 6 million TEU per year. For the purpose of the preliminary layout design of IOG it is assumed that the available port areas which are not designated for the projected cargo will be developed into container terminal area or used for the expansion of the Australian Marine Complex (AMC). The dry bulk cargo is mainly handled via the Kwinana Bulk Terminal (KBT). IOG will be located at sufficient distance from KBT and the Alcoa Jetty to allow a future upgrade of these jetties to handle Capesize vessels. The following milestones are used for the IOG project:
• Start of operations: 2021; • 1st phase at full capacity: 2036; • 2nd phase at full capacity: 2071.
Type of cargo:
Existing throughput Inner Harbour (2014/2015)
IOG cargo throughput 2036
IOG cargo throughput 2071
Containers (import + export) 743,503 TEU 2,100,000 TEU 4-6 million TEU General Cargo (import + export)
521,000 t 655,000 t 960,000 t
Dry Bulk (import + export) 250,000 t 310,000 t 460,000 t Motor vehicles (import) 101,601 units 185,000 units 520,000 units Livestock (export)
- Cattle - Sheep
127,248 head
1,780,978 head
250,000 head
3,750,000 head
250,000 head
3,750,000 head Table 1-1: Existing and projected cargo throughput
The following assumptions have been made for the projected cargo in 2036 and 2071: • AMC requires expansion area and its existing terminal will connect to IOG with “high-
wide” road access; • At the end of the 1st phase all existing cargo from the Fremantle inner harbour shall
be relocated to IOG, excluding Naval and passenger activities; • It is not foreseen that IOG shall attract significant amounts of dry bulk since the
majority of this commodity is already handled in the Outer Harbour;

City of Kwinana – Indian Ocean Gateway Terminal
29-04-2016
REV C memo 4 / 20
• Livestock shall vary over the years with a maximum export of 4 million head, consisting of 3,750,000 sheep and 250,000 cattle.
• Dry Bulk and Break-bulk cargo shall grow with 1.1% each year up to the year 2071, this percentage has been adopted from the research report of BITRE1 for the containerized and non-containerized cargo, this percentage has been extrapolated from 2033 up to the year 2071.
• The import of motor vehicles shall grow in line with GDP, GDP growth has been derived from the WA economic profile 2016 for the years up to 2019, after which it has been assumed at a constant growth of 3%.
• Transshipment is very limited in the existing Inner Harbour and is assumed to be negligible for the IOG.
1.2 Design vessel The future IOG will have a design capacity up to about 6 million TEU’s and will be able to handle container vessels similar to the Triple E Maersk Class (see figure below).
The main particulars of the design vessels which shall be handled at IOG are presented in Table 1-2. For general cargo and dry bulk no significant increase in vessel size is expected, for both type of cargo a maximum vessel size of 40,000 DWT has been selected. Length Beam Draft Capacity Container vessel 400 m 59 m 16.5 m 18,000 TEU Car Carrier 205 m 32 m 10.9 6,000 CEU Livestock Carrier 213 m 32 m 11.5 m 120,000 sheep or 25,000
cattle General Cargo vessel 210 m 30 m 12.5 m 40,000 t Dry Bulk Vessel 195 m 32 m 11.5 m 40,000 t Table 1-2: Main particulars design vessels for IOG
Based on the design vessels, the length of the different types of berths are listed in the table hereafter. 1 BITRE stands for Bureau of Infrastructure Transport and Regional Economics;
Figure 1-1: Triple E Maersk Class

City of Kwinana – Indian Ocean Gateway Terminal
29-04-2016
REV C memo 5 / 20
Length of berth Container vessel 450 m General Cargo & Dry Bulk 250 m Car Carrier 250 m Livestock Carrier 250 m Table 1-3: Length per berth for each terminal
It is foreseen that the existing bulk jetties at the project location shall be used by Capesize vessels in the future, therefore enough space between IOG and the Alcoa and KBT jetty has been reserved.
1.3 Average call size The table below indicates the expected average call size (total tons / TEU unloaded + loaded) per vessel during one vessel call for the various commodities for the reference years 2036, and 2071. Average call size (2036) Average call size (2071) Container vessel 2,500 TEU 4,500 TEU Car Carrier 2,000 CEU 3,000 CEU Livestock Carrier 75,000 sheep or 18,000 cattle 75,000 sheep or 18,000 cattle General Cargo vessel 10,000 t 20,000 t Dry Bulk Carrier 10,000 t 20,000 t Table 1-4: Average call size for the first and second phase
1.4 Berth productivity The resulting average effective berth productivity figures adopted are based on assumptions on number and type of ship-to-shore equipment units, and have been listed in the table below. The range of figures indicate that the productivity of containers is expected to increase in the course of time as a result of improvements in handling methods and the positive effect of larger call sizes. Berth productivity (2036) Berth productivity (2071) Containers 160 TEU/hr 215 TEU/hr Motor vehicles 250 CEU/hr 250 CEU/hr Livestock 1,800 sheep/hr or 600 cattle/hr 1,800 sheep/hr or 600 cattle/hr General Cargo 180 t/hr 180 t/hr Dry Bulk 360 t/hr 360 t/hr Table 1-5: Berth productivity for first and second phase
1.5 Required number of berths Based on the above stated berth productivity, a downtime of 5 to 6 % per year due to wind and waves and 21 effective working hours per day, the following number of berths are required with accompanied berth occupancy for each reference year. Note that the number of container berths at the end of the second phase is not based on cargo forecast but on available space in the project area.

City of Kwinana – Indian Ocean Gateway Terminal
29-04-2016
REV C memo 6 / 20
No. of berths (2036)
Berth occupancy
(2036)
No. of berths (2071)
Berth occupancy
(2071) Containers 4 55% 7 60% General Cargo & Dry Bulk
1 68% 2 48%
Cars 1 17% 1 43% Livestock 1 45% 1 45% Table 1-6: Required number of berths and estimated berth occupancy
The most economic berth occupancy for a single berth is approximately 45 % according to international benchmarks. This means that the port has reached its maximum quay capacity. With a higher berth occupancy the waiting time for the vessels before being handled becomes too high. When two berths are adjacent to each other and are able to exchange berths, the economical optimum of the berth occupancy increases to approximately 60% due to a higher flexibility. The berth occupancy of the single berth for general cargo & dry bulk is exceeding the 45 % in the first phase, since the car import terminal has a rather low berth occupancy it is assumed that the overflow of general cargo vessels will be handled at the car import terminal.

City of Kwinana – Indian Ocean Gateway Terminal
29-04-2016
REV C memo 7 / 20
2. Preliminary layout design Indian Ocean Gateway project
2.1 First phase At the end of the first phase the project area North of the Alcoa jetty has been developed into a port area with a total quay length of 2,300 m and a reclaimed port area covering approximately 152 ha. The quay shall consist of 2,050 m of quay parallel to the coastline and 250 m of quay perpendicular to the coastline, situated South at the port area. The northern part of the land plot will attach to the AMC and will be designated for the expansion of the AMC. South of the land plot a basin is foreseen between IOG and the Alcoa jetty with a width of 220 m. This will enable Livestock carriers to berth alongside the livestock terminal without hampering the Alcoa jetty operations. Container Terminals For the container operations there is a total quay length of 650 to 1550 m (depending on the size of AMC) available in the first phase which can be contracted into various concessions. The total cargo throughput for the container terminal(s) in the first phase is estimated at 1,500 TEU/m/yr, resulting in a total throughput of 1.0 to 2.3 million TEU in the first phase. General cargo terminal & car import terminal The general cargo terminal and the car terminal shall both have a quay length of 250 m each. At the end of the first phase, the berth occupancy of the general cargo berth is higher than the accepted optimum of 45% for a single berth. It is assumed that the overflow of general cargo vessels will also be able to use the car carrier berth which has a very low occupancy (only 17 %). This will result in an average berth occupancy of the combined berths of 43%. The car terminal will eventually have a storage capacity of 8,000 car equivalent units (CEU). This is enough to directly unload the largest vessel size and to enable an average dwell time of 5 to 6 days. The parking area will consist of a parking garage with 3 floors on the terminal area and an overflow area outside the terminal area. The parking garage and the overflow area will both have a capacity of 4,000 CEU. In order to make the vehicles “dealer ready”, a pre- delivery inspection (PDI) facility is foreseen on site or in the vicinity of the port. Expansion of the Australian Marine Complex AMC will be linked to the IOG development and consequently gain “high wide” access to the road network south of its current location. In the initial preliminary IOG layout, a reservation of 16 ha is made for expansion of the AMC, however AMC has indicated that it potentially would require more land in addition to the 16 ha. If the AMC require more than 16 ha, the number of container berths on the northern part of IOG needs to be reduced to 650 m in the first phase and to 900 m in the final phase. The total container handling capacity in the final phase would in that case be reduced from 6.3 to 4.5 million TEU per annum. Livestock terminal The livestock terminal will be developed at the most southern land plot of the first phase development at the quay perpendicular to the coastline. The berth lays well protected from

City of Kwinana – Indian Ocean Gateway Terminal
29-04-2016
REV C memo 8 / 20
waves. Upon arrival of the livestock trucks at the truck parking area, the livestock will be guided directly to the berth and loaded onto the vessel.
2.2 Second phase In the second phase of the IOG project, the land plot South of the Alcoa jetty shall be reclaimed and developed into a port area with a total quay length of 1,850 m and covering an area of approximately 129 ha. The general cargo terminal located at the Northern land plot will be relocated to the Southern port area and its former location will be redeveloped into a container terminal area. At the end of the second phase IOG will accommodate the following terminals: Northern land plot:
• AMC expansion covering an area up to 85 ha; • Container terminal with 4 berths with a total quay length of 1,800 m or 2 berths with a
total quay length of 900 m in order to increase the available area for expansion of AMC;
• Car import terminal with 1 berth and a quay length of 250 m; • Livestock terminal with 1 berth and a quay length of 250 m; • Tug berths.
Figure 2-1: Northern land plot (final phase)

City of Kwinana – Indian Ocean Gateway Terminal
29-04-2016
REV C memo 9 / 20
Southern land plot: • Container terminal with 3 berths with a total quay length of 1,350 m; • General cargo terminal with 2 berths with a total quay length of 500 m.
Figure 2-2: Southern land plot (final phase)
Container terminals The container terminals will have an estimated cargo throughput capacity of 2,000 TEU/m/yr which is increased compared to the first phase (1,500 TEU/m/yr). The higher capacity is due to an increase of vessel call size and higher quay productivity. The northern terminal has a capacity of 1.8 to 3.6 million TEU (depending on size of AMC) and the Southern terminal will have a capacity 2.7 million TEU, this will result in a total capacity of 4.5 to 6.3 million TEU per year. The quay apron shall be equipped with 4 STS-cranes per berth resulting in 8 or 16 cranes for the northern terminal and 12 cranes for the southern terminal. Both terminals have a terminal depth of 625 m, resulting in a total terminal area of 40 to 110 ha for the northern container terminal and 92 ha for the southern one. General cargo terminal The general cargo terminal consists of 2 berths with a total length of 500 m and a terminal area of approximately 35 ha. The terminal has a throughput capacity for 1 million tons of break bulk and 0.5 million tons of dry bulk. The apron shall be equipped with 6 mobile harbour cranes to enable the loading and unloading of break bulk and dry bulk. The storage area shall consist of open, as well as covered/enclosed storage areas.

City of Kwinana – Indian Ocean Gateway Terminal
29-04-2016
REV C memo 10 / 20
2.3 Facilities for tugs, pilots and mooring boats Tugs shall be able to moor along the most southern edge of the land plot, since the livestock berth only has a length of 250 m, more than enough space is available to develop tug facilities for the Outer Harbour.
2.4 Existing intakes and outtakes The existing intakes and outtakes of the power plant and desalination plan shall be redirected through an underground network of pipelines towards the basin between the two terminal areas. Especially the relocation of the desalination intake needs to be carefully considered since the intake water should be of sufficient quality. When the intake is too close to a vessels propellers it could seriously hamper the quality of the intake water since the increased turbidity will lead to more sediments/pollution in the intake water.
2.5 Hinterland connections Both port areas shall be individually connected to the existing road and railway network. It is foreseen that 30 % of the inland container traffic shall arrive or leave the port by train and 70 % by truck. The percentage can change depending on government policy changes and corresponding investments. Incoming and outgoing trains shall have a length of 1,600 m and have a capacity of approximately 120 TEU. The trains shall be split up in two parts of 800 m when arriving at the terminals, the splitting up of trains is common practice throughout the world and results in higher operating efficiencies. Each container terminal shall be able to load or unload 2 trains at the same time resulting in 4 x 800 m rails per container terminal. Double stacking on the trains can also be considered.

City of Kwinana – Indian Ocean Gateway Terminal
29-04-2016
REV C memo 11 / 20
3. Environmental Conditions
Beside the functional requirements, as described in section 2, the master plan is for an important part also dictated by the environmental conditions. From a functional and technical perspective, wave, wind and current climate dictate the dimensioning and orientation of the approach channel, orientation of the quays, turning circle dimensions and in the end the operability of the various berths. Site information was gathered from available open source information and from preliminary numerical wave modeling studies. In sections below the design starting points are summarized, which form the basis for the preliminary master plan design. More detailed background information can be found in document [Indian Ocean Gateway Coastal and Marine Aspects]. 3.1 Water level variations
Information with regards to tidal range for the Port of Fremantle has been found in the Australian National Tide Tables and Admiralty Tide Tables Volume 4:
• Highest Astronomical Tide 1.400m • Mean High Water Springs 1.130m • Mean High Water 0.972m • AHD 0.756m • Mean Sea Level 0.728m • Mean Low Water 0.503m • Indian Spring Low Water 0.396m • Lowest Astronomical Tide 0.200m • Fremantle Datum 0.000m
Mean Sea Level may lower during the summer months, when breezes off the land and High pressure systems are general, and raised during winter months. Prior to, and during winter Gales, the water may rise to 1.5m, and on rare occasions to 1.8m, above chart datum.

City of Kwinana – Indian Ocean Gateway Terminal
29-04-2016
REV C memo 12 / 20
3.2 Currents in the Cockburn Sound
It is concluded that for this conceptual study tidal and wind driven currents can be considered benign and will have limited effects on navigation and mooring of ships at the Indian Ocean Gateway. Based on available information, operational current climate is typically in the order of 0.02 – 0.1m/s with occasional increase to 0.25m/s during storm conditions (wind driven).
3.3 Wave climate
The wave climate to a large extent determines the economic feasibility of the facilities. Considering the benign current climate, wave conditions on site are expected to have largest impact on operability of the marine facilities of the IOG. If waves in the channel and/or at the berths are too high for safe (un) loading, there will be downtime. Wave heights close to conditions for safe mooring can result in the ships having to de-berth from the quays for safety reasons and depart to deep waters, where the effects of waves are less pronounced. Downtime can significantly affect the economic feasibility of the port. From a qualitative assessment of the area in the vicinity of the IOG the following is seen:
• Fremantle Port (FP) entrance is, compared to IOG, relatively exposed to waves; • Historic rock armoured breakwaters, initially built in 1890, protect the inner harbor; • The AMC (neighbouring IOG) is also protected from waves by rock breakwaters; • The AMC is exposed to waves from W and NW; only sheltered by Garden Island
from frequent waves from SW; • Cockburn Sound, in which the IOG is planned, lies sheltered behind Garden Island
from the predominant wave directions (about 99% of time from W and SW), providing a relatively sheltered environment that is ideal for a port. This is confirmed by the following:
• Shoreline in Cockburn Sound is relatively unprotected, with many industrial facilities right behind the beach. This would not be the case if the wave climate could become severe as it would endanger the structural integrity of these unprotected areas.
• Many exposed jetties can be found in this area; however the orientation of these jetties (finger pier type) are different from the IOG (planned parallel to the shore).
Figure 3-1: Exposed bulk jetty and unprotected (beach) shoreline in Cockburn sound area

City of Kwinana – Indian Ocean Gateway Terminal
29-04-2016
REV C memo 13 / 20
Offshore hind cast data for a period of 30 years has been gathered and analyzed and subsequently the near shore climate has been determined using a numerical wave model. The following can be summarized with regards to the offshore wave climate, some 60km outside of the Kwinana coastline: • Predominant offshore wave direction is from SW, with over 98% of the waves coming
from between 220° and 250° (relative to true North). • Around 1% of the offshore waves comes from due W and around 0.5% from WNW • Offshore wave climate is characterized by long period waves, with peak periods generally
between 11 and 14s and occasionally up to 22s • A design storm with occurrence of 1/1 year results in a significant wave height of
Hs=6.9m offshore. For a once in 100 year event the offshore wave height is Hs=11.5m More detailed information can be found in report [Indian Ocean Gateway Coastal and Marine Aspects] Near shore wave climate For operability of the container terminal, the actual day-to-day (operational) wave and wind climate is of main impact and not the extreme, rare storm events that occur once every 10 or 50 years. The events with longer return periods govern the design of the various structures, which is outside of the scope of this study. The conditions selected for the numerical study are the wave and wind conditions during a storm with a return period of 1/1 year. These conditions have been translated into conditions at the quays of the IOG development by numerical modelling. Figure 3-2 shows how the waves approaching from SW direction propagate toward the shoreline. The sheltering effect of Garden Island can clearly be seen.
Figure 3-2: Wave model output in a 2D plot

City of Kwinana – Indian Ocean Gateway Terminal
29-04-2016
REV C memo 14 / 20
The output from the wave model has been gathered at 3 points, at the Northern, the Middle and the Southern end of the development.
Figure 3-3: Output points for the wave model
Results at these output points can be found in report [Indian Ocean Gateway Coastal and Marine Aspects]. Generally the wave climate can be described as benign, with 95% - 97% of waves below Hs = 0.7m. However, these are mostly long period waves which may cause unfavorable ship motions that can negatively affect (un)loading rates of containers. Too large ship motions can also cause exceedance of line loads.
Wave height non-exceedance percentage Condition North boundary Middle South
Hs < 0.5m 88% 85% 94% Hs < 0.6m 94% 92% 96% Hs < 0.7m 96% 95% 98%
Table 3-1: Wave height under exceedance

City of Kwinana – Indian Ocean Gateway Terminal
29-04-2016
REV C memo 15 / 20
4. Navigation
From an environmental perspective it is considered most favorable to limit dredging operations. This can be achieved by following existing shipping channels. In Figure 4-1 the channel outline has been included in the Nautical chart of the area. An alternative would be a short, direct approach channel through the reef. This may result in limited dredging volumes, but it could have unfavorable environmental consequences. Also waves breaking on the reefs can cause unfavorable loads on the vessel. This could be something to further investigate in a follow-up stage of the project. The channels will have to be deepened and widened to account for the largest Triple E class ships. A net channel width of 300m and channel depth of -18m CD is required to accommodate these ships. The turning circle has a diameter of 800m. To allow access of Capesize class bulk carriers in future, the channel would have to be deepened up to -19.5m. Channel width and turning circle diameter can most probably remain unchanged, unless navigation assessments show that these ships, which are less maneuverable than container ships, require more space. This deepening can be done in the future when it is concluded that Capesize class vessels are expected. Deepening the channel and whole port area would incur quite a large additional investment. A proper study would need to be performed in due time to determine if this is really worth the investment.
Figure 4-1: Approach Channel outline

City of Kwinana – Indian Ocean Gateway Terminal
29-04-2016
REV C memo 16 / 20
5. Mooring aspects
Ships moored at a quay or jetty experience 6 degrees when exposed to winds, waves and currents (Figure 5-1). When comparing to bulk vessels, container vessels are less flexible with regards to (un)loading operations. Surge motion is most critical for (un)loading operations as the operator is almost unable to adapt to this type of motion as the cranes are effectively static in the along quay direction.
Figure 5-1: Ship motions [PIANC report 115 – 2012: Criteria for the (un)loading of container vessels]
Natural period of oscillation means that ship motions are increased / accelerated for waves with these periods (wave length is directly related to the wave period). Vertical motions (heave, roll and pitch) have a typical natural period of oscillation of 10s to 15s. Waves encountered at the IOG commonly have peak periods in this range, hence ship motions can be critical for (un)loading operations. Horizontal motions (surge, sway and yaw) have typical natural periods of 40s to 80s. In this preliminary master planning study typical wave periods for the 1:1 year condition lies within the critical range of 10s-15s for the vertical motions. This means that waves with these periods can cause ship motions to increase considerably. However, the wave heights encountered are limited to a few decimeters and might not have large impact. PIANC report Working Group 24 (1995) defines the following maximum values for ship motions for safe (un)loading:
City of Kwinana – Indian Ocean Gateway Terminal
29-04-2016
REV C memo 17 / 20
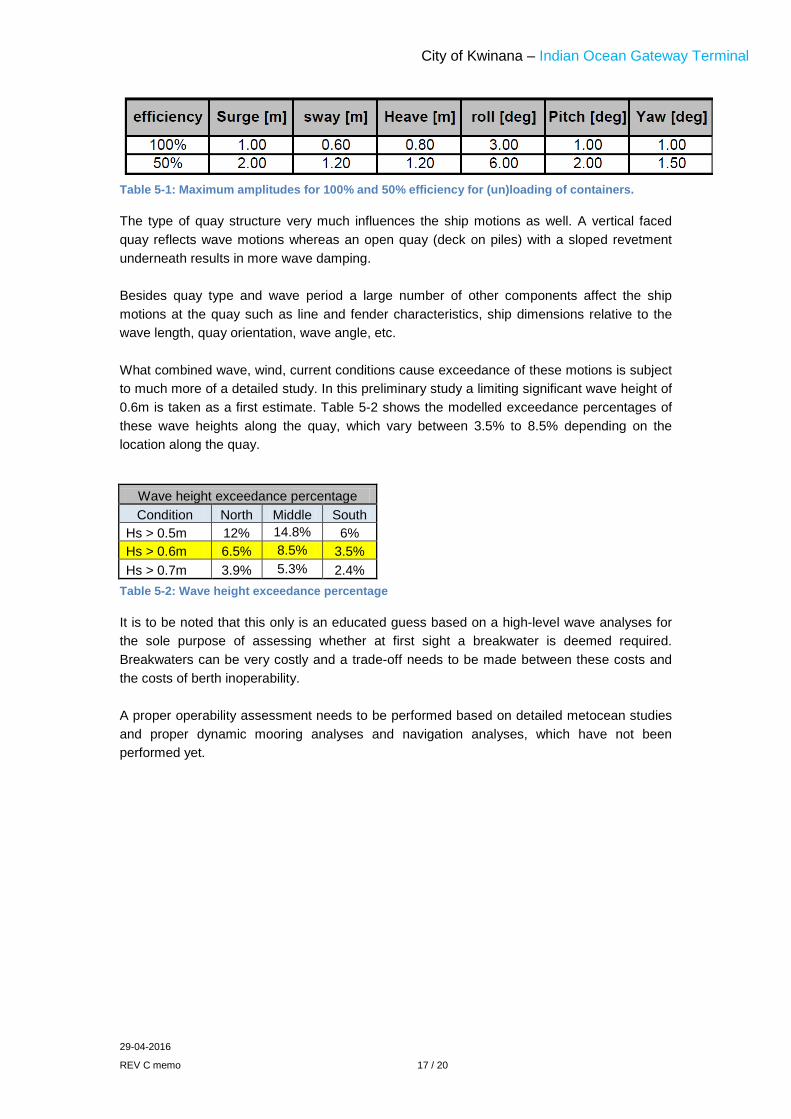
Table 5-1: Maximum amplitudes for 100% and 50% efficiency for (un)loading of containers.
The type of quay structure very much influences the ship motions as well. A vertical faced quay reflects wave motions whereas an open quay (deck on piles) with a sloped revetment underneath results in more wave damping. Besides quay type and wave period a large number of other components affect the ship motions at the quay such as line and fender characteristics, ship dimensions relative to the wave length, quay orientation, wave angle, etc. What combined wave, wind, current conditions cause exceedance of these motions is subject to much more of a detailed study. In this preliminary study a limiting significant wave height of 0.6m is taken as a first estimate. Table 5-2 shows the modelled exceedance percentages of these wave heights along the quay, which vary between 3.5% to 8.5% depending on the location along the quay.
Wave height exceedance percentage Condition North Middle South
Hs > 0.5m 12% 14.8% 6% Hs > 0.6m 6.5% 8.5% 3.5% Hs > 0.7m 3.9% 5.3% 2.4%
Table 5-2: Wave height exceedance percentage
It is to be noted that this only is an educated guess based on a high-level wave analyses for the sole purpose of assessing whether at first sight a breakwater is deemed required. Breakwaters can be very costly and a trade-off needs to be made between these costs and the costs of berth inoperability. A proper operability assessment needs to be performed based on detailed metocean studies and proper dynamic mooring analyses and navigation analyses, which have not been performed yet.

City of Kwinana – Indian Ocean Gateway Terminal
29-04-2016
REV C memo 18 / 20
6. Breakwater alignment (if deemed required after further study)
As mentioned determining whether a breakwater is required is generally a trade-off between the costs of a breakwater versus the benefits in terms of improved berth operability. This choice needs to be made based on detailed studies and comparison of various alternatives in a multi-criteria analyses. In this very early preliminary stage it is not profound whether a breakwater is required. Effect of a breakwater on the surroundings can be significant and a detailed analyses needs to be performed to come to a proper design. In the below sketch a possible breakwater alignment is indicated to provide shelter from incoming waves. An additional option would be to construct a groyne from the Northern shore of Garden Island, to provide more shelter to the Cockburn Sound. Refer to document [Indian Ocean Gateway Coastal and Marine Aspects] for more information.

City of Kwinana – Indian Ocean Gateway Terminal
29-04-2016
REV C memo 19 / 20
Figure 6-1: Optional Breakwater alignment; subject to further study
Beside construction of a breakwater, in-berth operability can be improved by changing the berth orientation to NW-SE direction. Moored ships are very sensitive to beam-on wave conditions and mooring ships with their bows into the main wave direction can improve operability. This option could be further investigated in a next stage if it is concluded that operability needs to be improved. Both options mentioned require very large investments that should only be made after proper and thorough investigation is done on expected downtime caused by waves. Having to seize operations for a few hours per year only (during a storm) could be much more economical than a port that can operate 24/7.

City of Kwinana – Indian Ocean Gateway Terminal
29-04-2016
REV C memo 20 / 20
7. Next steps
Below some further actions are recommended for a next stage study:
1. Detailed trade and traffic forecast; 2. A technical feasibility study, including:
a. Layout alternatives, phasing, operational schemes wave penetration studies; b. Multi Criteria analysis, including discussions with Client and stakeholders; c. Cost estimate;
3. Financial feasibility study; 4. Detailed site conditions study; 5. Detailed dynamic mooring analyses to determine limiting in-berth wave conditions; 6. Ship Navigation study; 7. Marine operability assessment; 8. Assessment of breakwater requirements or other measure to improve operability; 9. Assess effects of any measures on the surrounding area;


