22
Casual Dining Report 2016 thinknowresearch.com #ThinkNowMRX
| Date post: | 15-Apr-2017 |
| Category: |
Marketing |
| Upload: | thinknow-research |
| View: | 54 times |
| Download: | 0 times |

Casual Dining Report
2016
thinknowresearch.com#ThinkNowMRX
2
Contents
Methodology
Research Study Results
Frequency of Going to Casual Dining Restaurants
Day of Week Most Likely to Go
Type of Meal Eaten at Casual Dining Restaurants
Casual Dining Restaurant Occasions
Number of People in Party
With Whom Likely To Go to Casual Dining Restaurant
Dining Restaurant Spending
Casual Dining Restaurants Visited in Past 6 Months
Favorite Casual Dining Restaurant
Most Important Factors When Choosing Restaurants
Restaurants best Described by Statements
Appendix: Demographics
3
Methodology
4
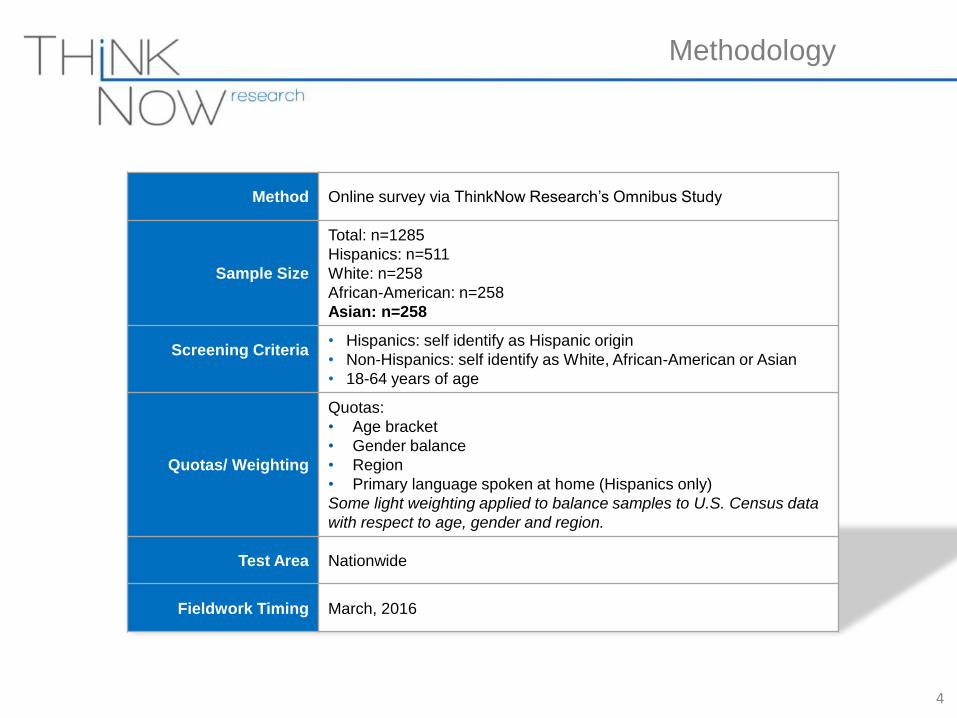
Methodology
Method Online survey via ThinkNow Research’s Omnibus Study
Sample Size
Total: n=1285
Hispanics: n=511
White: n=258
African-American: n=258
Asian: n=258
Screening Criteria• Hispanics: self identify as Hispanic origin
• Non-Hispanics: self identify as White, African-American or Asian
• 18-64 years of age
Quotas/ Weighting
Quotas:
• Age bracket
• Gender balance
• Region
• Primary language spoken at home (Hispanics only)
Some light weighting applied to balance samples to U.S. Census data
with respect to age, gender and region.
Test Area Nationwide
Fieldwork Timing March, 2016
5
An authority on creating and managing research products that help
clients gather insights about rapidly changing consumer segments
• Research experience specifically in the Hispanic, African
American, Asian and Total Market.
• Only full-service market research company that owns & operates
an in-house Hispanic panel
• Servicing Fortune 500 clients, ad agencies, non-profits and other
market research companies
• Experience in hard-to-reach demographic sub-groups
• Conduct online, in-person and telephone research
Who We Are

6
QUALITATIVE
QUANTITATIVE
o Online market research communities
o Concept and copy testing
o Advertising effectiveness
o Online panel building
o Website usability studies
o Omnibus surveys
o Attitudes & Usage
o Brand Tracking
o Product testing
o Online & offline qualitative MIXED MODE
ONLINE
PANEL
PHONE
INTERCEPTS
Our Services
7
Survey Results

8Base: Hispanics (n=541), Whites (n=212), African Americans (n=211), Asians (n=226)
Frequency of Going to Casual Dining Restaurants
49%
84%
45%
82%
38%
81%
49%
88%
Once a week or more often Once a month or more often
Hispanic (A) White (B) African American (C) Asian (D)
About how often do you go to casual dining restaurants?
C
Letters indicate statistically
significant difference (95% confidence)
C
Approximately half of Asian adults eat at a casual dining restaurant at
least once a week. This is similar to Hispanics and significantly higher
than African-Americans.
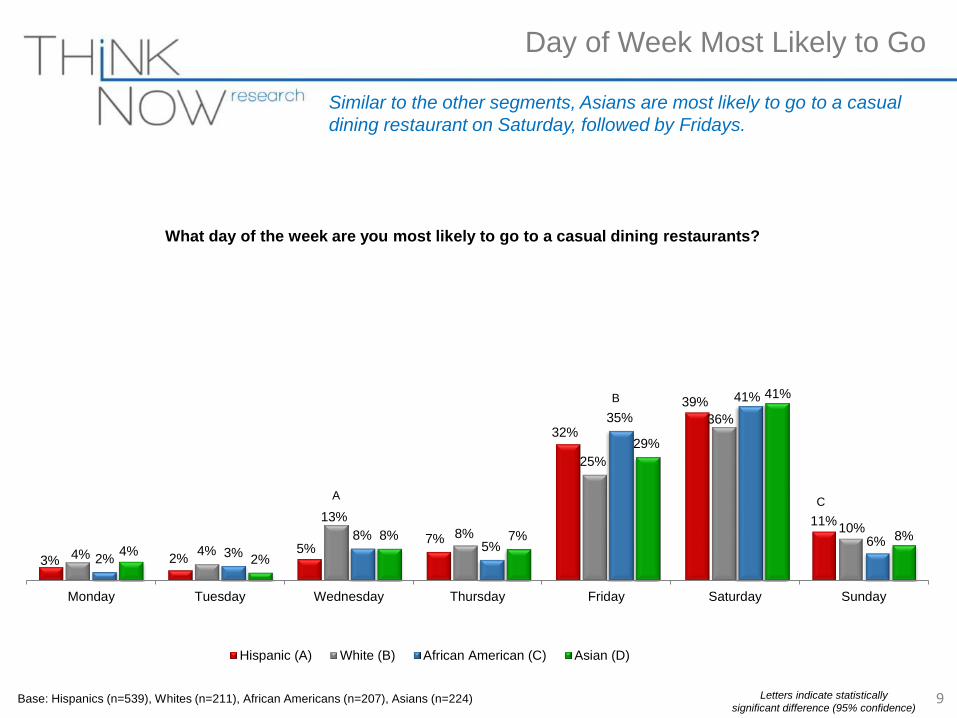
9Base: Hispanics (n=539), Whites (n=211), African Americans (n=207), Asians (n=224)
Day of Week Most Likely to Go
3% 2%5%
7%
32%
39%
11%
4% 4%
13%
8%
25%
36%
10%
2% 3%
8%5%
35%
41%
6%4%
2%
8% 7%
29%
41%
8%
Monday Tuesday Wednesday Thursday Friday Saturday Sunday
Hispanic (A) White (B) African American (C) Asian (D)
What day of the week are you most likely to go to a casual dining restaurants?
A
Letters indicate statistically
significant difference (95% confidence)
B
C
Similar to the other segments, Asians are most likely to go to a casual
dining restaurant on Saturday, followed by Fridays.

10Base: Hispanics (n=539), Whites (n=211), African Americans (n=207), Asians (n=224)
Type of Meal Eaten at Casual Dining Restaurants
14% 12%
43%
74%
15%
11%13%
44%
81%
14%16%
13%
43%
81%
18%
9%12%
35%
83%
9%
Breakfast Late Breakfast/Brunch Lunch Dinner Late evening
Hispanic (A) White (B) African American (C) Asian (D)
For what meals do you usually go to a casual dining restaurants?
D
Letters indicate statistically
significant difference (95% confidence)
A A A
DD
Consumers go to casual dining restaurants mainly to have dinner,
although lunchtime is common as well.

11Base: Hispanics (n=539), Whites (n=211), African Americans (n=207), Asians (n=224)
Casual Dining Restaurant Occasions
56%
49%47%
37%40%
34%
11%
52%
55%
52% 50%
42%
36%
13%
44%
50% 51%
39%
50%
38%
10%
60%
53% 53%49%
46%
33%
10%
To spend time withmy family
To go out To have a great meal To not have to cookat home
To spend time withfriends
To celebrate aspecial occasion
Work-related
Hispanic (A) White (B) African American (C) Asian (D)
For what occasions do you go to casual dining restaurants?
Letters indicate statistically
significant difference (95% confidence)
ACACC
C
Asians are the most likely segment to go to casual dining restaurants to
spend time with their family.
12
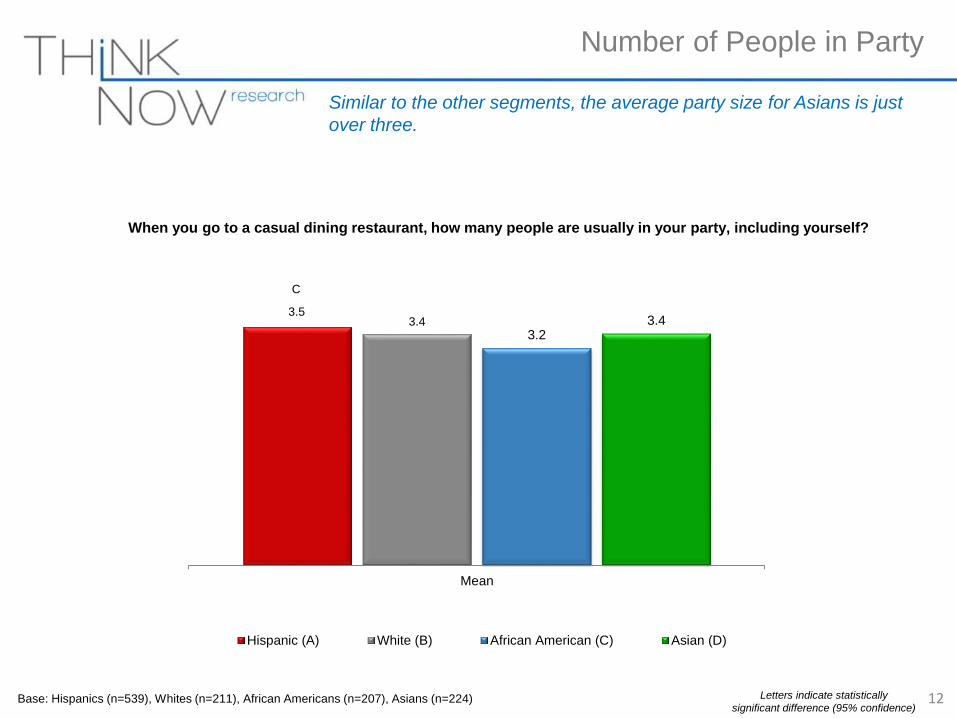
3.53.4
3.23.4
Mean
Hispanic (A) White (B) African American (C) Asian (D)
Base: Hispanics (n=539), Whites (n=211), African Americans (n=207), Asians (n=224)
Number of People in Party
Letters indicate statistically
significant difference (95% confidence)
C
Similar to the other segments, the average party size for Asians is just
over three.
When you go to a casual dining restaurant, how many people are usually in your party, including yourself?
13Base: Hispanics (n=539), Whites (n=211), African Americans (n=207), Asians (n=224)
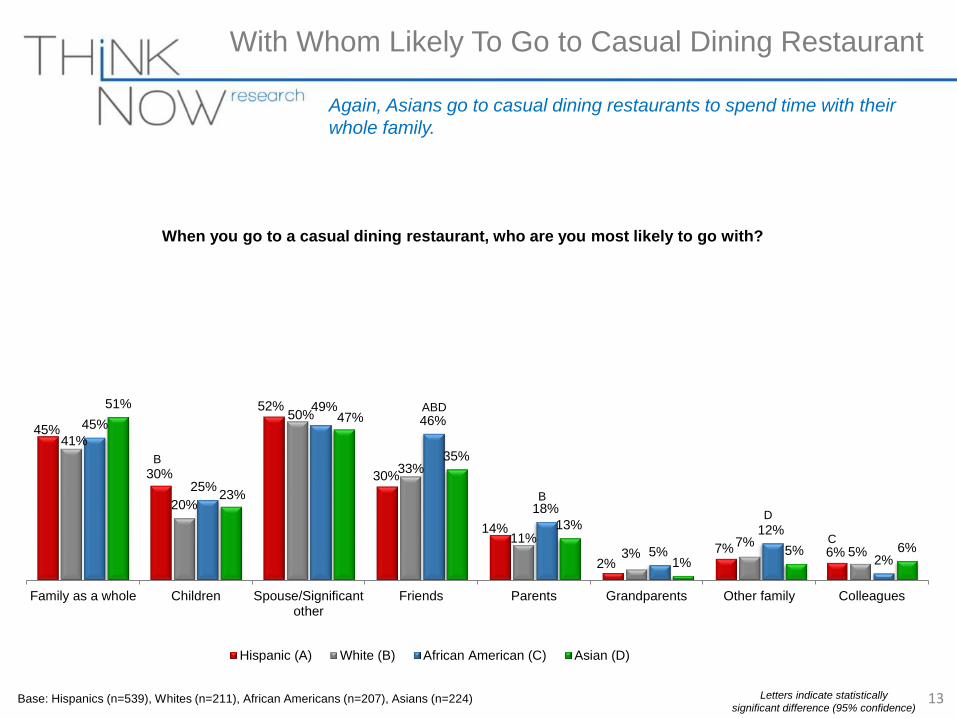
With Whom Likely To Go to Casual Dining Restaurant
45%
30%
52%
30%
14%
2%7% 6%
41%
20%
50%
33%
11%3%
7%5%
45%
25%
49%46%
18%
5%
12%
2%
51%
23%
47%
35%
13%
1%5% 6%
Family as a whole Children Spouse/Significantother
Friends Parents Grandparents Other family Colleagues
Hispanic (A) White (B) African American (C) Asian (D)
When you go to a casual dining restaurant, who are you most likely to go with?
B
Letters indicate statistically
significant difference (95% confidence)
ABD
B
D
C
Again, Asians go to casual dining restaurants to spend time with their
whole family.
14Base: Hispanics (n=539), Whites (n=211), African Americans (n=207), Asians (n=224)
Dining Restaurant Spending:
By Race/Ethnicity
$51 $50
$46
$52
Mean
Hispanic (A) White (B) African American (C) Asian (D)
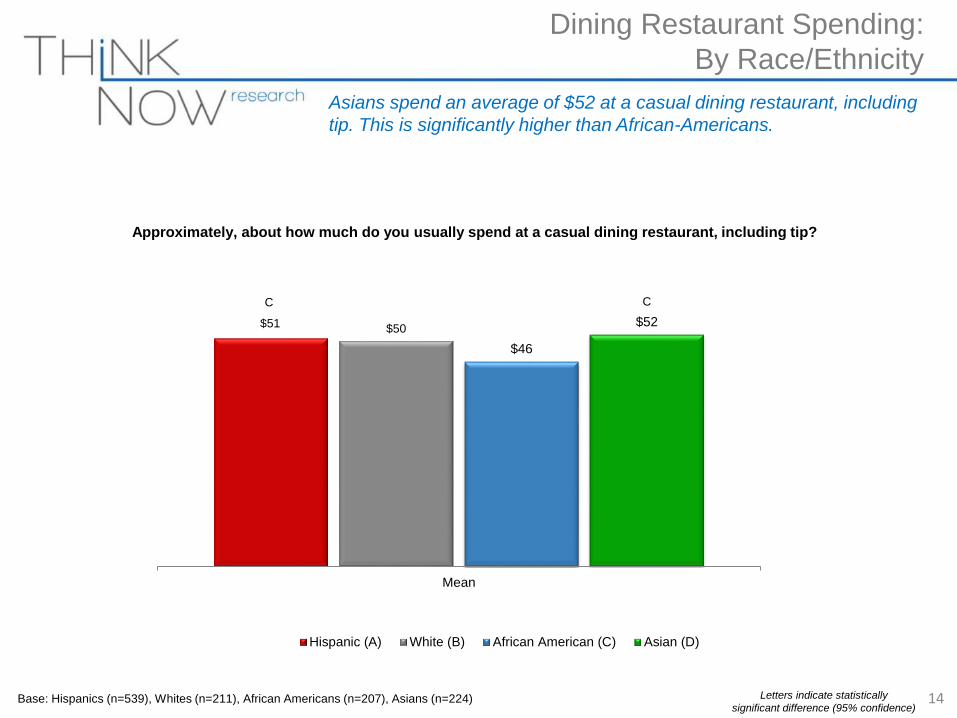
Approximately, about how much do you usually spend at a casual dining restaurant, including tip?
C
Letters indicate statistically
significant difference (95% confidence)
C
Asians spend an average of $52 at a casual dining restaurant, including
tip. This is significantly higher than African-Americans.
15
Casual Dining Restaurants Visited in P6M
Letters indicate statistically
significant difference (95% confidence)
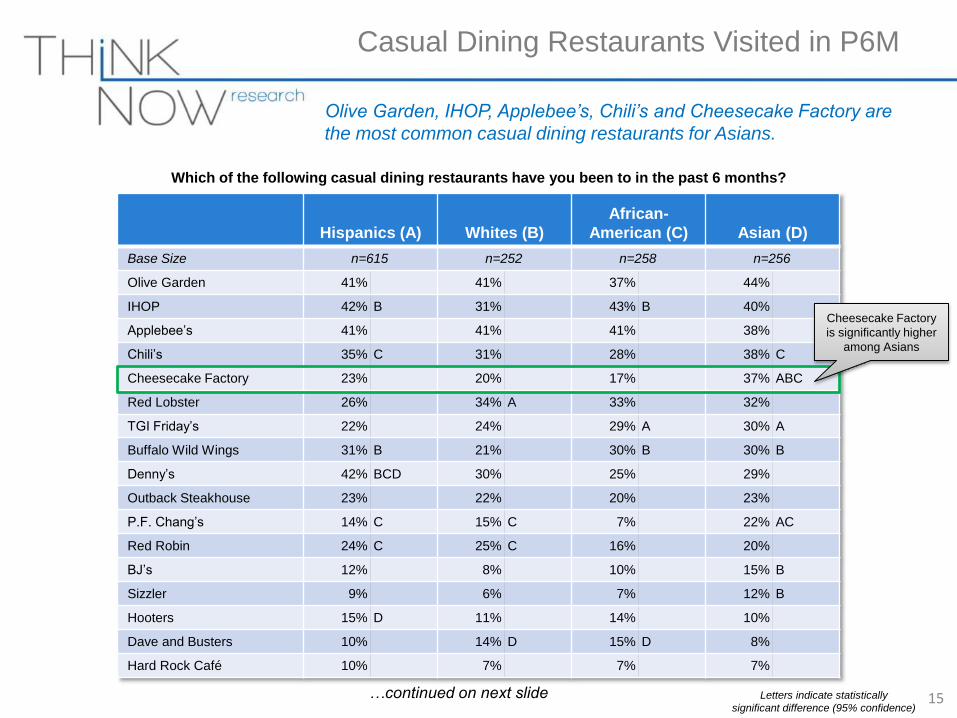
Which of the following casual dining restaurants have you been to in the past 6 months?
Olive Garden, IHOP, Applebee’s, Chili’s and Cheesecake Factory are
the most common casual dining restaurants for Asians.
Hispanics (A) Whites (B)
African-
American (C) Asian (D)
Base Size n=615 n=252 n=258 n=256
Olive Garden 41% 41% 37% 44%
IHOP 42% B 31% 43% B 40%
Applebee’s 41% 41% 41% 38%
Chili’s 35% C 31% 28% 38% C
Cheesecake Factory 23% 20% 17% 37% ABC
Red Lobster 26% 34% A 33% 32%
TGI Friday’s 22% 24% 29% A 30% A
Buffalo Wild Wings 31% B 21% 30% B 30% B
Denny’s 42% BCD 30% 25% 29%
Outback Steakhouse 23% 22% 20% 23%
P.F. Chang’s 14% C 15% C 7% 22% AC
Red Robin 24% C 25% C 16% 20%
BJ’s 12% 8% 10% 15% B
Sizzler 9% 6% 7% 12% B
Hooters 15% D 11% 14% 10%
Dave and Busters 10% 14% D 15% D 8%
Hard Rock Café 10% 7% 7% 7%
Cheesecake Factory
is significantly higher
among Asians
…continued on next slide

16
Which of the following casual dining restaurants have you been to in the past 6 months?
Hispanics (A) Whites (B)
African-
American (C) Asian (D)
Base Size n=615 n=252 n=258 n=256
Corner Bakery 5% 5% 4% 7%
Tony Roma’s 5% 5% 4% 7%
Mimi’s Café 5% 6% 3% 6%
Coco’s 4% 3% 2% 6% C
Black Angus 4% 3% 3% 6%
Johnny Rocket’s 8% 7% 5% 5%
Marie Calendar’s 5% 6% 4% 4%
Elephant Bar 4% 3% 2% 4%
Chevy’s Fresh Mex 5% C 3% 1% 4% C
Island’s 5% C 3% 1% 2%
Bob’s Big Boy 4% 6% 3% 2%
Baker’s Square 2% 3% 2% 2%
Carrow’s 3% C 4% C 0% 2%
Claim Jumper 4% 5% 2% 2%
Letters indicate statistically
significant difference (95% confidence)
Casual Dining Restaurants Visited in P6M (Cont’d)
17
Favorite Casual Dining Restaurant
Letters indicate statistically
significant difference (95% confidence)
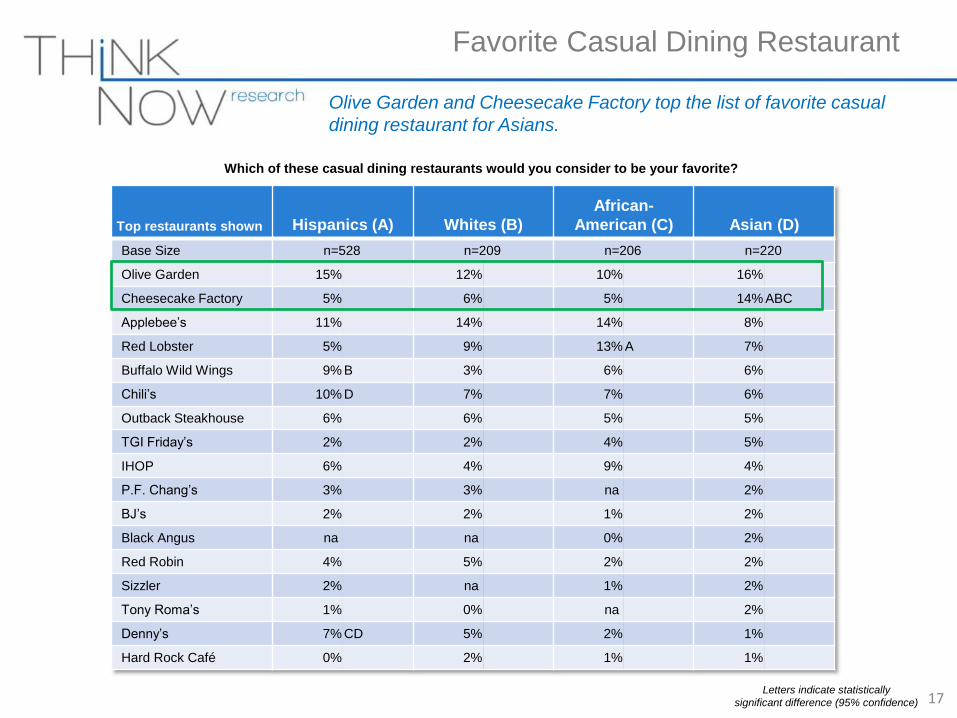
Which of these casual dining restaurants would you consider to be your favorite?
Top restaurants shown Hispanics (A) Whites (B)
African-
American (C) Asian (D)
Base Size n=528 n=209 n=206 n=220
Olive Garden 15% 12% 10% 16%
Cheesecake Factory 5% 6% 5% 14% ABC
Applebee’s 11% 14% 14% 8%
Red Lobster 5% 9% 13% A 7%
Buffalo Wild Wings 9% B 3% 6% 6%
Chili’s 10% D 7% 7% 6%
Outback Steakhouse 6% 6% 5% 5%
TGI Friday’s 2% 2% 4% 5%
IHOP 6% 4% 9% 4%
P.F. Chang’s 3% 3% na 2%
BJ’s 2% 2% 1% 2%
Black Angus na na 0% 2%
Red Robin 4% 5% 2% 2%
Sizzler 2% na 1% 2%
Tony Roma’s 1% 0% na 2%
Denny’s 7% CD 5% 2% 1%
Hard Rock Café 0% 2% 1% 1%
Olive Garden and Cheesecake Factory top the list of favorite casual
dining restaurant for Asians.
18
Most Important Factors When Choosing
Casual Dining Restaurants
Letters indicate statistically
significant difference (95% confidence)
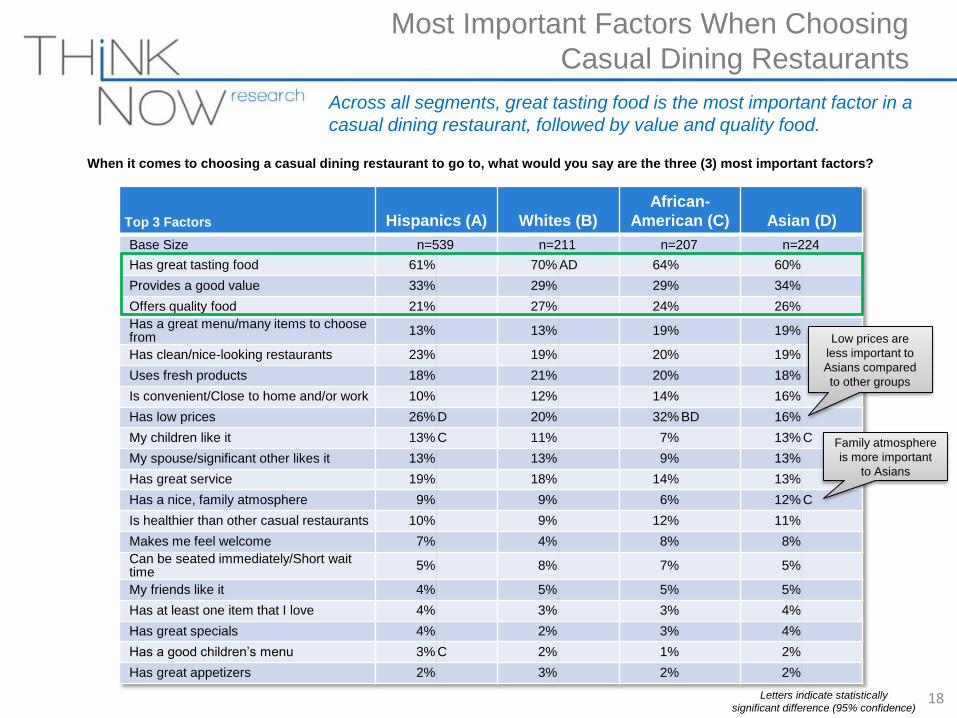
When it comes to choosing a casual dining restaurant to go to, what would you say are the three (3) most important factors?
Top 3 Factors Hispanics (A) Whites (B)
African-
American (C) Asian (D)
Base Size n=539 n=211 n=207 n=224
Has great tasting food 61% 70% AD 64% 60%
Provides a good value 33% 29% 29% 34%
Offers quality food 21% 27% 24% 26%
Has a great menu/many items to choose from
13% 13% 19% 19%
Has clean/nice-looking restaurants 23% 19% 20% 19%
Uses fresh products 18% 21% 20% 18%
Is convenient/Close to home and/or work 10% 12% 14% 16%
Has low prices 26% D 20% 32% BD 16%
My children like it 13% C 11% 7% 13% C
My spouse/significant other likes it 13% 13% 9% 13%
Has great service 19% 18% 14% 13%
Has a nice, family atmosphere 9% 9% 6% 12% C
Is healthier than other casual restaurants 10% 9% 12% 11%
Makes me feel welcome 7% 4% 8% 8%
Can be seated immediately/Short wait time
5% 8% 7% 5%
My friends like it 4% 5% 5% 5%
Has at least one item that I love 4% 3% 3% 4%
Has great specials 4% 2% 3% 4%
Has a good children’s menu 3% C 2% 1% 2%
Has great appetizers 2% 3% 2% 2%
Across all segments, great tasting food is the most important factor in a
casual dining restaurant, followed by value and quality food.
Low prices are
less important to
Asians compared
to other groups
Family atmosphere
is more important
to Asians
19
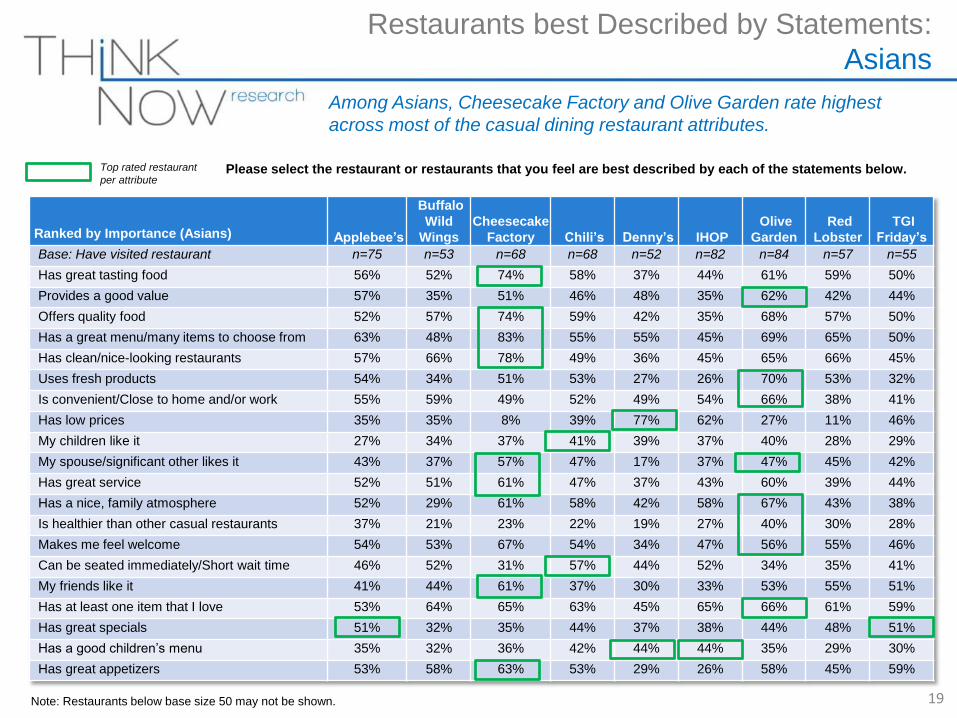
Restaurants best Described by Statements:
Asians
Please select the restaurant or restaurants that you feel are best described by each of the statements below.
Ranked by Importance (Asians) Applebee’s
Buffalo
Wild
Wings
Cheesecake
Factory Chili’s Denny’s IHOP
Olive
Garden
Red
Lobster
TGI
Friday’s
Base: Have visited restaurant n=75 n=53 n=68 n=68 n=52 n=82 n=84 n=57 n=55
Has great tasting food 56% 52% 74% 58% 37% 44% 61% 59% 50%
Provides a good value 57% 35% 51% 46% 48% 35% 62% 42% 44%
Offers quality food 52% 57% 74% 59% 42% 35% 68% 57% 50%
Has a great menu/many items to choose from 63% 48% 83% 55% 55% 45% 69% 65% 50%
Has clean/nice-looking restaurants 57% 66% 78% 49% 36% 45% 65% 66% 45%
Uses fresh products 54% 34% 51% 53% 27% 26% 70% 53% 32%
Is convenient/Close to home and/or work 55% 59% 49% 52% 49% 54% 66% 38% 41%
Has low prices 35% 35% 8% 39% 77% 62% 27% 11% 46%
My children like it 27% 34% 37% 41% 39% 37% 40% 28% 29%
My spouse/significant other likes it 43% 37% 57% 47% 17% 37% 47% 45% 42%
Has great service 52% 51% 61% 47% 37% 43% 60% 39% 44%
Has a nice, family atmosphere 52% 29% 61% 58% 42% 58% 67% 43% 38%
Is healthier than other casual restaurants 37% 21% 23% 22% 19% 27% 40% 30% 28%
Makes me feel welcome 54% 53% 67% 54% 34% 47% 56% 55% 46%
Can be seated immediately/Short wait time 46% 52% 31% 57% 44% 52% 34% 35% 41%
My friends like it 41% 44% 61% 37% 30% 33% 53% 55% 51%
Has at least one item that I love 53% 64% 65% 63% 45% 65% 66% 61% 59%
Has great specials 51% 32% 35% 44% 37% 38% 44% 48% 51%
Has a good children’s menu 35% 32% 36% 42% 44% 44% 35% 29% 30%
Has great appetizers 53% 58% 63% 53% 29% 26% 58% 45% 59%
Note: Restaurants below base size 50 may not be shown.
Among Asians, Cheesecake Factory and Olive Garden rate highest
across most of the casual dining restaurant attributes.
Top rated restaurant
per attribute
20
Sample Demographics
21
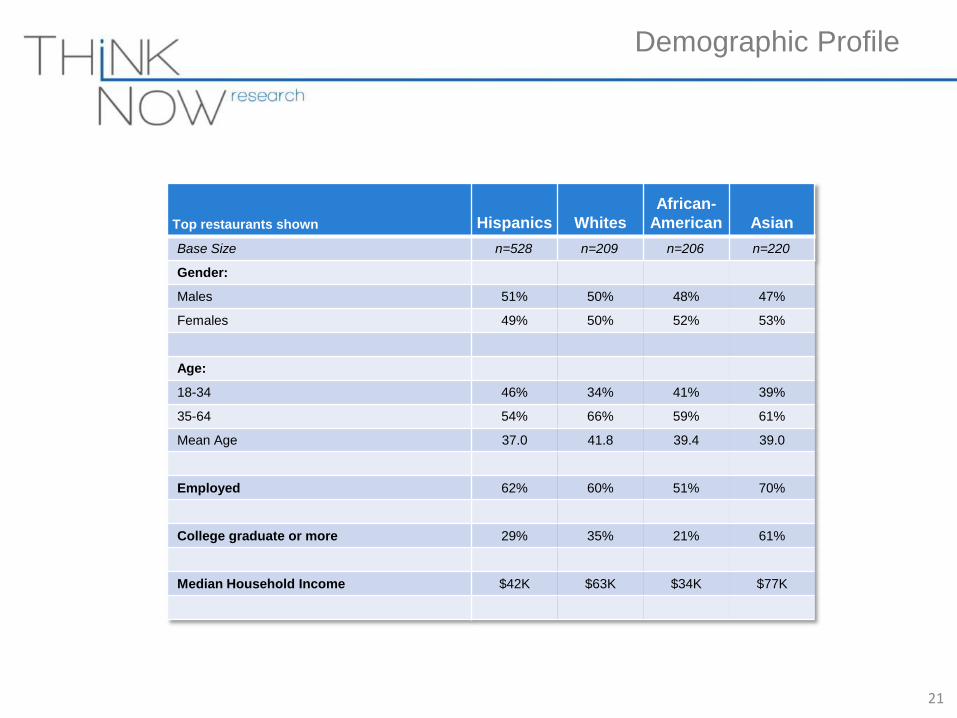
Demographic Profile
Top restaurants shown Hispanics Whites
African-
American Asian
Base Size n=528 n=209 n=206 n=220
Gender:
Males 51% 50% 48% 47%
Females 49% 50% 52% 53%
Age:
18-34 46% 34% 41% 39%
35-64 54% 66% 59% 61%
Mean Age 37.0 41.8 39.4 39.0
Employed 62% 60% 51% 70%
College graduate or more 29% 35% 21% 61%
Median Household Income $42K $63K $34K $77K
22
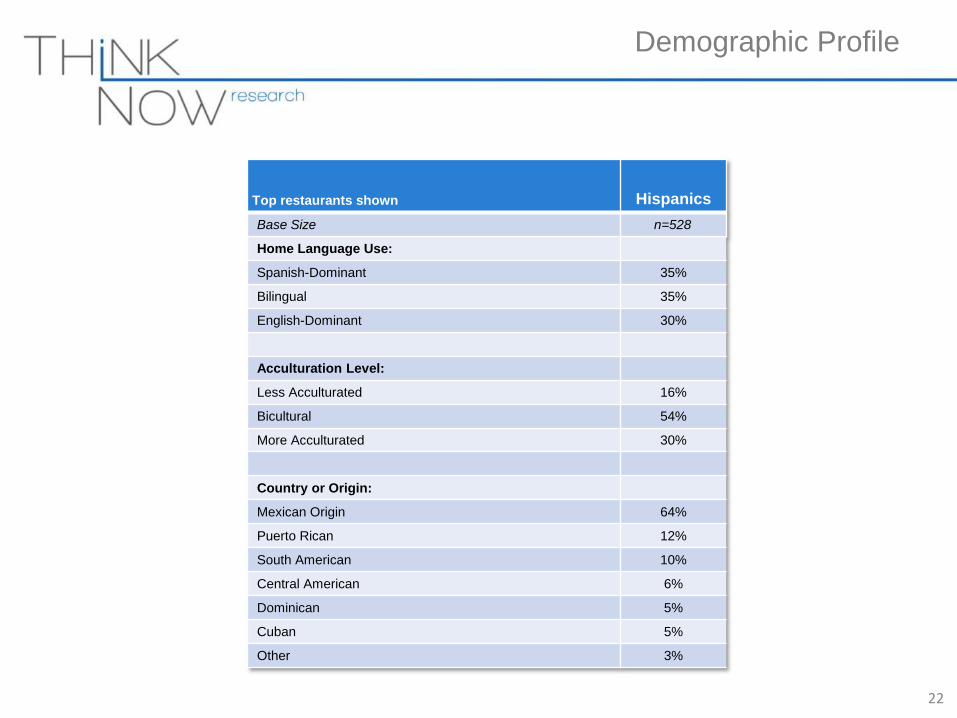
Demographic Profile
Top restaurants shown Hispanics
Base Size n=528
Home Language Use:
Spanish-Dominant 35%
Bilingual 35%
English-Dominant 30%
Acculturation Level:
Less Acculturated 16%
Bicultural 54%
More Acculturated 30%
Country or Origin:
Mexican Origin 64%
Puerto Rican 12%
South American 10%
Central American 6%
Dominican 5%
Cuban 5%
Other 3%


