The Future of ET – A National Initiative Conference for Industry and Education Collaboration Orlando, Florida February 3, 2008 Presenters: Robert Herrick, Head, Electrical & Computer Engineering Technology, Purdue University Mark Pagano, Dean, Continuing Education & Conferences, Purdue University Michael O’Hair, Associate Dean, College of Technology, Purdue University Ray Morrison, President, ACETS, LLC Consulting Gerald Jakubowski, President, Rose-Hulman Institute of Technology Joseph Tidwell, College of Technology & Innovation, Arizona State University-East
Transcript
The Future of ET – A National InitiativeConference for Industry and Education Collaboration
Orlando, Florida
February 3, 2008
Presenters:
Robert Herrick, Head, Electrical & Computer Engineering Technology, Purdue University
Mark Pagano, Dean, Continuing Education & Conferences, Purdue University
Michael O’Hair, Associate Dean, College of Technology, Purdue University
Ray Morrison, President, ACETS, LLC Consulting
Gerald Jakubowski, President, Rose-Hulman Institute of Technology
Joseph Tidwell, College of Technology & Innovation, Arizona State University-East
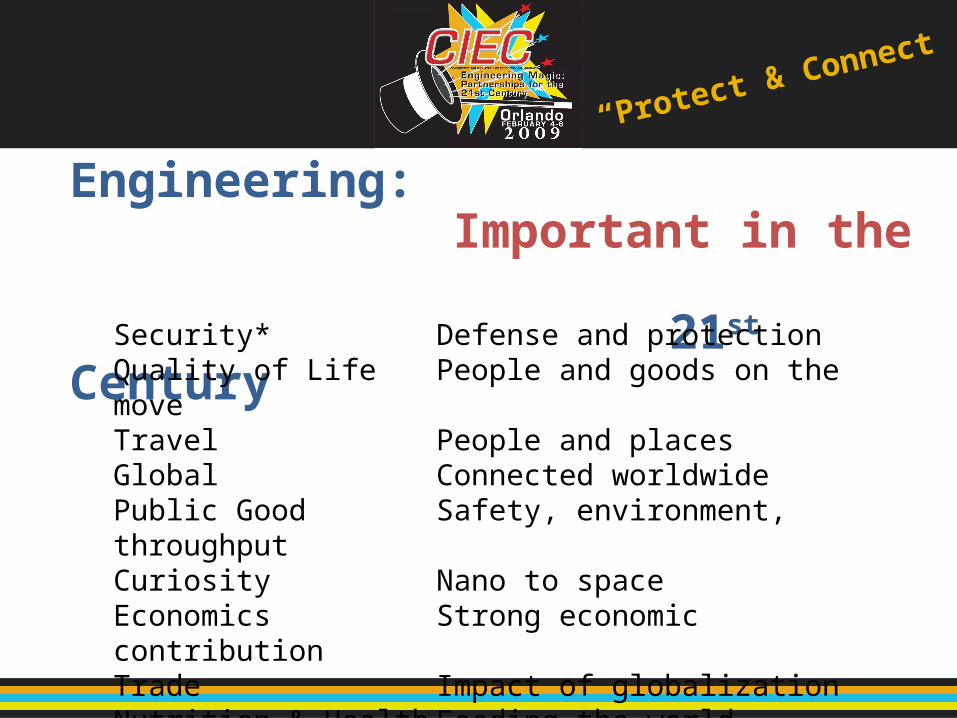
Security* Defense and protectionQuality of Life People and goods on the moveTravel People and placesGlobal Connected worldwidePublic Good Safety, environment, throughputCuriosity Nano to spaceEconomics Strong economic contributionTrade Impact of globalizationNutrition & Health Feeding the world
*Since “9/11” security has taken on a new significance
“Protect & Connect”
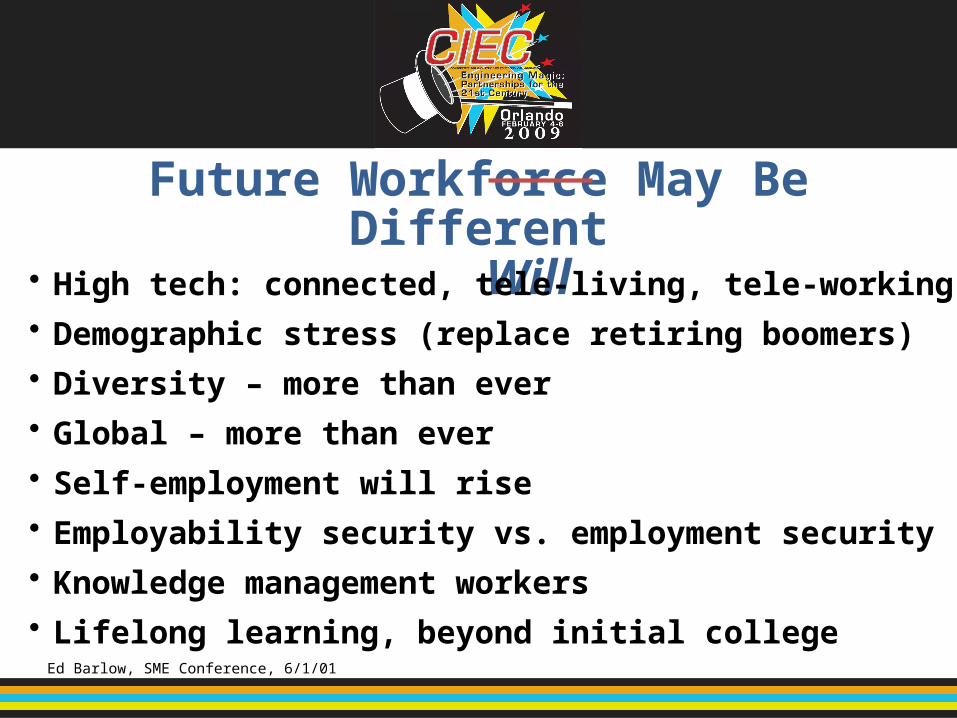
Future Workforce May Be Different Will
• High tech: connected, tele-living, tele-working
• Demographic stress (replace retiring boomers)
• Diversity – more than ever
• Global – more than ever
• Self-employment will rise
• Employability security vs. employment security
• Knowledge management workers
• Lifelong learning, beyond initial collegeEd Barlow, SME Conference, 6/1/01
Qualities for Future SuccessIntegrity:
High moral character, do what’s right – in the right way
Intelligent:Technically competent, broadly-educated, business acumen, eager to learn, a thinker
Capable:Opportunity identifier, problem solver, innovator, team player, risk taker, motivator, educator, mentor
Adaptable:Take new roles, change projects, change locations
Committed:Clear vision, tenacious, courageous pursuit of vision
Skills: Engineering Job Content Will Move Up the Value Chain
1975 2000 2025
BasicsBasics Basics
MethodsMethods Methods
Design
DesignDesign
Integration
Integration Integration
RequirementsRequirements Requirements
Wisdom
Knowledge Management (Knowledge “Re-use”)Information Technology affects Work Content
Data
KM
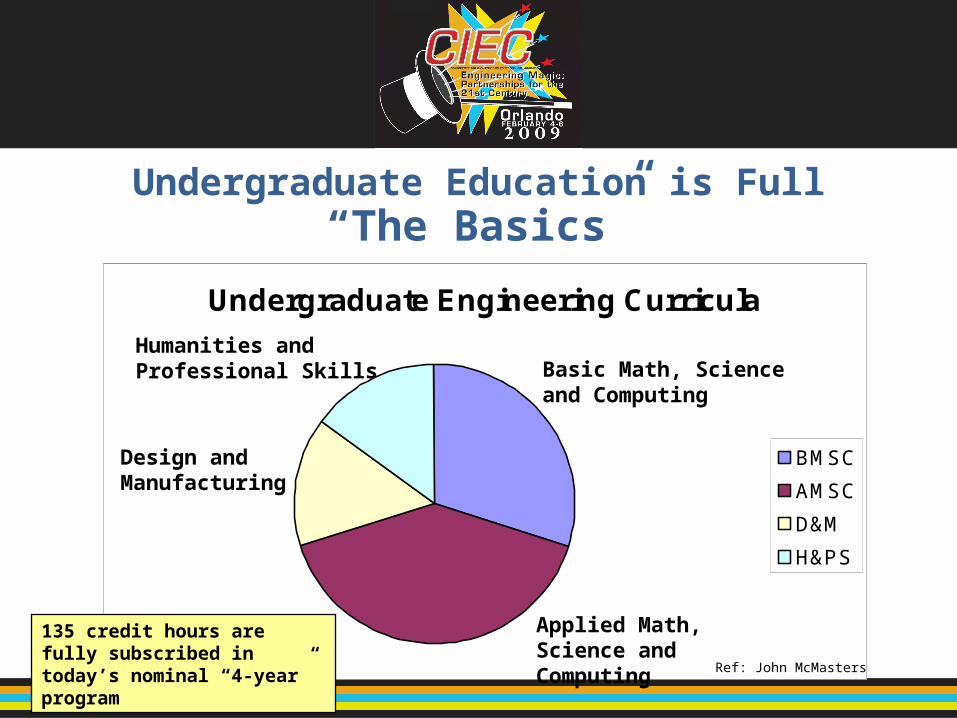
Undergraduate Engineering Curricula
BMSC
AMSC
D&M
H&PS
Basic Math, Scienceand Computing
Applied Math, Science and Computing
Design andManufacturing
Humanities and Professional Skills
Undergraduate Education is Full“The Basics”
135 credit hours are fully subscribed in today’s nominal “4-year” program Ref: John McMasters
Technical Education is Continuous
Technical talent must be educated at school and beyond
Education Continues into Professional Practice
School Work
Technical (engineering, math, science, computing) education and employment pipeline
K-12 College Professional Practice Management & Business
Teaching & Research
BS
ABET accredited2 & 4 year education
Emphasison Science
& Math
On-the-job and formaltraining plus continued
formal education
Basics
BS + 3 yr
Specifics
HS
CC’s
Preparing Engineers for Their Career• Engineering education has made great strides through the
acceptance of the ABET EC & ET 2000 quality standard for accreditation.
• There is only so much material that can be covered in a four-year program; much has to be devoted to the basics of science, math, and engineering fundamentals.
• Industry and the new graduate have to accept their roles in continuing the specifics education process.
• “Nobody is going to take care of you – YOU MUST COMMAND YOUR OWN DESTINY!”
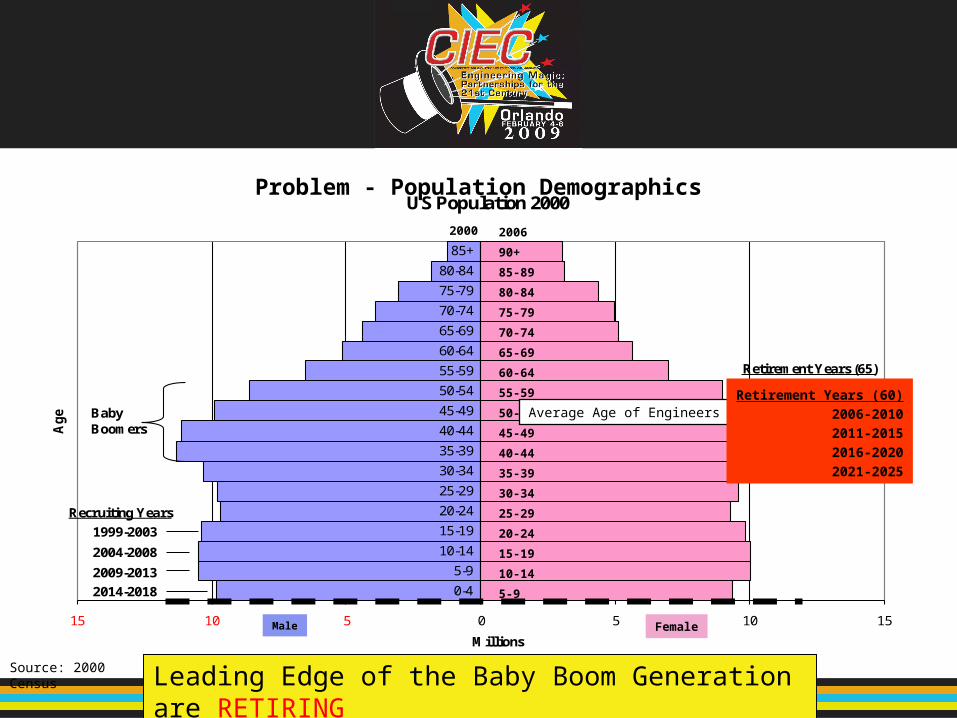
Technical Workforce• Men and women with technical capability will be needed in the future to sustain growth and bring new innovation to improve quality of life throughout the world
• The retirement of the “baby boom” generation will accentuate the need for new talent in the next decade
• Improvements to design/build/service processes and tools will partially offset some of this demand
• Globalization will open new pools of technical talent; in the US, most foreign students return home to work; industry may pursue talent around the globe
• In the USA, the increased percentage of Latinos and African Americans, coupled with the need for women, will factor into the effort to assure a “pipeline” of talent
Future Business Depends on Diversity • Agile, innovative companies need talent with diversity, including teams of different disciplines, linear and non- linear thinkers, working together attitudes, etc
• Diversity of thinking can stimulate innovation– New talent needs to come from a variety of schools in
different parts of the country
• The nature of America’s population is changing and all types of talent needs to be tapped
− Women and ethnic minorities are essential to meet future needs
– Latino and African American populations will continue to increase in the future
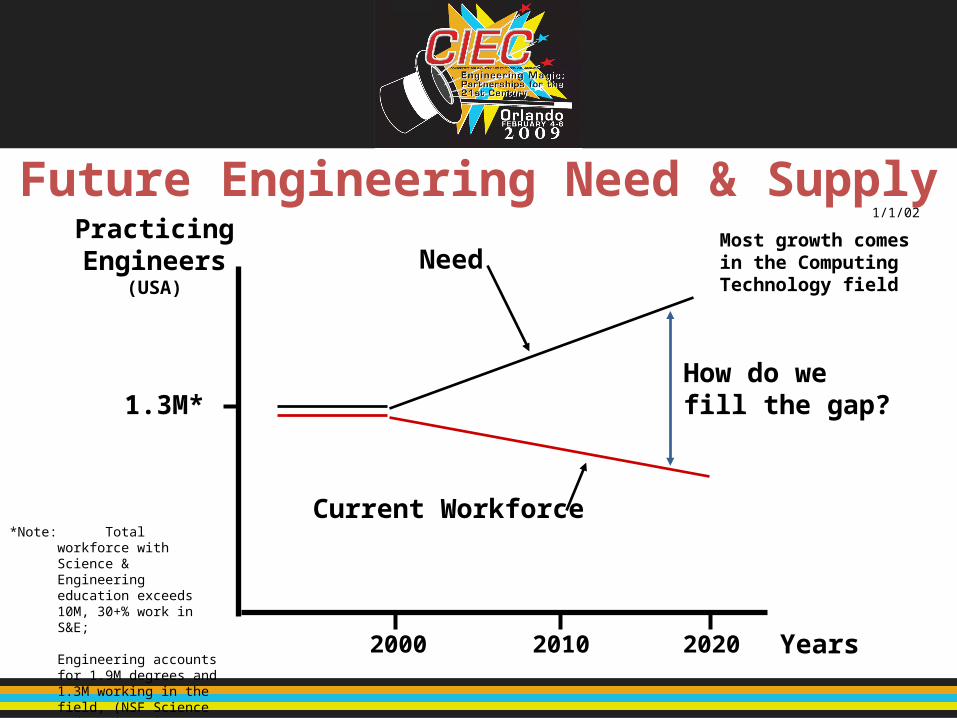
Future Engineering Need & Supply
*Note: Total workforce with Science & Engineering education exceeds 10M, 30+% work in S&E;
Engineering accounts for 1.9M degrees and 1.3M working in the field, (NSF Science and Engineering Indicators 2000)
PracticingEngineers
(USA)
Years2000 2020
1.3M*
Need
Current Workforce
How do we fill the gap?
2010
Most growth comesin the ComputingTechnology field
1/1/02
Session 2: Environmental FactorsFuture of Engineering and Engineering
Technology Education
Gerald S. Jakubowski
Outline
• Response to redefined engineering mission• Concepts of innovation in a competitive world• Future trends in engineering and engineering
technology education
Background• University of Toledo
– Engineering and Engineering Technology (2 yr/4 yr)
• Memphis State University (U of Memphis)– Engineering and Engineering Technology (4 yr)
• Loyola Marymount University– Engineering and Science
• Arizona State University– Engineering and Engineering Technology (4 yr)
Premise
• I believe there is a shortage of technologists and technicians in the U.S.
• I believe there is a pressing need for more technologists and technicians in the U.S.
• I believe that it is incumbent upon us to create a message and start a marketing campaign to recruit prospective students to these programs.
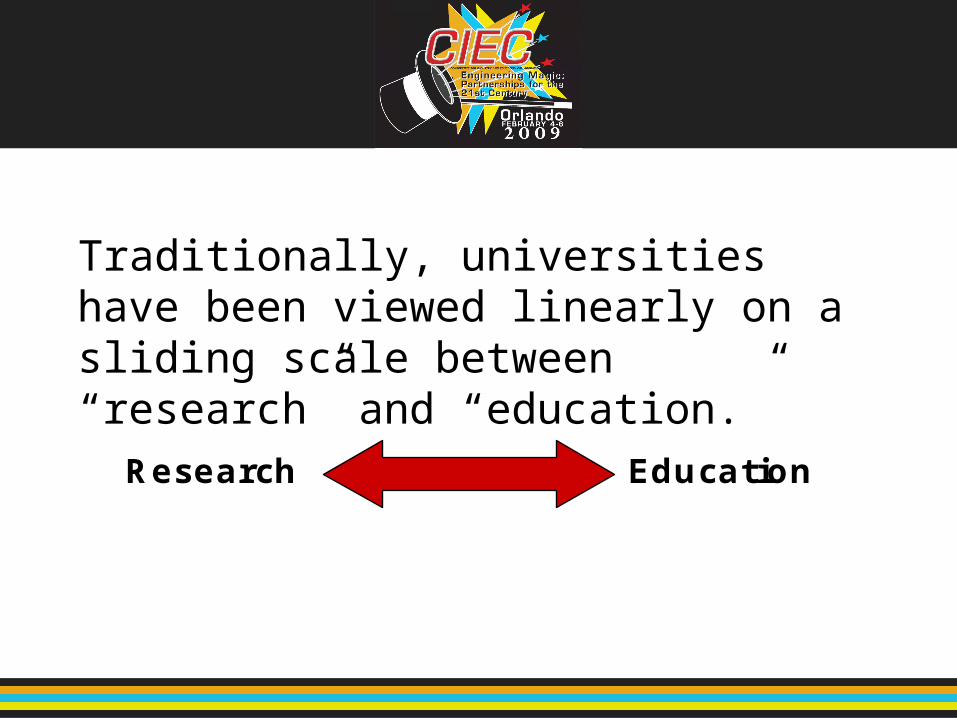
Traditionally, universities have been viewed linearly on a sliding scale between “research” and “education.”
Research Education
A new university view, however, could emerge if “innovation” were added into the scheme.
Research Education
Innovation
The Innovation University
• There is a need to bring more innovative products to market – sooner rather than later.
• Many have suggested that President Obama should create a new cabinet position – a “Department of Innovation.”
• I believe that many universities could better serve our nation if they moved more toward innovation and less away from research.
So innovation … What is it? What’s all the buzz about?
Innovation - Definition
• … the introduction of something new;
• … a new way of doing something;
• … involves the taking of the work of an individual or group of inventors and taking it to a broader audience.
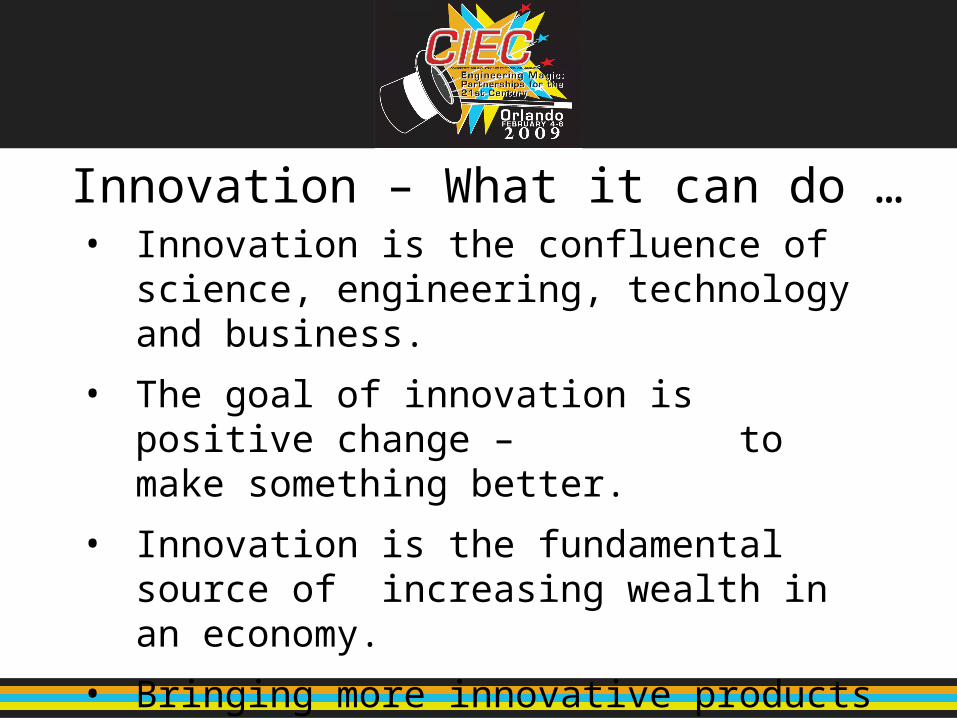
Innovation – What it can do …• Innovation is the confluence of science,
engineering, technology and business.
• The goal of innovation is positive change – to make something better.
• Innovation is the fundamental source of increasing wealth in an economy.
• Bringing more innovative products to market could potentially increase employment and bring the nation out of its economic woes.
Where do engineers, technologists and technicians fit in an “innovation” university?
The Technical Team
• Craftsperson
• Technician
• Technologist
• Engineer
• Scientist
• As a team, each plays a major role in advancing innovation.
PhD, MS, BS +6 years MS, BS BSET (4 Year) ASET (2 Year) Trade School
Research Stage Innovation Stage
TeamPositions
Research and development in basic sciences. Discovery of new inventions and intellectual property.
Design, concept development, project management,risk and cost analysis, manufacturing.
Machine and computer technologist, process control, prototype fabrication,technical documentation, trade and technician supervisor.
Machine and computer technician, process control, prototype fabrication,technical documentation, trade supervisor.
Assembly, machine operator, maintenance.
The Technical Team
Financial Principles and Manpower Utilization
Abstract Scientific Principles
Management
Industrial
Sales
Operations and Maintenance
Construction and Production
Design
Development
Research
Application of principlesin various engineeringfunctions.
What can we as engineers, technologists and technicians bring to the table?
The Innovation University
• By working with companies and entrepreneurs, we can help bring new products to market; and
• We can help produce an educated workforce that is needed for bringing innovative products to market.
Future Trends
• Charles Vest, President NAE
• 2008 ASEE Annual Conference in Pittsburgh
How Can the Grand Challenges be Met?
• By recognizing that these complex problems cannot be solved along traditional engineering disciplines;
• By re-visiting the concept and focusing on the concept of the “entire technical team;”
• By using a team approach;
• By knocking down the silo mentality and developing interdisciplinary programs; and
• By developing innovation universities.
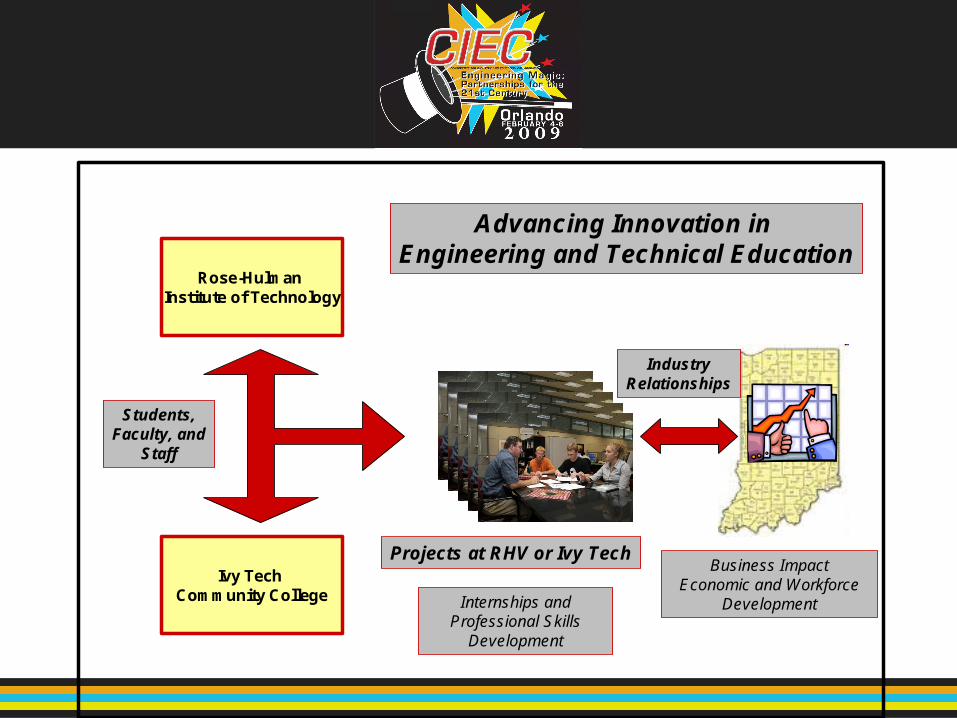
Rose-Hulman
• Rose-Hulman Ventures
• Collaborative Partnership with Ivy Tech Community College
• R-H is walking the talk!
Rose-Hulman Institute of Technology
Ivy Tech Community College
Students,Faculty, and
Staff
Projects at RHV or Ivy Tech
IndustryRelationships
Business ImpactEconomic and Workforce
DevelopmentInternships andProfessional Skills
Development
Advancing Innovation in Engineering and Technical Education
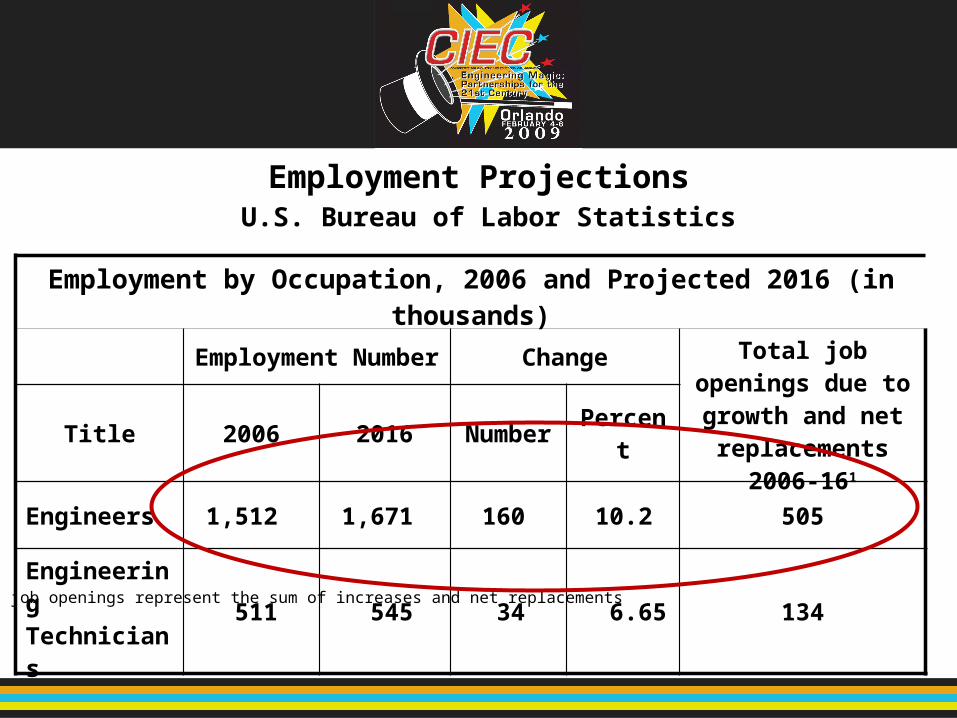
Employment Projections U.S. Bureau of Labor Statistics
1Total job openings represent the sum of increases and net replacements
Employment by Occupation, 2006 and Projected 2016 (in thousands)
Employment Number Change Total job openings due to growth and net replacements
2006-161Title 2006 2016 Number Percent
Engineers 1,512 1,671 160 10.2 505
Engineering Technicians
511 545 34 6.65 134
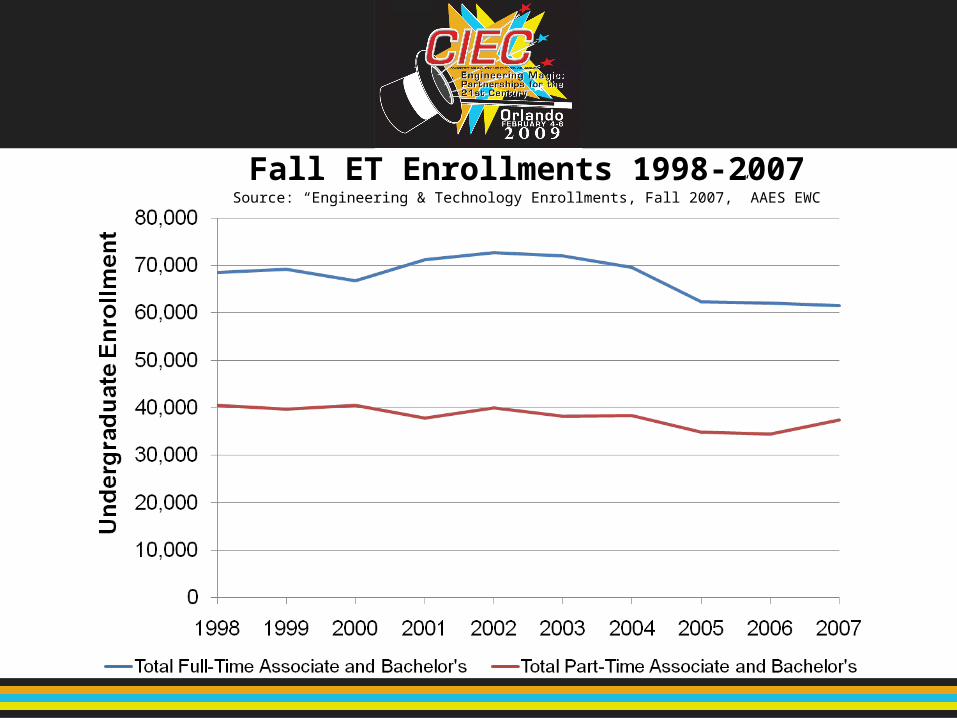
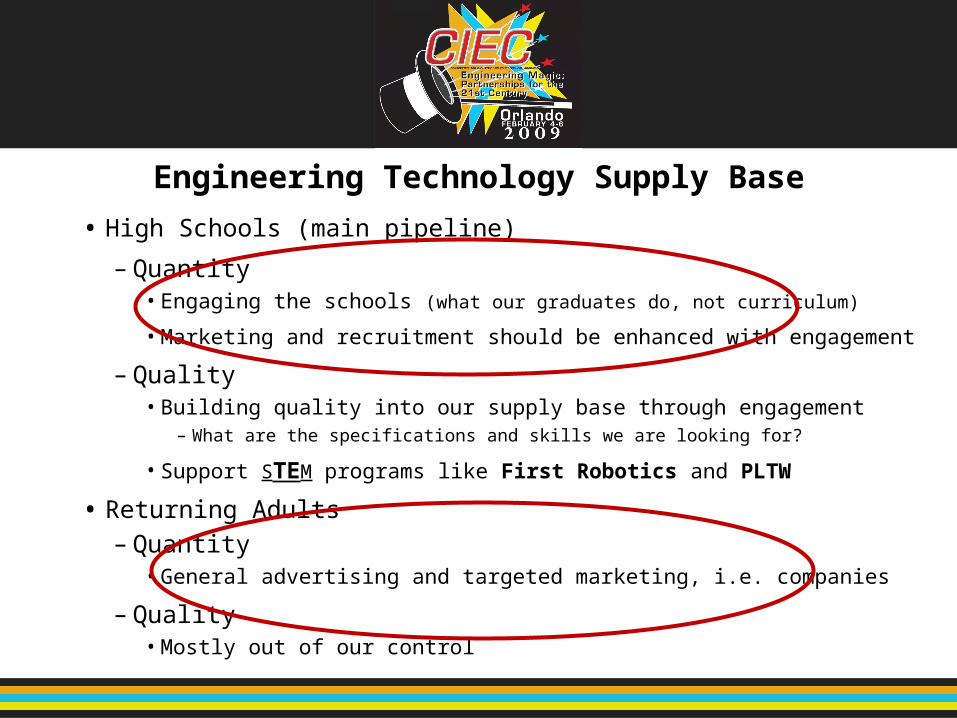
Engineering Technology Supply Base
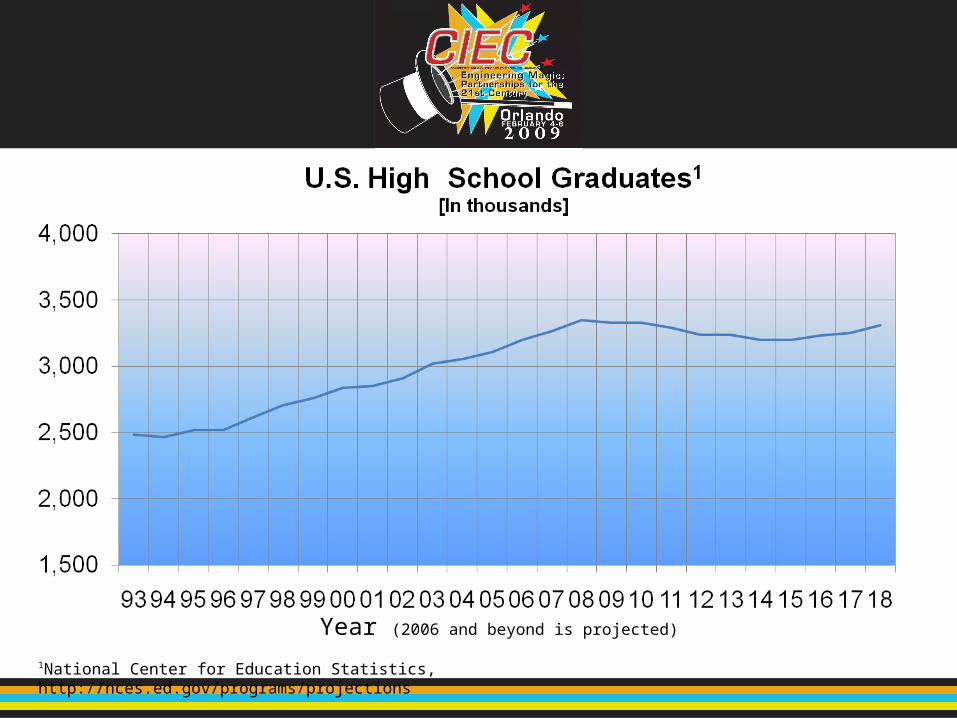
• High Schools (main pipeline)
– Quantity• Engaging the schools (what our graduates do, not curriculum)
• Marketing and recruitment should be enhanced with engagement
– Quality• Building quality into our supply base through engagement
– What are the specifications and skills we are looking for?
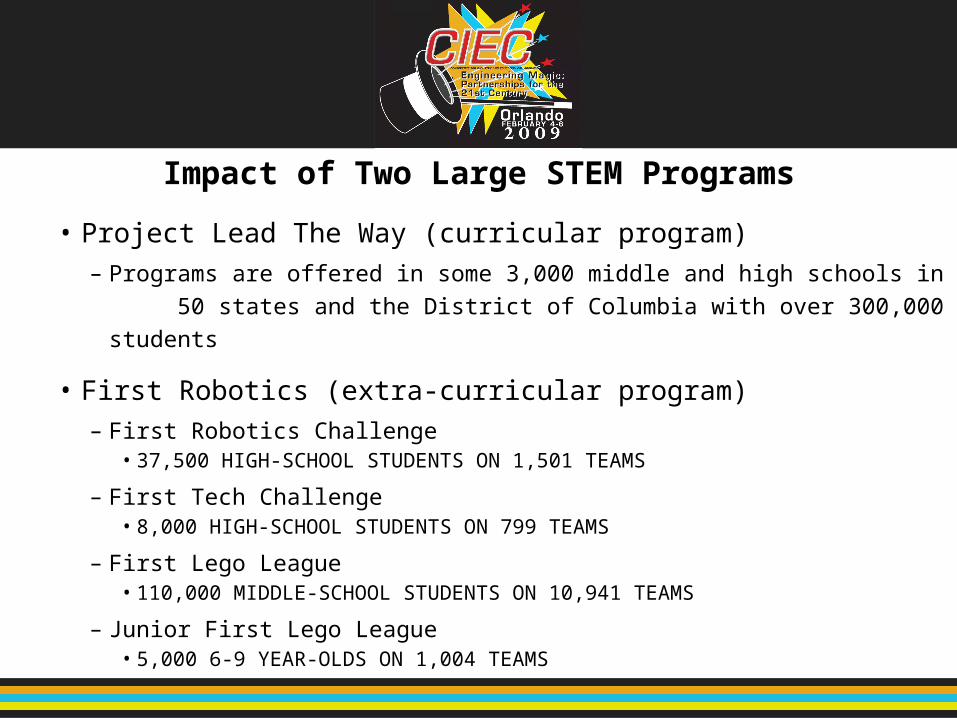
• Support STEM programs like First Robotics and PLTW
• Returning Adults– Quantity
• General advertising and targeted marketing, i.e. companies
– Quality• Mostly out of our control
I believe it is incumbent upon us to create a message and start a marketing campaign to recruit prospective students to engineering and engineering technology programs and to promote the concept of innovation.
Discussion
Education/Industry Partnerships:
Where do we go from here?
Education Pipeline rev. 01 2009
Joseph Tidwell
U.S. Population4.1%
67.2%
13.6%
1.6%0.9%
12.6% Latino
Non-Hispanic white
African American
Native American
Asian American
Other/multi
Source: U.S. Census Bureau, 2003
Latinos & African Americanstoday make up 1/4 of population
Projected U.S. Population by Race: 2000 - 2050
0
10
20
30
40
50
60
70
80
90
100
2000 2010 2020 2030 2040 2050
Pe
rce
nta
ge White alone
Black alone
Asian Alone
All other races*
Hispanic (of any race)
Source: U.S. Census Bureau
* Includes American Indian and Alaska Native alone, Native Hawaiian and other Pacific Islander alone, and two more races
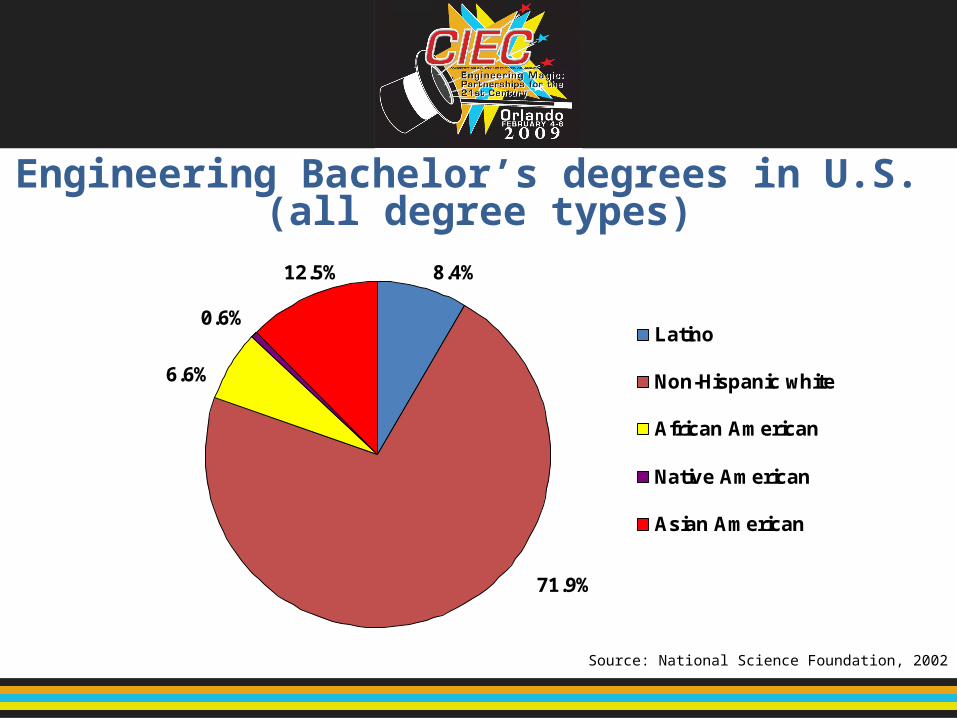
Engineering Bachelor’s degrees in U.S. (all degree types)
Source: National Science Foundation, 2002
12.5%
71.9%
8.4%
0.6%
6.6%
Latino
Non-Hispanic white
African American
Native American
Asian American
U.S. Engineering Workforce (all degree types)
Source: National Science Foundation, 2000
12.3%
79.2%
3.3%1.5%
0.3%
3.3%
Latino
Non-Hispanic white
African American
Native American
Asian American
Other/multi
Latinos & African Americans lag in engineering workforce at 1/4 of Census Participation
Women comprise ~10% of the engineering workforceWomen receive ~20% of engineering degrees (2004)
U.S. Population under age 18
15.3%
18.2%3.7% 2.8%
1.2%
58.8%
Latino
Non-Hispanic white
African American
Native American
Asian American
Other/multi
Source: U.S Census Bureau, 2003
Diversity will increase over time; Latinos and African Americans are 33% of census and 15% of college engineering classes
The Technical Workforce Pipeline
Technical talent must be raised, educated and put to work
Technical (engineering, math, science, computing) education and employment pipeline
School Work
K-12 College Professional Practice Transition to other jobs
Cradle Grave
Overall education system Jobs for all
BS PhDAttract
CC’s
Attrition & other jobs HS
System Framework
GradSchool
The Technical Workforce Pipeline
Technical talent must be raised, educated , and put to work
K-12 College Grad Professional Practice School
Areas where we can take action and support
School Work
Cradle Grave
Overall education system Jobs for all
Technical (engineering, math, science, computing) education and employment pipeline
BS PhDAttract
CC’s
Attrition
Technical CareerEncouragement
Better PrepareScience & Math
Educators
Retain ForeignStudents
Increase Diversity& Participation
SupportColleges
ContinualLearning
GovernmentEducation &
Research
Professional DevelopmentOrganizations
HS
SupportStudents
CulturalChange
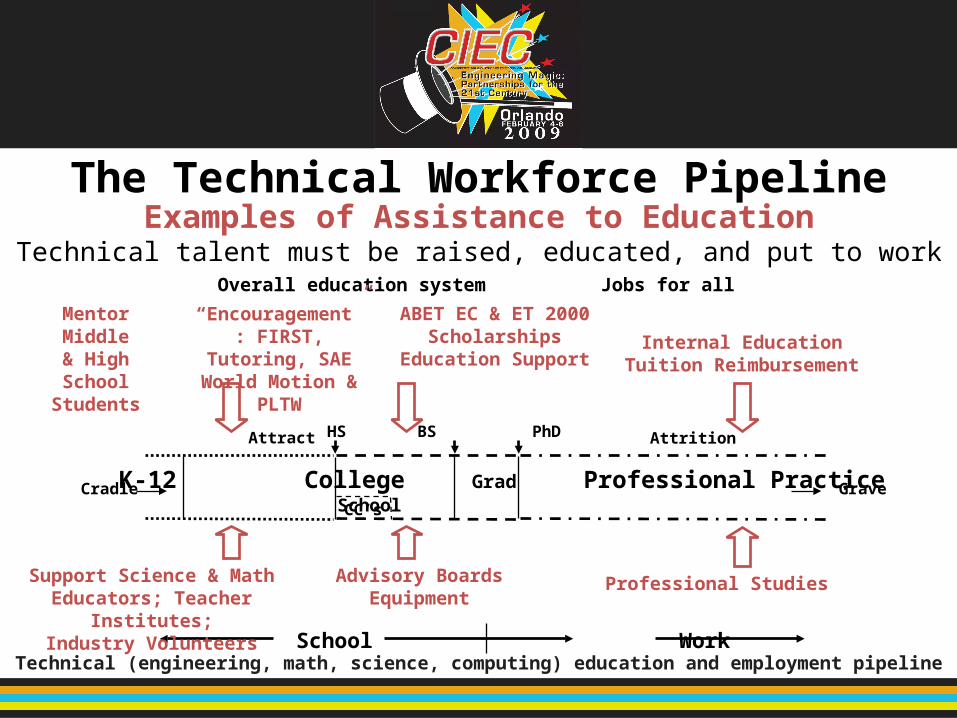
The Technical Workforce Pipeline
Technical talent must be raised, educated, and put to workExamples of Assistance to Education
Cradle Grave
Overall education system Jobs for all
Technical (engineering, math, science, computing) education and employment pipeline
K-12 College Grad Professional Practice School
BS PhDAttract
CC’s
School Work
Attrition
Mentor Middle& High School
Students
Support Science & Math Educators; Teacher Institutes;
Industry Volunteers
ABET EC & ET 2000Scholarships
Education Support
Advisory BoardsEquipment
Internal EducationTuition Reimbursement
Professional Studies
HS
“Encouragement”: FIRST, Tutoring,
SAE World Motion & PLTW
Technical Workforce Pipeline• Our future depends on capable technical workforce
• We need to do our part to assure a “pipeline” of talent
• This is a “holistic” effort
• Our support should have these aspects:- Support for K-12 students and science & math teachers -- focus
on primary & middle school
- Education goes beyond giving money -- mentoring, training
- Volunteerism is important
- Support for college students and selected schools
- Acceptance that we all have a role in continued education
- Education doesn’t stop with the degree
- Company relationship is significant
- Personal involvement is important
How can we help the pipeline?
• The overall need for technical workers will continue.
• Many youth are in the system, but only a few take up the Engineering and Technical career path. More need to be encouraged in Math & Science, particularly early in the K-12 segment.
• Many technical people go on to other occupations later in their career. Engineering offers numerous career paths.
• Industry and government can play several roles by encouraging both students & the education system:
- Science, Math & Technical aspects in K-12 education
- Technical education, access & diversity in college
- Continual learning for industry employees
What can be done to improve?All parties need to do their part to strengthen the Pipeline; no single entity can do it all. It is a holistic process.
Young people, their parents, mentors, industry, academia, government, et al, have finite resource capability.
A change in our culture may be necessary to promote and support desirable technical careers.
We need to know which initiatives actually are effective in raising the number of technical workers, particularly those from under-represented segments.