The Future of Human Resources in Canadian Libraries The 8Rs Research Team University of Alberta Ernie Ingles (Chair), Vice-Provost (Learning Services) and Chief Librarian Kathleen De Long, Associate Director, Finance and Human Resources Chuck Humphrey, Data Library Coordinator Allison Sivak, Research Associate Tandem Social Research Consulting Dr. Marianne Sorensen, Chief Methodologist Jennifer de Peuter, Research Associate
Transcript
The Future of Human Resources
in Canadian Libraries
The 8Rs Research TeamUniversity of Alberta
Ernie Ingles (Chair), Vice-Provost (Learning Services) and Chief Librarian
Kathleen De Long, Associate Director, Finance and Human Resources
Chuck Humphrey, Data Library Coordinator
Allison Sivak, Research Associate
Tandem Social Research Consulting
Dr. Marianne Sorensen, Chief Methodologist
Jennifer de Peuter, Research Associate
FEBRUARY 2005
Acknowledgements
We would like to thank members of the 8Rs steering committee who provided invaluable support and assistance with this research initiative, including:
William Curran, Director of Libraries, Concordia University (CARL representative)Julia Goodman, Library and Archives of Canada (to January 2004)Carrol Lunau, Resource Sharing Officer, Library and Archives Canada (LAC-BAC representative)Gerry Meek, Director, Calgary Public Library (CULC representative)Dr. Alvin Schrader, Professor, School of Library and Information Studies, University of Alberta
The following individuals assisted greatly with survey development, including pre-testing, translation, and veri-fication assistance:
The work of the 8Rs Research Team is also being supported by:
University of AlbertaCanadian Association of Research Libraries Canadian Urban Libraries CouncilAlberta Community Development, Government of AlbertaLibrary and Archives of CanadaOntario Library AssociationSaskatchewan Provincial Library, Saskatchewan Learning, Government of SaskatchewanUniversity of Manitoba LibrariesToronto Public LibraryNew Brunswick Public Library ServiceNova Scotia Provincial LibraryAtlantic Provinces Library AssociationAssociation of New Brunswick Librarians
Lastly, the study would not have been possible without the willing participation of the many library staff members who took the time to diligently complete lengthy and detailed surveys. We are indebted to these participants for their efforts.
B.3 Stage III: Survey of Professional Librarians and Paraprofessional Staff (Individual Survey) .............................................................................. 32
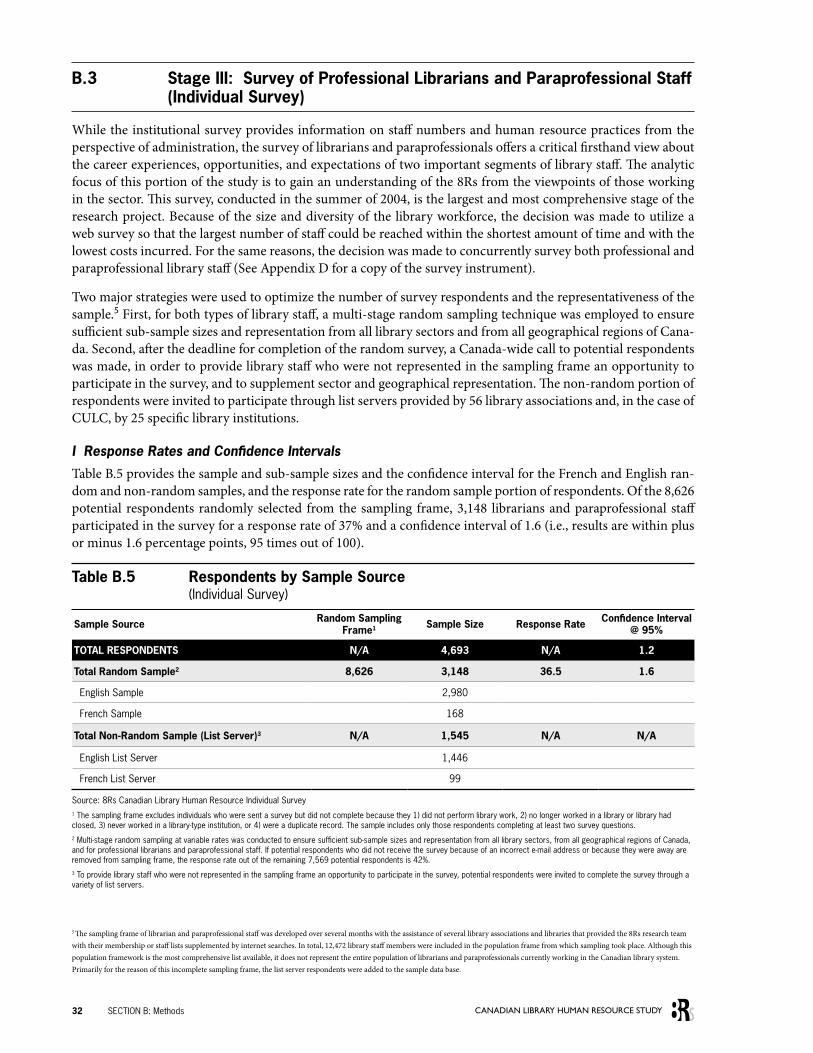
I Response Rates and Confidence Intervals ................................................................... 32
B.4 Data Limitations .................................................................................................................. 34
Section C: Workplace and Demographic Characteristics of Canadian Library Personnel
C.1 Staff and Workplace Characteristics ..................................................................................... 37
D.2 Recruitment to the Librarian Profession ................................................................................ 50
D.3 Demand Side Recruitment Issues (Organizational Recruitment) ................................................ 54I Recruitment Need, Activity, and Ability by Sector .......................................................... 54II Barriers to Recruitment .............................................................................................. 55III Competency Demand-Supply Match ............................................................................. 58IV Geographic Analysis of Recruitment ............................................................................. 61
iv CANADIAN LIBRARY HUMAN RESOURCE STUDY
D.4 Supply-side Recruitment Issues: Staff Sector and Geographic Interests and Activities ............... 65I Sector Interests ......................................................................................................... 66II Geographical Interests ................................................................................................ 67III Early Job Characteristics and Experiences of New Library Staff ..................................... 71
D.5 Strategic Human Resource Planning Implications ................................................................... 74
F.4 Intra-Organizational Mobility: The Match between Career Aspirations and Promotional Opportunities ........................................................................................... 104
F.5 Strategic Human Resource Planning Implications ................................................................. 111
G.3 Evaluation of Education ..................................................................................................... 119I Evaluation of Library School Programs ....................................................................... 119II Evaluation of Library Technician Programs .................................................................. 125
G.4: Strategic Human Resource Planning Implications ................................................................. 128
K.2 Drivers of Librarian Role Change ........................................................................................ 178
K.3 Librarians as Generalists and Specialists ............................................................................ 179
K.4 Meeting the Management, Leadership, and Business Skill Demands of Libraries .................... 181I Indicators of Demand for Management, Leadership, and Business Skills ....................... 181II Can Supply of Management, Leadership, and Business Skills Meet Demand? ................ 182
K.5 Meeting the Demands of Information Technology ................................................................. 186I Indicators of Demand for Information Technology Skills ............................................... 186II Can Supply of Technology Skills Meet Demand? .......................................................... 187
K.6 Changing Roles of Librarian and Paraprofessional Staff ........................................................ 188
K.7 Effects of Changing Roles on Work Levels and Job Attitudes ................................................ 191
K.8 Strategic Human Resource Planning Implications ................................................................. 193
Section L: Summary of Major Findings ............................................................................... 195
Appendix A Detailed Methods .............................................................................................. 199
Appendix B Supplementary Tables and Figures ..................................................................... 203
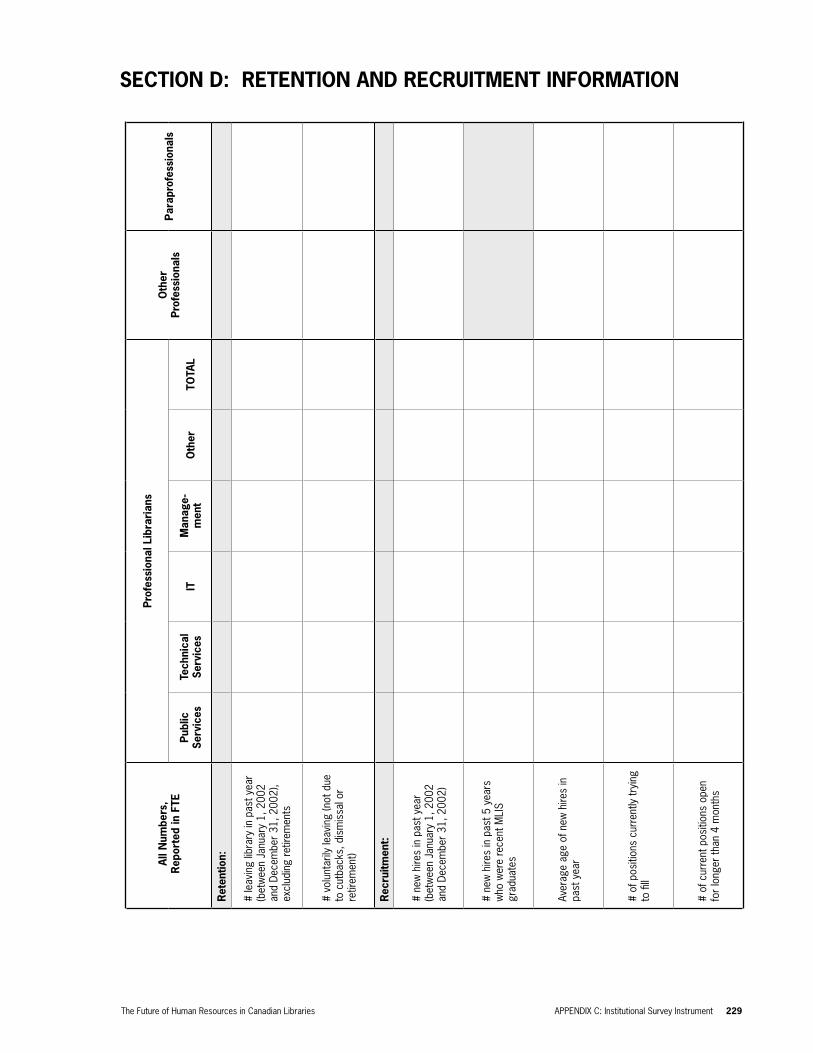
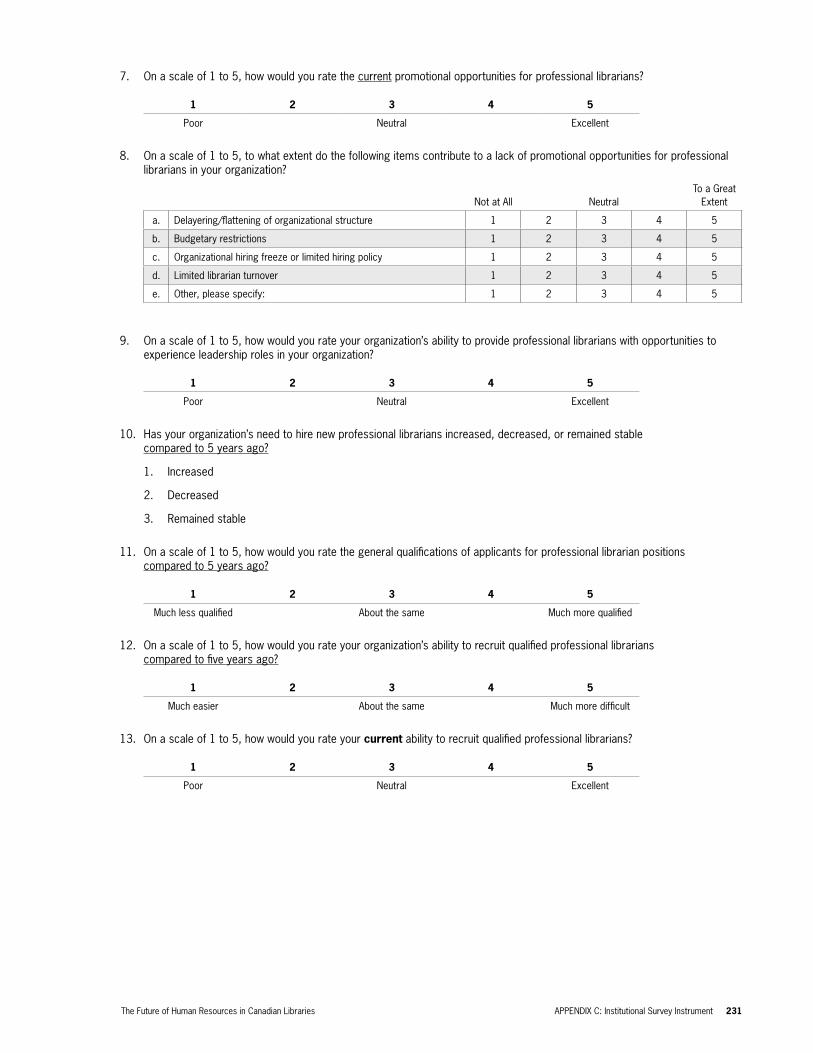
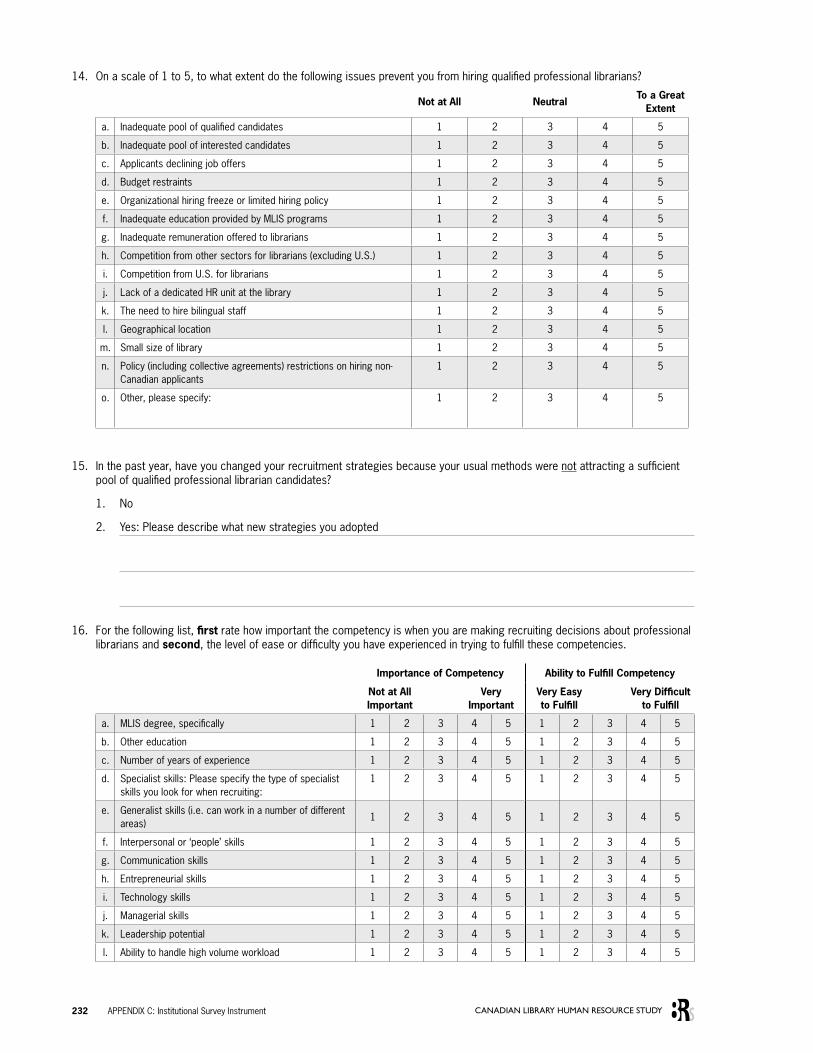
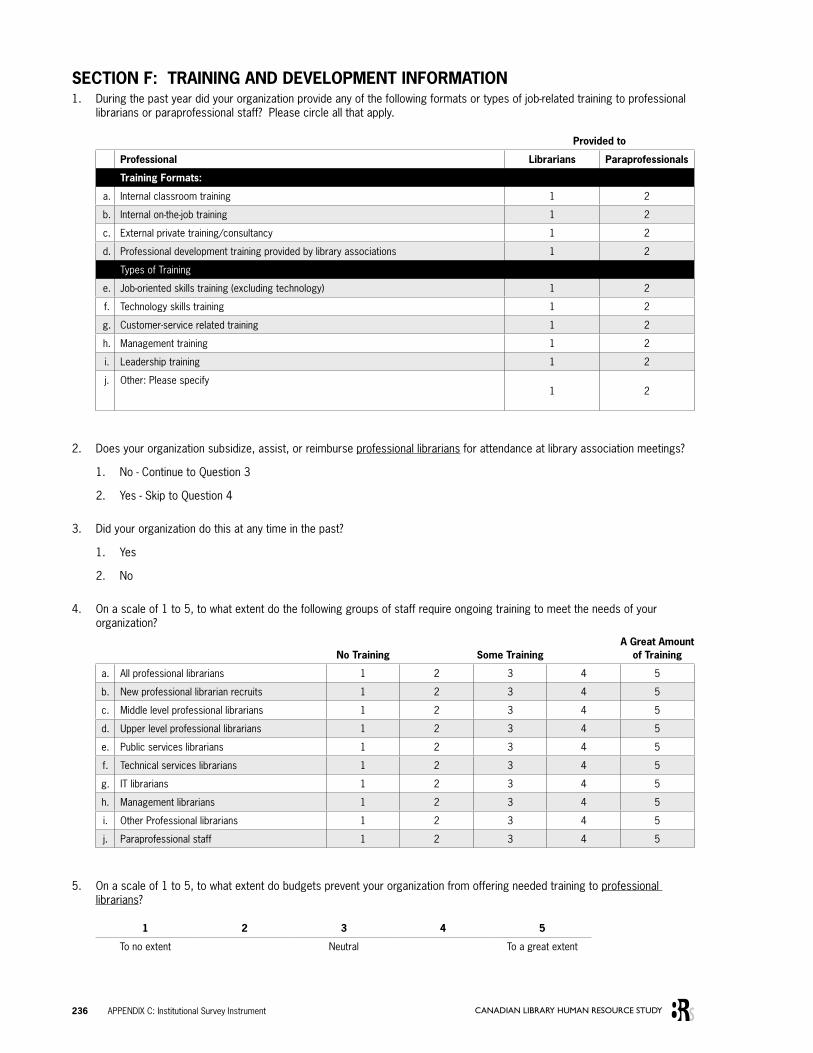
Appendix C Institutional Survey Instrument ........................................................................... 223
Appendix D Individual Survey Instrument (Professional Librarians and Paraprofessionals) ...... 243
Appendix E Director Telephone Interview Guide .................................................................... 267
WORKS CITED ........................................................................................................................ 271
The Future of Human Resources in Canadian Libraries vii
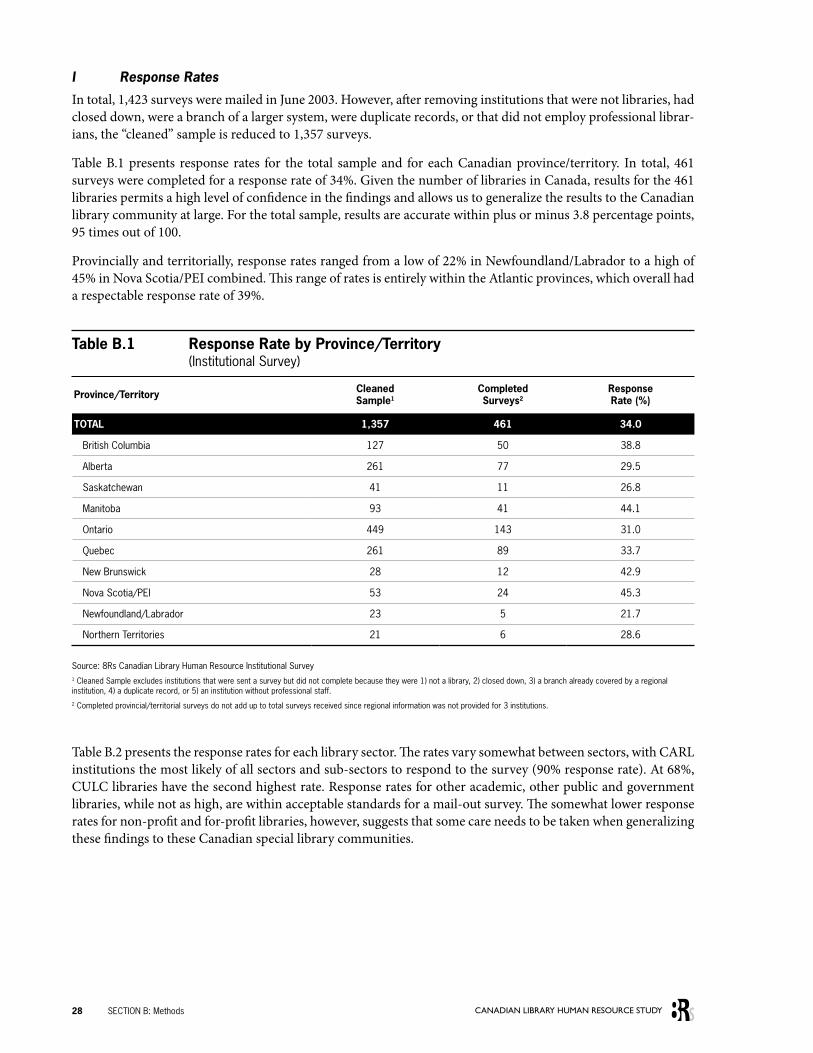
Table B.1 ................................Response Rate by Province/Territory
Table B.2 ................................Response Rate by Library Sector
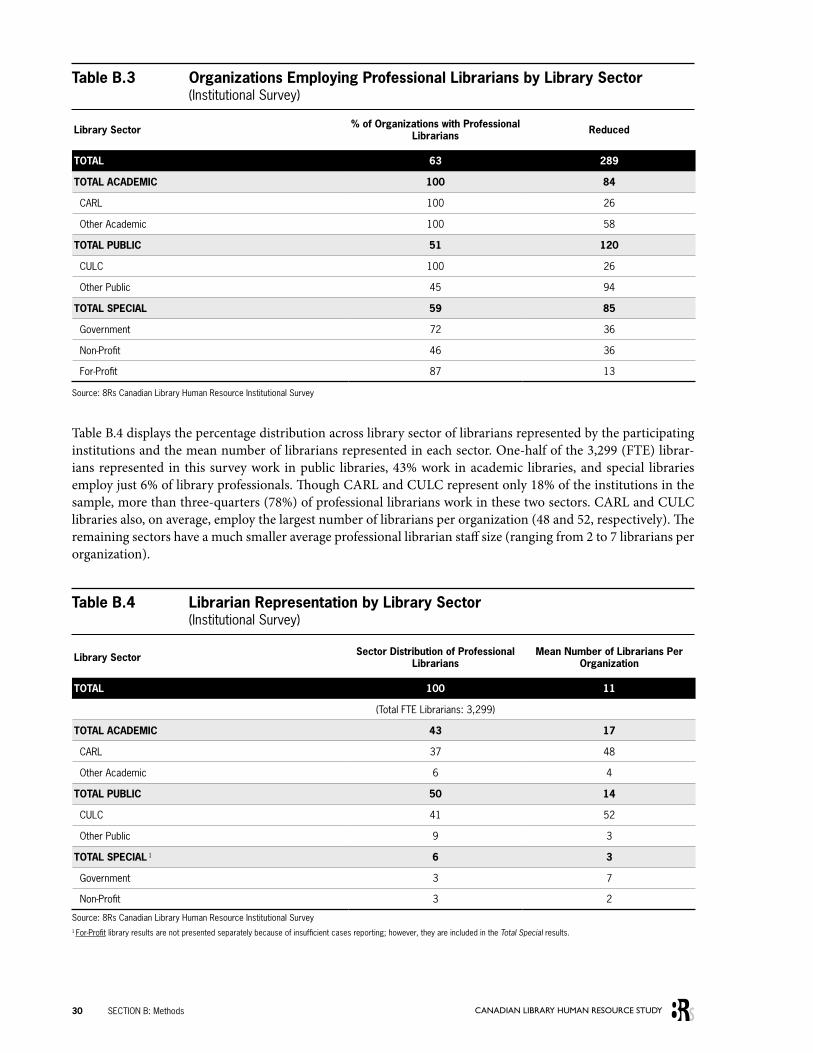
Table B.3 ................................Organizations Employing Professional Librarians by Library Sector
Table B.4 ................................Librarian Representation by Library Sector
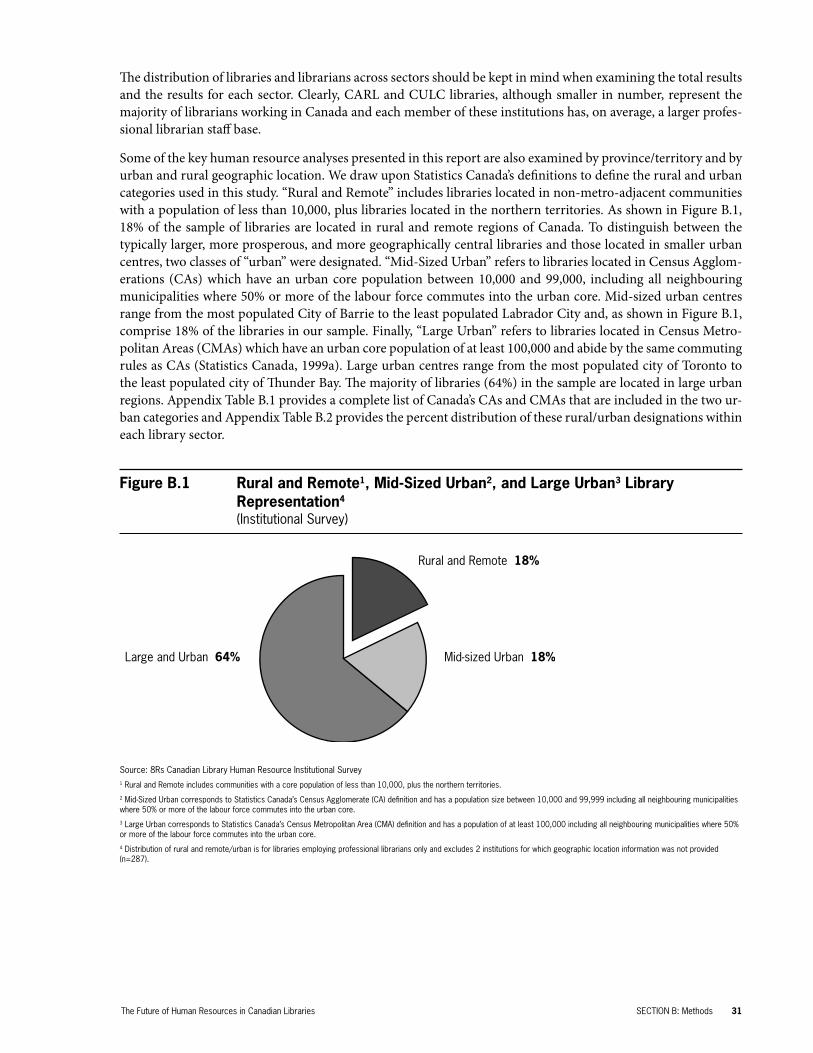
Figure B.1 ...............................Rural and Remote, Mid-Sized Urban, and Large Urban Library Representation
Table B.5 ................................Respondents by Sample Source
Table B.6 ................................Respondents by Province/Territory
Table B.7 ................................Sample Size and Confidence Intervals by Library Sector
Table C.1 ................................Type of Library Staff by Library Sector
Table C.2 ................................Occupational Level of Professional Librarians by Library Sector
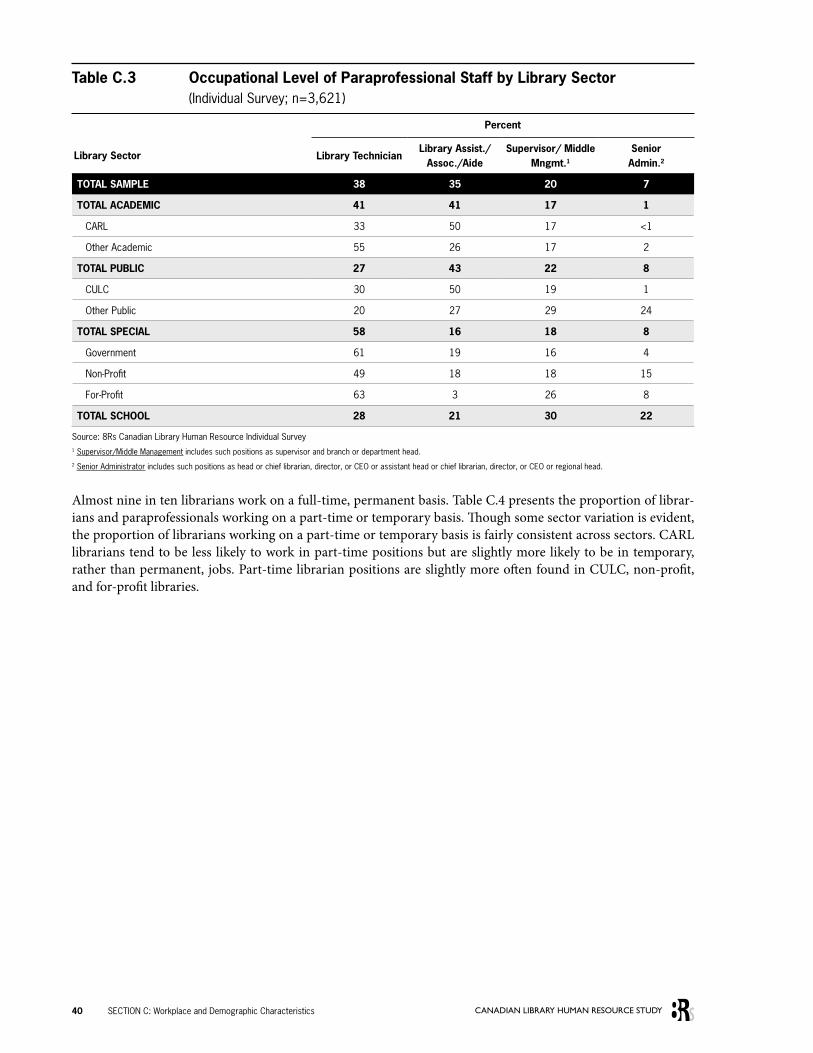
Table C.3 ................................Occupational Level of Paraprofessional Staff by Library Sector
Table C.4 ................................Work Status of Librarians and Paraprofessionals by Library Sector
Table C.5 ................................Union Status of Librarians and Paraprofessionals by Library Sector
Table C.6 ................................Career Stage of Librarians and Paraprofessionals by Library Sector
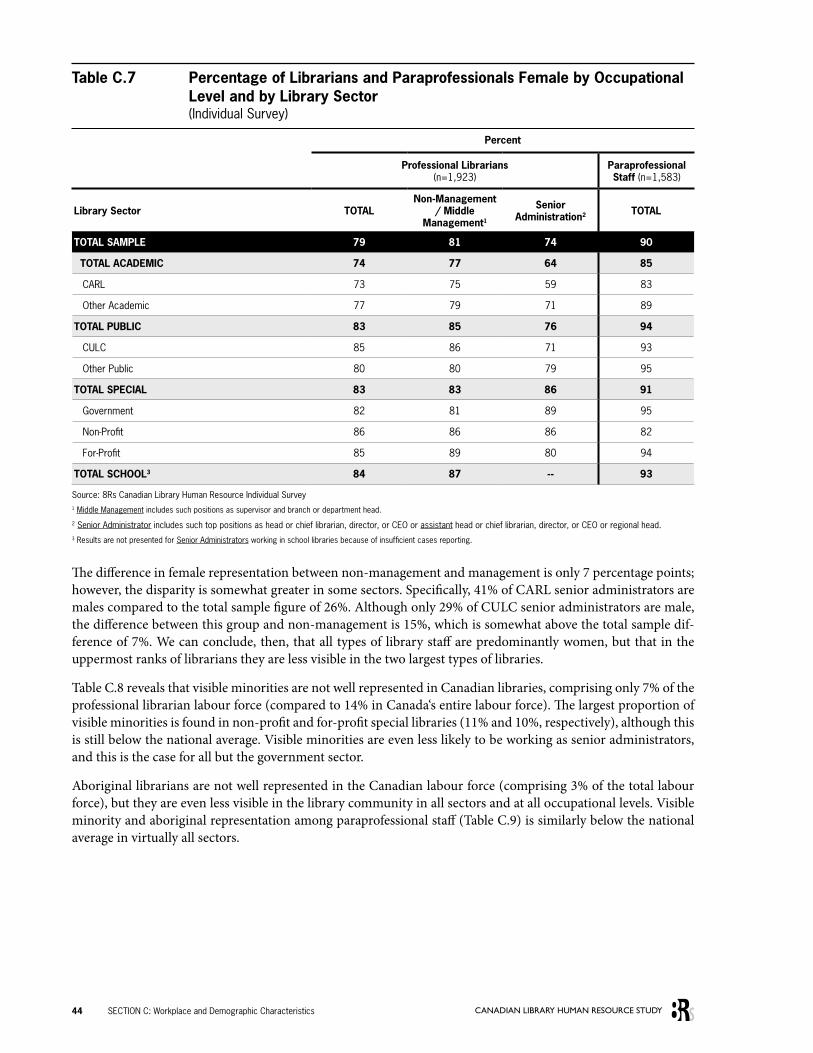
Table C.7 ................................Percentage of Librarians and Paraprofessionals Female by Occupational Level and by Library Sector
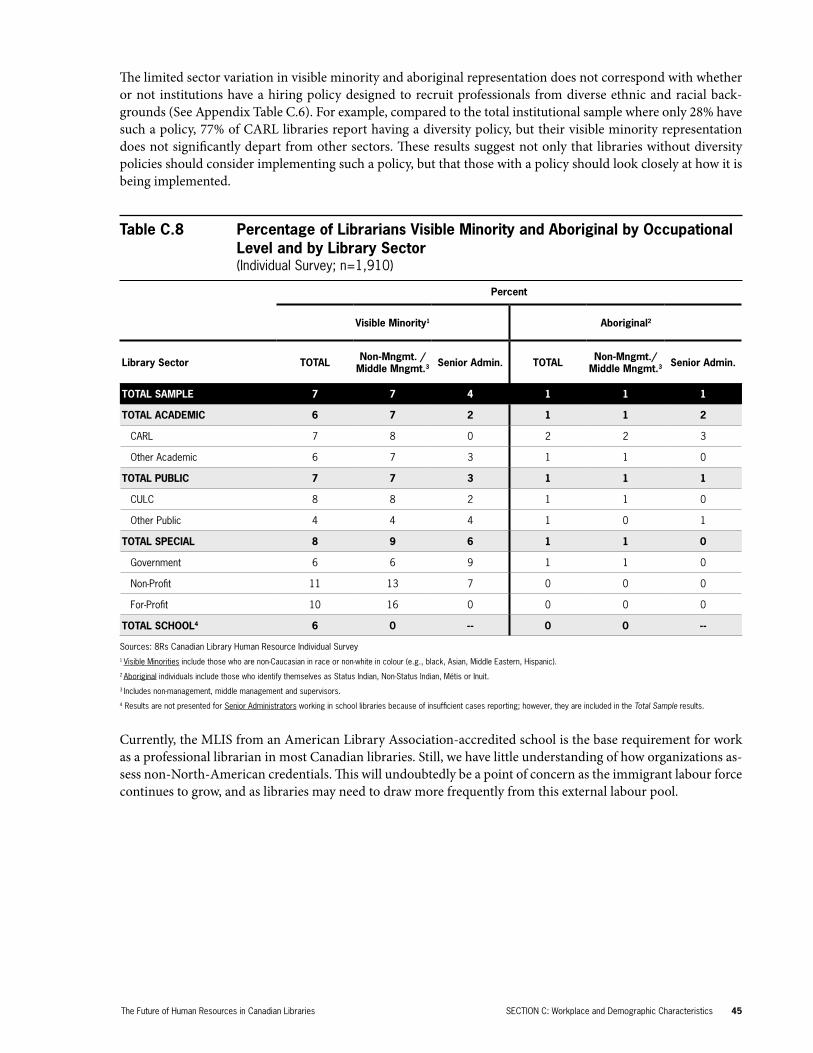
Table C.8 ................................Percentage of Librarians Visible Minority and Aboriginal by Occupational Level and by Library Sector
Table C.9 ................................Percentage of Paraprofessionals Visible Minority and Aboriginal by Library Sector
Table C.10 ..............................Age Category of Librarians and Paraprofessionals by Library Sector
Figure D.1 ..............................Major Reasons for Choosing Professional Librarian Career
Figure D.2 ..............................Major Barriers to MLIS Degree Obtainment Among Paraprofessional Staff
Figure D.3 ..............................Major Reasons Paraprofessional Staff Not Interested in Obtaining MLIS Degree
Table D.1 ................................Recruitment Need and Activity by Library Sector
Table D.2a and b .....................Barriers to Recruitment by Library Sector
List of Tables and Figures
viii CANADIAN LIBRARY HUMAN RESOURCE STUDY
Table D.3 ................................Ranking of the Ten Most Important AND Difficult to Fulfill Competencies
Table D.4a ..............................Ranking of Ten Most Important AND Most Difficult to Fulfill Competencies When Recruiting Librarians Among Academic Libraries
Table D.4b ..............................Ranking of Ten Most Important AND Most Difficult to Fulfill Competencies When Recruiting Librarians Among Public Libraries
Table D.4c ..............................Ranking of Ten Most Important AND Most Difficult to Fulfill Competencies When Recruiting Librarians Among Special Libraries
Table D.5 ................................Recruitment Need and Activity by Province/Region
Table D.6 ................................Major Barriers to Recruitment by Province/Region
Table D.7 ................................Recruitment Need and Activity by Urban/Rural Location
Table D.8 ................................Major Barriers to Recruitment by Urban/Rural Location
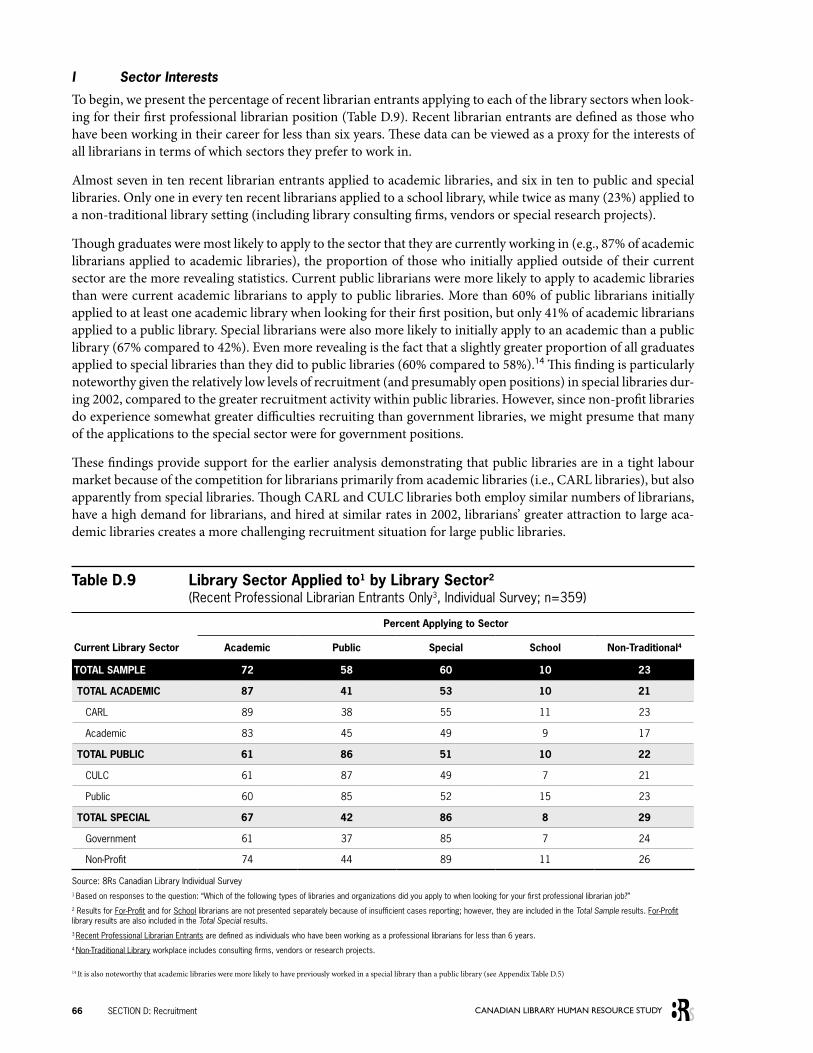
Table D.9 ................................Library Sector Applied to by Library
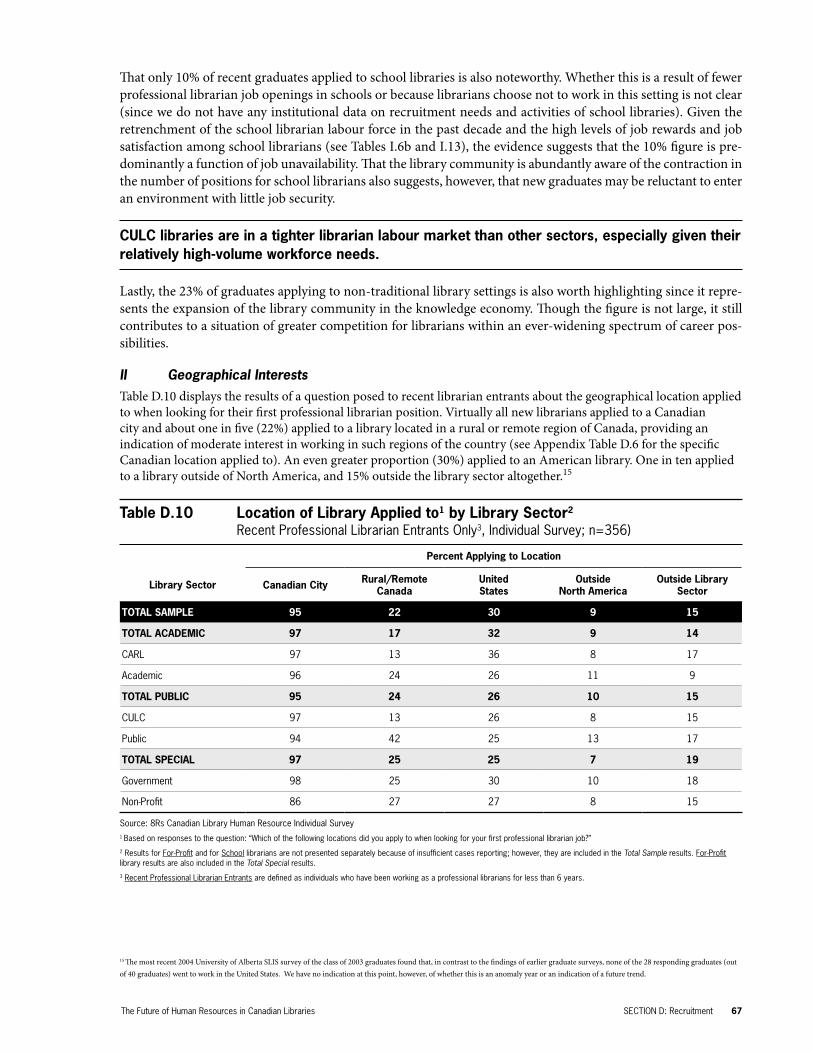
Table D.10 ..............................Location of Library Applied to by Library Sector
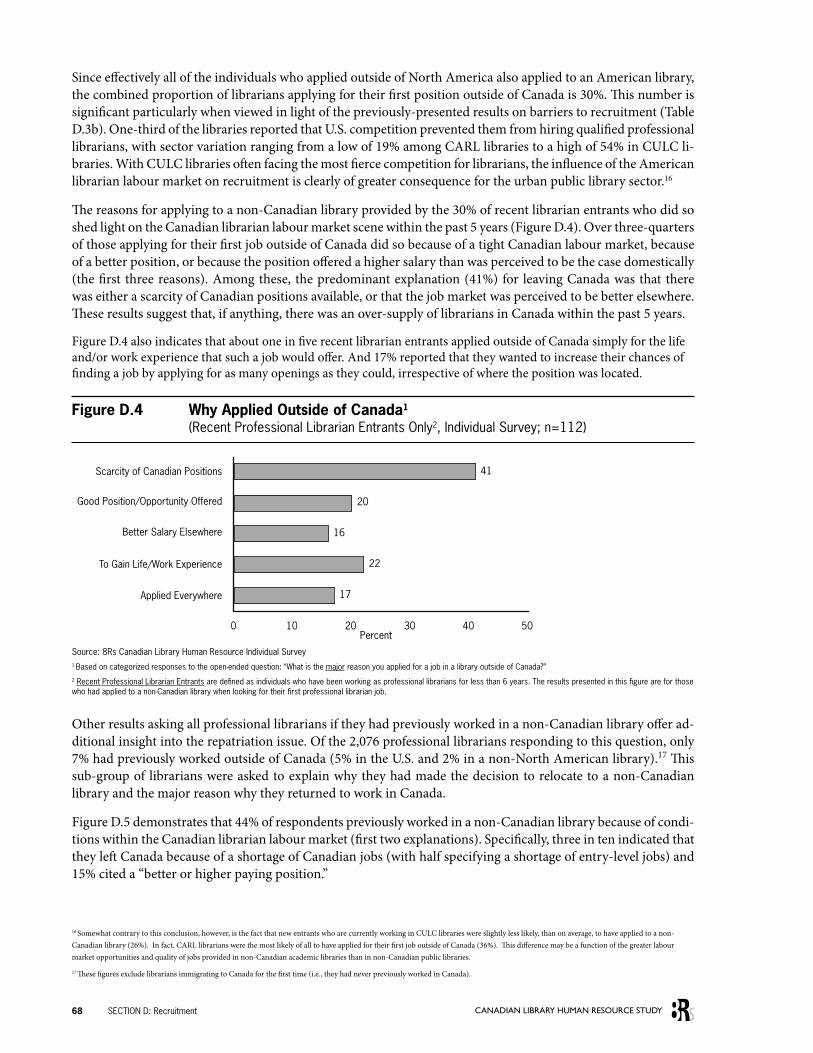
Figure D.4 ..............................Why Applied Outside of Canada
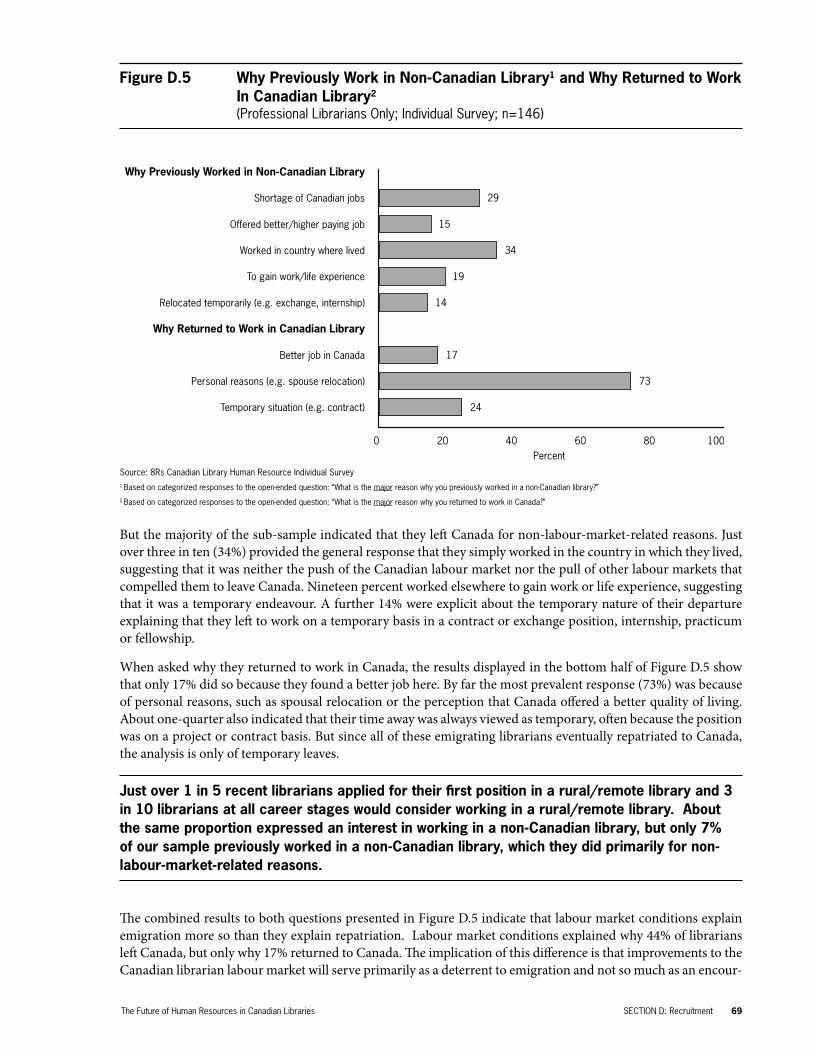
Figure D.5 ..............................Why Previously Worked in Non-Canadian Library and Why Returned to Work in Canadian Library
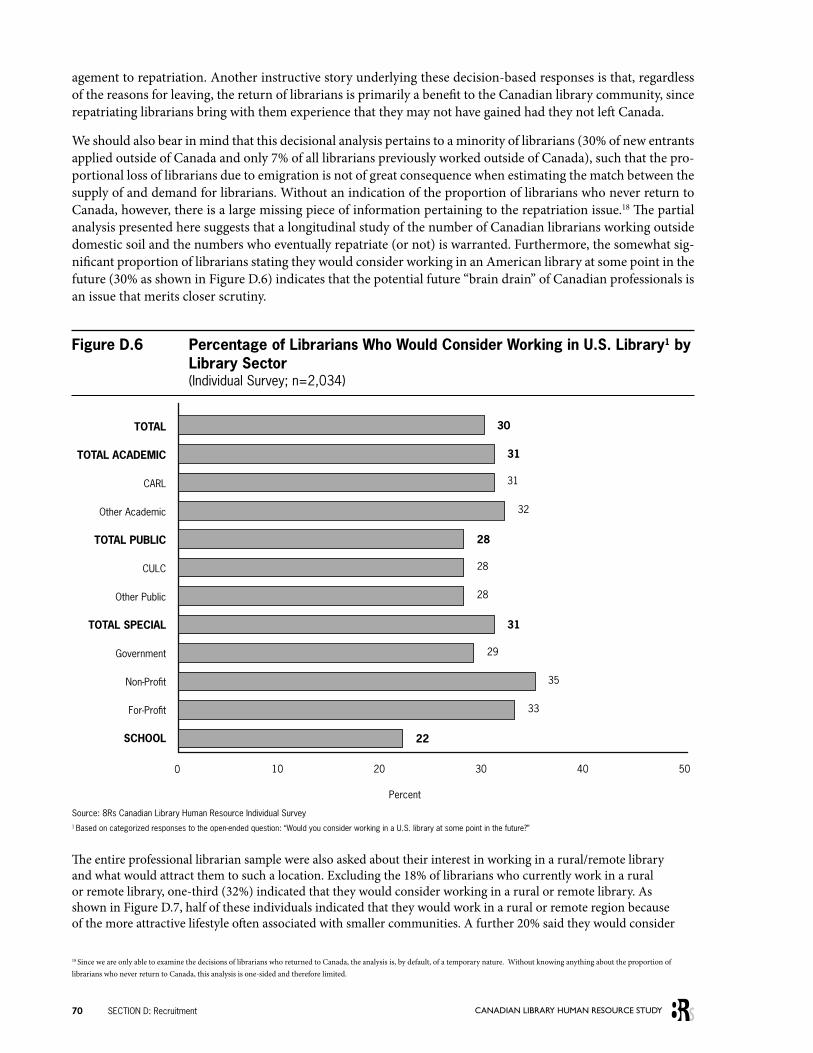
Figure D.6 ..............................Percentage of Librarians Who Would Consider Working in U.S. Library by Library Sector
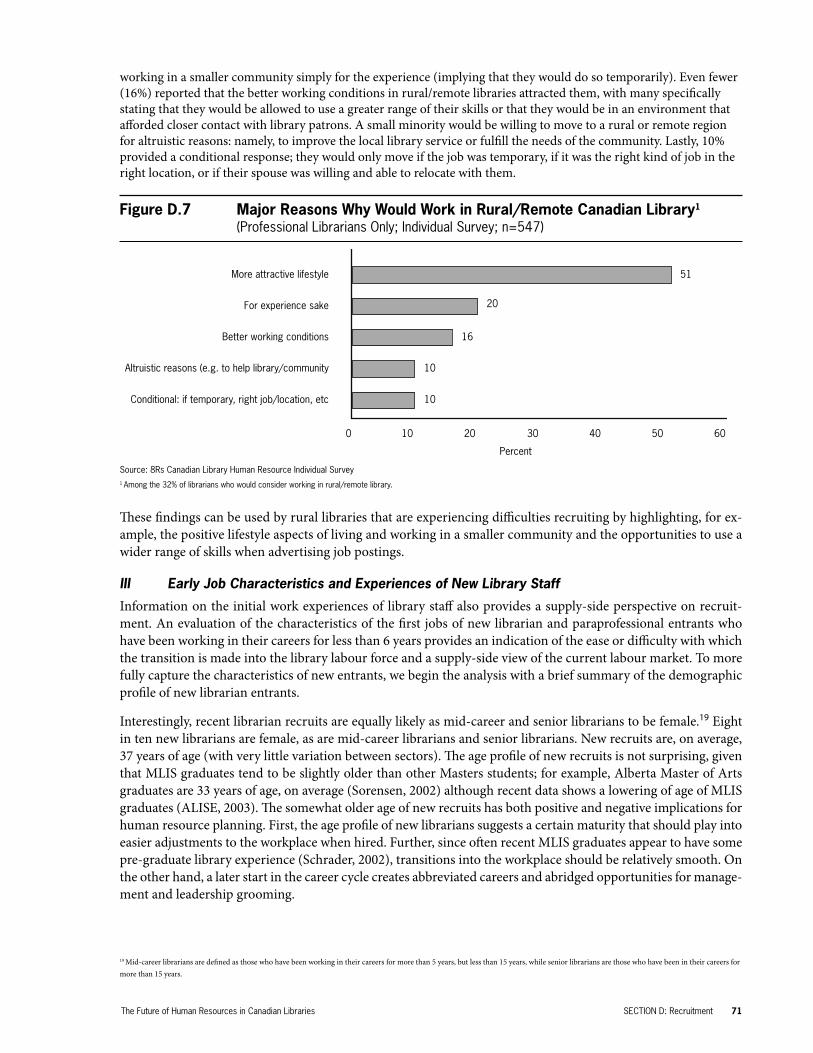
Figure D.7 ..............................Major Reasons Why Would Work in Rural/Remote Canadian Library
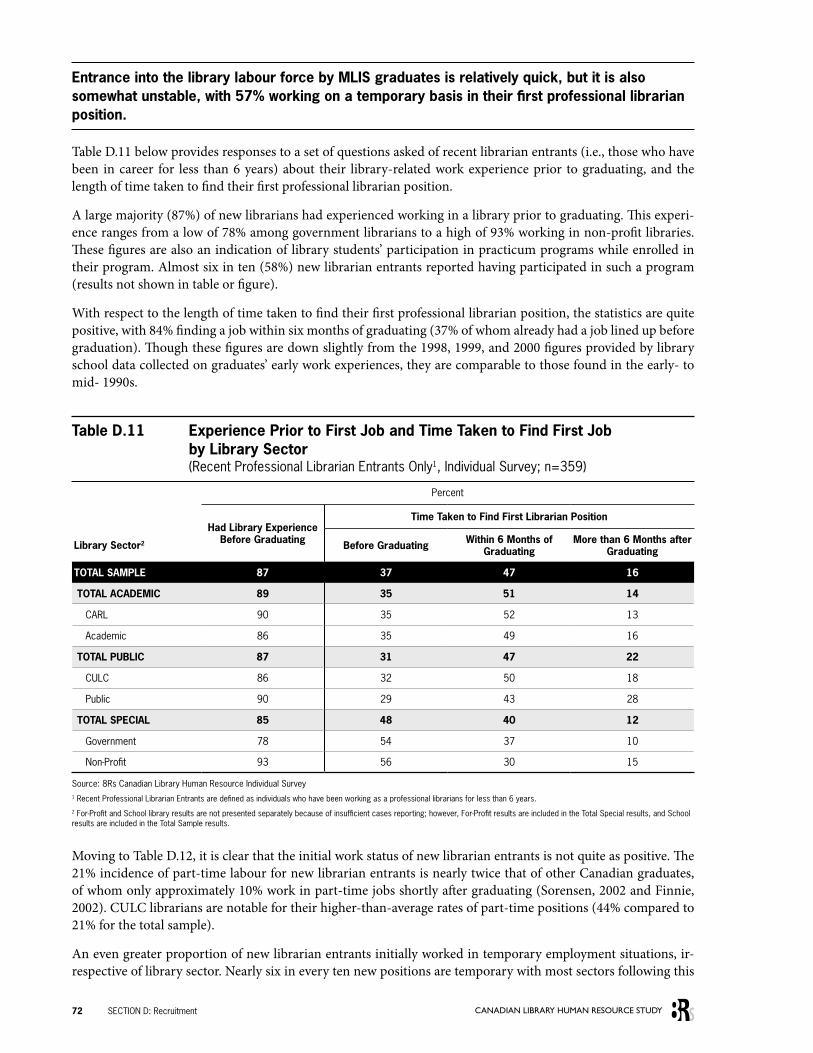
Table D.11 ..............................Experience Prior to First Job and Time Taken to Find First Job by Library Sector
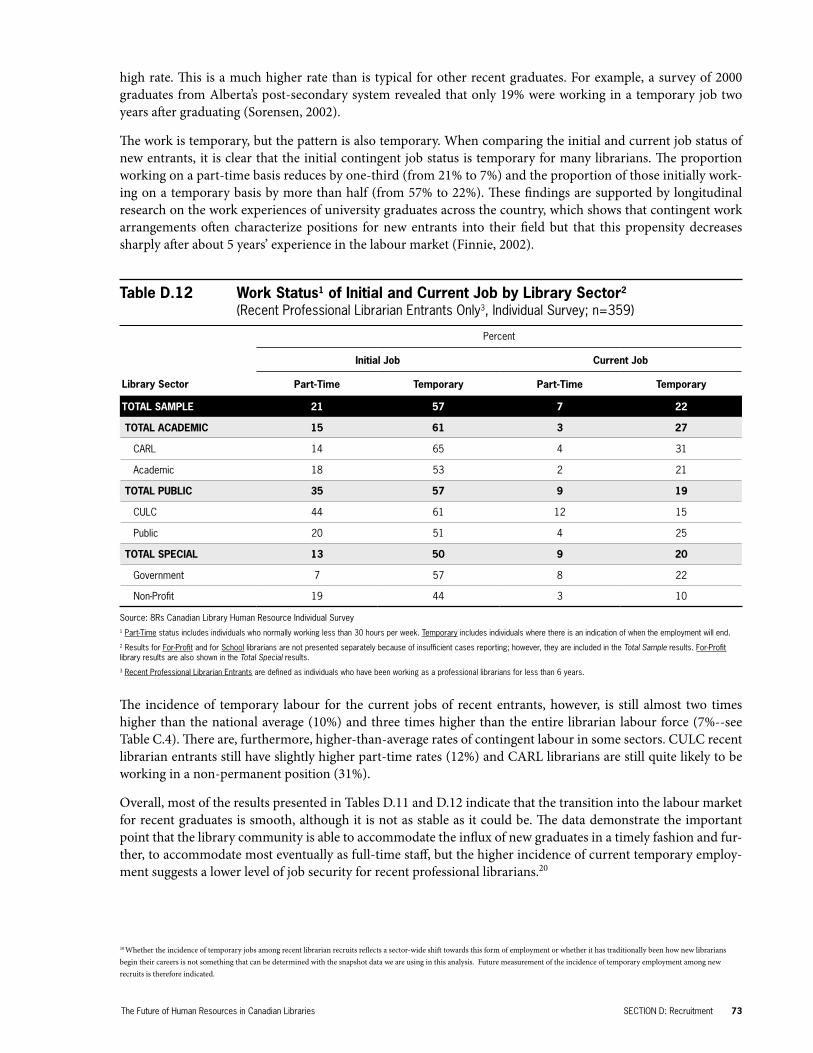
Table D.12 ..............................Work Status of Initial and Current Job by Library Sector
Table D.13 ..............................Experience Prior to First Job and Time Taken to Find First Job by Library Sector
Table E.1 ................................Librarian Retirements Between 1997 and 2002 by Library Sector
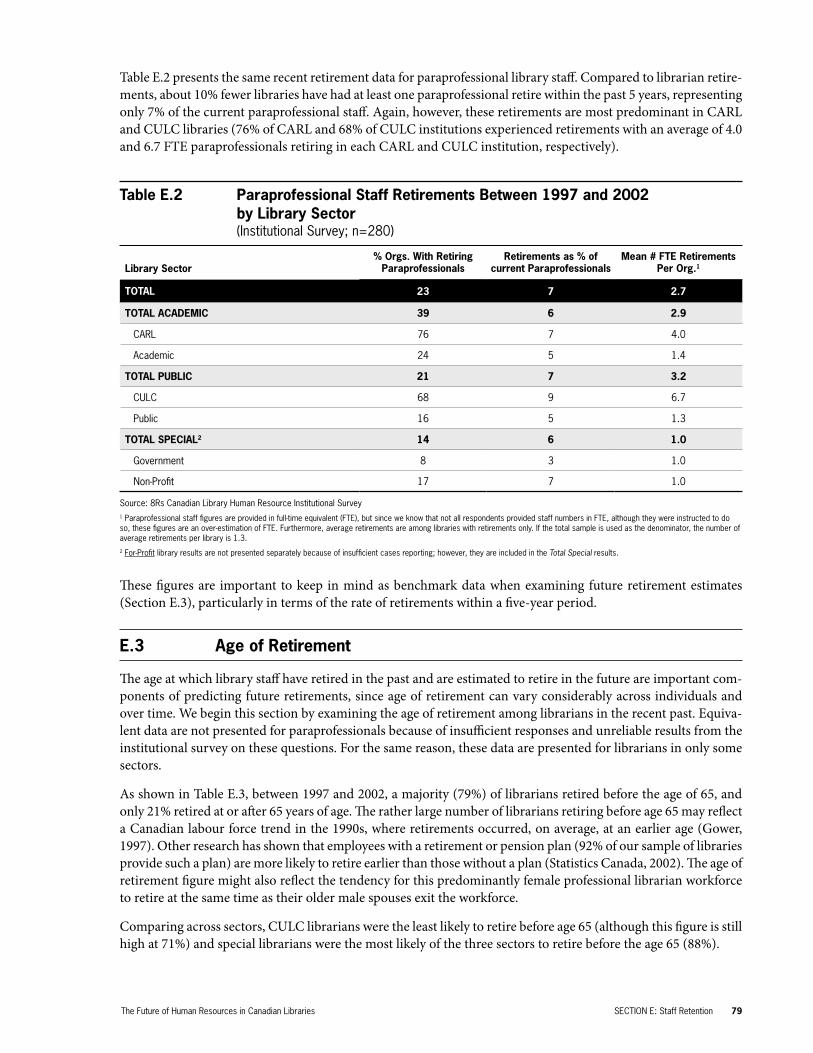
Table E.2 ................................Paraprofessional Staff Retirements Between 1997 and 2002 by Library Sector
Table E.3 ................................Librarian Age of Retirement by Library Sector
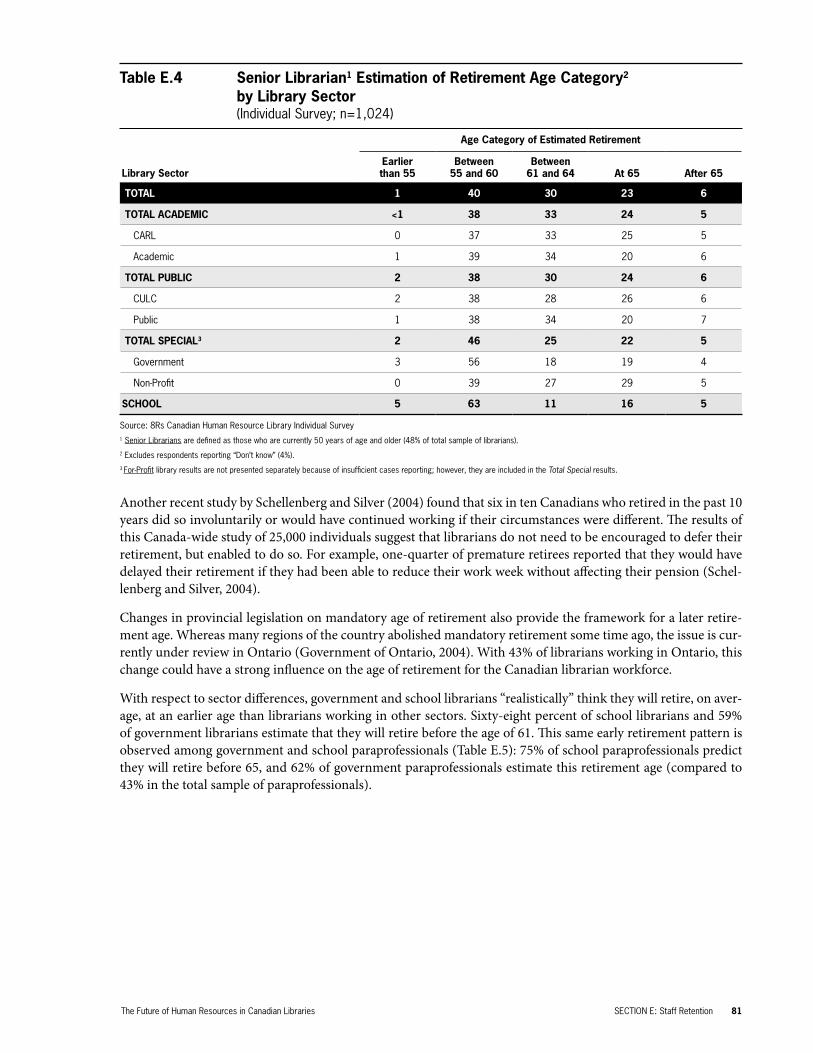
Table E.4 ................................Senior Librarian Estimation of Retirement Age Category by Library Sector
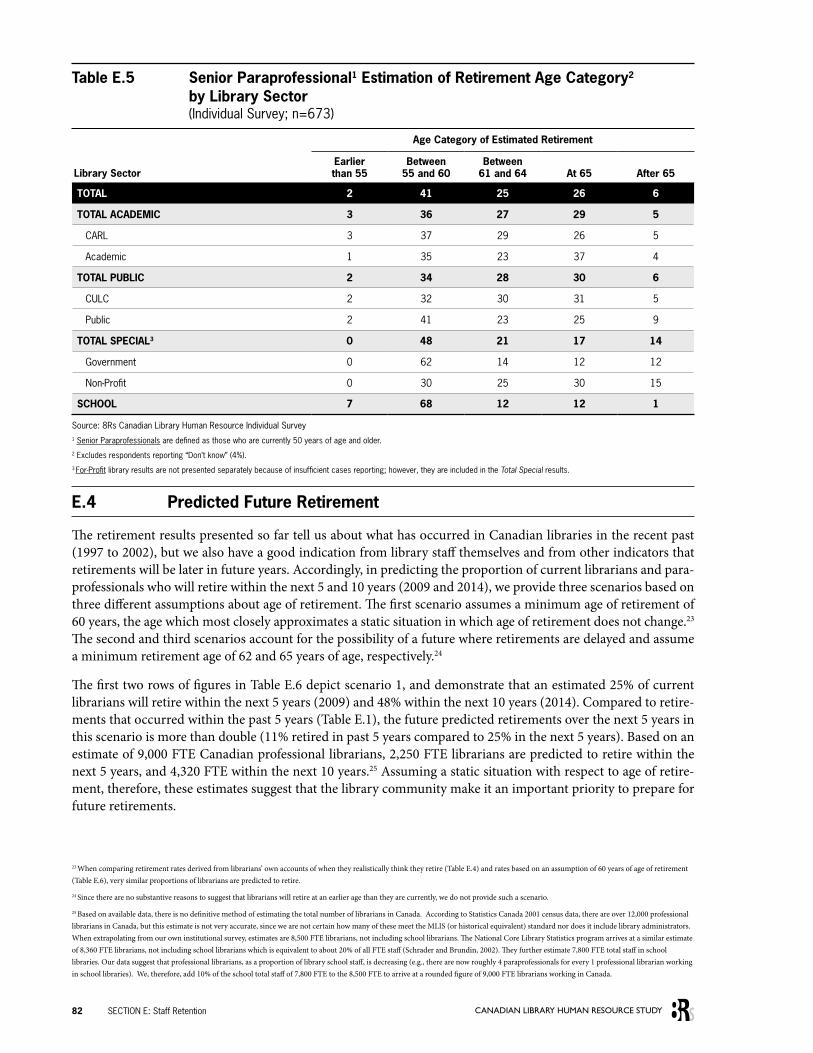
Table E.5 ................................Senior Paraprofessional Estimation of Retirement Age Category by Library Sector
Table E.6 ................................Predicted Librarian Retirements Within the Next 5 and 10 Years (Assuming age of retirement of 65, 62, and 60 years)
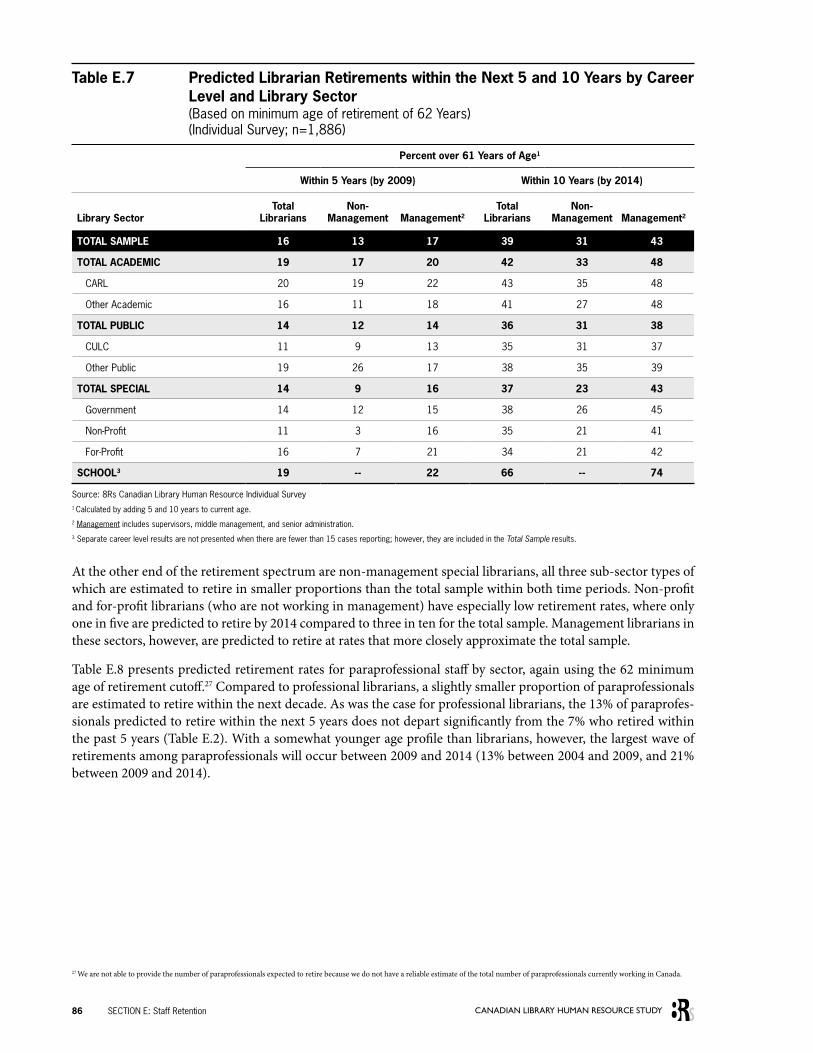
Table E.7 ................................Predicted Librarian Retirements Within the Next 5 and 10 Years by Career Level and Library Sector
Table E.8 ................................Predicted Paraprofessional Staff Retirements Within the Next 5 and 10 Years by Library Sector
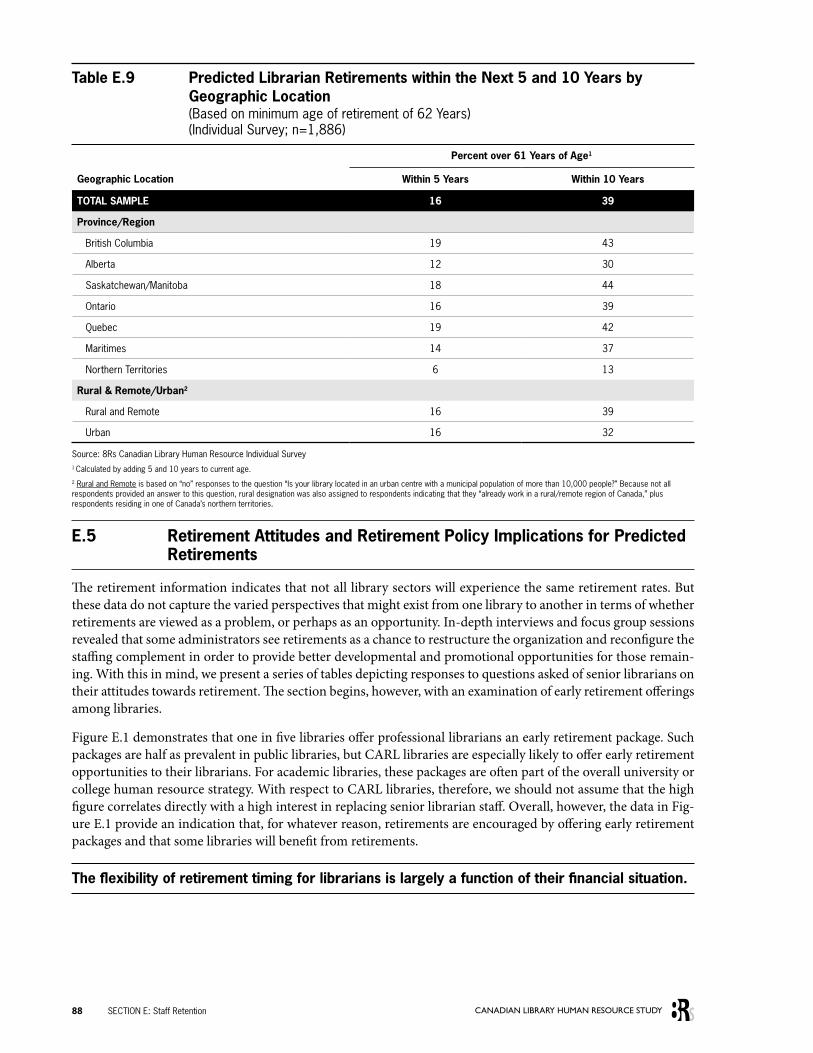
Table E.9 ................................Predicted Librarian Retirements Within the Next 5 and 10 Years by Geographic Location (Based on minimum age of retirement of 62 Years)
Figure E.1 ...............................Percentage of Organizations Offering Early Retirement Package by Library Sector
Table E.10 ..............................Extent Senior Librarians Looking Forward to Retirement by Library Sector
Table E.11 ..............................Percentage of Senior Librarians Who Would Consider Delaying Retirement or Accepting Early Retirement Package by Library Sector
Table E.12 ..............................Extent Senior Paraprofessional Staff Looking Forward to Retirement by Library Sector
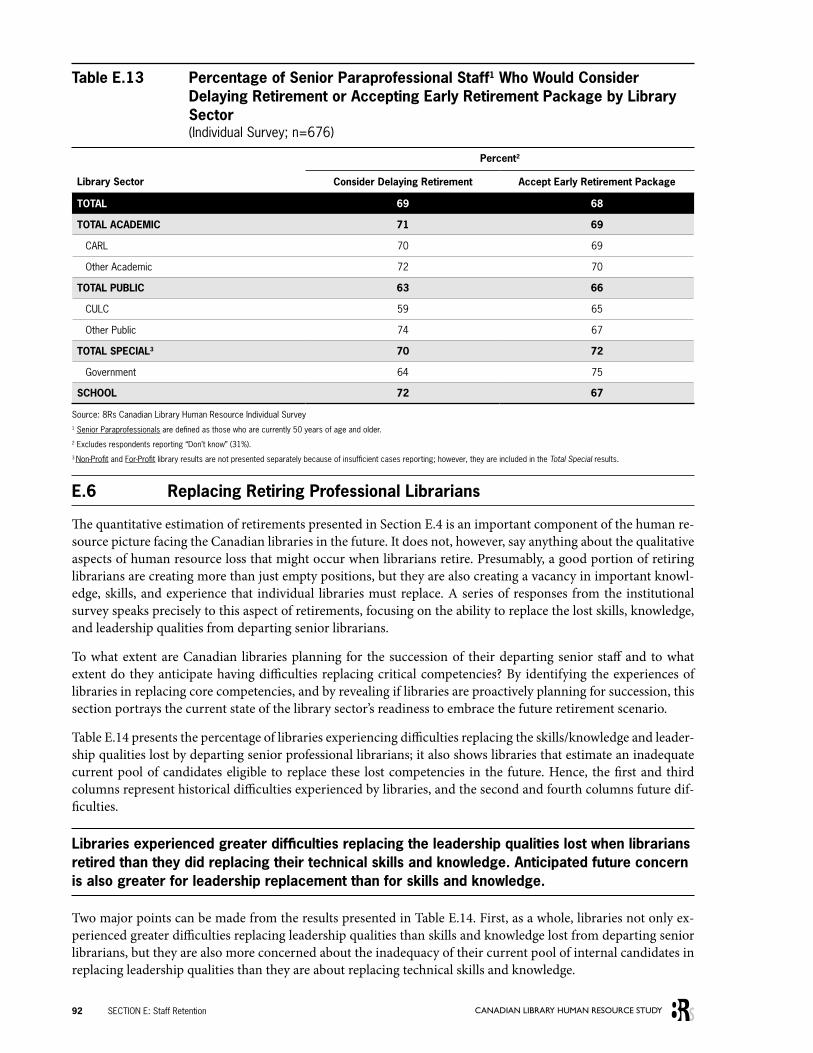
Table E.13 ..............................Percentage of Senior Paraprofessional Staff Who Would Consider Delaying Retirement or Accepting Early Retirement Package by Library Sector
The Future of Human Resources in Canadian Libraries ix
Table E.14 ..............................Past and Future Ability to Replace Skills/Knowledge and Leadership Qualities Lost from Departing Senior Librarians by Library Sector
Table E.15a and b ...................Barriers to Replacing Competencies Lost by Retiring Librarians by Library Sector
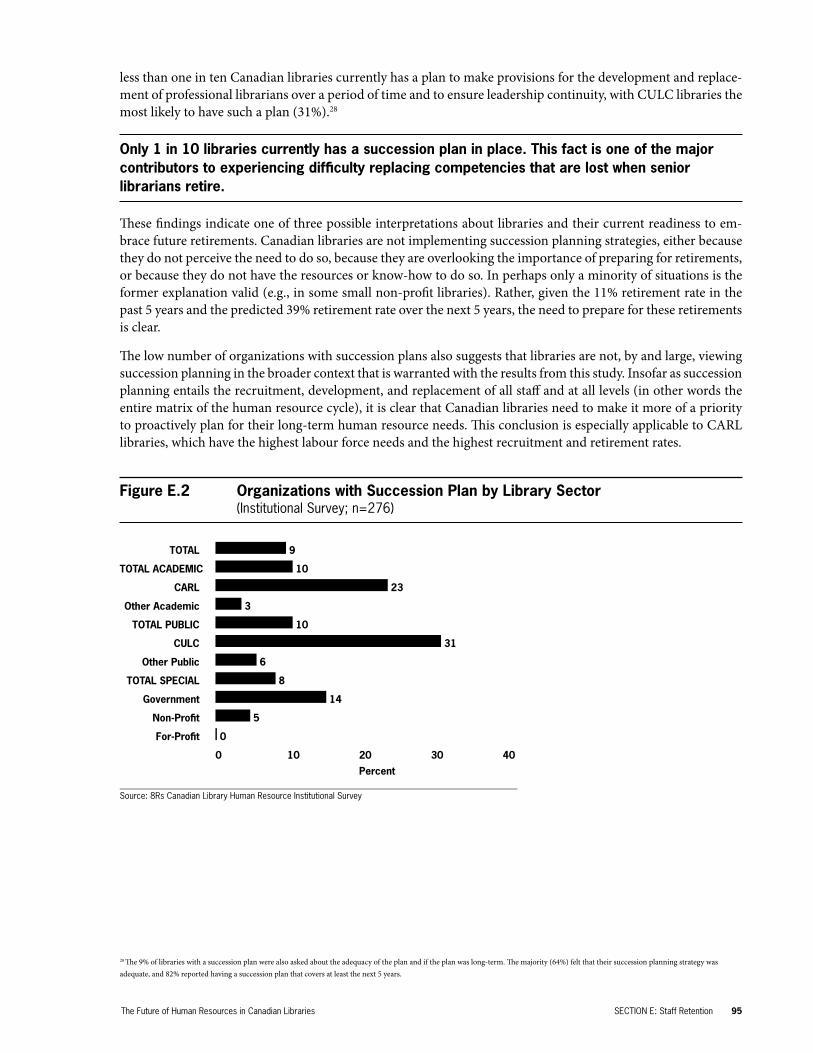
Figure E.2 ...............................Organizations with Succession Plan by Library Sector
Table F.1 .................................Departing Professional Librarians in 2002 by Library Sector
Figure F.1 ...............................Percentage of Senior Librarians Working at Current Library for More than 10 Years
Table F.2 .................................Percentage of Librarians Interested in Spending Remainder of Career at Current Organization by Career Stage and Library Sector
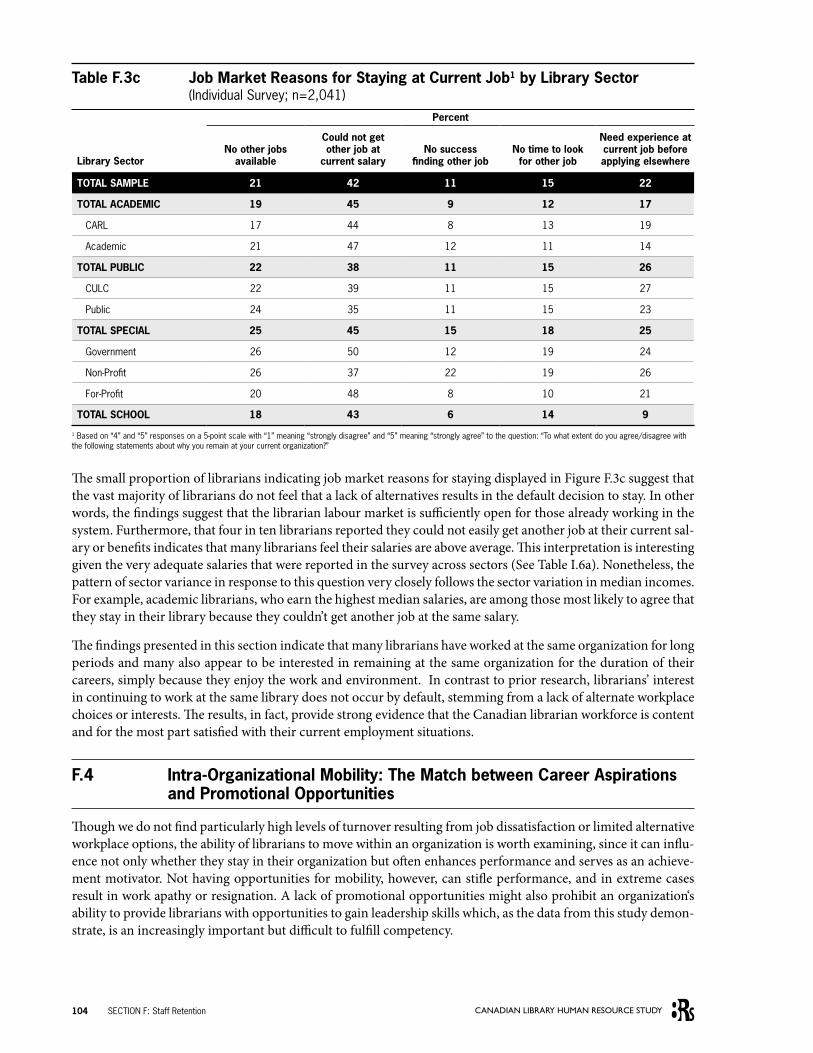
Table F.3a ...............................“Pull” Reasons for Staying at Current Job by Library Sector
Table F.3b ...............................Personal Reasons for Staying at Current Job by Library Sector
Table F.3c ...............................Job Market Reasons for Staying at Current Job by Library Sector
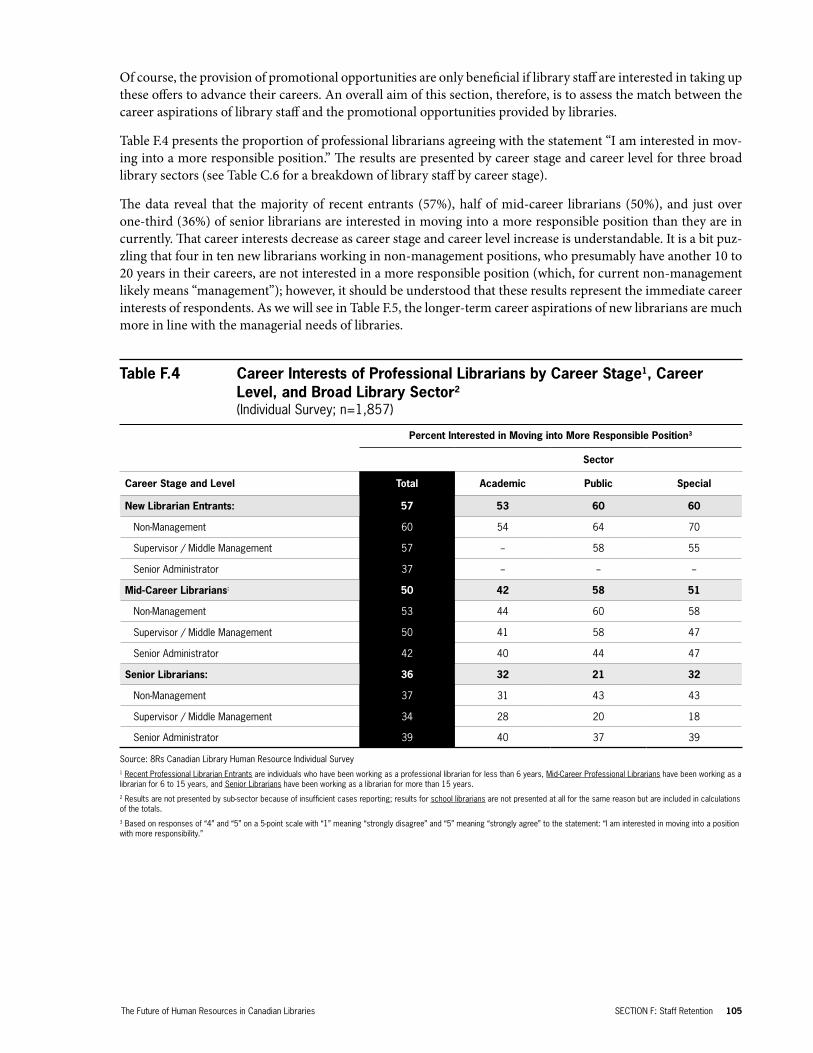
Table F.4 .................................Career Interests of Professional Librarians by Career Stage, Career Level, and Broad Library Sector
Table F.5 .................................Future Career Level Aspirations of Non-Management Recent Professional Librarian Entrants by Library Sector
Table F.6 .................................Percentage of Librarians Self-Reporting as “Qualified” for Higher Position by Career Stage and Library Sector
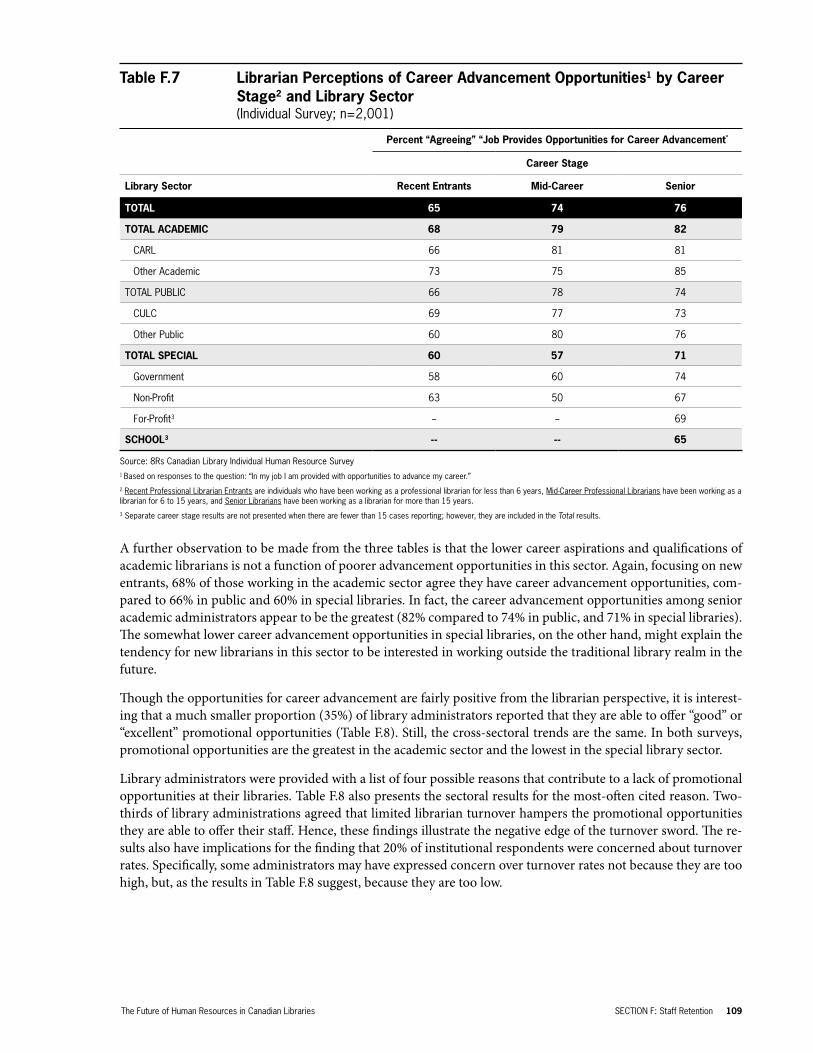
Table F.7 .................................Librarian Perceptions of Career Advancement Opportunities by Career Stage and Library Sector
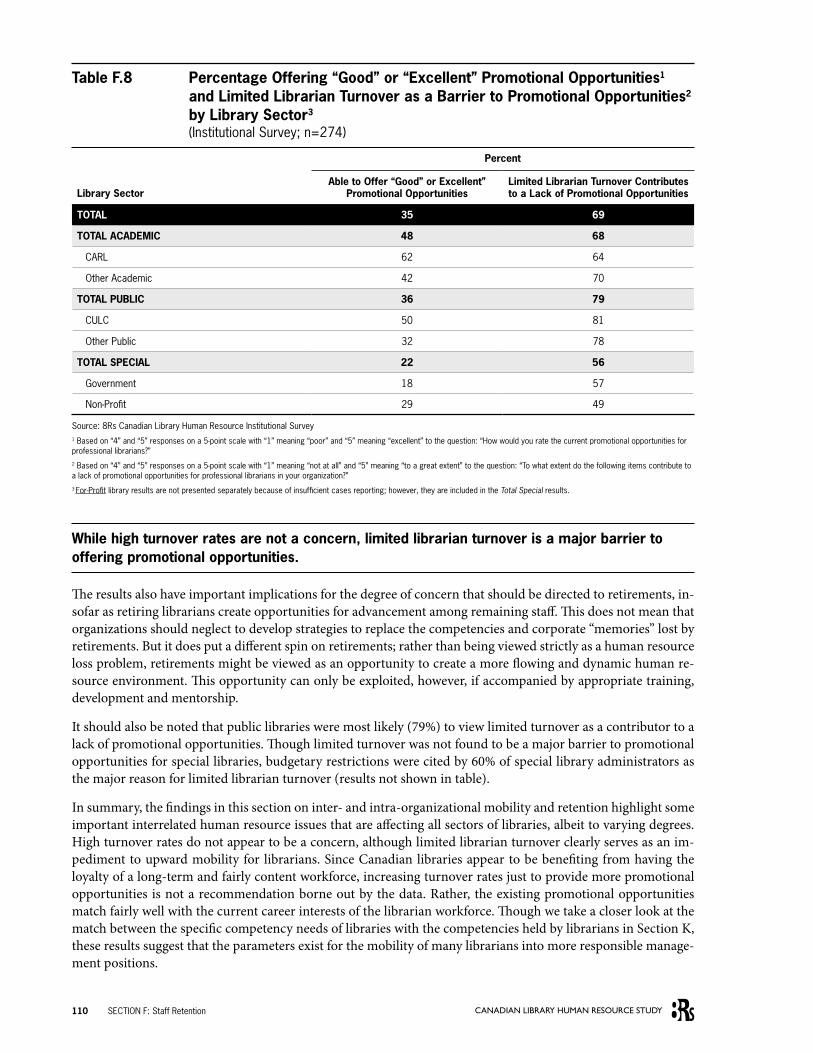
Table F.8 .................................Percentage Offering “Good” or “Excellent” Promotional Opportunities and Limited Librarian Turnover as a Barrier to Promotional Opportunities by Library Sector
Table G.1 ................................Year Received MLIS Degree by Library Sector
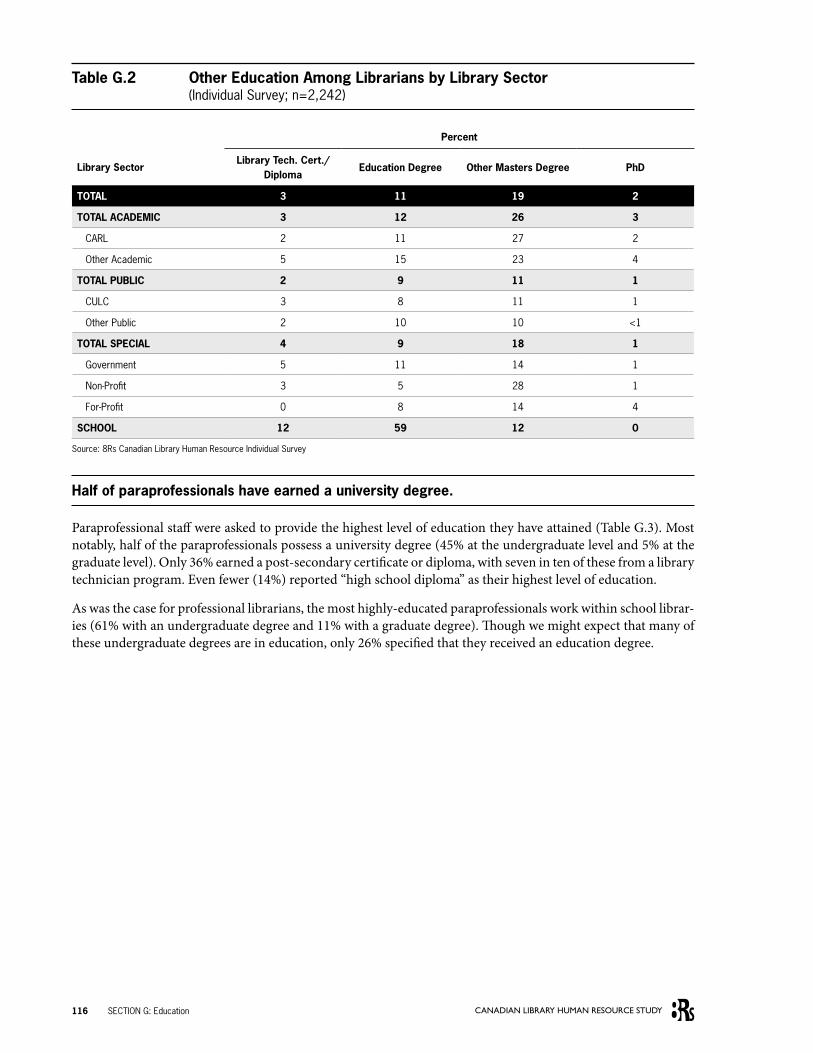
Table G.2 ................................Other Education Among Librarians by Library Sector
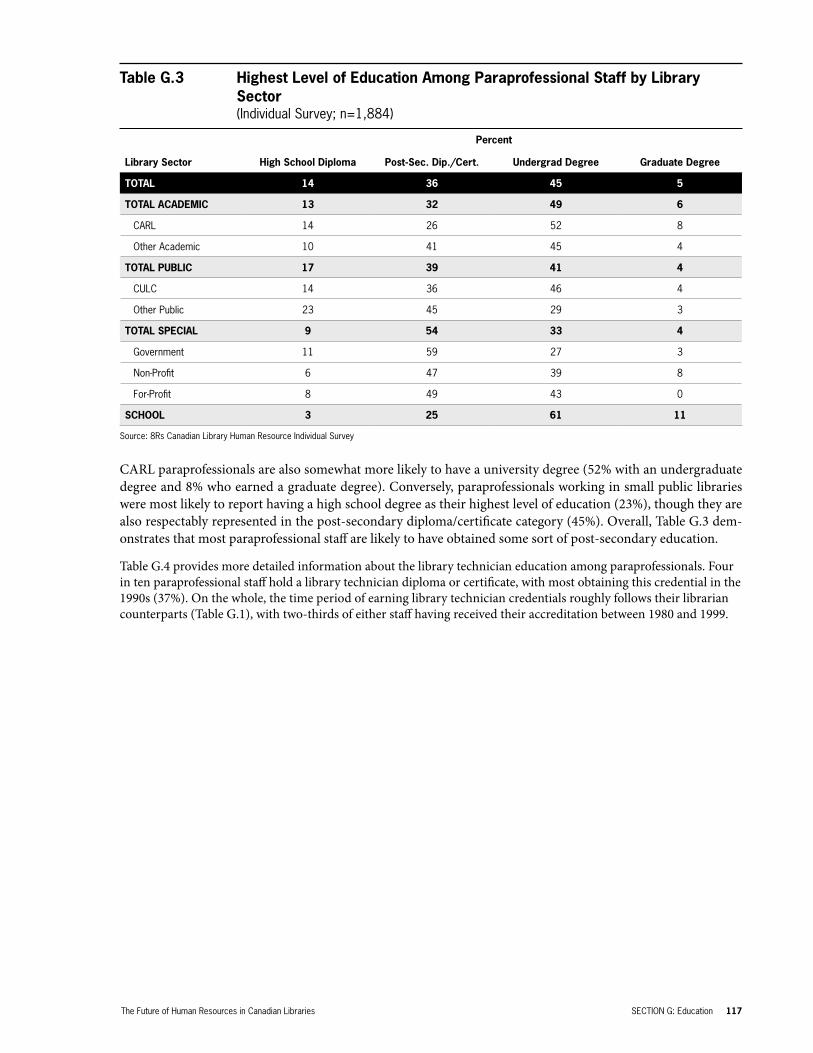
Table G.3 ................................Highest Level of Education Among Paraprofessional Staff by Library Sector
Table G.4 ................................Library Technician Certificate/Diploma Holders and Year Obtained Among Paraprofessional Staff by Library Sector
Figure G.1 ..............................Percent of Library Administrators Agreeing MLIS Programs Equip Graduates with Needed Competencies by Library Sector
Table G.5 ................................Top 5 Suggestions for How to Improve Library Science Programs by Library Sector
Table G.6 ................................Level of Input into Curriculum Content of MLIS Programs by Library Sector
Figure G.2 ..............................Percent of Recent Professional Librarians Satisfied with Overall Quality of Education in MLIS Program by Library Sector
Table G.7 ................................Percent of Recent Librarian Entrants Agreeing that MLIS Program Provided Skills to Effectively Perform their Jobs by Library Sector
Table G.8 ................................Percent of Recent Librarian Entrants Agreeing that MLIS Program Provided Realistic Depiction of Job and Ability to Apply Education to Job by Library Sector
Figure G.3 ..............................Top 5 Suggestions by Recent Librarian Entrants for How to Improve MLIS Programs
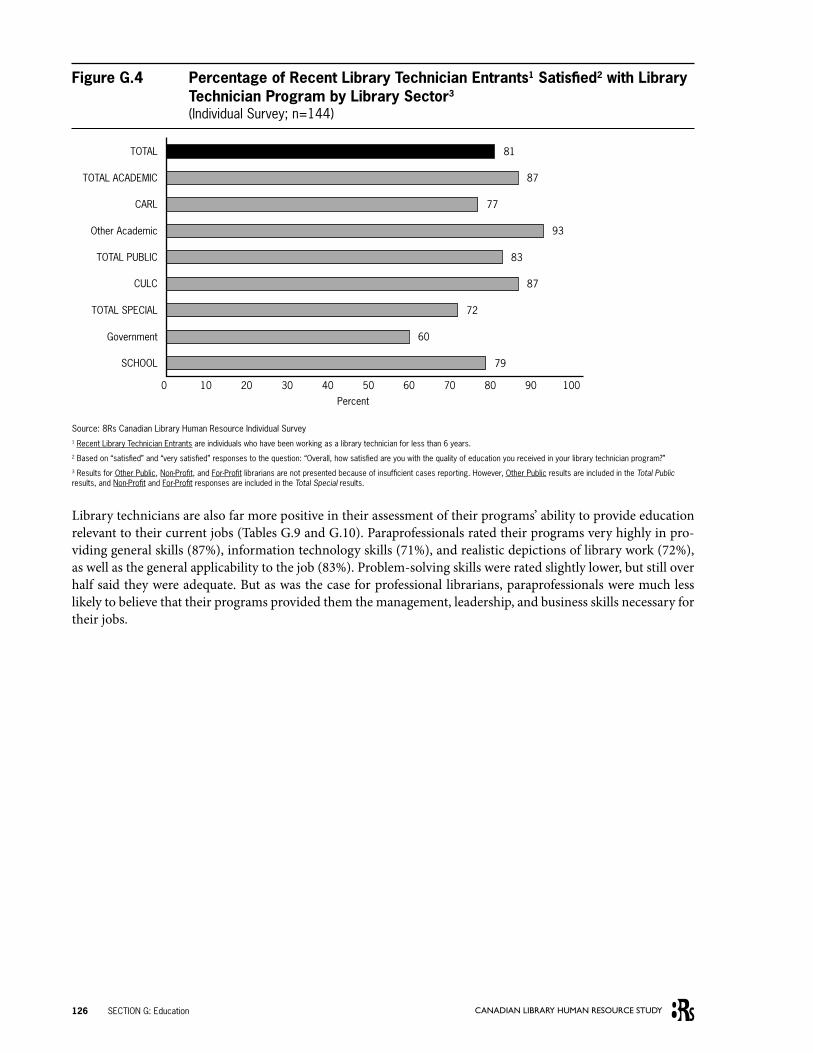
Figure G.4 ..............................Percentage of Recent Library Technician Entrants Satisfied with Library Technician Program by Library Sector
Table G.9 ................................Percent of Recent Library Technician Entrants Agreeing that Library Technician Program Provided Skills to Effectively Perform their Jobs by Library Sector
Table G.10 ..............................Percent of Recent Library Technician Entrants Agreeing that Library Technician Program Provided Realistic Depiction of Job and Ability to Apply Education to Job by Library Sector
x CANADIAN LIBRARY HUMAN RESOURCE STUDY
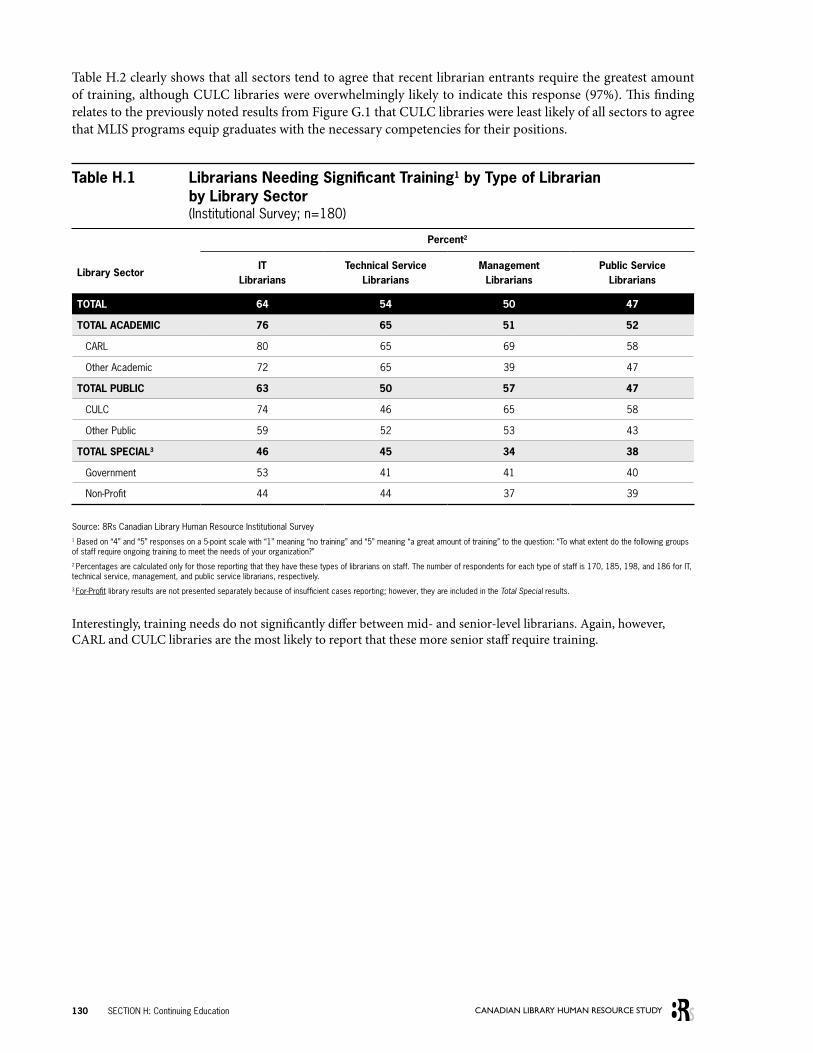
Table H.1 ................................Librarians Needing Significant Training by Type of Librarian by Library Sector
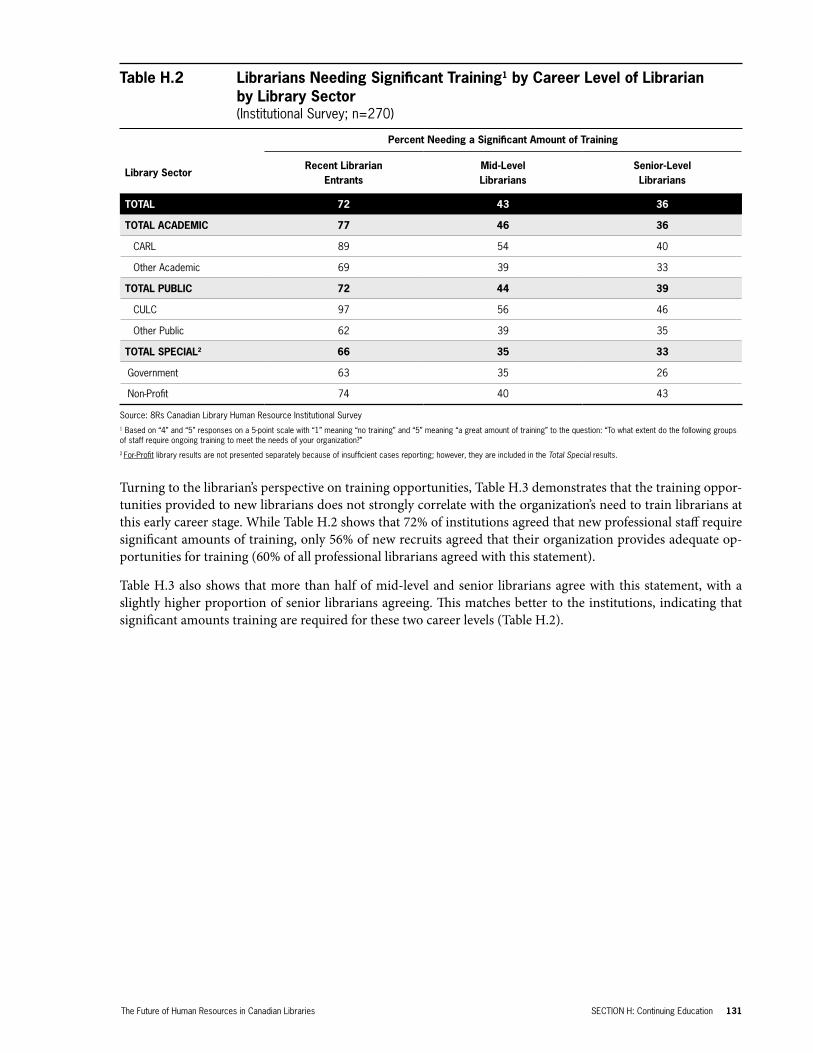
Table H.2 ................................Librarians Needing Significant Training by Career Level of Librarian by Library Sector
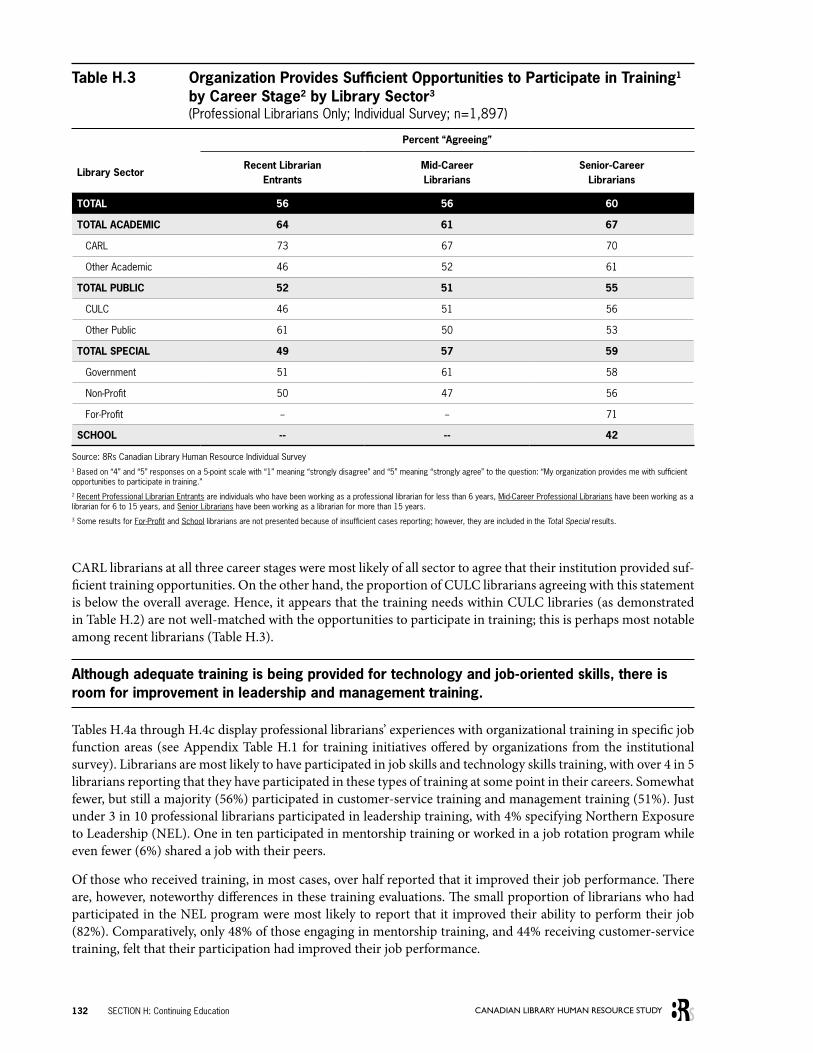
Table H.3 ................................Organization Provides Sufficient Opportunities to Participate in Training by Career Level and Library Sector
Table H.4a ..............................Training Experiences of Professional Librarians by Library Sector
Table H.4b ..............................Training Experiences of Professional Librarians by Library Sector
Table H.4c ..............................Training Experiences of Professional Librarians by Library Sector
Figure H.1 ..............................Organizations Reporting that Budgets Prevent Provision of Training to Librarians by Library Sector
Figure H.2 ..............................Organization Provides Sufficient Opportunities to Participate in Training by Library Sector
Table H.5 ................................Training Experiences of Paraprofessional Staff by Library Sector
Table I.1 .................................Librarian Job Satisfaction by Occupational Level and Library Sector
Table I.2 .................................Librarian Job Satisfaction by Career Stage and Library Sector
Table I.3 .................................Paraprofessional Job Satisfaction by Type of Position and Library Sector
Table I.4 .................................Paraprofessional Job Satisfaction by Career Stage and Library Sector
Table I.5a ...............................Median Yearly Librarian Salary by Occupational Level and Library Sector
Table I.5b ...............................Percentage of Librarians Satisfied with Salary by Occupational Level and Library Sector
Table I.6a ...............................Median Yearly Librarian Salary by Career Stage and Library Sector
Table I.6b ...............................Percentage of Librarians Satisfied with Salary by Career Stage and by Library Sector
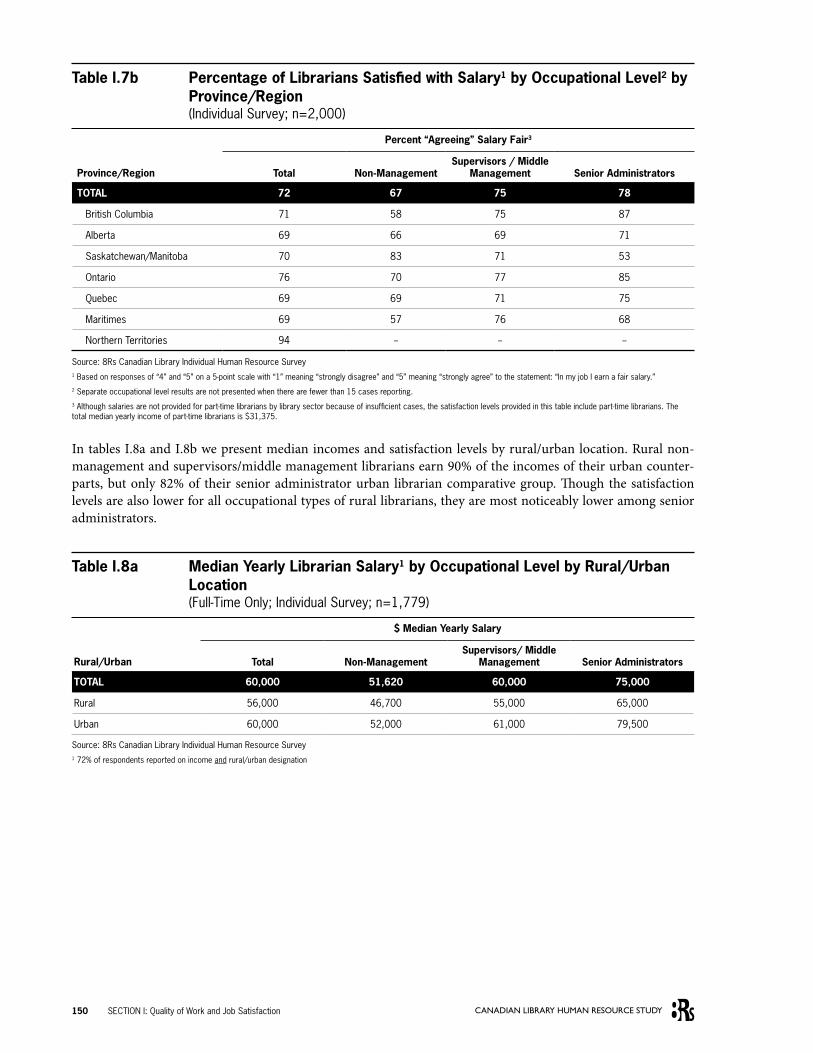
Table I.7a ...............................Median Yearly Librarian Salary by Occupational Level and Province/Region
Table I.7b ...............................Percentage of Librarians Satisfied with Salary by Occupational Level and Province/Region
Table I.8a ...............................Median Yearly Librarian Salary by Occupational Level and Rural/Urban Location
Table I.8b ...............................Percentage of Librarians Satisfied with Salary by Occupational Level and Rural/Urban Location
Table I.9a ...............................Median Yearly Paraprofessional Salary by Type of Position and Library Sector
Table I.9b ...............................Percentage of Paraprofessionals Satisfied with Salary by Type of Position and Library Sector
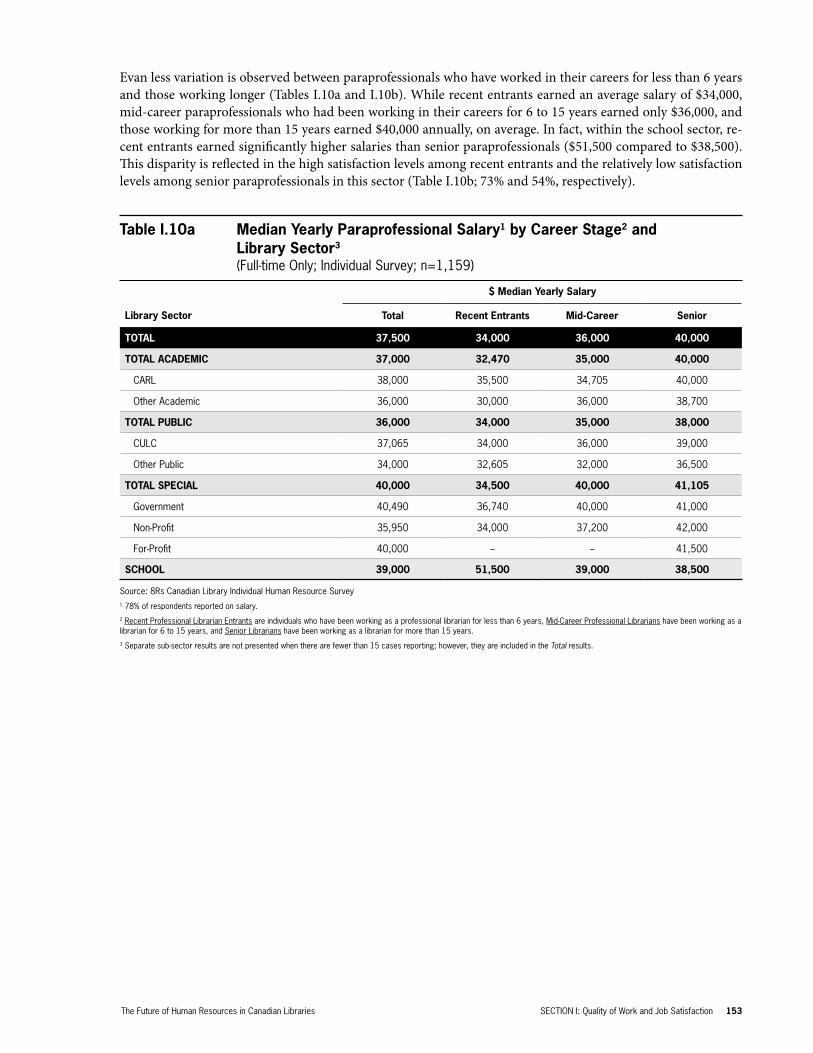
Table I.10a .............................Median Yearly Paraprofessional Salary by Career Stage and Library Sector
Table I.10b .............................Percentage of Paraprofessionals Satisfied with Salary by Career Stage and Library Sector
Table I.11a .............................Median Yearly Paraprofessional Salary by Highest Level of Education and Library Sector
Table I.11b .............................Percentage of Paraprofessionals Satisfied with Salary by Highest Level of Education and Library Sector
Table I.12a and b ....................Benefits Offered to Full-Time, Permanent Librarians by Library Sector
Table I.13 ...............................Percentage of Librarians Satisfied with Benefits by Occupational Level and Library Sector
The Future of Human Resources in Canadian Libraries xi
Table I.14 ...............................Percentage of Paraprofessional Staff Satisfied with Benefits by Type of Position and Library Sector
Table I.15 ...............................Percentage of Organizations Employing Job Strategies for Professional Librarians by Library Sector
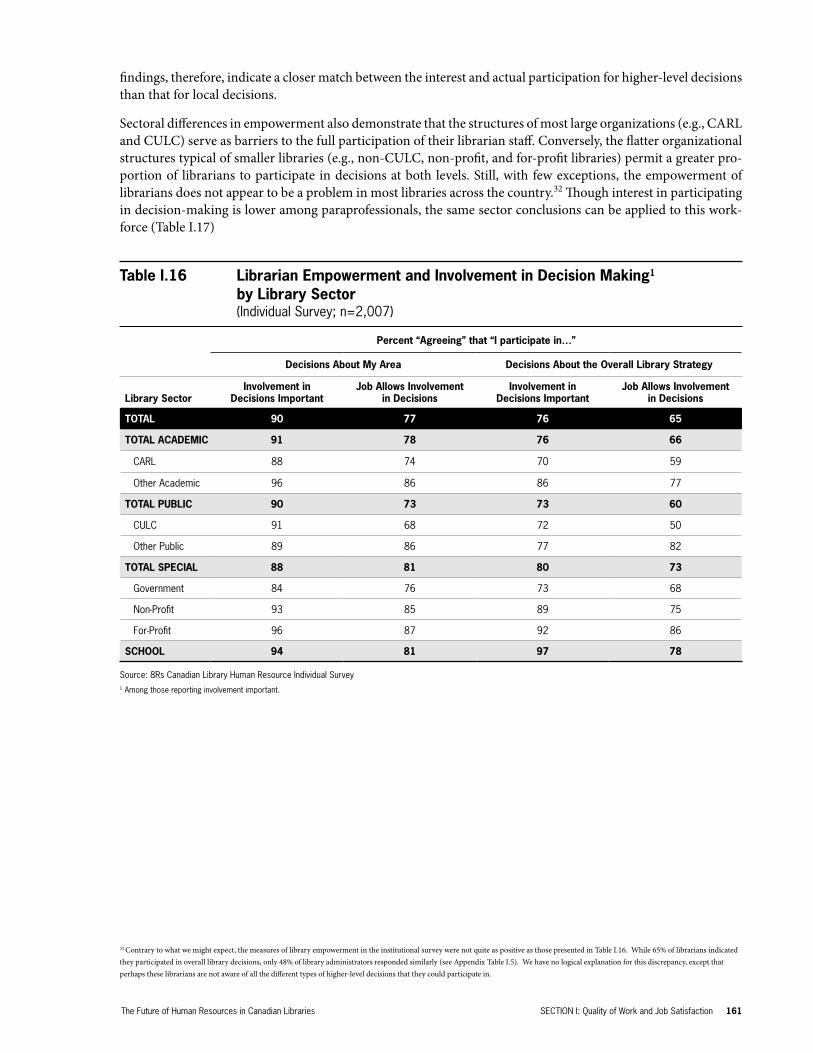
Table I.16 ...............................Librarian Empowerment and Involvement in Decision Making by Library Sector
Table I.17 ...............................Paraprofessional Empowerment and Involvement in Decision Making by Library Sector
Table I.18 ...............................Librarian Workload Manageability, Job Stress, and Work-Family Balance by Library Sector
Table I.19 ...............................Paraprofessional Workload Manageability, Job Stress, and Work-Family Balance by Library Sector
Table I.20 ...............................Respectful Treatment of Librarians and Paraprofessionals by Library Sector
Table J.1 ................................Net Gain/Loss of Librarians in Past Year by Library Sector
Table J.2 ................................Past and Future Demand Increase for Professional Librarians by Library Sector
Table K.1 ................................Top 5 Contributors to Changing Librarian Roles by Library Sector
Table K.2 ................................Past and Future Demand Increase for Generalist and Specialist Librarians by Library Sector
Table K.3 ................................Indicators of Demand for Management and Leadership Skills by Library Sector
Table K.4 ................................Indicators of Demand for Management, Leadership, and Business Skills by Library Sector
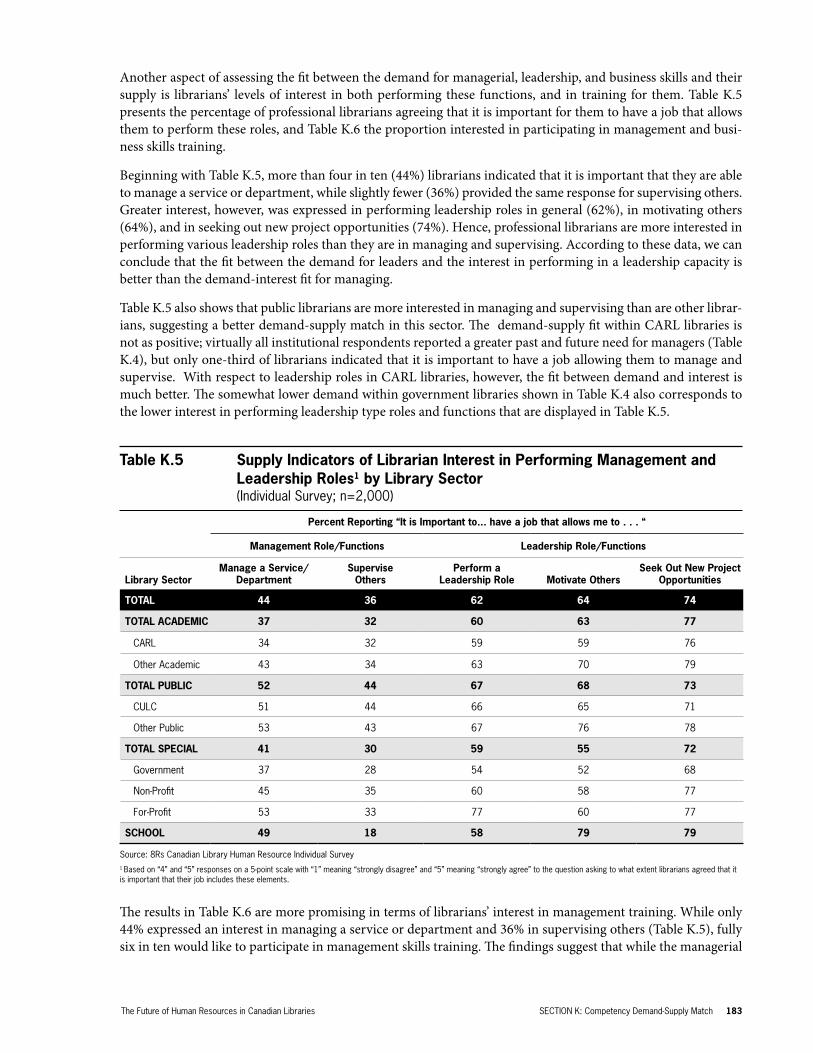
Table K.5 ................................Supply Indicators of Librarian Interest in Performing Management and Leadership Roles by Library Sector
Table K.6 ................................Supply Indicators of Librarian Interest in Participating in Management and Business Skills Training by Library Sector
Table K.7 ................................Supply Indicators of Librarian Interest in Performing and Participating in Training for Management, Leadership and Business by Career Stage
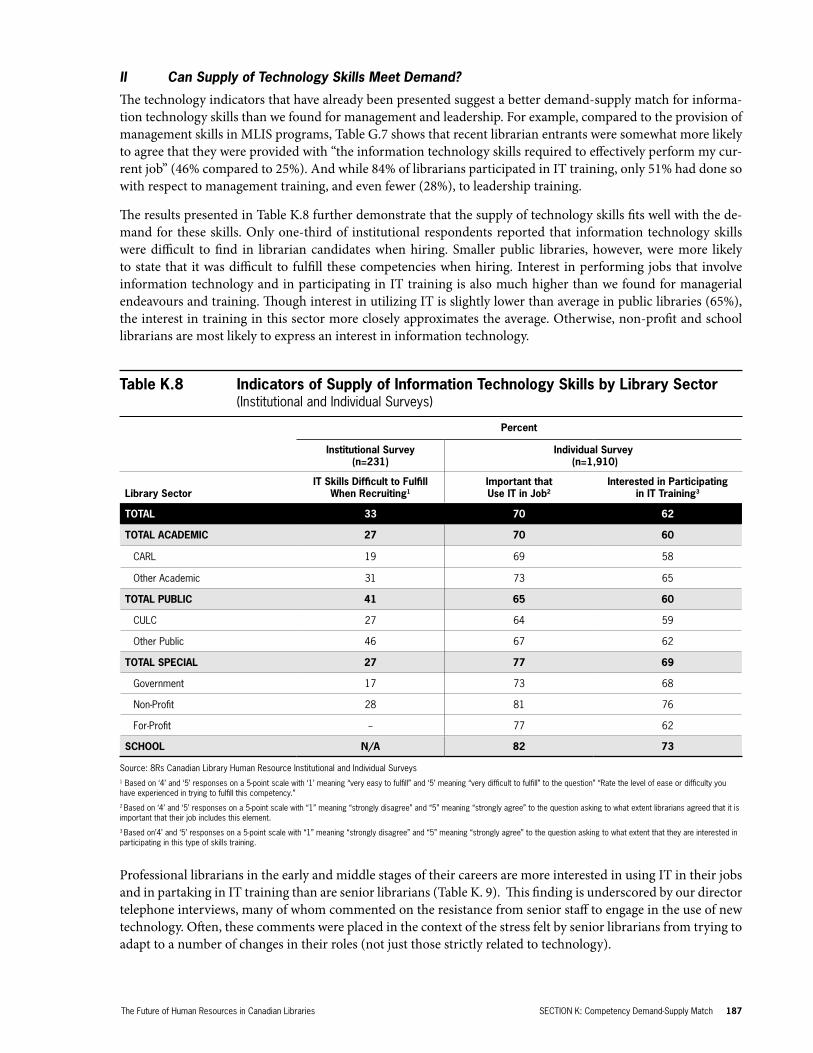
Table K.8 ................................Indicators of Supply of Information Technology Skills by Library Sector
Table K.9 ................................Indicators of Supply of Information Technology Skills by Career Stage
Table K.10 ..............................Paraprofessional Adoption of Professional Roles by Library Sector
Table K.11 ..............................Percentage Frequently Performing Job Function by Type of Staff
APPENDIX B: SUPPLEMENTARY TABLES AND FIGURES
Appendix Table B.1 ..................Communities Included in CMAs and CAs for Designation of Urban Libraries
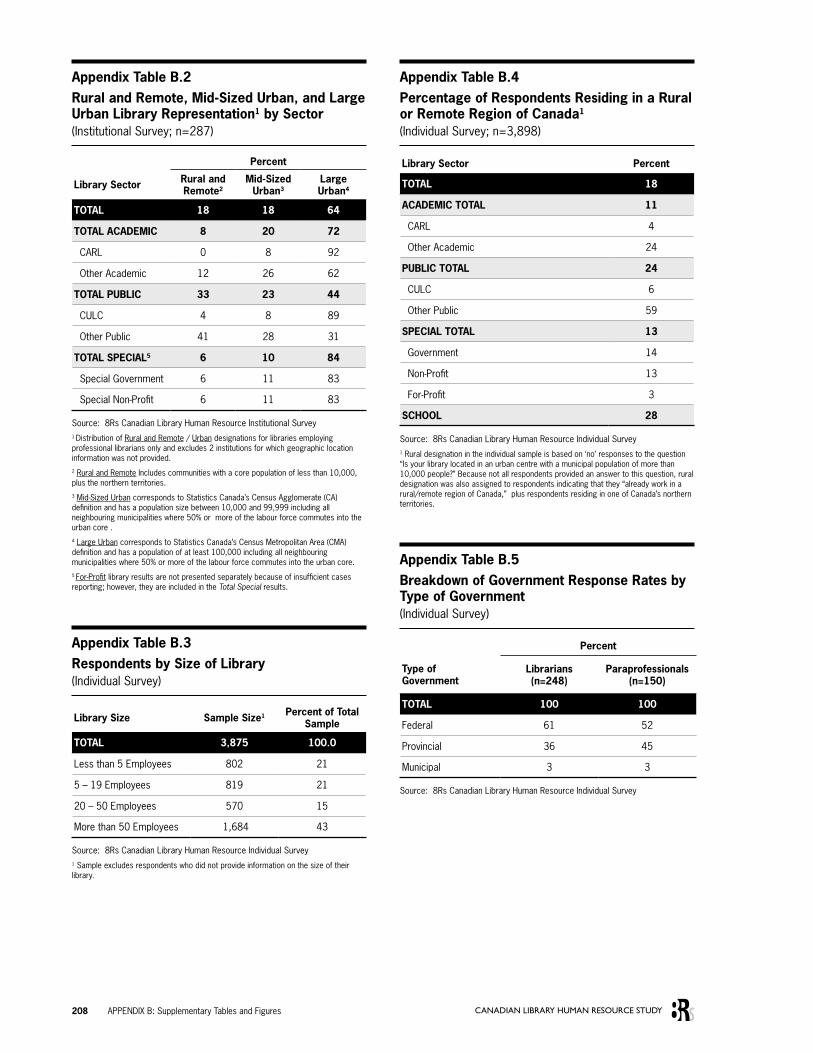
Appendix Table B.2 ..................Rural and Remote, Mid-Sized Urban, and Large Urban Library Representation by Library Sector
Appendix Table B.3 ..................Respondents by Size of Library
Appendix Table B.4 ..................Percentage of Respondents Residing in a Rural or Remote Region of Canada
Appendix Table B.5 ..................Breakdown of Government Response Rates by Type of Government
xii CANADIAN LIBRARY HUMAN RESOURCE STUDY
Appendix Table C.1 ..................Type of Professional Librarian by Library Sector
Appendix Table C.2 ..................Volunteer Labour by Library Sector
Appendix Table C.3 ..................Work Status of Professional Librarians by Library Sector
Appendix Table C.4 ..................Work Status of Paraprofessional Staff by Library Sector
Appendix Table C.5 ..................Visible Minority Status Among Professional Librarians and Paraprofessional Staff by Library Sector
Appendix Table C.6 ..................Recruitment Policies by Library Sector
Appendix Table D.1 ..................Demand Change for Need to Hire Professional Librarians by Library Sector
Appendix Table D.2 ..................Current Ability to Recruit Compared to 5 Years Ago by Library Sector
Appendix Table D.3 ..................Recruitment Patterns by Library Sector
Appendix Table D.4 ..................Applicant Ratings Compared to 5 Years Ago by Library Sector
Appendix Table D.5 ..................Prior Sectors Librarians Worked in by Library Sector
Appendix Table D.6 ..................Canadian Location of Library Applied to by Library Sector
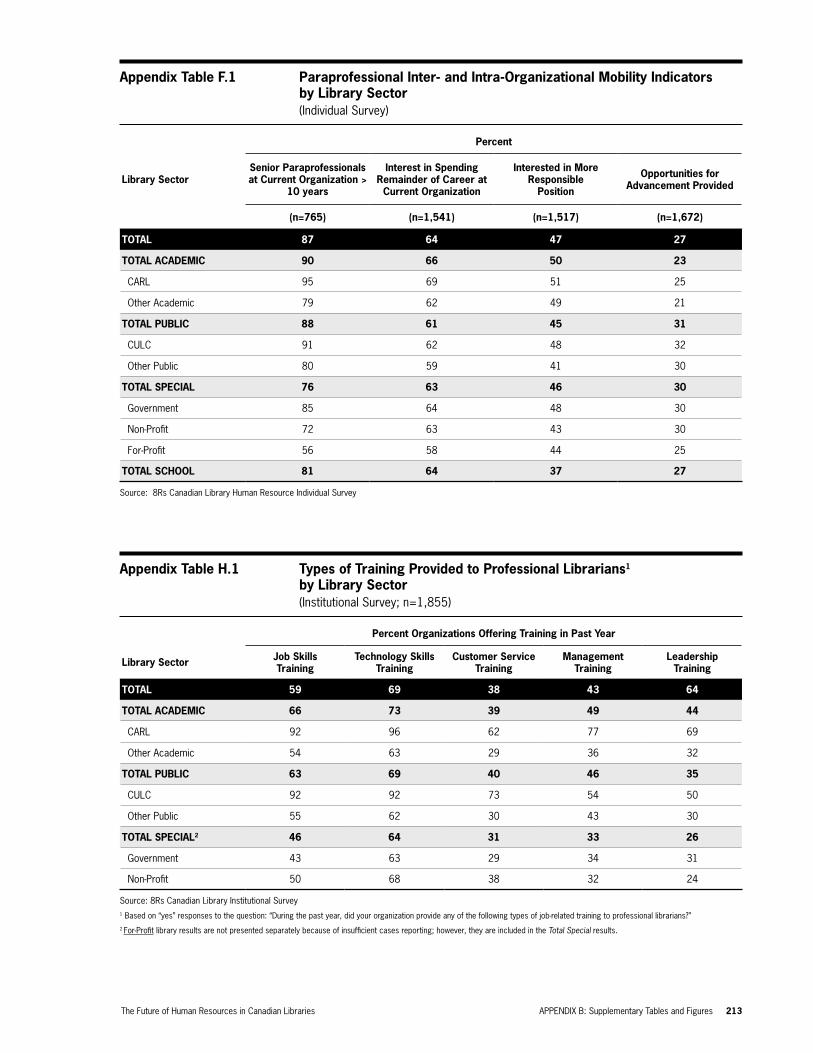
Appendix Table F.1 ..................Paraprofessional Inter- and Intra-Organizational Mobility Indicators by Library Sector
Appendix Table H.1 ..................Types of Training Provided to Professional Librarians by Library Sector
Appendix Figure H.1 ................Organizations Subsidizing Training Outside of Paid Working Hours by Library Sector
Appendix Table I.1a .................Benefits Offered to Temporary Librarians by Library Sector
Appendix Table I.1b .................Benefits Offered to Temporary Librarians by Library Sector
Appendix Table I.2a .................Benefits Offered to Part-Time Librarians by Library Sector
Appendix Table I.2b .................Benefits Offered to Part-Time Librarians by Library Sector
Appendix Table I.3 ...................Percentage of Librarians Satisfied with Benefits by Career Stage by Library Sector
Appendix Table I.4 ...................Percentage of Librarians Satisfied with Benefits by Work Status by Library Sector
Appendix Table I.5 ...................Librarian Involvement in Decision-Making by Library Sector
Appendix Table K.1 ..................Indicators of Demand for Management and Leadership Skills/Abilities by Library Sector
Appendix Table K.2a ................Indicators of Supply of Management and Leadership Skills/Abilities by Library Sector
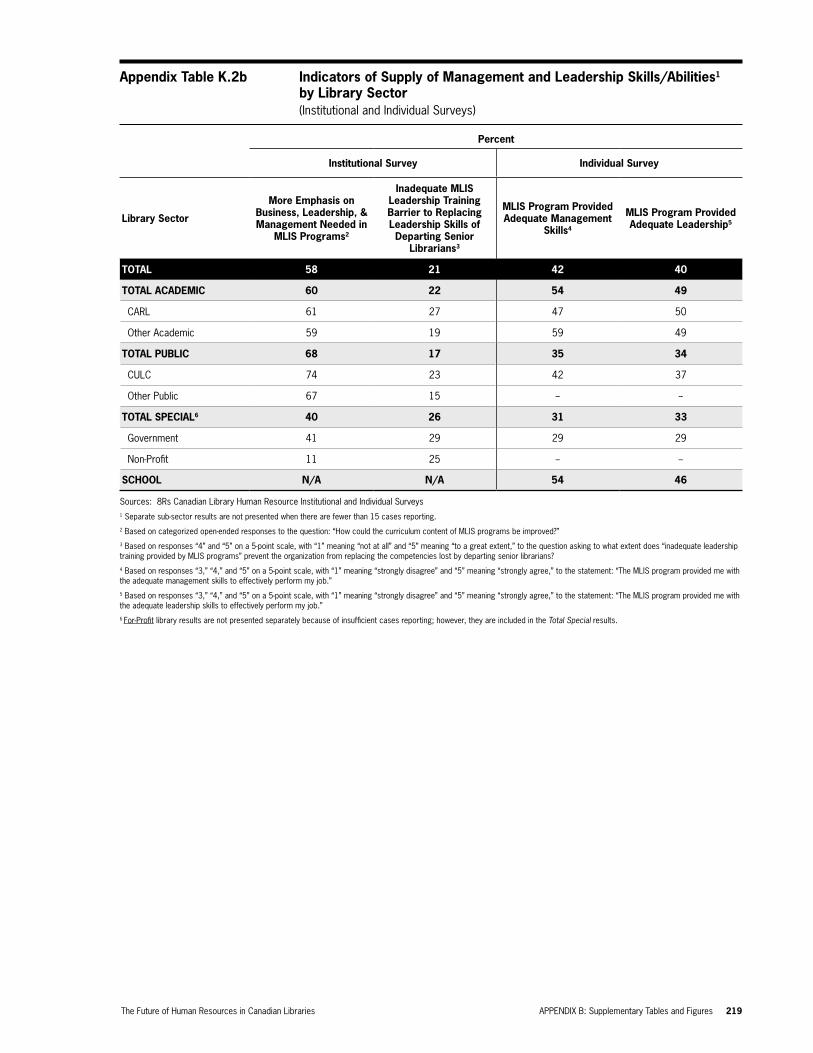
Appendix Table K.2b ................Indicators of Supply of Management and Leadership Skills/Abilities by Library Sector
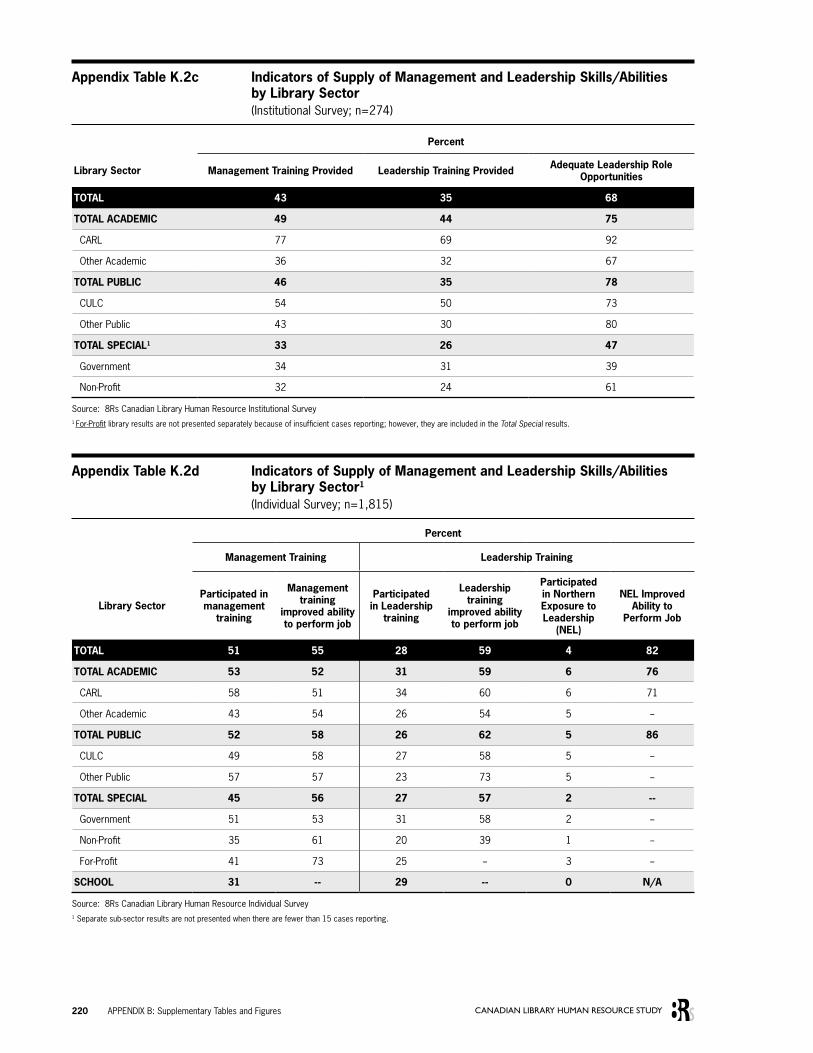
Appendix Table K.2c ................Indicators of Supply of Management and Leadership Skills/Abilities by Library Sector
Appendix Table K.2d ................Indicators of Supply of Management and Leadership Skills/Abilities by Library Sector
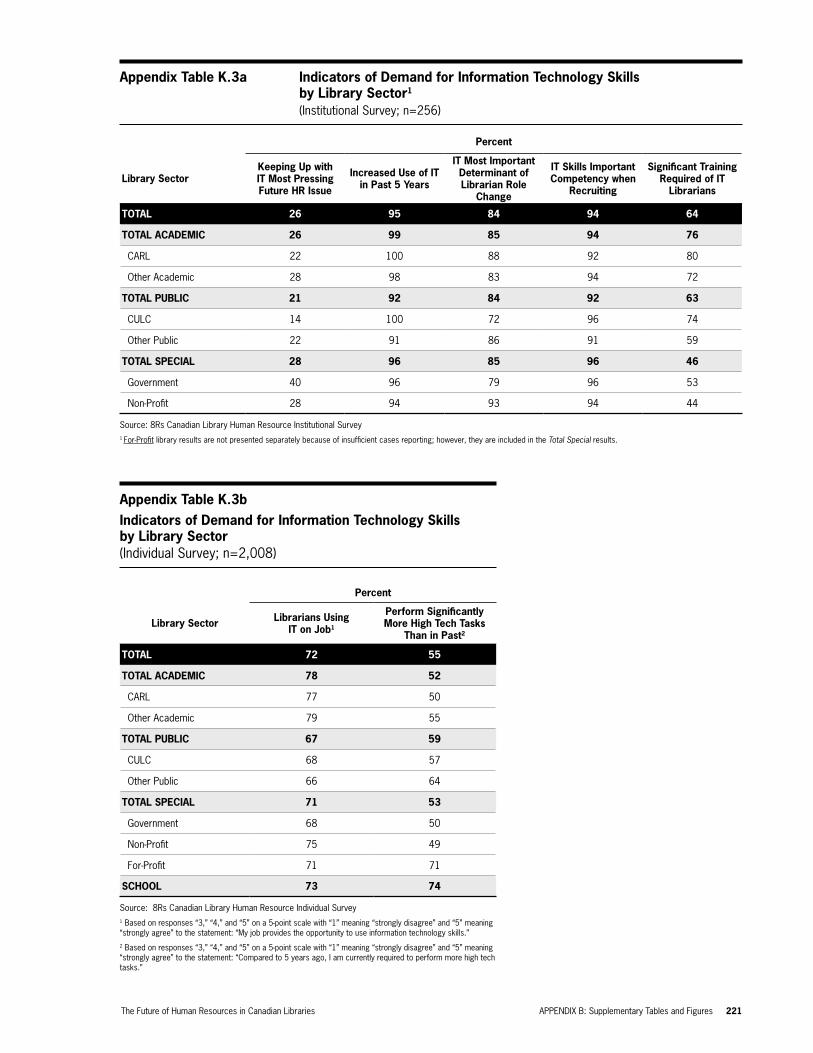
Appendix Table K.3a ................Indicators of Demand for Information Technology Skills by Library Sector
Appendix Table K.3b ................Indicators of Demand for Information Technology Skills by Library Sector
Appendix Table K.4 ..................Major Contributors to Job Stress by Library Sector
Appendix Table K.5 ..................Percentage of Librarians Reporting Job More Enjoyable, Rewarding, Interesting, and Challenging Compared to 5 Years Ago
The Future of Human Resources in Canadian Libraries 1
Executive Summary
Section A: Introduction and Background
This research project began in response to calls for a greater understanding of several intersecting human re-source challenges believed to be facing Canadian libraries. Of primary concern was that of having a sufficient number of adequately trained and experienced staff that could succeed a senior librarian workforce poised to retire in large numbers over the next 5 to 10 years.
In recognizing that retirements cannot be viewed in isolation from a number of interrelated factors, however, the research also encompasses such matters as recruitment, retention, education and training, and quality of work, all within a context of changing library and library staff roles. Specifically, the 8Rs research team highlighted eight elements necessary to address the status of human resources in libraries across the country: recruitment, retire-ment, retention, rejuvenation, repatriation, re-accreditation, remuneration, and restructuring (the 8Rs).
A parallel concern with that regarding a potential human resource shortage is the perceived need to rejuvenate mid-level staff who, because of downsizing and hierarchical flattening, have not been provided with the oppor-tunity to prepare themselves to fill the roles that will arise from retirements. Questions surrounding educational requirements, occupational competencies, and the provision of training opportunities also play into the cultiva-tion of needed skills, knowledge and abilities of library staff.
This report represents the culmination of nearly three years of research, including a survey of 461 library ad-ministrators and human resource managers, a survey of over 2,200 librarians and nearly 2,000 paraprofessionals (non-MLIS staff, excluding library clerks), in-depth telephone interviews with 17 library administrators, and 3 focus group sessions. In addition, a literature review and analyses of existing data were conducted.
The report, therefore, covers much ground that has never before been examined in libraries. The 8Rs study pro-vides the data and analysis to inform national coalitions and partnerships between libraries, educational institu-tions, and representative professional associations about the issues surrounding the supply and demand of the workforce. In doing so, the study permits an unprecedented opportunity to assess the sector’s readiness to accom-modate change and to illuminate potential strategies that can be used by libraries in planning their own human resources.
Although we recommend and hope that most individuals will read this report in its entirety, we are well aware that because of the sheer size of the report, not all individuals will be able to do so. We have thus tried to construct this executive summary and the consolidation of the human resource implications presented in the next section
2 CANADIAN LIBRARY HUMAN RESOURCE STUDY
to include the major findings, conclusions, and implications. Alternatively, readers might also use this report as a reference tool in which they can examine specific sections and tables of the report that are applicable to their area of interest.
Section B: Methods
The research methods involved three major stages, with each consecutive stage designed to inform the directions and content of subsequent stages. Stage I entailed a literature review, a compilation of existing Statistics Canada and library school graduate data, in-depth interviews with 17 library administrators and focus group sessions with representatives from the Canadian Association of Research Libraries (CARL), the Canadian Urban Libraries Council (CULC), and the Alberta Association of Library Technicians (AALT).
Stage II of the 8Rs project involved the completion by library management from academic, public, and special library systems of a written, mail-out survey in the summer of 2003. Of the 1,357 surveys randomly distributed, 461 were completed for a response rate of 34%. The 63% of institutions that employed professional librarians together represented 3,300 librarians.
Stage III, a web survey of professional librarians and paraprofessional staff conducted in the summer of 2004, was the largest and most comprehensive stage of the research project. The analytic focus of this portion of the study was to gain an understanding of the 8Rs from the viewpoints of those who work in libraries. To optimize the number of survey respondents and therefore the representativeness of the sample, both random and non-random sampling strategies were used. Of the 8,626 potential respondents randomly selected from the sampling frame, 3,148 librarians and paraprofessional staff participated in the survey for a response rate of 37%. When adding the 1,545 non-random respondents to the sample, the total sample size increases to 4,693 for a confidence interval of plus or minus 1.2 percent (i.e., the total sample results are within plus or minus 1.2 percent 95 times out of a hundred).
All survey data have been analyzed by type of library, and in some instances, by geographic location.
Section C: Workplace and Demographic Characteristics of Canadian Library Personnel
The sample of professional and paraprofessional staff have the following characteristics:
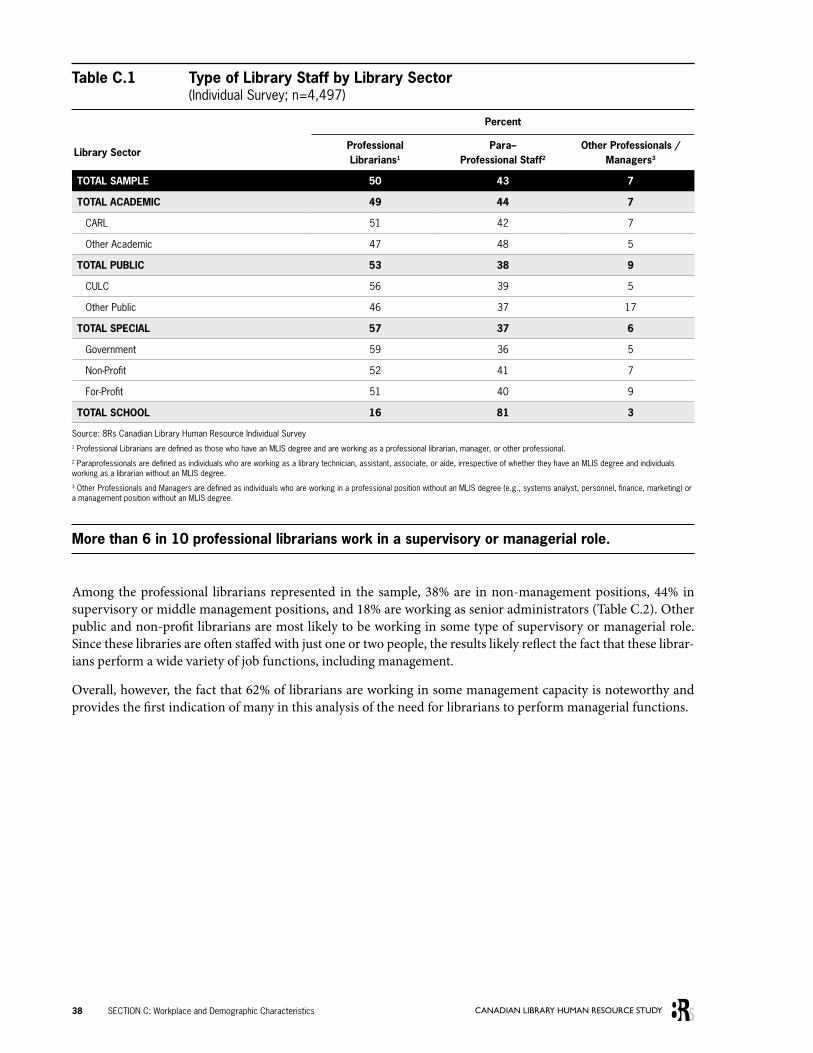
• About 6 in 10 professional librarians and 3 in 10 paraprofessionals work in a supervisory or managerial role.
• Though small proportions of librarians and paraprofessionals work in temporary positions (7% and 6%, respectively), one quarter of paraprofessionals work on a part-time basis (compared to only 7% of profes-sionals). Part-time positions for paraprofessionals are most common in the public sector where we find that 43% of these positions involve working less than 30 hours per week.
• 54% of professional librarians and 44% of paraprofessionals have been working in their careers for more than 15 years. School librarians are the most likely to have worked in their careers for this length of time (63%), while small public library paraprofessionals tend to have had the shortest careers with only 30% working for more than 15 years.
• 4 in 5 professional librarians are female, but 9 in 10 of paraprofessionals are female.
• Visible minorities and Aboriginal individuals are not well represented in Canadian libraries. Seven percent of professional librarians are visible minorities (compared to 14% for the entire Canadian labour force) and only 1% are of Aboriginal origin (compared to 3% in the total labour force). The figures are virtually the same for paraprofessionals.
The Future of Human Resources in Canadian Libraries 3
• One-quarter of librarians and one in five paraprofessionals are 55 years of age or older (compared to 11% among all Canadian workers). School librarians have the oldest demographic profile, while librarians working in non-profit libraries are the youngest.
Section D: Recruitment
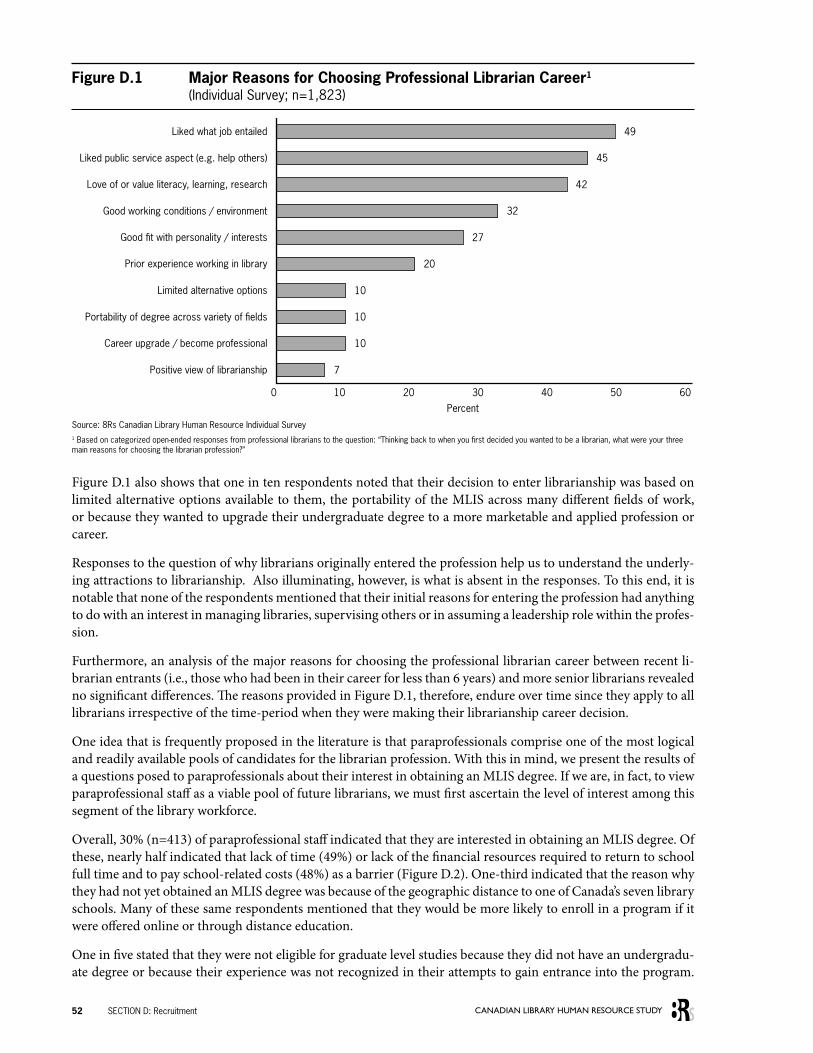
Recruitment to the Librarian ProfessionResearch demonstrates that popular stereotypes of librarians persist, no doubt contributing to whatever problems might exist when recruiting individuals to the librarian profession. When librarians themselves were asked about what attracted them initially to the profession, the 8Rs research found the most common reasons were because of the core values of librarianship, including an appreciation of books, learning, and research and an interest in serving the public good. Notably, none of the respondents mentioned that their initial reasons for entering the profession were at all related to an interest in managing or in supervising others. Furthermore, positive views of librarianship that drove the initial reason for entering the profession often emerged from having prior exposure or experience with librarians and libraries. These results suggest that efforts to recruit to the profession could be targeted to library users and other library staff, and should entail an educational component highlighting the core values of librarianship, while at the same time detailing some of the many functions of librarians, and perhaps most visibly, the functions of managing, supervising and leading.
Three in 10 paraprofessionals indicated an interest in obtaining an MLIS degree. When the paraprofessional sam-ple was asked to explain why they had not pursued this degree, the most dominant response was limited access to library school programs. Hence, when assessing recruitment to the librarian profession, consideration must not only be placed on public perception of the profession, but also on accessibility to the profession.
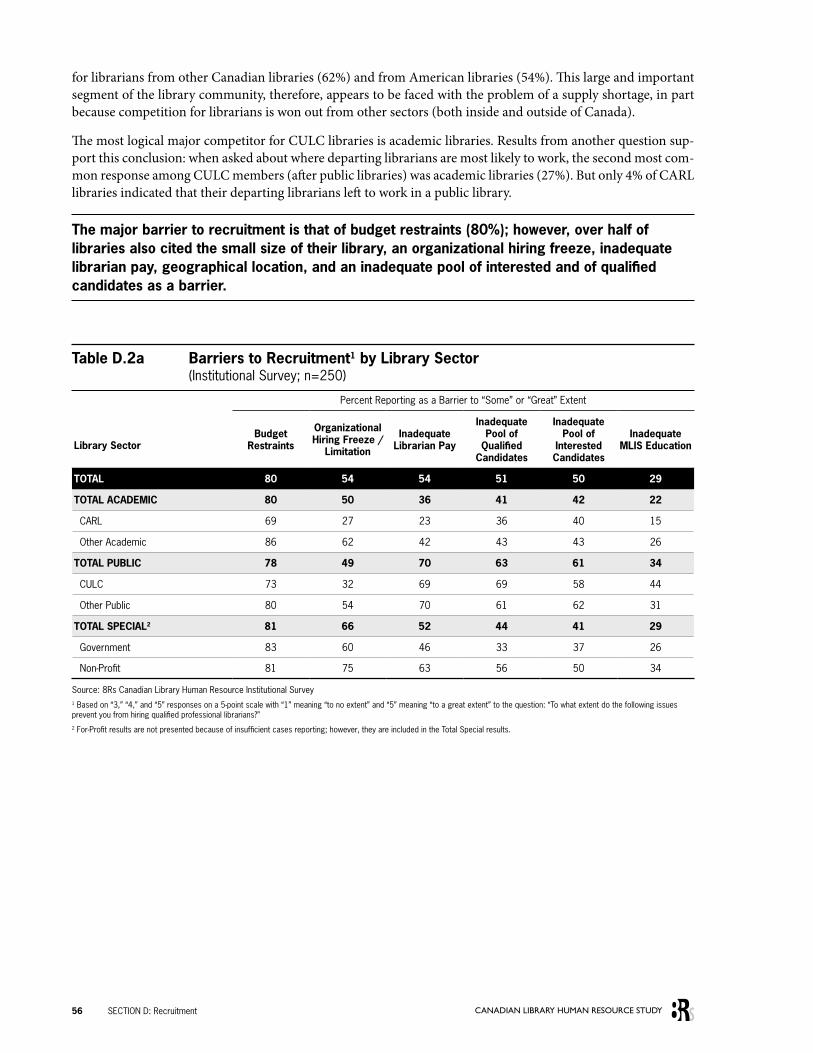
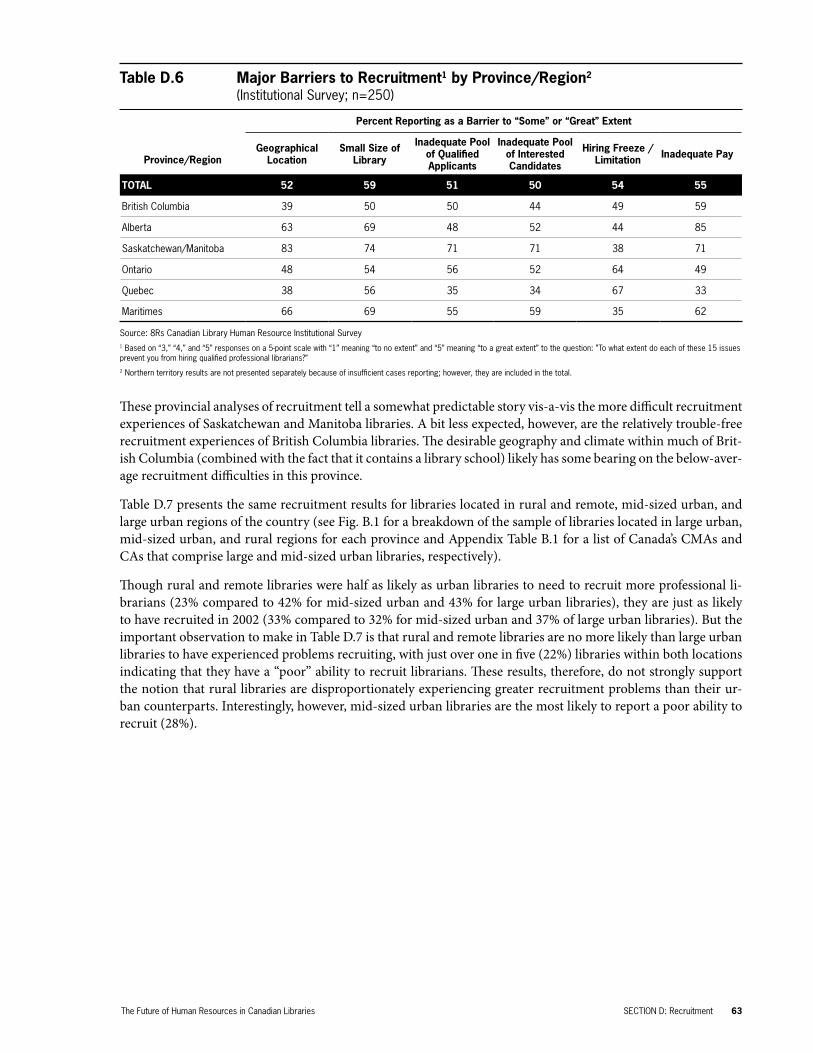
Demand Side Recruitment Issues: Organizational Recruitment The predominant recruitment pattern in 2002 represented by nearly half of libraries was that of not having an increased need to recruit librarians compared to 5 years ago, combined with no recruitment activity. Keeping in mind that very few (23%) of institutional respondents indicated that they currently had a “poor” ability to recruit, budget restraints was the most-cited barrier to recruitment for all library sectors. Otherwise, the results demon-strated that CARL libraries are hiring more extensively, are not experiencing excessive problems recruiting, and are not faced with as many barriers to recruitment as the rest of the Canadian library community. Conversely, CULC libraries are actively engaged in recruitment and are faced with a tight labour market in which they are vying primarily with CARL and other academic libraries to access a sufficient number of adequately and ap-propriately trained librarians. In the smaller libraries of this nation is yet another story; one which is typified by little recruitment need and activity. These libraries are, however, faced with a perennial financial problem and are handicapped simply because of their small size. In addition to these barriers, the recruitment efforts of libraries located in Saskatchewan and Manitoba are further hampered by their geographic location, which in turn explains their likelihood of not having a sufficient pool of interested or qualified candidates applying for positions in their libraries.
Interestingly, libraries located in rural and remote regions of Canada did not report having more problems re-cruiting than did urban libraries, although as we would expect, they are more likely to experience problems because of their geographic location and small size. One-third (32%) of librarians indicated that they would consider working in a rural or remote library primarily because of the more attractive lifestyle often associated with smaller communities.
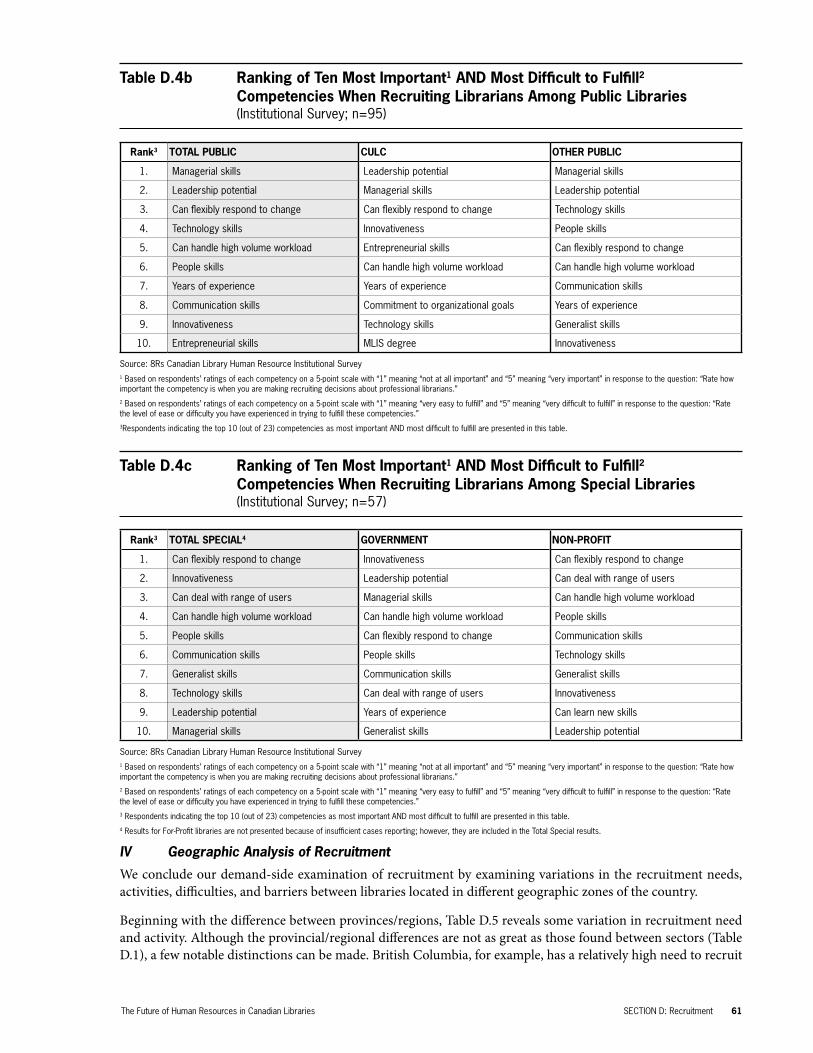
An analysis of the match between the competencies needed by libraries and their ability to meet these needs when recruiting revealed little sector variability. Virtually all types of libraries in the Canadian system are finding it the most difficult to fulfill their leadership, managerial, flexibility, innovation, technology and workload needs.
4 CANADIAN LIBRARY HUMAN RESOURCE STUDY
Supply-side Recruitment Issues: Staff Sector and Geographic Interests and Activities An examination of the library sector applied to among recent librarian recruits (i.e., those who have been work-ing in their careers for less than 6 years) when looking for their first librarian position revealed that at least part of the recruitment problems experienced by CULC libraries is because candidates are less likely to apply for jobs in this sector than they are to apply for jobs in academic and special libraries. For example, only 43% of current academic librarians applied for a public librarian position when looking for their first professional job compared to 54% who applied to a special library.
Three in 10 recent entrants initially applied to a non-Canadian university, primarily because they perceived a shortage of Canadian jobs. Furthermore, an analysis of the reasons for leaving and returning among the 7% of librarians who had previously worked outside of Canada revealed that labour market conditions explained why 44% of librarians left Canada, but only why 17% returned to Canada. The implication of this difference is that improvements to the Canadian librarian labour market will serve primarily as a deterrent to emigration and not necessarily as an encouragement to repatriation.
With respect to the early labour market experiences of recent librarian recruits, 84% found their first position within 6 months of graduating from their MLIS program (compared to 77% of recent library technician entrants). However, most (57%) of these initial positions were of a temporary nature. Recent librarian recruits working in CARL libraries were both initially (65%) and currently (31%) the most likely to be working in a temporary em-ployment arrangement.
Section E: Retirement
Recent Retirement TrendsThirty-four percent of libraries had at least one librarian retire between 1997 and 2002 (representing 11% of li-brarians). Somewhat smaller proportions of libraries experienced a paraprofessional retirement during this same period (23%, representing 7% of current paraprofessionals).
Age of RetirementBetween 1997 and 2002, the majority (79%) of librarians retired before the age of 65. Current senior librarians’ predictions about their age of retirement, changes in provincial legislation on mandatory age of retirement, and concerns about having the financial ability to retire combine to suggest that age of retirement will increase in the future.
Predicted Future RetirementWhen employing the most likely scenario of age of retirement (62 years of age), 16% (1,440) of the current profes-sional librarian labour force are predicted to retire over the next 5 years (between 2004 and 2009). A somewhat larger proportion of retirements are predicted to occur between 2009 and 2014 at 23% (2,070), for a total pre-dicted retirement rate of 39% (3,510) between 2004 and 2014. However, since the librarian age profile is highly concentrated in an older demographic (e.g., nearly half are currently 50 years of age and older), these predictions are highly dependent upon age of retirement.
Predicted rates of retirement among paraprofessional staff are slightly lower: 13% between 2005 and 2009 and 21% between 2009 and 2014, for a total 10-year retirement rate of 34%.
The implications of these data are that efforts to groom the next generation of leaders and managers need to begin now, not only with mid-level librarians, but with recent entrants into the profession. Moreover, when re-tirement rates for both professional librarians and paraprofessional staff are viewed in their entirety, succession management becomes more complex. The experience, skills, talents, and knowledge lost by the two most pre-dominant occupational groups within libraries present a compounded situation that warrants careful scrutiny. If, for example, paraprofessionals are viewed as a possible pool of future professional librarians, the paraprofessional workforce will be subject to further losses which, as the retirement data suggest, the library community can ill
The Future of Human Resources in Canadian Libraries 5
afford. Together then, these results suggest that the library community needs to focus more strongly on attracting lay individuals to libraries in both professional and paraprofessional capacities.
Retirement Attitudes and Retirement Policy ImplicationsOverall, only 3 in 10 senior librarians are looking forward to retirement to a “great extent” while most (56%) reported “to some extent.” Furthermore, large proportions of librarians indicated that they would consider both delaying their retirement (75%) and accepting an early retirement plan (68%), suggesting that retirement timing can be influenced by organizational policies and practices. The strongest determinant of time of retirement for librarians is their financial ability to do so. The same retirement attitudes were found among senior paraprofes-sional staff.
Replacing Retiring Professional LibrariansLibraries experienced greater difficulties replacing the leadership qualities lost when librarians retired than they did replacing their technical skills and knowledge. Anticipated future concern is also slightly greater for leader-ship replacement than for skills and knowledge; 46% of libraries reported that their current pool of internal suit-able candidates is inadequate to replace the leadership qualities lost by departing senior librarians compared to 40% of libraries responding similarly with respect to skills and knowledge.
The most frequently-cited barriers to the replacement of competencies lost by retiring librarians cited by at least 6 in 10 libraries include budget restraints, inadequate leadership or management training within the organiza-tion, the absence of a succession plan (currently only 1 in 10 libraries has a formal succession plan in place), an inadequate pool of qualified candidates, an inadequate pool of interested candidates, and the inability to fast track strong candidates.
Section F: Staff Retention
Departure and Tenure RatesOrganizational longevity of librarians and low turnover rates are indicated by the following two findings:
• Only one in every five libraries experienced a librarian departure in 2002 (excluding retirements): 73% left voluntarily and 27% left involuntarily.
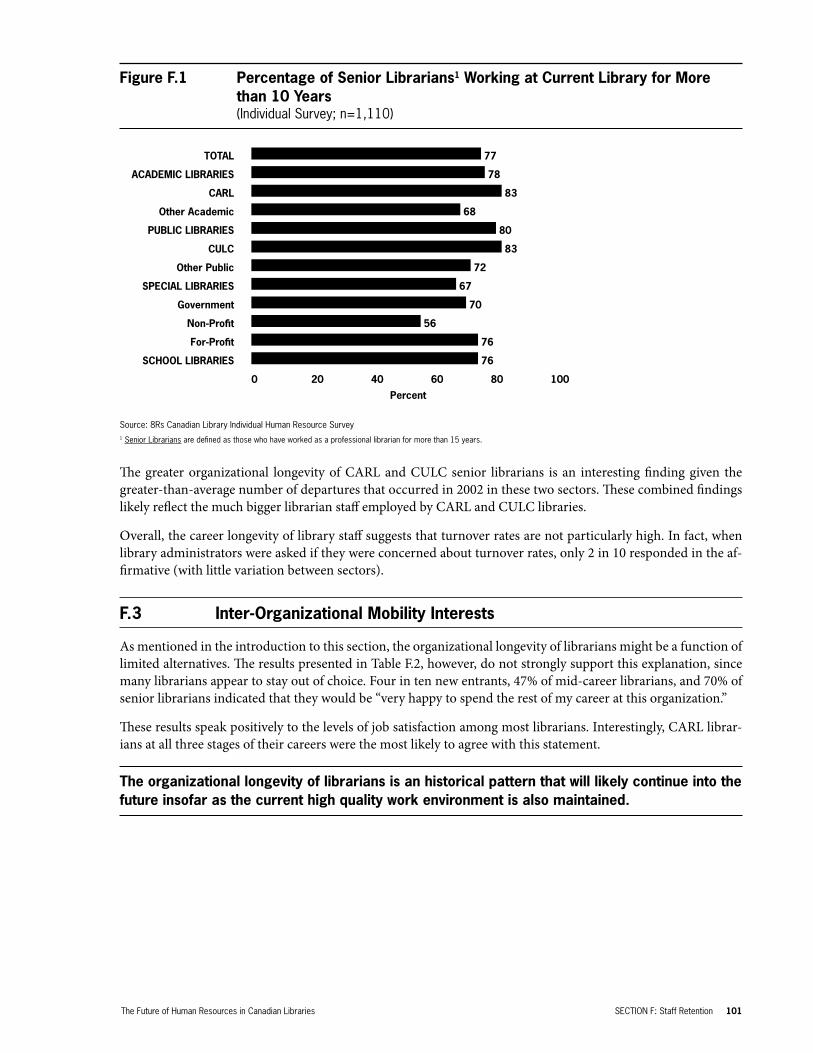
• 77% of senior librarians have worked in their current organization for more than 10 years.
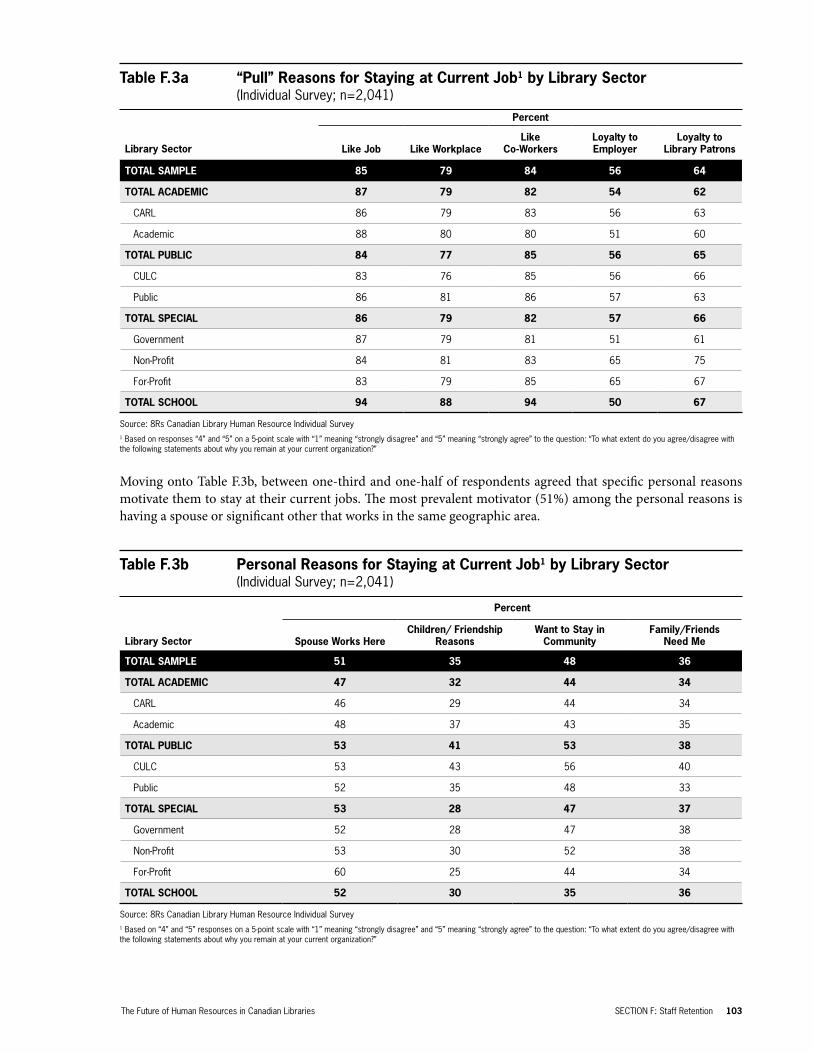
Inter-Organizational Mobility InterestsThe 8Rs research found that librarians are primarily motivated to stay at their workplace because of job satisfac-tion. For example, 88% reported that they stayed at their current workplace because they liked the job compared to only 21% who agreed that they stayed because there are no other jobs available.
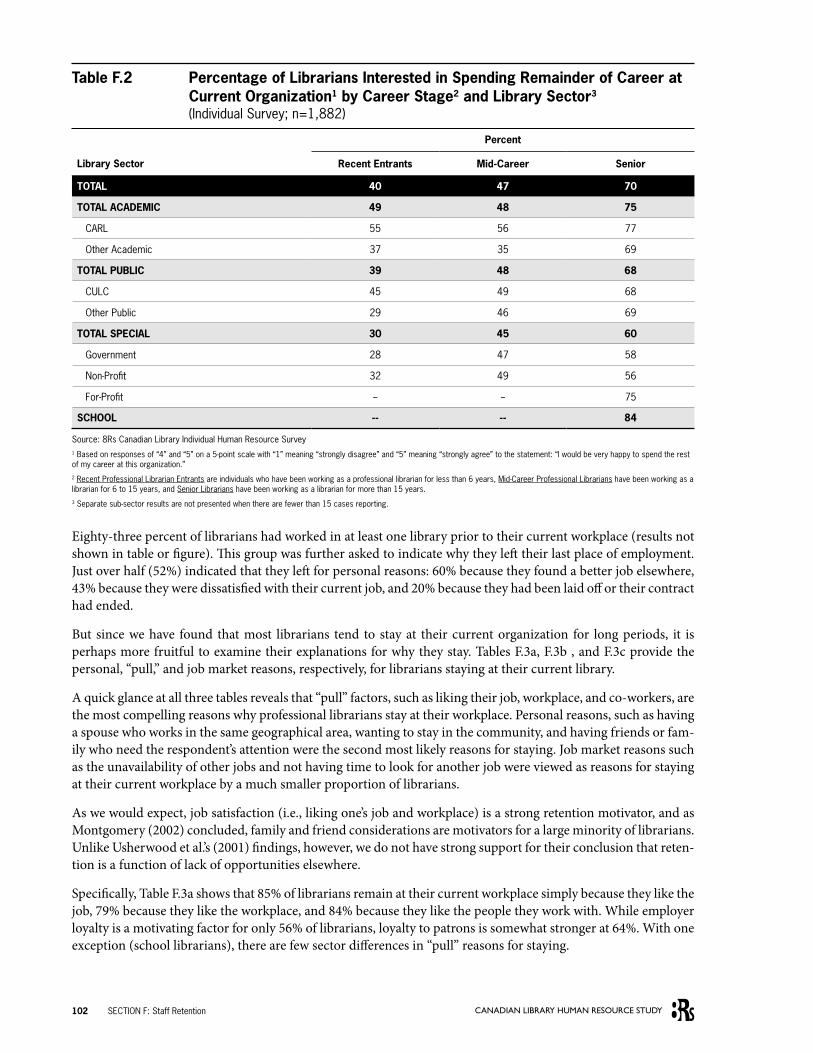
Intra-Organizational Mobility: The Match between Career Aspirations and Promotional OpportunitiesThe existing promotional opportunities offered within Canadian libraries match fairly well with the current ca-reer interests of the librarian workforce. When examining the career interests and promotional opportunities of recent librarian recruits, for example, 57% indicated an interest in working in a more responsible position, 50% reported that they would like to see themselves working in a management position within the next 10 years, and 65% agreed that their job provides opportunities for advancement. At the same time, the institutional survey revealed that promotional opportunities are hampered primarily because of limited staff turnover.
6 CANADIAN LIBRARY HUMAN RESOURCE STUDY
Section G: Education
Educational BackgroundThree in 10 professional librarians have at least one other degree (other than their MLIS and undergraduate de-grees). Most notable, however, is the finding that half of the paraprofessional respondents in the survey have a university degree (5% with a graduate degree).
Evaluation of EducationThree-quarters of library administrators agreed with the statement “the education provided in MLIS programs equips graduates with the competencies required to be professional librarians in your organization,” but only 64% of recent librarian recruits indicated that they were satisfied with the overall quality of the education they received in their MLIS program. Results from both survey groups, however, suggest that greater curriculum emphasis should be placed on management, leadership, and business skills and that more opportunities should be provided to engage in hands-on practical experience (e.g., through practicum and internship programs). These suggestions are perhaps most relevant to MLIS training with respect to the needs of CULC libraries.
Evaluations by recent library technician recruits of library technician programs was much more favourable, with 81% expressing satisfaction with the overall quality of their education. Furthermore, 81% of recent library tech-nician recruits (compared to 63% of professional librarians) agreed that their program provided them with the general skills and abilities required to perform their jobs, and 71% (compared to 46% of professional librarians) responded similarly with respect to the provision of information technology skills.
Section H: Continuing Education
Organizational Training of Professional LibrariansRecent librarian recruits are felt by 72% of libraries to require the most amount of training, but only 56% of these librarians indicated that they are provided with sufficient opportunities to participate in training. Moreover, training in management, leadership, and business for all librarians was found to be the most lacking, especially in light of the organizational need for librarians to perform such roles. Suggested by these data is the need for organizations to explore how they can provide management and leadership training through experiential means such as mentorship, job rotation, and job sharing programs. Also, the positive results of participating in leader-ship programs like the Northern Exposure to Leadership (NEL) Institute suggest that similar non-organizational initiatives should be considered by the library community.
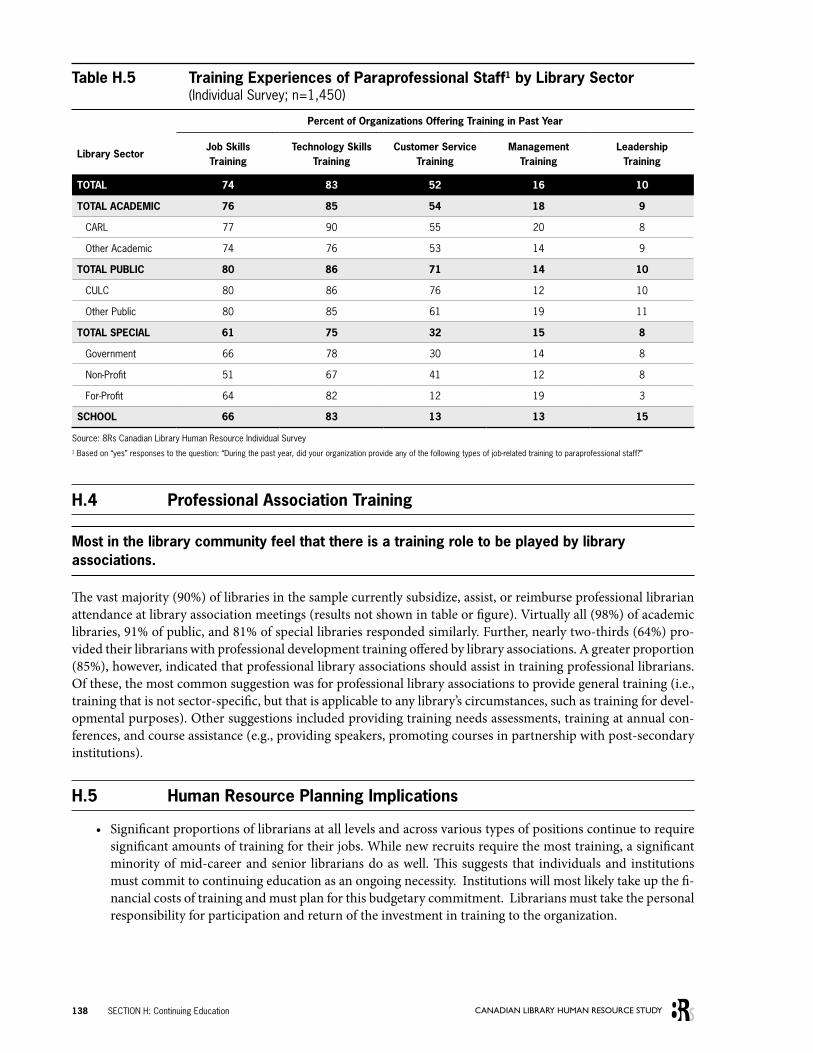
Organizational Training of ParaprofessionalsEvaluations of training among paraprofessionals were not quite as positive as they were among professionals. For example, only 44% of paraprofessional respondents agreed that their organization provides them with suf-ficient opportunities to participate in training (compared to 60% of professional librarians). As we might expect, the professional-paraprofessional differences are most remarkable for management and leadership training, with only 16% of paraprofessionals having participated in management training and 10% in leadership training (com-pared to 51% and 28%, respectively, among librarians).
Professional Association TrainingThe vast majority (90%) of libraries in the sample currently subsidize, assist, or reimburse professional librar-ian attendance at library association meetings. Further, nearly two-thirds (64%) provided their librarians with professional development training offered by library associations. An even greater proportion (85%) agreed that professional library associations should assist in training professional librarians.
The Future of Human Resources in Canadian Libraries 7
Section I: Quality of Work and Job Satisfaction
Overall Job SatisfactionAbout 8 in 10 librarians and paraprofessionals indicated they were “satisfied” or “very satisfied” with their current job. Satisfaction is especially high among management and among school library staff.
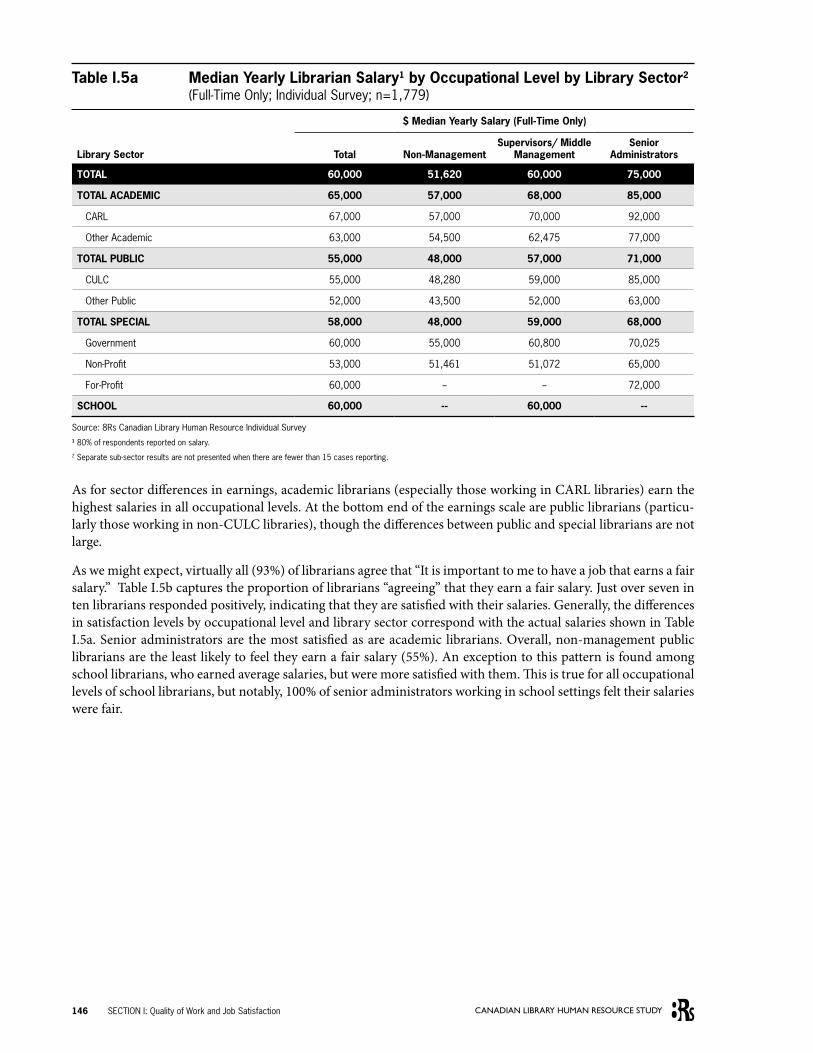
Extrinsic Benefits and Job SatisfactionOn average, all full-time librarians earned a median income of $60,000 per year. Non-management librarians earned $51,620, compared to supervisors/middle management who earned $60,000, and senior administrators who earned a median annual salary of $75,000. Academic librarians (especially those working in CARL institu-tions) earned the highest median incomes ($65,000), followed by school librarians ($60,000), special librarians ($58,000), and finally, public librarians ($55,000). Seventy-two percent of librarians felt they earned a “fair” sal-ary.
Earning a median income of $37,500 per year, paraprofessionals make about 63 cents for every dollar made by professional librarians. Though salary variations between sectors are less apparent among paraprofessionals than they are for professionals, paraprofessionals working in special libraries were the highest earners among this group, on average ($40,000). Salaries also vary little between paraprofessional position levels with library assistants, associates, and aides earning $35,240, library technicians earning $37,000, and management parapro-fessionals earning an average of $41,000 per year. Even fewer salary differences are observed among paraprofes-sionals by highest level of education; those with a high school diploma earned $36,000 per year compared to $38,000 among those with a university degree. Sixty-one percent of paraprofessionals felt they earned a “fair” salary.
Most libraries are able to offer a wide range of benefits to their librarians. The benefits most frequently offered in-clude retirement or pension plans and life or disability insurance, workers’ compensation, supplemental medical and dental plans. Overall, these benefits compare very favourably to those offered within Canadian workplaces in general. For example, only one-half of the labour force has employer-sponsored pension plans (Lowe, 2000), compared to 92% of librarians. Four in five professional librarians agreed that they receive “adequate” benefits.
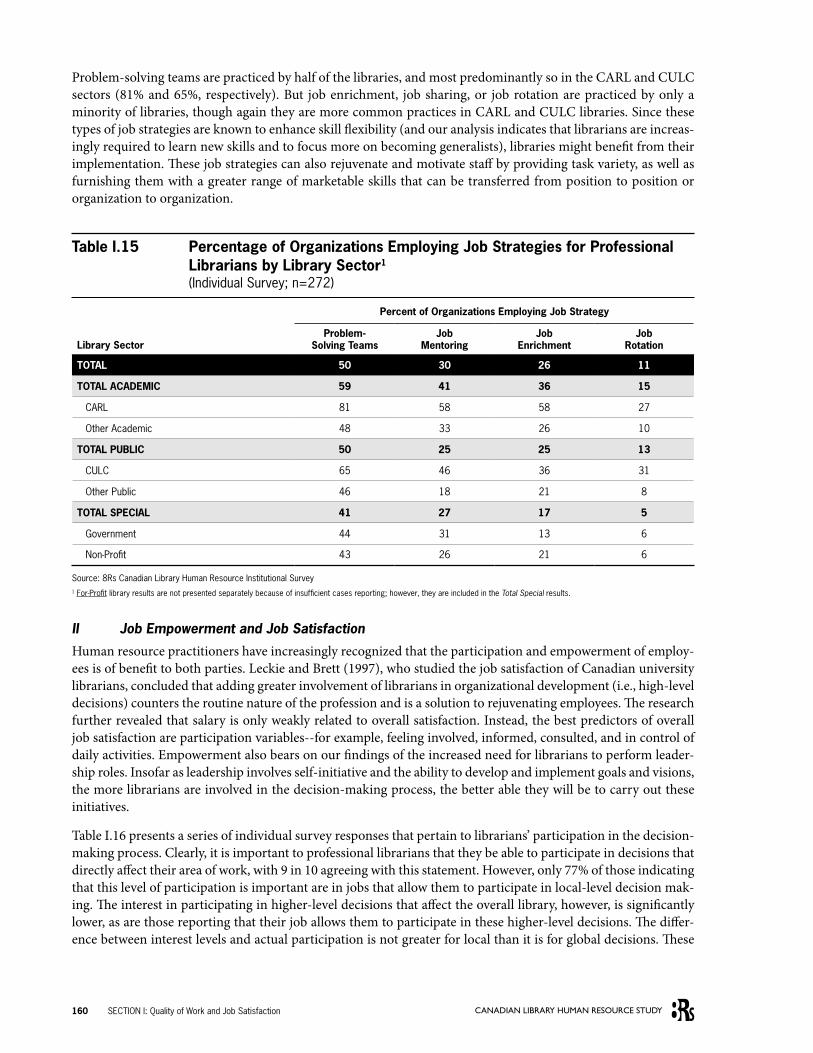
Intrinsic Benefits and Job SatisfactionCentral to contemporary management approaches are work reform schemes such as job enlargement, job enrich-ment, quality circles, and participative management that are said to result in mutual gains for employers and em-ployees in terms of increased productivity and job satisfaction, respectively. Problem-solving teams are practiced by half of the libraries, and most prevalently so in the CARL and CULC sectors (81% and 65%, respectively). But job enrichment, job sharing, or job rotation are practiced by only a minority of libraries, though again they are more common practices in CARL and CULC libraries.
It has been argued that adding greater involvement of librarians in organizational development counters the rou-tine nature of the profession and is a solution to rejuvenating employees. The 8Rs study revealed a closer match between librarians’ interest in participating in decisions and having a job that allows them to do so with respect to the overall library strategy than for decisions pertaining only to their own area of work. Disparities between inter-est and participation in decisions is greatest among the larger organizations, such as CARL and CULC libraries.
Individual survey results about workloads and stress were the least favourable of all intrinsic benefits analyzed in this study. Only two in five librarians indicated that their workloads are manageable and one-quarter agreed that they have little work-related stress. Considerably more (62%), but still not as many as we might hope, reported that they are provided with the opportunity to balance work and family/personal life in their jobs. The parapro-fessional results from our survey were slightly more positive, although still only half (53%) indicated that their workloads are manageable and even fewer (35%) that their job related stress is low.
Finally, a multivariate causal analysis of job satisfaction revealed that the two single most important contributing factors to job satisfaction for both professionals and paraprofessionals are that they are treated with respect by
8 CANADIAN LIBRARY HUMAN RESOURCE STUDY
their superiors and that they work in a job that allows them to grow and learn new skills. With regard to respectful treatment, these results are not surprising given that virtually all (98%) of the librarians and paraprofessionals in our study indicated that it is important to them that they are treated with respect by their superiors. Compara-tively, however, only 77% of librarians and 75% of paraprofessionals agreed that this respect is conferred by their superiors in their jobs.
Section J: Numerical Librarian Demand-Supply Match
Librarian Numerical Growth On the heels of a librarian staff contraction in the 1990s, our data showed a 2002 growth rate in the librarian workforce of 3.0 percentage points. And as we might expect, the two largest segments, CARL and CULC libraries, together accounted for the vast majority of growth (84%). Only government libraries experienced a contraction in their librarian workforce of 4.5 percent points in 2002.
Past and Future Numerical Librarian DemandThe results provide a clear indication that there has, and will continue to be, an increased demand for librarians. Three-quarters of all libraries in the institutional sample experienced, at least to some extent, an increased de-mand for more professional librarians in the past 5 years and 77% also indicated that their demand for librarians will continue to increase over the next 5 years. CARL libraries were the most likely to indicate such an increased future demand (96%) followed by CULC libraries (89%), while government libraries were the least likely to report an increased future demand for professional librarians (58%).
Match Between Supply and DemandFactoring in the number of MLIS graduates and the number of predicted retirements, we estimate that by 2009 the library system will be working with 98% of the current size of the librarian workforce. Using the same for-mula, however, by the year 2014 the workforce size will reduce to 89% of what it is currently. With the supply decreasing at the same time as demand increases, the long-term future situation for the Canadian library sector is one of a librarian shortage.
This conclusion is, however, provided with several caveats. First, our confidence in the short-term picture is much greater than it is for the long-term picture, simply because the chances that the influence of any one vari-able will change increases over time. Second, though we have strong evidence to suggest that libraries believe their demand for librarians will increase in the future, whether or not they have the financial resources to create these new positions is another matter altogether. With six in ten libraries citing “limited budgets” as a barrier to recruitment, it is not likely that most libraries will be in a position to create new positions just because they are needed. Rather, it may be that positions are restructured to accommodate increased demand. Third, the predicted future contraction of the librarian workforce does not depart significantly from what has already occurred in the 1990s. Estimates vary from a 12% contraction among Canadian ARL university libraries between 1994 and 1998 (Wilder, 2000) up to Statistics Canada estimates of 33% between 1991 and 2002. Our institutional survey results show that, under these prior conditions of contraction, moreover, most libraries appeared able to cope with re-ductions in their librarian workforce.
Because of the varying educational qualifications of library assistants, associates, and aides, we are not able to provide estimates of the number of new entrants into these occupational groups. With a known number of library technical schools and their related graduate information, however, projected future library technician supply can be calculated.
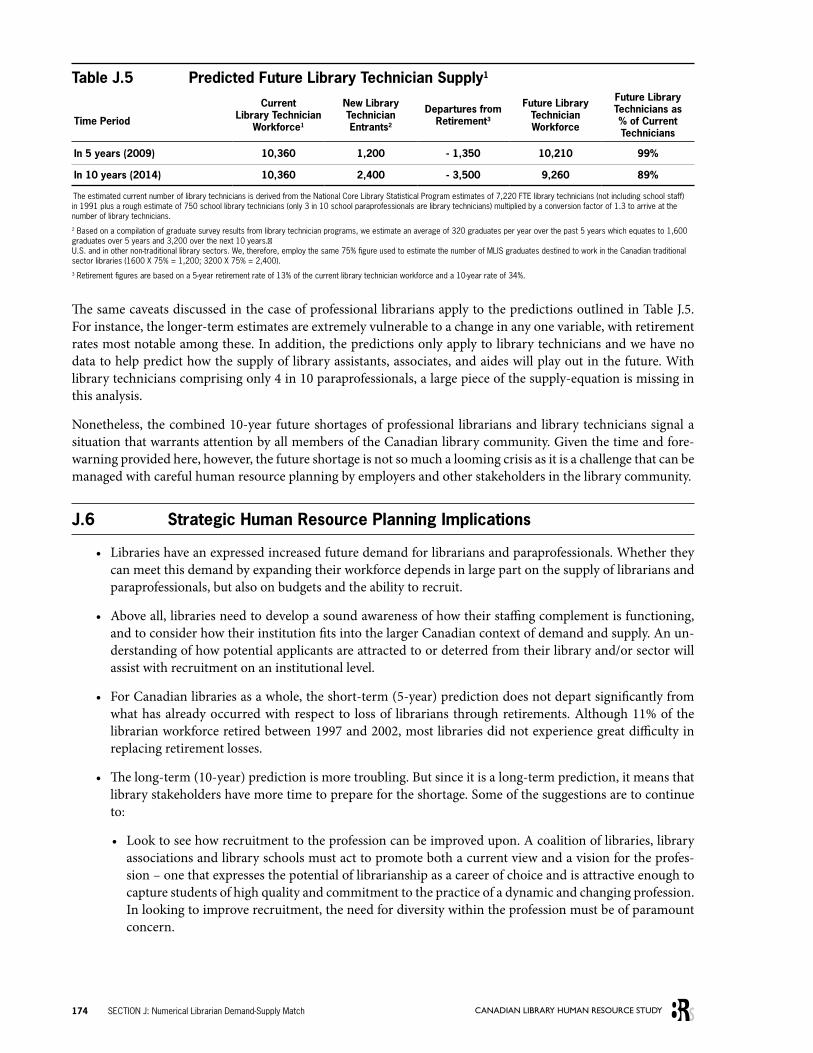
The predicted future library technician supply is remarkably similar to the future professional librarian supply. In both instances, the 5-year (2009) estimate is virtually the same as the current workforce, but the 10-year (2014) estimate is 89% of the current workforce. Once again, therefore, the short-term future picture does not depart significantly from what the library system is currently dealing. By 2014, however, the Canadian library sector is predicted to be facing a library technician shortage.
The Future of Human Resources in Canadian Libraries 9
Section K: Competency Demand-Supply Match
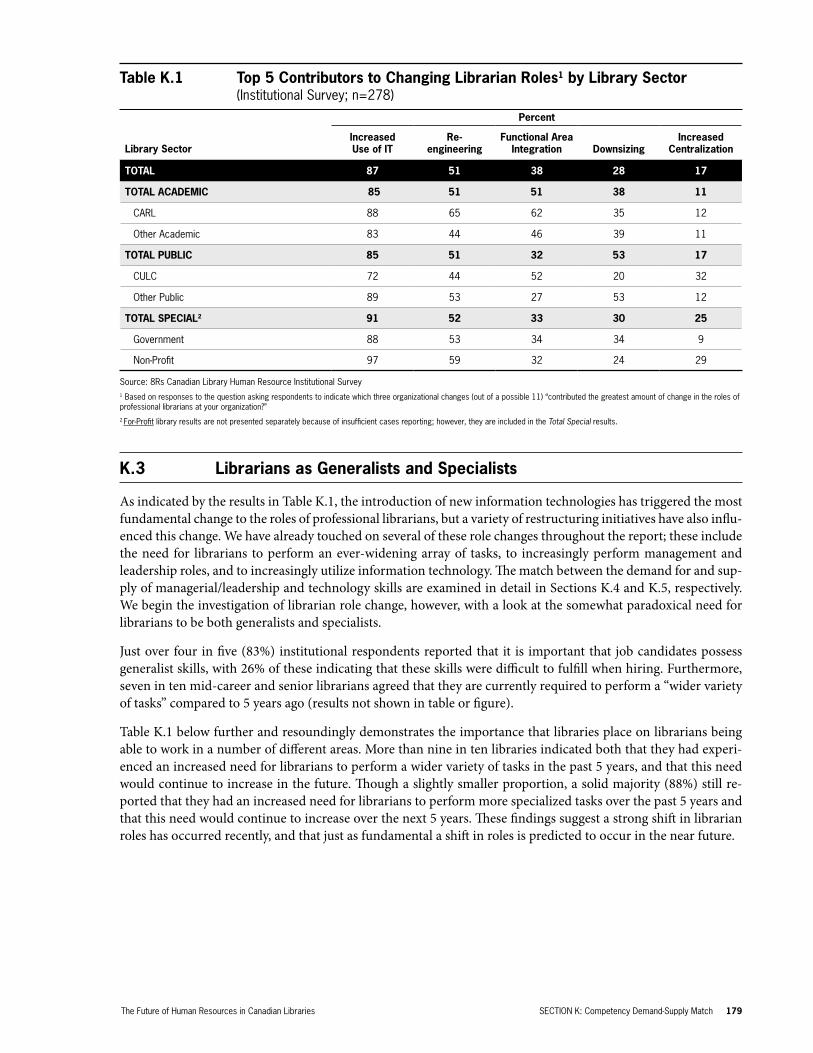
Drivers of Librarian Role ChangeWhen institutional respondents were asked to indicate which of 11 possible organizational changes contributed the most to shifting librarian roles, increased utilization of information technology clearly stands out as the most influential determinant for all library sectors (87%). Just over half (51%) of the sample also viewed re-engineering as a major contributor to role change, followed by functional area integration (38%). A smaller proportion indi-cated that downsizing (28%) or increased centralization (17%) had the greatest impact on librarian role change.
Past, Current, and Future Role Demand ChangeLibrarians are increasingly required to be generalists and specialists, as demonstrated in the following institu-tional and individual survey results:
• Just over four in five (83%) institutional respondents reported that it is important that job candidates pos-sess generalist skills, with 26% of these indicating that these skills were difficult to fulfill when hiring.
• Seven in ten mid-career and senior librarians agreed that they are currently required to perform a “wider variety of tasks” compared to 5 years ago.
• More than 9 in 10 libraries indicated both that they had experienced an increased need for librarians to perform “a wider variety of tasks” in the past 5 years and that this need would continue to increase in the next 5 years.
• A solid majority (88%) of libraries reported that they had an increased need for librarians to perform more specialized tasks over the past 5 years and that this need would continue to increase over the next 5 years.
Meeting the Management, Leadership, and Business Skill Demands of LibrariesOne of the most consistent and solid findings from this study is that librarians are increasingly required to assume managerial, business, and leadership roles. These findings include:
• Three in every five professional librarians work in management positions.
• 71% of library administrators reported management skills as an important competency to look for when hiring and 76% felt the same way about leadership potential.
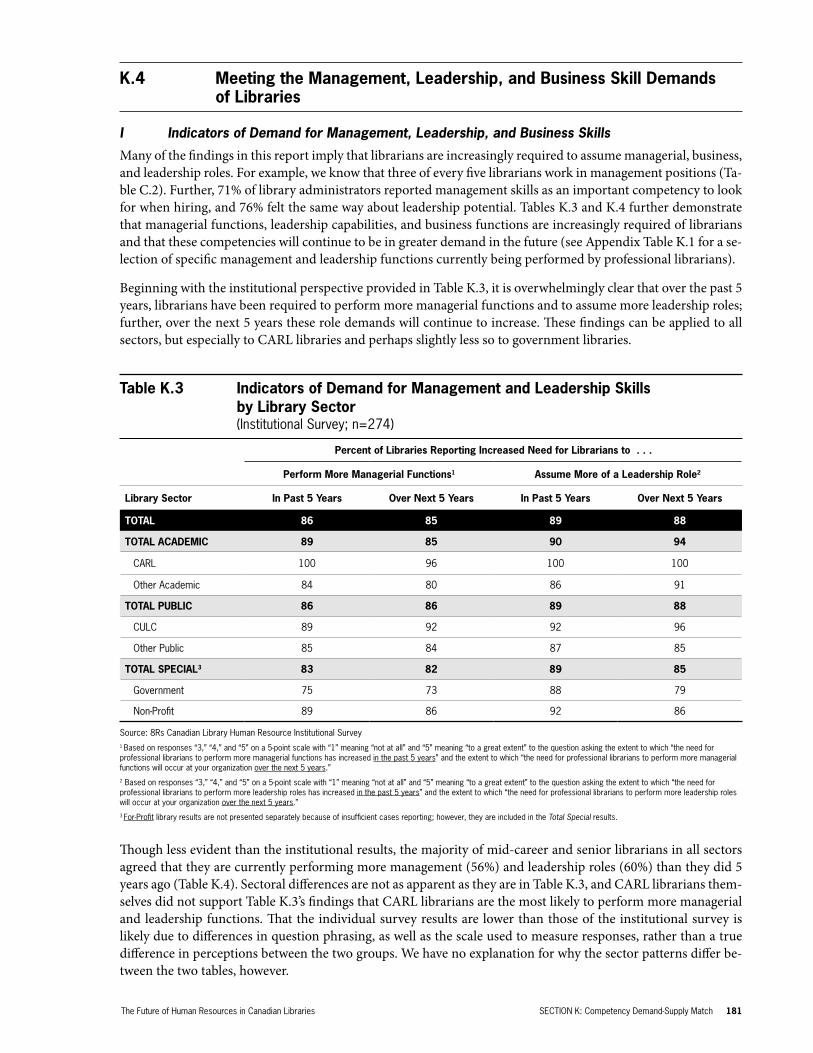
• 86% of library administrators indicated that there has been an increased need for librarians to perform more managerial functions in the past 5 years and 85% felt this need would continue to increase over the next 5 years.
• 89% of library administrators indicated that there has been an increased need for librarians to perform more leadership roles in the past 5 years and 88% felt this need would continue to increase over the next 5 years.
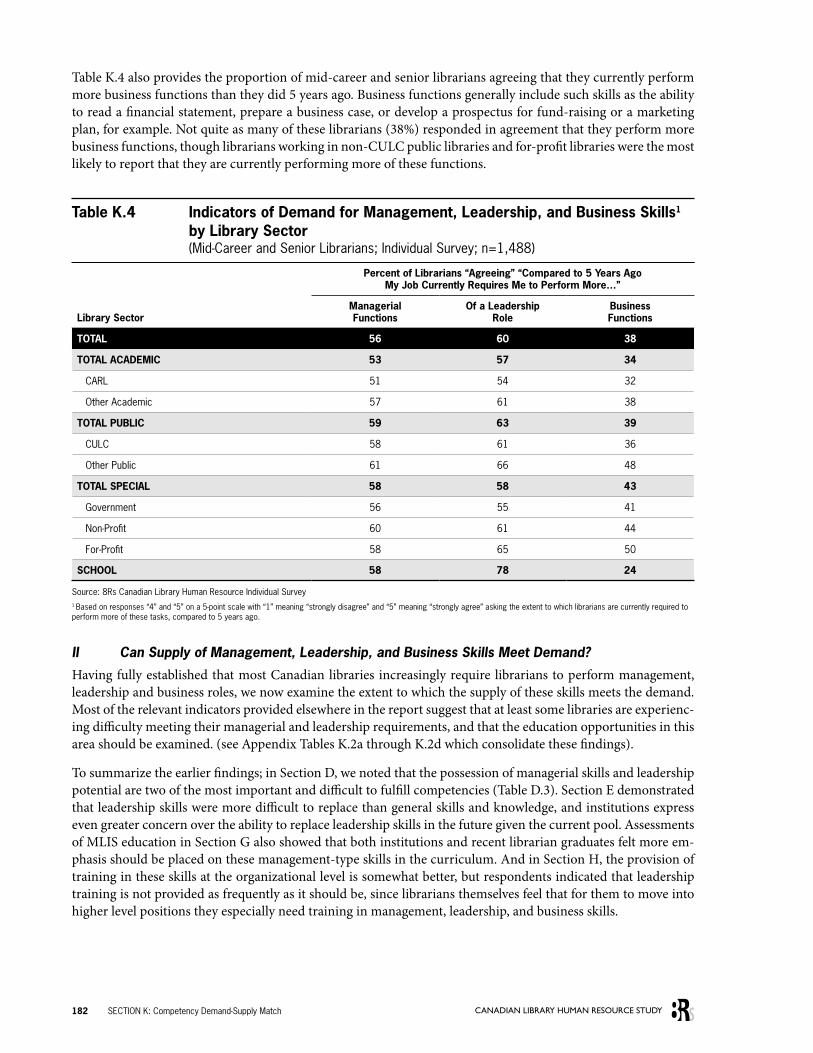
• 56% of mid-career and senior librarians in all sectors agreed that compared to 5 years ago, they are cur-rently performing more management functions, 60% felt they are now assuming more a leadership role, and 38% felt they are now performing more business functions.
Most of the relevant indicators suggest that at least some libraries are experiencing difficulty meeting their mana-gerial requirements.
To summarize:
• The possession of managerial skills and leadership potential are two of the most important and difficult to fulfill competencies.
10 CANADIAN LIBRARY HUMAN RESOURCE STUDY
• When senior librarians retired, leadership skills were more difficult to replace than general skills and knowledge, and even greater concern is expressed over the ability to replace leadership skills in the fu-ture.
• Assessments of MLIS education showed that both institutions and recent librarian graduates felt there is a need to place more emphasis on management-type skills in the curriculum.
• The provision of training in these skills at the organizational level is a bit better, but there is an indication that leadership training is perhaps not provided as frequently as it could be. Moreover, librarians them-selves feel that for them to move into higher-level positions they especially need training in management, leadership, and business skills.
Further analyses of the interest among librarians in performing these roles and in participating in management, leadership, and business training suggest that the demand-supply match in these skills is better for leadership and business skills than it is for managing. Though the current and predicted future demand are high for librarians to perform managerial functions and though six in ten librarians are currently working as managers/supervisors, only 44% of librarians indicated that it is important that they are able to manage a service or department, and even fewer (36%), provided the same response for supervising others. But, there are indications that the future situation will be more positive. Most recent librarian entrants do not feel that it is important for them to manage or supervise at this point in their short careers, but they are interested in participating in management skills train-ing and have expectations to perform managerial roles in the future.
Our rating of the demand-supply match for leadership skills is somewhat more promising. Again, juxtaposed against a very high current and predicted future demand, the interest among the majority of librarians at all stages of their careers in assuming leadership roles is apparent. Sixty-two percent expressed an interest in performing a leadership role in general, 64% an interest in the specific role of motivating others, and 74% in seeking out new project opportunities (74%). That nearly half of library administrators are concerned about replacing the lost leadership qualities of retiring professionals in the future is, however, a finding that tempers this rather optimistic conclusion.
Though we do not have as many indicators for business skills, the data we have suggest that the demand for business skills is not quite as strong as it is for management and leadership skills and abilities. That only 45% of librarians expressed an interest in business skills training might reflect a relatively low demand for these skills since significantly smaller proportions of librarians reported that, in the past 5 years, they had increased their performance of business functions (38%) than they did in their management functions (56%) and leadership roles (60%).
Meeting the Demands of Information TechnologyAs suggested by the following findings, the demand for information technology skills in libraries is currently high and constantly increasing:
• Virtually all (95%) institutional respondents reported that they had increased their use of information technology in the past 5 years.
• Virtually all (94%) of institutional respondents reported that candidates’ technology skills were an impor-tant consideration when recruiting librarians.
• Of all types of librarians, institutional respondents indicated that IT librarians require the most amount of training.
• Just over 7 in 10 librarians indicated that they had opportunities to use information technology.
• Just over half of mid-career and senior librarians indicated that they are required to perform more high technology tasks now than they did 5 years ago.
The Future of Human Resources in Canadian Libraries 11
The supply of technology indicators suggest a better demand-supply match for information technology skills than was found for management and leadership. These are:
• Compared to the provision of management skills in MLIS programs, recent librarian entrants were some-what more likely to agree that they were provided with “the information technology skills required to ef-fectively perform my current job” (46% compared to 25%).
• While 84% of librarians participated in IT training, only 51% had done so with respect to management training, and even fewer (28%) participated in leadership training.
• Only one-third of institutional respondents reported that information technology skills were difficult to find in librarian candidates when hiring.
• 70% of librarians felt that it was important to them that they be able to use IT in their jobs and 62% were interested in participating in IT training.
Changing Roles of Librarian and Paraprofessional StaffResults from the 8Rs surveys suggest that paraprofessionals have and continue to take on the roles and functions of professionals. More than three-quarters of institutions reported both that the need for paraprofessionals to perform tasks once done by professional librarians has increased in the past 5 years (78%), and that this need will continue over the next 5 years (77%).
A comparison of the functions performed by professional and paraprofessional staff shows that both are perform-ing duties within the realm of public services and information technology. Otherwise, paraprofessionals are more likely to be performing children’s programming and all types of technical and bibliographic services. Conversely, professional librarians are more likely to be working on collection development, performing liaison activities and managerial functions and to be participating in professional development.
Effects of Changing Roles on Work Levels and Job AttitudesThe dramatic changes in the work of librarians and paraprofessionals in recent years has resulted in higher stress levels reported by many staff members. Results of a multivariate causal analysis pinpoint four major contributors to increased stress levels among mid-career and senior librarians in our sample, including:
1. The requirement to work harder compared to 5 years ago.
2. The requirement to perform more difficult tasks compared to 5 years ago.
3. The requirement to perform a wider variety of tasks compared to 5 years ago.
4. The requirement to perform more managerial functions compared to 5 years ago.
Another multivariate analysis revealed that some of the same contributors to stress noted above also lead to more positive elements of the librarian job. Specifically, the performance of a wider variety of tasks and more difficult tasks (as well as the increased performance of leadership roles) were found to be significantly and positively re-lated to jobs that are more enjoyable, rewarding, interesting, and challenging.
The same causal analysis was conducted for mid-career and senior paraprofessional staff and revealed that only working harder and performing more high-technology tasks contributed to increasing stress levels. Increasing skill requirements of their jobs and a more varied set of tasks, on the other hand, render their jobs more interest-ing, enjoyable and rewarding.
Section L: Report Summary of Major Findings
Perhaps one of the most recurring and reliable themes uncovered in this study is that of the need for librarians to perform managerial functions and to assume leadership roles. In Section K, the shifting demand towards manag-ing was clearly demonstrated, as was the need for training in these areas and as was the lack of interest among
12 CANADIAN LIBRARY HUMAN RESOURCE STUDY
librarians in performing some of these roles. In addition, the continuing shift in the roles of librarians has impli-cations for retirement, recruitment, retention, education and training, and job satisfaction.
First, with two in five current librarians and over three in ten current paraprofessionals predicted to retire by 2014, the library community would be well-advised to begin investigating their institutional demographics, and planning for the future (for example, by restructuring staff positions or grooming current staff to assume the managerial and leadership roles of departing senior staff). The overall well-being of the library in the future is contingent upon the continuous cultivation of both managing and leading competencies through in-house and external training. Though the organizational longevity of librarians limits promotional opportunities, it confers the added benefit of long-term management and leadership grooming possibilities that can begin with new re-cruits. The results of this study also revealed that the current workforce is open to assuming leadership roles and, indeed, tend to find these roles to be interesting, challenging, and rewarding. On the other hand, those less mo-tivated to engage in managing and supervising may benefit from knowing that managers, and especially senior administrators, are the most satisfied with their jobs.
Third, an increased demand for managers and leaders has implications for recruitment of individuals to the profession. Efforts to attract individuals to the profession should not only highlight the literacy, learning, and public service values of librarianship, but also the fact that most librarian jobs will eventually involve some form of supervising and managing.
Fourth, on the whole, the recruitment situation in Canadian libraries is not one that can be clearly labeled as a “problem” situation. Our data demonstrate, however, that human resource administrators should not ignore candidates’ prior experience, training, and education in managing and leading nor their potential and interest in performing these roles.
Finally, the need for library schools to place a greater curriculum emphasis on managing, business, and leadership skills was clearly documented in Section G. Furthermore, inasmuch as library education is the first point of entry into the profession and therefore involves the early socialization of librarians into the values, intellectual ground-ing, and activities of librarianship, it is also implied by the findings that the entire community would benefit from the inclusion of the reality of “librarian as manager” into this socialization process. Increased opportunities for library students to participate in practicum and internship programs would also allow future librarians to witness the realities of the “librarian as manager” role firsthand.
In conclusion, it is our hope that the many human resource initiatives implied by the results of this study will be actively exploited by the various library community stakeholders. We further encourage the community to con-tinue to build a solid understanding of the nature of its work and its people.
The Future of Human Resources in Canadian Libraries 13
Consolidation of Strategic Human Resource Planning
Implications
At the end of every section in this report are a set of bullets representing the human resource planning implica-tions arising from the results in that section. The following is a consolidation of these implications.
Section C: Workplace and Demographic Characteristics of Canadian Library Personnel
• Sixty-two percent of librarians are working in a managerial function, indicating a trend of employing librarians as managers and the shifting some of librarians’ traditional job responsibilities to non-MLIS staff.
• A relatively high proportion of paraprofessionals working in part-time or temporary positions is a point of notice for library organizations. Taking a long view, which incorporates an understanding of anticipated retirement rates, institutions are advised to think about how they wish to configure the work status of their future workforce (understanding that there are other constraints, such as financial resources, collective agreements, etc.)
• While library work is female-dominated, we see that relatively higher proportions of senior administra-tors are male. This supports the premise that (as with many other female-dominated professions) although women have made inroads into supervisory and middle management positions, men are still more likely to become senior administrators; institutions should ensure that equal opportunities in the upper levels of management and leadership are presented to women in the workplace.
• Visible minorities and Aboriginal staff are under-represented across all types of libraries. The Canadian Aboriginal population has been identified as an untapped source of labour that will become increasingly
14 CANADIAN LIBRARY HUMAN RESOURCE STUDY
important in the future (Lamontagne, 2001). Institutions need to consider diversity programs if they do not already have them, and should explore recruitment strategies that actively attract minorities to their libraries. Institutions working with collective agreements should also examine how they promote or pro-hibit diversification of the workforce. This need to diversify the workforce also has implications for educa-tors, in terms of how they promote recruitment to MLIS and library technician programs. Associations, too, should consider a role in promoting the profession outside the predominantly Caucasian demograph-ics.
• Few library policies recognizing the professional credentials of non-North American graduates seems to be resulting in the hiring of few immigrant librarians. A greater awareness and understanding of this is necessary within institutions, as immigrants increasingly comprise a larger share of the Canadian labour force (HRDC, 2002). Library associations need to consider how they can support institutions in assessing and recognizing degree and accreditation equivalencies.
• School librarians tend to be older than other groups of librarians, and may be first to retire; the question is whether positions will continue to be defined as librarian positions or whether schools will sustain a trend of replacing librarians with library technicians and other library workers. Decision-makers must be reminded of the long-term implications of this replacement, as investment in school libraries and in teacher-librarian positions are related to better student achievement, improved literacy and reading skills, and enhanced readiness to success in the post-secondary environment (Haycock, 2003).
Section D: Recruitment
• Current librarians tend to say that they chose the field because they thought they would like what the work entailed (though they do not state what these early assumptions were), and that they were interested in serving the public and/or the public good, as well as because of their value of literacy and learning. While these demonstrate a clear understanding of the core values of librarianship, they do not necessarily include the real functions of the job. Insofar as recruitment to the librarian profession is hampered by mispercep-tions about the work content of this profession, marketing directives should include an educational com-ponent that highlights the actual job functions and levels of responsibility held by librarians.
• Since structural barriers are the main reason why paraprofessionals do not pursue MLIS education (though one-third are interested), access to library education needs to be further examined.
• Library schools, MLIS students, HR administrators, and organizational trainers should also be made aware of libraries’ unmet needs for librarians to be equipped to perform management and leadership roles and to be able to respond flexibly to change.
• Since recruitment need, activity, and level of difficulty widely range between sectors and geographic re-gions of the country, strategies should also be sector and geographically specific.
• For example, while CARL libraries as a whole do not seemingly need to make major changes to their recruitment strategies, CULC libraries are advised to consider marketing more rigorously to MLIS students (and perhaps to library school professors) about the benefits of working in public libraries. It is also important that they provide experience through practicum programs, internships, or co-op programs. The extent to which MLIS programs focus on librarianship within the public sector should also be examined.
• Rural libraries (which are predominantly public libraries) should focus their efforts upon promoting the desirable lifestyle of smaller communities and the opportunities for staff to use a wider range of skills. Knowing that retirements are coming up, rural libraries might foster a relationship with library schools and library technician programs that allows for practicum and other opportunities in their libraries. There is also the possibility that rural and remote libraries might consider “growing their own” and working with local schools to identify career opportunities in libraries for local community members.
The Future of Human Resources in Canadian Libraries 15
• The continued use of temporary jobs for new librarian entrants, while better than the alternative of not offering a job at all, is a pattern that should be closely watched. The possible long-term negative effects on staff who continually work in a contract positions include the erosion of loyalty and trust and dissatisfac-tion; most temporary jobs do not engender a sense of being part of the organization, garnering neither training opportunities nor other employer benefits that are provided to others in the workplace.
• Since 41% of recent professional librarian entrants stated they applied to a U.S. job due to a perceived scarcity of Canadian positions, it appears that generally, Canadian librarians would tend to stay in Canada if the initial jobs were here (and perhaps in a permanent capacity). A much smaller proportion of respon-dents worked internationally, and then returned to Canada (primarily for personal reasons); this suggests that job market factors are not the only influence on international work. It also suggests that if there are an adequate number of good jobs for librarians in Canada, they may be less likely to leave in the first in-stance.
• The question remains as to how many institutions have reconsidered the MLIS hiring requirement for positions traditionally held by librarians. The Association of Research Libraries states that about one-third of North American research libraries do not require the MLIS (Blixrud, 2000). If institutions are recon-sidering this base credential for a greater number of positions, this could have a greater impact on recruit-ment.
Section E: Retirement
• Age and rate of retirement of the librarian workforce is an exceedingly complex planning issue for librar-ies.
• It is influenced at the macro level by a federally-regulated pension plan and age-based social benefits with the issue of mandatory retirement still an outstanding question in many jurisdictions. Human re-source managers would be advised to be very aware of age demographics and years of service of library staff. Most staff contribute to local pension schemes where entitlements are normally based upon an age/service factor for “full” pension. Attainment of this factor will also undoubtedly influence indi-vidual decisions to retire.
• It is vulnerable to local institutional policies that promote or delay retirements.
• It is very much a matter of individual choice; many retirement decisions could be based upon personal factors that are not predictable in planning. The 8Rs survey data suggest a number of critical factors that lead to great uncertainty for library organizations.
• Individuals’ predictions of retirement age seem to indicate that anticipated age of retirement is increas-ing rather than decreasing and that most individuals will be influenced by monetary variables, such as performance of investments and pension funds, which are very dynamic as well as differentially valued by individuals. This is substantiated by a recent poll of the Canadian labour force showing that the aver-age age of retirement is trending upwards (Canadian Labour Congress, 2004).
• Most senior librarians (those who would be nearing retirement age) do not feel strongly either way about their age of retirement.
• Paraprofessional retirement rates will not be quite as high as librarian retirement rates, but will be happening within the same timeframe, thus compounding the number and impact of retirements that library organizations are dealing with.
• Libraries should develop and support communication and planning processes that allow individuals to discuss their retirement planning and its attendant impact upon the library organization as openly as they feel able to do so. This is especially critical in instances where retirement is no longer mandatory at age 65.
16 CANADIAN LIBRARY HUMAN RESOURCE STUDY
• Currently, only 10% of libraries have a succession plan. Knowing that the bulk of most institutions’ retire-ments (librarians and paraprofessionals) will take place from 2009-2014, organizations could consider undertaking a 10-year succession management process for human resources designed to anticipate and focus effort upon managing the effects of retirement. Succession planning and management will be com-plex for many library organizations. Libraries must develop the “know how” and commit the resources to do continuous planning and management. Some of the key considerations could include:
• Required competencies within libraries and within the individual institution (for both professional and paraprofessional positions).
• Potential for restructuring positions to fulfill institutional needs and employing new competencies, for both professional and paraprofessional positions.
• Recruitment incentives and marketing (both to the institution, and to library work in general) in light of the implied increased competition that will occur throughout the library community as a result of retirements. This becomes more urgent for institutions such as CULC libraries, who have stated that they face greater problems filling human resource needs both from within and beyond their current workforce pool.
• Library associations will be wise to think in similar terms, as retirements will impact membership, and the resultant change in demographics will undoubtedly reflect different expectations of the role of associa-tions.
• Retirees take with them knowledge and skills that have been acquired through years of experience. Librar-ies will have to judge how critical this loss will be and how to ameliorate the effects. Succession planning will have to consider graduated retirement plans, mentorship programs, internships and other schemes that allow transfer of essential knowledge and skills.
• Grooming efforts for leadership/management should be taking place at all levels of the library organiza-tion, including new entrants (both professionals and paraprofessionals). Again, library associations must think in similar terms.
• Some sectors in particular (CARL and school libraries) are predicted to experience retirement rates above the norm. This must be communicated to decision-makers and funders, as it will place a large burden upon organizations to respond strategically, whether through recruitment or restructuring.
Section F: Retention
• Turnover of staff is not a problem for most libraries. Factors contributing to retention include positive work relationships and challenging work environments, loyalty to the organization and its users, support and recognition for what librarians contribute, support for professional development and growth, more-than-adequate salaries and benefits, personal ties to the community, and location and reputation of the organization.
• As libraries tend to retain staff members for large portions of their careers, recruitment decisions are criti-cal. Institutions need to set selection criteria that assess potential and ability to grow with the needs of the organization. New recruits need to understand how their career aspirations “match” the needs of the institution and assess whether the organization is a good fit for them.
• Lack of turnover is not a concern except insofar as it has affected upward mobility or promotion oppor-tunities for librarians. Libraries can encourage employee growth by providing challenging assignments and additional professional development throughout their careers. If this is not immediately possible, individuals wishing to expand their skill sets and professional competencies can also look to professional and other associations for opportunities to build skill sets while making a professional contribution.
The Future of Human Resources in Canadian Libraries 17
• Conditions exist for many new librarians to move into management positions early in their careers. Most librarians are interested in and feel qualified to move into more responsible and more senior positions. Upon recruitment, individuals need to be apprised of the management needs of the organization, and library organizations can support them through appropriate training, development and mentorship. Op-portunities to experience and practice management tasks should be made available to new recruits so that knowledge and skill levels can be assessed early and appropriate career planning done. Library schools and library associations similarly have a role to play in ensuring that education and development opportunities are offered from first career choice and throughout the career span.
• Collective agreements and internal policies (as well as internal organizational and work structures) can impede or promote progression and professional growth. Institutions would be well-advised to examine these structures.
• Libraries must develop and support a culture where every individual is encouraged to play a leadership role in whatever position they hold. Institutions need to communicate what leadership looks like, what is expected of staff, and how staff will be recognized within their organization.
Section G: Education
• Few librarians hold a library technician degree, suggesting that in the past, paraprofessionals seldom chose to pursue the MLIS. At the same time, in section D we saw that one-third of paraprofessionals were inter-ested in pursuing an MLIS, but half of these faced structural barriers. These two results present a situation in which movement from paraprofessional to professional status could be difficult within the field. The library profession needs to question how these difficulties might be ameliorated, and how recruitment of this interested group might be promoted. Individual institutions need to assess how their needs can be met by encouraging paraprofessional members of staff to acquire a professional degree.
• Institutional satisfaction with MLIS education is sector-dependent, showing that curricula may be less easily aligned with jobs in different sectors. CULC libraries’ dissatisfaction with the MLIS degree as a basic competency warrants further study to identify how that workplace is significantly different. CULC admin-istrators and library educators should consider discussing the gaps between MLIS education and CULC libraries’ needs; while MLIS programs have other stakeholders and requirements and cannot tailor their entire curricula to the needs of particular sector employers, programs such as public library internships or practicum placements, co-op programs, linked assignments to public library practice, and more discus-sion of the difference between sectors may be useful here.
• The assessments of recent graduates should not be overlooked in evaluating the applicability of library schools’ curricula, which is generally less favourable than those of the employer. That the sector differences in evaluation from the institutional perspective do not parallel the sector patterns found among recent graduates suggests that the viewpoints of both stakeholders are important to gather when conducting a comprehensive evaluation of library schools. Additionally, new librarians and employers would ben-efit from learning about the evaluative viewpoints of each, thereby furthering their understanding of the other’s expectations in the workplace.
• An important exception to the divergent assessments of library school education between institutions and recent librarian entrants is the consensus of an increased need to incorporate management, leadership, and business training into the curriculum. The implications of this finding for library school curricula are clear.
• While libraries believe they have little or no input into MLIS education, we know there are different kinds of partnerships that can provide practical experience (e.g., practicum placements, co-op programs, in-ternships, assignments linked to the “real world” of library work). Educators and employers may consider working together to build these opportunities. Also, while librarians have historically to come to librarian-ship as a second or third career, recent statistics from the Association of Library and Information Science
18 CANADIAN LIBRARY HUMAN RESOURCE STUDY
Education (ALISE) suggest that the average age of MLIS students is decreasing (from 34 years of age in 2001 to 30 years of age in 2003). Insofar as this means that contemporary students have less experience in the general workforce, further importance is placed on practicum programs or other forms of direct experience as part of the degree.
• Technicians show greater levels of satisfaction with their base education than do professional librarians which may be due, in part, to the fact that college programs have the ability to change their course offerings on a much more timely basis. Still, technicians are less likely to learn leadership and management skills through their programs. For technician positions that require management competencies (27% of para-professionals work in supervisory or management positions), employers should ensure adequate training is provided.
Section H: Continuing Education
• Library administrators report significant proportions of librarians at all levels and across various types of positions continue to require significant amounts of training for their jobs. While new recruits require the most training, a significant minority of mid-career and senior librarians do as well. This suggests that in-dividuals and institutions must commit to continuing education as an ongoing necessity. Institutions will most likely take up the financial costs of training and must plan for this budgetary commitment. Librar-ians must take the personal responsibility for participation and return of the investment in training to the organization.
• At the same time, just over half of new professional librarians surveyed stated that there are adequate op-portunities for training at their institutions. This suggests some potentially serious gaps in these librarians’ opportunities to gain the knowledge and skills necessary for their work.
• The largest gaps between institutional need and new librarians’ perceptions of training opportunities fall within CULC libraries. At the same time, CULC libraries are also most likely to say that budgets prevent them from offering needed training. CULC libraries are therefore in a situation in which their need for staff training is high, but their ability to offer training appears to be low. CULC libraries need to investigate their institutional barriers to training and determine ways to overcome these barriers, perhaps by working in conjunction with other organizations (associations, partnering with other libraries, etc.).
• Of the institutional training offered to librarians, most frequently offered was that of job skills and technol-ogy training, with about half receiving customer skills or management training. However, one-third un-dertook leadership training. While leadership is a more difficult competency to “teach,” institutions’ stated needs for leadership abilities suggests that this is an area that warrants greater attention from individuals and institutions. Further, librarians interested in moving into higher positions state that leadership and management training are necessary for them to feel confident in performing these new roles.
• While 80% of librarians agreed that they have sufficient education, training and experience to perform their jobs effectively, when asked about the impact of training on their jobs, somewhat lower levels agreed that professional development allowed them to perform their jobs well. Also, relatively few institutions had formal structures either for determining what training is needed or for evaluating that training. Libraries and library staff should both question the return on investment from training activities and how this can be improved through training outcomes that serve the needs of both the individual and the institution. This return will assume even greater importance as increased retirements and recruitment occurs.
• While a very small proportion of librarians participated in the NEL institute, they rated it as having a higher impact on job performance than other areas of training. Considering that leadership is a significant training need throughout Canadian libraries, more “leadership institute” models may be effective.
• Paraprofessionals overall are less satisfied with the training opportunities offered to them. Equal propor-tions of librarians and paraprofessionals receive technology skills or customer service training, but far
The Future of Human Resources in Canadian Libraries 19
fewer paraprofessionals than librarians receive leadership or management training. Leadership in particu-lar is a competency that should be held by staff throughout the organization.
• Most libraries believe that library associations should play a training role. While they suggested that “gen-eral training” be provided by associations, respondents did not define this area any further. Associations would be advised to work with their memberships and other stakeholders in order to determine specifi-cally what kinds of training is in demand for their sector/region, if they are to build upon their professional development programs.
Section I: Quality of Work and Job Satisfaction
• Job satisfaction for both librarians and paraprofessionals is fairly high. For librarians, this satisfaction is slightly higher for recent entrants and senior librarians than for mid-career librarians. Across occupational levels, overall job satisfaction for all library staff tends to grow slightly as occupational levels increase. Still, the overall measure of job satisfaction and the many job satisfaction sub-indicators examined in this sec-tion suggest a very positive rating of the quality of work offered within Canadian libraries. This conclusion might be used as a promotional element to help attract individuals to the profession.
• Salary satisfaction levels, however, are a slightly different story. While 72% of all librarians agree that they earn a fair salary, non-management public librarians are least likely to be satisfied, with only 55% agree-ing their salary is fair. Overall, paraprofessionals are less satisfied with their salaries (61%) than librarians. At the same time, the majority of paraprofessionals have high levels of education, with 50% possessing a university degree. And, we have noted that roles between librarians and paraprofessionals have been shift-ing within the workplace. When reviewing salary scales, administrators should consider both educational credentials and shifting roles.
• While salaries should be linked to both educational credentials and position responsibilities, if libraries’ ability to pay higher salaries is circumscribed by budget limitations, they should examine the intrinsic benefits within the workplace and see how these can help offset lower salaries.
• Library paraprofessionals working in schools have much lower satisfaction levels with salaries as com-pared to school librarians. As the school library system attempts to survive the impact of cuts, school administrators should be very aware of not only the shrinking component of librarians in school libraries, but also the low satisfaction level of library technician staff (who may be taking greater responsibility for the library at a lower salary).
• While library staff empowerment overall does not appear to be a problem, it is higher for librarians than it is for paraprofessional staff. Again, considering the education levels of paraprofessionals and their chang-ing roles, libraries should examine how local and global decisions are made in the workplace, and endea-vour to involve staff throughout the organization, where feasible.
• Library administrators need to carefully watch both the workload and the job stress levels of their staff which appear to be increasing for both professionals and paraprofessionals.
• Key contributors to job satisfaction for library staff are:
• Respect from supervisors
• Desire to grow and learn new skills
These are congruent with library institutional needs to continue to innovate as they respond to changing user demands and new technologies. In order to build healthy workplaces, senior managers need to understand where their staff are both satisfied and dissatisfied, and provide opportunities to staff throughout the organizational hi-erarchy, while clearly communicating the limitations within which the institution must function (such as limited budgets, collective agreements, etc.).
20 CANADIAN LIBRARY HUMAN RESOURCE STUDY
Section J: Numerical Librarian Demand-Supply Match
• Libraries have an expressed increased future demand for librarians and paraprofessionals. Whether they can meet this demand by expanding their workforce depends in large part on the supply of librarians, but also on budgets and the ability to recruit.
• Above all, libraries need to develop a sound awareness of how their staffing complement is functioning, and to consider how their institution fits into the larger Canadian context of demand and supply. Admin-istrators’ and managers’ understanding of how potential applicants are attracted to or deterred from their library and/or sector will assist with recruitment on an institutional level.
• For Canadian libraries as a whole, the short-term (5-year) prediction does not depart significantly from what has already occurred with respect to loss of librarians through retirements. Although 11% of the librarian workforce retired between 1997 and 2002, most libraries did not experience great difficulty in replacing retirement losses.
• The long-term (10-year) prediction is more troubling. But since it is a long-term prediction, it means that library stakeholders have more time to prepare for the shortage. Some of the suggestions are to continue to:
• Look to see how recruitment to the profession can be improved upon. A coalition of libraries, library associations and library schools must act to promote both a current view and a vision for the profes-sion--one that expresses the potential of librarianship as a career of choice and is attractive enough to capture students of high quality and commitment to the practice of a dynamic and changing profession. In looking to improve recruitment, the need for diversity within the profession must be of paramount concern.
• Consider developing recruitment strategies for paraprofessional staff, with the understanding that de-mand for these workers will continue to grow at a similar rate to that of librarians, and that they will be retiring in similar numbers. This can be a point of potential collaboration for librarian and library technician associations, educators, and individuals.
• Look at the current paraprofessional corps as a possible pool of future librarians. This is not only a matter of encouraging paraprofessional staff to consider a library degree but also of working to reduce the identified barriers to obtaining the MLIS degree. Libraries, library associations and library schools need to work in partnership to develop and promote a model of professional education that is both of high quality and easily accessible. On-line programming and distance education programs are obvious directions to explore. Financial support, whether through scholarships and bursaries or “earn as you learn” employer-funded incentives, will be critical.
• Look at increasing the number of spaces in library schools (both MLIS and library technician programs), or increasing the number of schools themselves. This will involve intensive lobbying of post-secondary institutions and competition for government funding. Again, libraries and library associations must act in coalition with library schools to present the case for the profession.
• Look at immigrants as possible pool of future librarians. This speaks to the question of diversity in libraries, but also to how libraries will be prepared to assess and recognize library credentials from other countries. Library associations must also play a role in both the assessment of credentials and by ascertaining how they might fill any identified educational “gaps.” Similarly, library schools could play a role in appropriate educational upgrading.
• Look at defining roles for “other” professionals within libraries. Many libraries now utilize the skills of other professionals, whether accountants, human resource professionals or training officers. These oth-er professional groups need to see libraries as a desirable environment for exercising their professional skills and abilities. As noted, management skills are necessary competencies for librarians. However,
The Future of Human Resources in Canadian Libraries 21
other professionals can take complementary roles in libraries, adding to the depth of expertise avail-able.
• In recognizing that the creation of new professional librarian positions is not always possible, look at reengineering processes and functions to ensure that “meaningless” work is eliminated and all library staff are employing their education and skills set at appropriate levels. Staff should be assured that they will be able to employ their skills and abilities to the fullest possible extent.
• Constraints of budget and size will always exist. Therefore, libraries should also look to sharing of staffing resources through consortia and other local arrangements where two or more libraries might realize benefits and share costs. Sharing of resources has been the hallmark of the library profession for many years; the thinking needs to extend to the sharing of human resources--whether one webmaster for a college/university library partnership, one children’s literature specialist for two regional library systems, or one training officer for a consortium of libraries.
Section K: Competency Demand-Supply Match
• Role change will continue to take place in libraries. Institutions need to carefully plan how they will re-structure their staffing complements as retirements occur. The first step is to define needed competencies and determine what mix of staff will meet the present and (insofar as possible) future needs of the orga-nization. However, we can say overall that the ability for staff to adapt flexibly to change will clearly be a necessary competency throughout Canadian libraries.
• Libraries need to cultivate librarians’ management, leadership, and in some instances, business skills. In-terest in and potential for performing management and leadership roles could be a factor in recruitment of new librarians and grooming needs to begin shortly after recruitment, so that potential can be assessed and appropriately directed.
• Libraries’ emphasis on leadership and management also have implications for library education, with re-spect to both recruitment of students and curricula content. Opportunities for management and leader-ship within the field of library work can be highlighted as one method of attracting individuals with the desire to pursue these career goals.
• Mid-career librarians, particularly, need to send clear signals about their interest in managing. The lack of interest in supervising needs closer attention, suggesting that the supervisory role is not necessarily a role of choice for many librarians and that supervisory models and structuring of the staff complement in libraries needs to be closely examined.
• The large degree to which librarians and paraprofessionals overlap in job functioning is apparent. In de-signing jobs for both librarians and paraprofessionals, libraries need to carefully consider the level of responsibility attached to the job task or function. Clearly, paraprofessionals should not be performing to the same level of responsibility as professional librarians if they are not recognized or paid for doing so.
• Almost half of paraprofessionals indicate that they do not perceive they are treated with the same respect as librarians. Supervisors and managers need to ensure that they build and/or promote a respectful work-place that recognizes the contributions of all staff, and acknowledges the increasingly demanding respon-sibilities these staff perform.
• In designing jobs, the balance between the elements of managing/leading and working harder or working at a variety of more complex tasks needs to be carefully considered. The balance can be tipped and jobs made more stressful or more fulfilling, depending upon the relative proportion of the elements.
SECTION A: Introduction and Background 23The Future of Human Resources in Canadian Libraries
S E C T I O N A
Introduction and Background
This report represents the culmination of three years of research on critical factors affecting human resources in Canadian libraries. Within this time span, the 8Rs team conducted literature reviews, focus group sessions
and in-depth interviews with key library stakeholders, a mail-out survey of 461 libraries and a web survey of 4,693 librarians and paraprofessionals.1 This comprehensive research agenda has allowed us to fill many gaps in our understanding of human resource issues emerging in the contemporary Canadian library.
The 8Rs Canadian Library Human Resource Study arose primarily in response to a growing perception in the community that libraries were facing mass retirements over the next five to 10 years. Some literature with general statistics were published, purporting that up to 48% of librarians could be retiring by 2005 (Weiler, 2000); howev-er, no literature was published regarding estimates of library paraprofessional staff retirements. Much important information remained unclear beyond this initial data, including for example, library workers’ own intended age of retirement and institutions’ plans for position replacements and/or restructuring. Left completely unanswered were broad questions about the effects of replacing staff in an environment of continual budget cuts, shifting staff roles, and the impact of new technologies on the sector and its staff complement.
After a preliminary investigation of some of these factors, the 8Rs research team determined eight elements nec-essary to address the status of human resources in libraries across the country: recruitment, retirement, retention, remuneration, repatriation, rejuvenation, re-accreditation, and restructuring (the 8Rs).
The 8Rs are recruitment, retirement, retention, remuneration, repatriation, rejuvenation, re-accreditation, and restructuring.
Significant demands have been placed upon the library community as knowledge and information increasingly take centre stage in world social and economic spheres. The ability of institutions to recruit, retain and develop a committed and talented workforce will determine the capacity for Canadian libraries to participate fully in the development of the new economy, as key managers of information and knowledge. A major factor in the library community‘s ability to respond to challenges posed by shifting service demands and new economic consider-ations is that of an adequate number of appropriately educated and skilled staff that are aligned with the needs of the library.
1 For the purposes of this study, we have defined librarians as individuals who have a Master of Library and Information Studies (MLIS) or a Bachelor of Library Studies (BLS) and paraprofessionals are those with a library technician diploma or equivalent work experience. Library clerks and support staff are not addressed in this study, nor are other professionals.
24 SECTION A: Introduction and Background CANADIAN LIBRARY HUMAN RESOURCE STUDY
Many in the library community have expressed concern about a lack of succession management (either for indi-vidual institutions or within the field as a whole), and thus anticipate a potential crisis in staffing over the next 5 to 10 years. This concern is rooted in the notion that as librarians near the eligible age of retirement (60 years and over), there will be a lack of trained and experienced staff to fill the vacancies created. Other issues that feed from a potential human resource shortage include the need to rejuvenate mid-level staff who, because of downsizing and hierarchical flattening, have not been provided with the opportunity to prepare themselves to fill the roles that will arise from retirements. Questions surrounding the educational requirements, occupational competen-cies, and the provision of training opportunities also play into the cultivation of needed skills, knowledge and abilities.
The issue of an aging workforce is common to many industries nation-wide. In the library community, the com-bination of an aging workforce and budget cuts have strained human resource capacities. Curran (2003) echoes this assertion, noting that the decreased capacity for hiring librarians over the last twenty years (due in part to sustained budget cuts) has created a situation where the majority of the library workforce is concentrated into an older age demographic, thus setting up the pre-conditions for mass retirements within a short period of time. In-stitutional expansion in libraries during the 1960s and 1970s was followed by a period of severe funding cutbacks in the 1990s. During this time, Canadian libraries were faced with two pressures: significant budget cuts and some retirements. As the Association of College and Research Libraries (ACRL), Ad Hoc Task Force on Recruitment and Retention in Libraries (2002) concluded:
The situation in Canada showed little change at the beginning of 2002. Some institutions report problems filling middle-management positions, as so few were hired in the 1990s that management experience was not easily gained. Many institutions are expecting further budget cuts. Retirements are slated to occur, but permanent tenure-track positions will not automatically be filled…Ca-nadian human resources librarians worry that their organizations are losing the vitality that new recruits bring to a professional group. Practicing librarians feel that few are following behind to maintain the legacy, whether of service quality or of collection strength, that they have built and fostered. (7)
While the interviews demonstrate the concerns of academic libraries, they could just as easily be applied across the library sector. In the case of school libraries, even greater concern is warranted. Durand and Daschko (2004) note that school libraries, which have often been the recipients of public education budget cuts, are characterized as being in a “crisis” situation, with data showing that between 1991 and 1999, there was a 43.2 percentage point reduction in full-time librarians employed in Canadian schools.
In response to these concerns, members of the library community began to discuss succession planning strate-gies. Though succession planning was initially in response to the replacement of key upper-level management librarians, recent publications and presentations have expanded this view to include planning for the replacement of librarians at all levels, as well as of paraprofessional staff. One obvious reason for this shift is the acknowledge-ment that senior librarians may hold non-management positions which also need to be filled when they retire suggesting that functional requirements of librarians at all levels in the hierarchy need to be addressed. As well, many paraprofessional staff members were hired in the same time period as librarians, are of a comparable age demographic, and are predicted to retire in similar numbers (Kalin, 2003). Lastly, much of the current literature on succession management reiterates the need for libraries to take a long-term view and a proactive role in terms of planning their workforce needs. The understanding of succession planning within the library field has thus migrated to a long-term, organization-wide approach. Furthermore, as representatives of the library community attending the 2004 Heritage Summit in Ottawa concluded, although succession planning within institutions is important, it is “the responsibility of the community as a whole” (8Rs, 2004).
Succession management is therefore increasingly viewed as the responsibility of individuals, institutions, and as-sociations. However, the community does not appear to have a clear understanding of how this will be achieved. For example, results from a Canadian Library Association (Summerfield, 2002) study suggest that many libraries are uncertain about the role that associations could play in fostering succession planning. When asked about what
SECTION A: Introduction and Background 25The Future of Human Resources in Canadian Libraries
the CLA could do to assist with addressing the situation, the most frequent response from the sample of libraries was “nothing.”
The 8Rs study provides the data and analysis to inform national coalitions and partnerships between libraries, educational institutions, and representative professional associations of the issues surrounding the supply and demand of the workforce. In doing so, the study permits an unprecedented opportunity to assess the sector‘s readiness to accommodate change and to illuminate potential strategies that can be used by libraries in plan-ning their own human resources. The study also presents standards with which individual libraries can assess their preparedness for emerging employment trends, thereby allowing them a timely opportunity to review the effectiveness of their current institutional and professional human resource structures. Institutions and associa-tions can use this data to gain a greater understanding of the needs and interests of library workers at all stages of their careers, implicating everything from organizational structure to ongoing professional development. As we highlight information regarding the needs of staff and the requirements of organizations, we hope that the data will provide a starting point for individuals, institutions, and associations to continue building a strong library workforce.
Results from this study fill many of the gaps in our understanding of human resource issues in libraries. We begin addressing these gaps with a presentation of libraries’ staffing and demographic profiles in Section C. In Section D, we examine results pertaining to recruitment to the profession and to the organization, both from the perspective of the organization and from the individual staff member. Retirement issues, including recent retirements, projected future retirements, and libraries’ experiences with retirements are the focus of Section E. These recruitment and retirement analyses are very important components of this study, as they allow us to identify the chief challenges the sector must address when hiring and planning for succession. Section F includes an analysis of staff retention, but also investigates the relationship between promotional opportunities and career aspirations. Sections G and H provide an evaluation of post secondary and continuing education, respectively, as well the implications of these findings for the sector’s readiness to deal with organizational and professional role change. Section I includes a comprehensive analysis of job satisfaction that provides a benchmark against which human resource practitioners can evaluate the quality of work in their own organizations. A numerical projection of future supply of librarians assessed against predicted demand in the Canadian library sector is the primary focus of Section J. In assessing the fit between competency demand and supply, Section K ties together a number of recruitment, retirement, education, training, and job satisfaction findings that are presented throughout the report, supplemented with additional results from this study. Finally, Section L summarizes the key findings of the report.
Each section of the report concludes with a series of points highlighting the human resource planning implica-tions of the results presented in that section. Most of the results are presented in the main body of the report in a series of tables and figures. Supplementary findings, however, are also provided in Appendix B and are referred to in the report when applicable. Although we recommend and hope that most individuals will read this report in its entirety, we are well aware that the sheer size of the report makes this more difficult. Alternatively, readers might also use this report as a reference tool in which they can examine specific sections and specific tables in the report that are applicable to their area of interest.
Our analytical focus is primarily on the entire Canadian library context; however, in recognizing the often vast differences between different types of libraries (e.g., academic, public, and special), results are typically examined by library sector. When appropriate and applicable, the findings are also presented for provincial/territorial geo-graphic regions as well as for urban and rural areas of the country. Again, when appropriate and applicable, results from the individual survey are presented by occupational level and career stage to distinguish between the differ-ent experiences and perspectives among staff. Lastly, though most of the results apply to professional librarians, we also examine the role of the paraprofessional in several sections of the report.
Prior to presenting the findings, however, the methods used in each stage of our study are outlined in the follow-ing section.
SECTION B: Methods 27The Future of Human Resources in Canadian Libraries
S E C T I O N B
Methods
B.1 Introduction
This research initiative was designed to answer a wide range of questions about librarianship within each type of library system, across regional jurisdictions of the nation, and at several occupational levels. As such, the breadth of the study demands a methods plan that is equally comprehensive and exhaustive. The research methods in-volved three major stages with each consecutive stage designed to inform the directions and content of subse-quent stages. Stage I entailed a literature review, a compilation of existing Statistics Canada and library school graduate data, in-depth interviews with library administrators and focus group sessions with representatives from the Canadian Association of Research Libraries (CARL), the Canadian Urban Libraries Council (CULC), and the Alberta Association of Library Technicians (AALT). Although we draw upon some of the findings from Stage I in our analysis, the information gathered through these means primarily served to inform the survey questions for Stages II and III.
Stage II was a mail-out survey of library institutions and Stage III a web survey of librarians and paraprofession-als, which we refer to as the “institutional” and “individual” surveys, respectively. Results from the two surveys form the core of the analysis and are the primary data used in this report.
The following sections briefly outline the methods used for the two major phases of this research project (Stages II and III). A more detailed description of the questionnaire design and data collection methods used in all stages is provided in Appendix A and copies of the survey instruments are provided in Appendix C, D, and E.
B.2 Stage II: Survey of Library Administration (Institutional Survey)
This second stage of the 8Rs project involved the completion of a written, mail-out survey by library administra-tions from academic, public, and special library systems. A mail-out design was chosen because of the extensive nature of the data required and the length of time required to complete the survey.2
The questionnaire used in the institutional portion of the study was designed to collect information on the human resource experiences and perspectives of libraries (a copy of the survey instrument is provided in Appendix C).3 The major focus of the institutional survey was to gather information on professional librarian staff, although respondents were also asked to provide some organizational statistics pertaining to paraprofessional and other professional staff members.
2 Since detailed information about staff numbers was asked in the survey, it was expected that surveys would need to be completed by respondents over a number of days as they gathered data from their own records to fill in responses.
3This portion of the study was part of a larger investigation of the heritage sector, including libraries, museums, and archives and was funded in part by Canadian Heritage through the Canadian Council of Archives, the Canadian Library Association, and the Canadian Museums Association.
28 SECTION B: Methods CANADIAN LIBRARY HUMAN RESOURCE STUDY
I Response RatesIn total, 1,423 surveys were mailed in June 2003. However, after removing institutions that were not libraries, had closed down, were a branch of a larger system, were duplicate records, or that did not employ professional librar-ians, the “cleaned” sample is reduced to 1,357 surveys.
Table B.1 presents response rates for the total sample and for each Canadian province/territory. In total, 461 surveys were completed for a response rate of 34%. Given the number of libraries in Canada, results for the 461 libraries permits a high level of confidence in the findings and allows us to generalize the results to the Canadian library community at large. For the total sample, results are accurate within plus or minus 3.8 percentage points, 95 times out of 100.
Provincially and territorially, response rates ranged from a low of 22% in Newfoundland/Labrador to a high of 45% in Nova Scotia/PEI combined. This range of rates is entirely within the Atlantic provinces, which overall had a respectable response rate of 39%.
Table B.1 Response Rate by Province/Territory (Institutional Survey)
Province/Territory CleanedSample1
Completed Surveys2
ResponseRate (%)
TOTAL 1,357 461 34.0
British Columbia 127 50 38.8
Alberta 261 77 29.5
Saskatchewan 41 11 26.8
Manitoba 93 41 44.1
Ontario 449 143 31.0
Quebec 261 89 33.7
New Brunswick 28 12 42.9
Nova Scotia/PEI 53 24 45.3
Newfoundland/Labrador 23 5 21.7
Northern Territories 21 6 28.6
Source: 8Rs Canadian Library Human Resource Institutional Survey1 Cleaned Sample excludes institutions that were sent a survey but did not complete because they were 1) not a library, 2) closed down, 3) a branch already covered by a regional institution, 4) a duplicate record, or 5) an institution without professional staff.2 Completed provincial/territorial surveys do not add up to total surveys received since regional information was not provided for 3 institutions.
Table B.2 presents the response rates for each library sector. The rates vary somewhat between sectors, with CARL institutions the most likely of all sectors and sub-sectors to respond to the survey (90% response rate). At 68%, CULC libraries have the second highest rate. Response rates for other academic, other public and government libraries, while not as high, are within acceptable standards for a mail-out survey. The somewhat lower response rates for non-profit and for-profit libraries, however, suggests that some care needs to be taken when generalizing these findings to these Canadian special library communities.
SECTION B: Methods 29The Future of Human Resources in Canadian Libraries
Table B.2 Response Rate by Library Sector (Institutional Survey)
Library Sector CleanedSample1
Completed Surveys2 Response
TOTAL 1,357 461 34.0
TOTAL ACADEMIC 168 84 50.0
CARL 29 26 89.7
Other Academic 139 58 41.7
TOTAL PUBLIC 659 234 35.5
CULC 38 26 68.4
Other Public 621 208 33.5
TOTAL SPECIAL 532 140 26.3
Government 135 50 37.0
Non-profit 319 75 23.5
For-profit 78 15 19.2
Source: 8Rs Canadian Library Human Resource Institutional Survey1 Cleaned Sample excludes institutions that were sent a survey but did not complete because they were 1) not a library, 2) closed down, 3) a branch already covered by a regional institution, 4) a duplicate record, or 5) an institution without professional staff.2 Completed library sector surveys do not add up to total surveys completed since library sub-sector information was not provided for 3 institutions, 2 of which were from Quebec.
II Institutional CharacteristicsThe majority of analyses for the institutional survey focused upon those organizations with professional librar-ians. This reduces the sample size to 289 organizations for results on professional librarians within the institu-tional sample.4
About 4 in 10 Canadian libraries do not employ professional librarians.
As shown in Table B.3, while sample sizes from all academic and CULC libraries remain the same, sub-sample sizes are reduced by over half for other public and non-profit libraries, by nearly 30% for government, and by 20% among for-profit libraries. The resulting reduced sample size is adequate for all but one library sector. The number of for-profit libraries is reduced to an inadequate number (13), such that their data are not representative of the sector and presentation of their results would risk jeopardizing respondent confidentiality. The majority of for-profit results, therefore, are not presented separately in the report, but they are included in the Total Special results.
4 That only 63% of libraries in our sample have professional librarians on staff is comparable with findings from a 1999 statistical study estimating that six in ten libraries employ professional librarians. The finding that smaller public and non-profit libraries are the least likely to employ professional librarians also concurs with this previous statistical compilation of library data (Schrader and Brundin, 2002).
30 SECTION B: Methods CANADIAN LIBRARY HUMAN RESOURCE STUDY
Table B.3 Organizations Employing Professional Librarians by Library Sector (Institutional Survey)
Library Sector % of Organizations with Professional Librarians Reduced
TOTAL 63 289
TOTAL ACADEMIC 100 84
CARL 100 26
Other Academic 100 58
TOTAL PUBLIC 51 120
CULC 100 26
Other Public 45 94
TOTAL SPECIAL 59 85
Government 72 36
Non-Profit 46 36
For-Profit 87 13
Source: 8Rs Canadian Library Human Resource Institutional Survey
Table B.4 displays the percentage distribution across library sector of librarians represented by the participating institutions and the mean number of librarians represented in each sector. One-half of the 3,299 (FTE) librar-ians represented in this survey work in public libraries, 43% work in academic libraries, and special libraries employ just 6% of library professionals. Though CARL and CULC represent only 18% of the institutions in the sample, more than three-quarters (78%) of professional librarians work in these two sectors. CARL and CULC libraries also, on average, employ the largest number of librarians per organization (48 and 52, respectively). The remaining sectors have a much smaller average professional librarian staff size (ranging from 2 to 7 librarians per organization).
Table B.4 Librarian Representation by Library Sector (Institutional Survey)
Library Sector Sector Distribution of Professional Librarians
Mean Number of Librarians Per Organization
TOTAL 100 11
(Total FTE Librarians: 3,299)
TOTAL ACADEMIC 43 17
CARL 37 48
Other Academic 6 4
TOTAL PUBLIC 50 14
CULC 41 52
Other Public 9 3
TOTAL SPECIAL 1 6 3
Government 3 7
Non-Profit 3 2
Source: 8Rs Canadian Library Human Resource Institutional Survey1 For-Profit library results are not presented separately because of insufficient cases reporting; however, they are included in the Total Special results.
SECTION B: Methods 31The Future of Human Resources in Canadian Libraries
The distribution of libraries and librarians across sectors should be kept in mind when examining the total results and the results for each sector. Clearly, CARL and CULC libraries, although smaller in number, represent the majority of librarians working in Canada and each member of these institutions has, on average, a larger profes-sional librarian staff base.
Some of the key human resource analyses presented in this report are also examined by province/territory and by urban and rural geographic location. We draw upon Statistics Canada’s definitions to define the rural and urban categories used in this study. “Rural and Remote” includes libraries located in non-metro-adjacent communities with a population of less than 10,000, plus libraries located in the northern territories. As shown in Figure B.1, 18% of the sample of libraries are located in rural and remote regions of Canada. To distinguish between the typically larger, more prosperous, and more geographically central libraries and those located in smaller urban centres, two classes of “urban” were designated. “Mid-Sized Urban” refers to libraries located in Census Agglom-erations (CAs) which have an urban core population between 10,000 and 99,000, including all neighbouring municipalities where 50% or more of the labour force commutes into the urban core. Mid-sized urban centres range from the most populated City of Barrie to the least populated Labrador City and, as shown in Figure B.1, comprise 18% of the libraries in our sample. Finally, “Large Urban” refers to libraries located in Census Metro-politan Areas (CMAs) which have an urban core population of at least 100,000 and abide by the same commuting rules as CAs (Statistics Canada, 1999a). Large urban centres range from the most populated city of Toronto to the least populated city of Thunder Bay. The majority of libraries (64%) in the sample are located in large urban regions. Appendix Table B.1 provides a complete list of Canada’s CAs and CMAs that are included in the two ur-ban categories and Appendix Table B.2 provides the percent distribution of these rural/urban designations within each library sector.
Figure B.1 Rural and Remote1, Mid-Sized Urban2, and Large Urban3 Library Representation4
(Institutional Survey)
Large and Urban 64% Mid-sized Urban 18%
Rural and Remote 18%
Source: 8Rs Canadian Library Human Resource Institutional Survey1 Rural and Remote includes communities with a core population of less than 10,000, plus the northern territories. 2 Mid-Sized Urban corresponds to Statistics Canada’s Census Agglomerate (CA) definition and has a population size between 10,000 and 99,999 including all neighbouring municipalities where 50% or more of the labour force commutes into the urban core. 3 Large Urban corresponds to Statistics Canada’s Census Metropolitan Area (CMA) definition and has a population of at least 100,000 including all neighbouring municipalities where 50% or more of the labour force commutes into the urban core.4 Distribution of rural and remote/urban is for libraries employing professional librarians only and excludes 2 institutions for which geographic location information was not provided (n=287).
32 SECTION B: Methods CANADIAN LIBRARY HUMAN RESOURCE STUDY
B.3 Stage III: Survey of Professional Librarians and Paraprofessional Staff (Individual Survey)
While the institutional survey provides information on staff numbers and human resource practices from the perspective of administration, the survey of librarians and paraprofessionals offers a critical firsthand view about the career experiences, opportunities, and expectations of two important segments of library staff. The analytic focus of this portion of the study is to gain an understanding of the 8Rs from the viewpoints of those working in the sector. This survey, conducted in the summer of 2004, is the largest and most comprehensive stage of the research project. Because of the size and diversity of the library workforce, the decision was made to utilize a web survey so that the largest number of staff could be reached within the shortest amount of time and with the lowest costs incurred. For the same reasons, the decision was made to concurrently survey both professional and paraprofessional library staff (See Appendix D for a copy of the survey instrument).
Two major strategies were used to optimize the number of survey respondents and the representativeness of the sample.5 First, for both types of library staff, a multi-stage random sampling technique was employed to ensure sufficient sub-sample sizes and representation from all library sectors and from all geographical regions of Cana-da. Second, after the deadline for completion of the random survey, a Canada-wide call to potential respondents was made, in order to provide library staff who were not represented in the sampling frame an opportunity to participate in the survey, and to supplement sector and geographical representation. The non-random portion of respondents were invited to participate through list servers provided by 56 library associations and, in the case of CULC, by 25 specific library institutions.
I Response Rates and Confidence Intervals Table B.5 provides the sample and sub-sample sizes and the confidence interval for the French and English ran-dom and non-random samples, and the response rate for the random sample portion of respondents. Of the 8,626 potential respondents randomly selected from the sampling frame, 3,148 librarians and paraprofessional staff participated in the survey for a response rate of 37% and a confidence interval of 1.6 (i.e., results are within plus or minus 1.6 percentage points, 95 times out of 100).
Table B.5 Respondents by Sample Source (Individual Survey)
Total Non-Random Sample (List Server)3 N/A 1,545 N/A N/A
English List Server 1,446
French List Server 99
Source: 8Rs Canadian Library Human Resource Individual Survey1 The sampling frame excludes individuals who were sent a survey but did not complete because they 1) did not perform library work, 2) no longer worked in a library or library had closed, 3) never worked in a library-type institution, or 4) were a duplicate record. The sample includes only those respondents completing at least two survey questions. 2 Multi-stage random sampling at variable rates was conducted to ensure sufficient sub-sample sizes and representation from all library sectors, from all geographical regions of Canada, and for professional librarians and paraprofessional staff. If potential respondents who did not receive the survey because of an incorrect e-mail address or because they were away are removed from sampling frame, the response rate out of the remaining 7,569 potential respondents is 42%.3 To provide library staff who were not represented in the sampling frame an opportunity to participate in the survey, potential respondents were invited to complete the survey through a variety of list servers.
5 The sampling frame of librarian and paraprofessional staff was developed over several months with the assistance of several library associations and libraries that provided the 8Rs research team with their membership or staff lists supplemented by internet searches. In total, 12,472 library staff members were included in the population frame from which sampling took place. Although this population framework is the most comprehensive list available, it does not represent the entire population of librarians and paraprofessionals currently working in the Canadian library system. Primarily for the reason of this incomplete sampling frame, the list server respondents were added to the sample data base.
SECTION B: Methods 33The Future of Human Resources in Canadian Libraries
When adding the 1,545 list server respondents to the sample, the total sample size increases to 4,693 and the confidence interval decreases to plus or minus 1.2 percent. These very low confidence intervals combined with a respectable response rate indicate that the sample of library staff used in this study are highly representative of all librarians and paraprofessionals and that we can be very confident in the results presented in this report.
Table B.6 presents the distribution of individual survey respondents by province for the combined random and non-random samples. Since the total population size of library staff within each province is unknown, we are not able to provide confidence intervals for each province.6 Ontario comprises the largest proportion with 42% of respondents working in this province. Three in ten library staff are from British Columbia or Alberta, while about one in ten work in Saskatchewan or Manitoba (4%), Quebec (8%), or the Maritimes (11%). Only 1.4% of the total sample work in a library located in one of the northern territories.
Table B.6 Respondents by Province/Territory (Individual Survey)
Province / Territory Total Sample Size1 Percent of Total Sample
TOTAL 3,920 100
British Columbia 604 16
Alberta 545 14
Saskatchewan 175 5
Manitoba 156 4
Ontario 1,630 42
Quebec 314 8
New Brunswick 117 3
Nova Scotia 178 5
Newfoundland / Labrador 79 2
Prince Edward Island 34 1
Yukon 26 1
Northwest Territories 16 <1
Nunavut 12 <1
Source: 8Rs Canadian Library Human Resource Individual Survey1 Sample excludes respondents who did not provide geographic information or who work in a non-Canadian library.
Table B.7 provides the sample sizes, sector distribution of the sample, and confidence intervals for each library sector. The 1,580 librarian and paraprofessional respondents working in the academic sector represent 38% of the total sample. Results provided for academic libraries are accurate within plus or minus 2.1%, 95 times out of 100, public libraries within plus or minus 2.2%, and special libraries within plus or minus 3.3%.
Although sub-sample sizes are adequate for most sectors (and more than adequate for some sectors), the 98 re-spondents working in for-profit libraries is lower than what is required to be fully confident in the responses from this sector. School librarians comprise 5% of the total sample and, although confidence intervals are higher than we would like, the sample is still within acceptable limits.7
6 Confidence intervals can only be calculated when the population size is known.
7 The survey was conducted in mid-June, resulting, no doubt, in a lower response rate for school librarians.
34 SECTION B: Methods CANADIAN LIBRARY HUMAN RESOURCE STUDY
Over half of respondents are from one of the two largest employers of library staff (CARL and CULC). This is much lower than the 93% of librarians represented in CARL and CULC from the institutional survey, but it should be kept in mind that the institutional survey did not include school libraries and, in addition, under-rep-resented special libraries. It should also be noted that the “Total Special” individual survey responses also include 19 librarians working in a non-traditional library setting (e.g., as a consultant or vendor, or on a non-academic research project).
The 50-50 ratio of library staff between CARL and CULC is consistent for both the individual and institutional surveys, however. With respect to government libraries, a breakdown of federal, provincial, and municipal pro-portions of individual respondents can be found in Appendix Table B.4.
Table B.7 Sample Size and Confidence Intervals by Library Sector (Individual Survey)
Library Sector Sample Size1 % of Total Sample Confidence Interval at 95%
TOTAL 4,124 100 1.2%
TOTAL ACADEMIC 1,580 38 2.10%
CARL 1,041 25 2.70%
Other Academic 539 13 3.60%
TOTAL PUBLIC 1,566 38 2.20%
CULC 1,055 26 2.70%
Other Public 511 12 3.70%
TOTAL SPECIAL 757 19 3.30%
Government 420 10 4.10%
Non-Profit 220 5 6.00%
For-Profit 98 2 9.50%
SCHOOL 221 5 6.20%
Source: 8Rs Canadian Library Human Resource Individual Survey1 Sample excludes respondents who did not provide library sector information or those who work in a non-Canadian library.
Because of issues of confidentiality, a different method was used to determine the rural/urban location of indi-vidual respondents than was used for the institutional sample.8 Nevertheless, as shown in Appendix Table B.5, the exact same proportion of individual respondents as institutional respondents were located in a rural or remote region of Canada (18%).
B.4 Data Limitations
While we are confident that the overall findings from this research can be applied to the Canadian library context, there are some limitations that should be considered. First, the sheer amount of data garnered from this study makes the analyses which inter-relate findings between surveys, and between survey questions, a very complex process that could be performed in a multitude of ways. In recognizing this, and in recognizing the limitations of time and money, we believe that while the report provides an enormous amount of heretofore unknown informa-
8 Rural and Remote, Mid-Sized Urban, and Large Urban designations were based on the city/town information provided by institutional respondents. To protect the confidentiality of individual respondents, city/town information was not asked. Rural designation in the individual sample is based on “no” responses to the question “Is your library located in an urban centre with a municipal population of more than 10,000 people?” Because not all respondents provided an answer to this question, rural designation was also assigned to respondents indicating that they “already work in a rural/remote region of Canada,” plus respondents residing in one of Canada’s northern territories.
SECTION B: Methods 35The Future of Human Resources in Canadian Libraries
tion and knowledge about human resources in Canadian libraries, there is certainly room for further exploration of the data. It is our hope that the library community and academics take advantage of this unprecedented data set to analyze human resource topics at a more in-depth and perhaps more sophisticated level. For example, though we perform a multivariate analysis in a few areas, most of the results provided are simple correlations.
Second, certain sectors and groups are not sufficiently represented to allow as much confidence in the findings as we have for the total samples and for most sub-groups. The response rate for the entire institutional survey is sufficient to allow the generalization of results to the Canadian library context. However, special libraries are somewhat under-represented (especially for-profit libraries) as are libraries located in Newfoundland/Labrador. The lower response rates warrant some caution when interpreting results from this sector and this province. Fur-thermore, since library staff working in for-profit libraries are also under-represented in the individual survey, we have less confidence in the conclusions drawn with respect to this sector overall.
It should also be acknowledged that voluntary staff members are under-represented in the study. Only 19 cases (0.5%) of total sample of individual library staff work on a voluntary basis. Results from the institutional survey (see Appendix Table C.2) suggest that these numbers should be higher.
Third, it needs to be understood that the total number of librarians working in Canada that are used to project future retirements and future librarian and paraprofessional supply (see Tables E.6, J.3, and J.5) are rough ap-proximations and should not be used literally. The vast majority of the information disseminated in this report are from our own study, however, since there are no available data that allow for a definitive estimation of the total number of librarians and paraprofessionals in Canada, we rely on extrapolations from the institutional survey in combination with data from the National Core Library Statistics Program (Schrader and Brundin, 2002). At the same time, these approximations are likely more precise than what is available elsewhere.9
Lastly, it should be noted that not all respondents provided an answer to every question in either survey. Accord-ingly, we have provided the number of respondents (n) for each table and figure as an indication of individual question response rates. On the rare occasion when response rates for individual questions were deemed as inap-propriately low, we do not present the data at all.
9 Statistics Canada 2001 census data states there are over 12,000 professional librarians in Canada, but this estimate is not very accurate since we are not certain how many of these individuals meet the MLIS (or historical equivalent) standard, nor does the figure include administrators.
SECTION C: Workplace and Demographic Characteristics 37The Future of Human Resources in Canadian Libraries
S E C T I O N C
Workplace and Demographic
Characteristics of Canadian Library Personnel
In this section we present the types of library staff represented in the individual survey, their work status and career stage, and their demographic characteristics. We draw on the individual survey exclusively in this sec-
tion for ease in interpreting the numbers. Since the individual survey was conducted in 2004 and the institutional in 2003, the former are also more recent data and, therefore, depict the most current trends. Complementary institutional data are provided in Appendix Tables C.1 through C.5.
C.1 Staff and Workplace Characteristics
Of the 4,693 respondents in the individual sample, 98% were currently employed in a library-type setting. Of these, Table C.1 shows that half are professional librarians, 43% paraprofessional staff, and 7% other professionals and managers (without a MLIS degree). With two exceptions the distribution of the different types of staff are very similar for all sectors. First, within non-CULC public libraries, other professionals and managers are more highly represented (17% compared to 7% for the total sample). Secondly, a much greater proportion of those working in schools are paraprofessionals than professional librarians (81% and 16%, respectively). This distribu-tion reflects the reality of school libraries which have endured years of budget cuts, often eliminating librarian positions or replacing them with paraprofessional staff.
38 SECTION C: Workplace and Demographic Characteristics CANADIAN LIBRARY HUMAN RESOURCE STUDY
Table C.1 Type of Library Staff by Library Sector (Individual Survey; n=4,497)
Percent
Library SectorProfessionalLibrarians1
Para–Professional Staff2
Other Professionals /Managers3
TOTAL SAMPLE 50 43 7
TOTAL ACADEMIC 49 44 7
CARL 51 42 7
Other Academic 47 48 5
TOTAL PUBLIC 53 38 9
CULC 56 39 5
Other Public 46 37 17
TOTAL SPECIAL 57 37 6
Government 59 36 5
Non-Profit 52 41 7
For-Profit 51 40 9
TOTAL SCHOOL 16 81 3
Source: 8Rs Canadian Library Human Resource Individual Survey1 Professional Librarians are defined as those who have an MLIS degree and are working as a professional librarian, manager, or other professional.2 Paraprofessionals are defined as individuals who are working as a library technician, assistant, associate, or aide, irrespective of whether they have an MLIS degree and individuals working as a librarian without an MLIS degree. 3 Other Professionals and Managers are defined as individuals who are working in a professional position without an MLIS degree (e.g., systems analyst, personnel, finance, marketing) or a management position without an MLIS degree.
More than 6 in 10 professional librarians work in a supervisory or managerial role.
Among the professional librarians represented in the sample, 38% are in non-management positions, 44% in supervisory or middle management positions, and 18% are working as senior administrators (Table C.2). Other public and non-profit librarians are most likely to be working in some type of supervisory or managerial role. Since these libraries are often staffed with just one or two people, the results likely reflect the fact that these librar-ians perform a wide variety of job functions, including management.
Overall, however, the fact that 62% of librarians are working in some management capacity is noteworthy and provides the first indication of many in this analysis of the need for librarians to perform managerial functions.
SECTION C: Workplace and Demographic Characteristics 39The Future of Human Resources in Canadian Libraries
Table C.2 Occupational Level of Professional Librarians by Library Sector (Individual Survey; n=2,134)
Percent
Library SectorNon-
ManagementSupervisor /
Middle Mngmt.1
SeniorAdministrator2
TOTAL SAMPLE 38 44 18
TOTAL ACADEMIC 43 39 18
CARL 47 39 14
Other Academic 36 38 26
TOTAL PUBLIC 34 49 17
CULC 39 53 8
Other Public 22 41 37
TOTAL SPECIAL 36 43 21
Government 38 46 16
Non-Profit 32 42 26
For-Profit 30 33 37
TOTAL SCHOOL 22 53 25
Source: 8Rs Canadian Library Human Resource Individual Survey1 Supervisor/Middle Management includes such positions as supervisor, branch or department head.2 Senior Administrator includes such positions as head or chief librarian, director, or CEO or assistant head or chief librarian, director, or CEO or regional head.
With respect to paraprofessional staff, Table C.3 shows that 38% are library technicians, 35% library assistants, associates, or aides, and 27% are working in supervisory or managerial positions. Library technicians are most highly represented in non-CARL academic and special libraries. CARL and CULC libraries, on the other hand, are most likely to hire library assistants, associates, and aides, with 50% of the paraprofessional cadre holding these job titles. As was the case for librarians and likely for the same reasons, paraprofessionals working in man-agement positions are most often located in smaller public and school libraries.
40 SECTION C: Workplace and Demographic Characteristics CANADIAN LIBRARY HUMAN RESOURCE STUDY
Table C.3 Occupational Level of Paraprofessional Staff by Library Sector (Individual Survey; n=3,621)
Percent
Library Sector Library TechnicianLibrary Assist./
Assoc./AideSupervisor/ Middle
Mngmt.1
SeniorAdmin.2
TOTAL SAMPLE 38 35 20 7
TOTAL ACADEMIC 41 41 17 1
CARL 33 50 17 <1
Other Academic 55 26 17 2
TOTAL PUBLIC 27 43 22 8
CULC 30 50 19 1
Other Public 20 27 29 24
TOTAL SPECIAL 58 16 18 8
Government 61 19 16 4
Non-Profit 49 18 18 15
For-Profit 63 3 26 8
TOTAL SCHOOL 28 21 30 22
Source: 8Rs Canadian Library Human Resource Individual Survey1 Supervisor/Middle Management includes such positions as supervisor and branch or department head.2 Senior Administrator includes such positions as head or chief librarian, director, or CEO or assistant head or chief librarian, director, or CEO or regional head.
Almost nine in ten librarians work on a full-time, permanent basis. Table C.4 presents the proportion of librar-ians and paraprofessionals working on a part-time or temporary basis. Though some sector variation is evident, the proportion of librarians working on a part-time or temporary basis is fairly consistent across sectors. CARL librarians tend to be less likely to work in part-time positions but are slightly more likely to be in temporary, rather than permanent, jobs. Part-time librarian positions are slightly more often found in CULC, non-profit, and for-profit libraries.
SECTION C: Workplace and Demographic Characteristics 41The Future of Human Resources in Canadian Libraries
Table C.4 Work Status of Librarians and Paraprofessionals by Library Sector (Individual Survey)
Sources: 8Rs Canadian Library Human Resource Individual Survey1 Part-Time status includes individuals who normally working less than 30 hours per week.2 Temporary includes individuals where there is an indication of when the employment will end.
Comparatively, paraprofessional library staff are more than three times more likely than librarians to be working on a part-time basis (25% compared to 7%). Even greater differences in part-time rates are observed between librarians and paraprofessionals within public libraries (43% compared to 10%). Temporary employment, how-ever, is equally uncommon for most librarians and paraprofessionals.
Table C.5 presents the proportion of librarians and paraprofessionals represented by a union or staff associa-tion. Although a greater proportion of paraprofessionals than professionals are covered by a collective agreement (79% versus 67%), much of this difference is attributed to the higher unionization rates among paraprofessionals working in school settings. Compared to school librarians, 67% of whom are unionized, 90% of paraprofessionals belong to a union. For both types of staff, unionization rates vary considerably between sectors. Generally, school paraprofessionals and those working in large libraries are more likely to be unionized.
42 SECTION C: Workplace and Demographic Characteristics CANADIAN LIBRARY HUMAN RESOURCE STUDY
Table C.5 Union status1 of Librarians and Paraprofessionals by Library Sector (Individual Survey)
Percent Union Members
Library SectorProfessional Librarians
(n=2,080)Paraprofessional Staff
(n=1,773)
TOTAL SAMPLE 67 79
TOTAL ACADEMIC 83 91
CARL 88 95
Other Academic 72 84
TOTAL PUBLIC 59 75
CULC 69 88
Other Public 32 46
TOTAL SPECIAL 54 49
Government 76 74
Non-Profit 25 27
For-Profit 74 8
TOTAL SCHOOL 67 90
Source: 8Rs Canadian Library Human Resource Individual Survey1 Based on “yes” responses to the question: “Are you currently covered by a union or staff association (e.g., are you covered by a collective agreement or a union contract?”)
To capture differences in results between staff at various stages of their careers, some of the data in this report are provided separately for recent professional librarian entrants, mid-career librarians, and senior librarians, when appropriate and possible. The proportion of librarians and paraprofessional staff defined as “Recent Entrants”, “Mid-Career,” and “Senior” are displayed in Table C.6 by library sector.
One in five professional librarians have been working in their careers for less than 6 years, one quarter are in the middle of their careers (6 to 15 years), and more than half (54%) have been working for at least 16 years as a pro-fessional librarian. These proportions differ little between most sectors. Librarians working in non-profit libraries are, however, less likely to have been in their careers as long as the average (43% are senior librarians compared to 54% for the total sample), while school librarians tend to have been in their careers for a longer period (63% for more than 15 years). These sector variations generally follow the differences in age profiles (presented in Table C.9). The career stage patterns in Table C.6 also reflect the historical hiring patterns of Canadian librarians. For example, with one in five librarians recently being hired within a 5 year period of graduating, and only slightly more between the larger time span of 6 and 15 years used to define mid-career librarians, we have evidence of the hiring freezes and workforce reductions that took place in the 1990s. Similarly, the predominance of senior librarians in the Canadian workforce reflects the more active hiring trends in the decades prior to this.
Over half of professional librarians have been in their careers for more than 15 years.
Table C.6 also shows that paraprofessional staff have not been working in their careers for quite as long as profes-sional librarians, although a significant minority (44%) are still considered long-term (i.e., have worked in career for more than 15 years). CARL paraprofessionals are highly likely to be “senior” (54%). But, in contrast to the career stage distribution of school librarians, paraprofessionals working in school settings are one of the least likely (31%) of all groups to have worked for this length of time. Again, the school professional/paraprofessional career stage data demonstrate the recent preference for hiring paraprofessional rather than professional staff in this sector.
SECTION C: Workplace and Demographic Characteristics 43The Future of Human Resources in Canadian Libraries
Table C.6 Career Stage1 of Librarians and Paraprofessionals by Library Sector (Individual Survey)
Percent
Professional Librarians (n=2,102) Paraprofessional Staff (n=1,788)
Library SectorRecent Entrants
Mid-Career SeniorRecent Entrants
Mid-Career Senior
TOTAL SAMPLE 20 26 54 25 31 44
TOTAL ACADEMIC 20 26 54 18 28 54
CARL 20 24 56 14 27 59
Other Academic 20 30 50 25 30 45
TOTAL PUBLIC 17 26 57 29 32 39
CULC 16 27 57 29 28 43
Other Public 23 22 55 30 40 30
TOTAL SPECIAL 24 28 48 27 32 41
Government 20 30 50 23 37 40
Non-Profit 27 30 43 31 29 40
For-Profit 22 24 54 33 21 46
TOTAL SCHOOL 17 20 63 36 33 31
Source: 8Rs Canadian Library Human Resource Individual Survey1 Recent Professional Librarian Entrants are individuals who have been working as a professional librarian for less than 6 years, Mid-Career Professional Librarians have been working as a librarian for 6 to 15 years, and Senior Librarians for more than 15 years.
C.2 Demographic Characteristics
Discussions in the literature about a shortage of professionals are often interspersed with the need for libraries to build a more diverse workforce (Howland, 1999; Acree, Epps, Gilmore, & Henriques, 2001). The library sector, which may as a whole be a female-dominant field in terms of numbers, is still seen as not creating enough oppor-tunities for women and visible minorities, particularly in higher management. Canada-wide general labour force research demonstrates that males continue to dominate the uppermost ranks despite that females have made inroads into supervisory and middle-management positions (Hughes, 2000). Visible minority under-representa-tion has particular relevance with the Human Resources Development Canada (2002) prediction that by 2011, all net labour force growth in Canada will be supplied by immigrant workers. As our institutions and services are, to a certain extent, expected to mirror the demographics of our larger society, programs designed to enhance employment equity and diversity are of considerable importance. Libraries in particular are charged with provid-ing service access across cultures and demographics, which is enhanced by the presence of staff who understand cross-cultural issues. It is with these considerations in mind that we present the demographic characteristics of professional librarians and paraprofessional staff.
Overall, females are significantly more represented than males, with nearly eight in ten librarians being female (Table C.7). This is comparable to the gender ratio within all Canadian non-profit organizations where 75% are female (Saunders, 2004). Gender disparity is greatest among paraprofessionals, where females hold nine out of every ten positions. Librarian and paraprofessional staff working in academic libraries are the least likely to be female.
44 SECTION C: Workplace and Demographic Characteristics CANADIAN LIBRARY HUMAN RESOURCE STUDY
Table C.7 Percentage of Librarians and Paraprofessionals Female by Occupational Level and by Library Sector
(Individual Survey)
Percent
Professional Librarians (n=1,923)
Paraprofessional Staff (n=1,583)
Library Sector TOTAL Non-Management
/ Middle Management1
Senior Administration2 TOTAL
TOTAL SAMPLE 79 81 74 90
TOTAL ACADEMIC 74 77 64 85
CARL 73 75 59 83
Other Academic 77 79 71 89
TOTAL PUBLIC 83 85 76 94
CULC 85 86 71 93
Other Public 80 80 79 95
TOTAL SPECIAL 83 83 86 91
Government 82 81 89 95
Non-Profit 86 86 86 82
For-Profit 85 89 80 94
TOTAL SCHOOL3 84 87 -- 93
Source: 8Rs Canadian Library Human Resource Individual Survey1 Middle Management includes such positions as supervisor and branch or department head.2 Senior Administrator includes such top positions as head or chief librarian, director, or CEO or assistant head or chief librarian, director, or CEO or regional head.3 Results are not presented for Senior Administrators working in school libraries because of insufficient cases reporting.
The difference in female representation between non-management and management is only 7 percentage points; however, the disparity is somewhat greater in some sectors. Specifically, 41% of CARL senior administrators are males compared to the total sample figure of 26%. Although only 29% of CULC senior administrators are male, the difference between this group and non-management is 15%, which is somewhat above the total sample dif-ference of 7%. We can conclude, then, that all types of library staff are predominantly women, but that in the uppermost ranks of librarians they are less visible in the two largest types of libraries.
Table C.8 reveals that visible minorities are not well represented in Canadian libraries, comprising only 7% of the professional librarian labour force (compared to 14% in Canada‘s entire labour force). The largest proportion of visible minorities is found in non-profit and for-profit special libraries (11% and 10%, respectively), although this is still below the national average. Visible minorities are even less likely to be working as senior administrators, and this is the case for all but the government sector.
Aboriginal librarians are not well represented in the Canadian labour force (comprising 3% of the total labour force), but they are even less visible in the library community in all sectors and at all occupational levels. Visible minority and aboriginal representation among paraprofessional staff (Table C.9) is similarly below the national average in virtually all sectors.
SECTION C: Workplace and Demographic Characteristics 45The Future of Human Resources in Canadian Libraries
The limited sector variation in visible minority and aboriginal representation does not correspond with whether or not institutions have a hiring policy designed to recruit professionals from diverse ethnic and racial back-grounds (See Appendix Table C.6). For example, compared to the total institutional sample where only 28% have such a policy, 77% of CARL libraries report having a diversity policy, but their visible minority representation does not significantly depart from other sectors. These results suggest not only that libraries without diversity policies should consider implementing such a policy, but that those with a policy should look closely at how it is being implemented.
Table C.8 Percentage of Librarians Visible Minority and Aboriginal by Occupational Level and by Library Sector
(Individual Survey; n=1,910)
Percent
Visible Minority1 Aboriginal2
Library Sector TOTAL Non-Mngmt. / Middle Mngmt.3 Senior Admin. TOTAL Non-Mngmt./
Middle Mngmt.3 Senior Admin.
TOTAL SAMPLE 7 7 4 1 1 1
TOTAL ACADEMIC 6 7 2 1 1 2
CARL 7 8 0 2 2 3
Other Academic 6 7 3 1 1 0
TOTAL PUBLIC 7 7 3 1 1 1
CULC 8 8 2 1 1 0
Other Public 4 4 4 1 0 1
TOTAL SPECIAL 8 9 6 1 1 0
Government 6 6 9 1 1 0
Non-Profit 11 13 7 0 0 0
For-Profit 10 16 0 0 0 0
TOTAL SCHOOL4 6 0 -- 0 0 --
Sources: 8Rs Canadian Library Human Resource Individual Survey1 Visible Minorities include those who are non-Caucasian in race or non-white in colour (e.g., black, Asian, Middle Eastern, Hispanic).
2 Aboriginal individuals include those who identify themselves as Status Indian, Non-Status Indian, Métis or Inuit.3 Includes non-management, middle management and supervisors.4 Results are not presented for Senior Administrators working in school libraries because of insufficient cases reporting; however, they are included in the Total Sample results.
Currently, the MLIS from an American Library Association-accredited school is the base requirement for work as a professional librarian in most Canadian libraries. Still, we have little understanding of how organizations as-sess non-North-American credentials. This will undoubtedly be a point of concern as the immigrant labour force continues to grow, and as libraries may need to draw more frequently from this external labour pool.
46 SECTION C: Workplace and Demographic Characteristics CANADIAN LIBRARY HUMAN RESOURCE STUDY
The results of our study show, however, that less than three in ten libraries have a formal policy recognizing the credentials of librarians who have graduated from non-North American programs and even fewer (2%) current librarians obtained their degrees outside of North America. The latter finding suggests that little hiring of immi-grants is taking place within the library sector.
Table C.9 Percentage of Paraprofessionals Visible Minority and Aboriginal by Library Sector
(Individual Survey; n=1,575)
Percent
Library Sector Visible Minority1 Aboriginal2
TOTAL SAMPLE 7 2
TOTAL ACADEMIC 9 2
CARL 12 1
Other Academic 5 3
TOTAL PUBLIC 6 2
CULC 7 1
Other Public 4 4
TOTAL SPECIAL 6 1
Government 5 2
Non-Profit 9 1
For-Profit 3 0
TOTAL SCHOOL 3 1
Sources: 8Rs Canadian Library Human Resource Individual Survey1 Visible Minorities include those who are non-Caucasian in race or non-white in colour (e.g., black, Asian, Middle Eastern, Hispanic).2Aboriginals (including those who identify themselves as Status Indian, Non-Status Indian, Métis or Inuit).
The demographic composition of the library community is further depicted through a presentation of the age distribution of professional librarians and paraprofessional staff in Table C.10.
Professional librarians are most likely to be female (79%), Caucasian (93%), and over 45 years of age (65%).
SECTION C: Workplace and Demographic Characteristics 47The Future of Human Resources in Canadian Libraries
Table C.10 Age Category1 of Librarians and Paraprofessionals by Library Sector (Individual Survey)
Percent
Professional Librarians (n=1,886) Paraprofessional Staff (n=1,560)
Library Sector < 45 45-54 55+ < 45 45-54 55+
TOTAL SAMPLE 35 40 25 38 41 21
TOTAL ACADEMIC 34 39 27 36 40 24
CARL 32 39 29 33 42 25
Other Academic 38 37 25 42 36 22
TOTAL PUBLIC 34 44 22 42 38 20
CULC 34 47 19 42 38 20
Other Public 34 37 29 43 40 17
TOTAL SPECIAL 39 38 23 41 43 16
Government 37 37 26 42 47 11
Non-Profit 43 41 16 36 42 22
For-Profit 39 37 24 46 36 18
TOTAL SCHOOL 19 44 37 30 48 22
Source: 8Rs Canadian Library Human Resource Individual Survey1 Only 77% of respondents provided year of birth information from which age is derived.
One-quarter of librarians are 55 years of age and older. This is more than double the national average figure, where only 11% of Canadian workers are 55 years and over and higher than several other comparable profes-sionals; 15% of museum professionals, 13% of RNs, and 17% of college teachers are within this age category. Compared to teachers, 33% of whom are 50 years of age and older, 49% of professional librarians are at least 50 years old. The age distribution of librarians is also more heavily weighted in the older age categories compared to the entire non-profit sector; only 39% of employees in the non-profit sector are 45 years of age or older compared to 65% of librarians (Saunders, 2004). Similar or lower proportions of librarians are, however, 55 years of age or older compared to archivists (23%), medical specialists (25%) and professors (29%).10
Table C.10 demonstrates that school librarians are significantly older than other librarians, but also that librarians working in CARL and smaller public libraries have a somewhat older age profile than on average. CARL para-professional staff also tend to be older than those working in other sectors. In contrast, non-profit librarians have the youngest age profile with only 16% being 55 years of age or older, followed closely by CULC librarians, 19% of whom are in the oldest age category.
These age data have obvious implications for retirements which will be examined in much greater detail in Sec-tion E.
C.3 Strategic Human Resource Planning Implications
• Sixty-two percent of librarians are working in a managerial function, indicating a trend of employing librarians as managers and the shifting some of librarians’ traditional job responsibilities to non-MLIS staff.
10 The comparable data used in this paragraph are from Statistics Canada Canadian Socio-Economic Information Management System (CANSIM) tables and for archivist and museum professionals from the 8Rs report, “The Future of Heritage Work in Canada” (2004).
48 SECTION C: Workplace and Demographic Characteristics CANADIAN LIBRARY HUMAN RESOURCE STUDY
• A relatively high proportion of paraprofessionals working in part-time or temporary positions is a point of notice for library organizations. Taking a long view, which incorporates an understanding of anticipated retirement rates, institutions are advised to think about how they wish to configure the work status of their future workforce (understanding that there are other constraints, such as financial resources, collective agreements, etc.)
• While library work is female-dominated, we see that relatively higher proportions of senior administra-tors are male. This supports the premise that, as with many other female-dominated professions, though women have made inroads into supervisory and middle management positions, men are still more likely to become senior administrators; institutions should ensure that equal opportunities in the upper levels of management and leadership are presented to women in the workplace.
• Visible minorities and Aboriginal staff are under-represented across all types of libraries. Institutions need to consider diversity programs if they do not already have them and should explore recruitment strategies that actively attract minorities to their libraries. Institutions working with collective agreements should also examine how they promote or prohibit diversification of the workforce. This need for diversifying the workforce also has implications for educators, in terms of how they promote recruitment to MLIS and library technician programs. Associations, too, should consider a long-term role in promoting the profes-sion outside the predominantly Caucasian demographics.
• Few library policies recognizing the professional credentials of non-North American graduates seems to be resulting in the hiring of few immigrant librarians. A greater awareness and understanding of this is necessary within institutions as immigrants increasingly comprise a larger share of the Canadian labour force. Library associations need to consider how they can support institutions in assessing and recognizing degree and accreditation equivalencies.
• School librarians tend to be older than other groups of librarians, and may be first to retire; the question is whether these positions will continue to be defined as librarian positions or whether schools will sustain a trend of replacing librarians with library technicians and other library workers. Decision-makers must be reminded of the long-term implications of this replacement as investment in school libraries and in teacher-librarian positions are related to better student achievement, improved literacy and reading skills, and enhanced readiness to success in the post-secondary environment (Haycock, 2003).
SECTION D: Recruitment 49The Future of Human Resources in Canadian Libraries
S E C T I O N D
Recruitment
D.1 Introduction
Recruitment represents the pivotal point of organizational entry for library staff. Decisions about what kind of skills, knowledge, and abilities are needed, and how best to design positions and then select employees, play a central role in building library human resources and, ultimately, in sustaining library service. As libraries find themselves in increasingly complex economic, technical, social, cultural, and political environments, they are challenged to find new and more innovative ways of structuring their human resource functions. Within this context, one of the most critical exercises of human resource management is to attract and develop a library workforce suited to the organization’s unique needs and goals. For example, as jobs increasingly necessitate the ability to change and to learn new skills (i.e., skill flexibility), libraries are challenged to recruit in order to meet these needs.
Recruitment is not simply a question of filling open positions; it is more accurately an understanding of the best match of competencies and qualities of candidates with the organization’s goals. In Britain, for example, library researchers have noticed the rise of a trend of “an emphasis on the specific qualities, skills and abilities which candidates can offer, rather than possession of a single qualification” (Usherwood, et al., 2001, p. 49).
As is the case with most library human resource issues, the few existing studies tend to revolve around the need to recruit professional librarians, and there is less research on recruiting paraprofessional staff. Though the following discussion draws upon the librarian recruitment literature, we see no reason why many of the findings and con-clusions could not be applied to the recruitment of paraprofessional staff. Our own analysis of recruitment also focuses on the organization’s recruitment need, activity, and problems with respect to professional librarians. We do, however, examine the supply side of recruitment issues by providing results from the paraprofessional sample about their initial career experiences.
British researchers Goulding, Bromham, and Hannabuss (1999) investigated links between desired personal qual-ities and those found in new entrants to the profession (or those found lacking in new entrants). The traits that were found to be both desired and lacking in new professionals were: the ability to accept pressure, flexibility, and written communication skills. Other personal qualities found lacking were commitment to organizational goals, friendliness, reliability, energetic attitude, logic, ability to work with and for a range of colleagues, and confidence (p. 217-218). The authors assert that these “personality competencies” play an ever-larger role in determining what positions new graduates are hired into, as the sector moves farther into a service role.
In Canada, particular attention should be given to recruitment in light of the rural-urban divide found in librari-anship. Anecdotally, libraries located in regions outside of urban centres or in the remote north are thought to be faced with the problem of attracting library staff to their typically smaller libraries that cannot compete with
50 SECTION D: Recruitment CANADIAN LIBRARY HUMAN RESOURCE STUDY
the higher salaries offered in urban centres. Our own research supports the understanding that the vast majority of these are public libraries in which one or two employees run the entire organization, performing everything from programming to web maintenance to budgeting and marketing. In the least populated areas, furthermore, accredited professional librarians are scarce and library staff may be comprised of a library technician or of an individual who has learned librarianship entirely on the job.
Research undertaken in Australia’s Northern Territory (NT) might be a model with which to examine recruit-ment and retention to rural and/or northern areas. This research raises such issues as the lack of education pro-grams accessible in the NT, the high cost of living compared with often less well-paid employment in libraries, professional development challenges, and the difficulty of attracting professionals to remote areas, resulting in a need to “grow your own” library staff (Chmielewski, 2002).
Most often, recruitment is perceived as the hiring of new staff to the organization. Yet, we can also think about a broader recruitment need in terms of the enlistment of individuals to library careers. Many feel that problems with this kind of recruitment into librarianship stem from a poor and outdated image of the profession, or from a low job profile in attracting individuals from other fields (Rogers, 2003).
The overall goal of this section of the report is to examine the extent to which recruitment is a problem for most Canadian libraries. In doing so, we investigate the extent to which libraries are in need of hiring new librarians and how they assess their hiring experiences. The emphasis of the analysis is on the entire Canadian library situa-tion and on each library sector; however, we also examine the question of whether recruitment is more problem-atic in rural and remote regions of Canada, and the extent to which current library staff are interested in working in such regions, as well as in libraries outside of Canada. In recognizing that recruitment is more than just filling open positions, the section also includes an evaluative analysis of the match between the competencies needed by libraries and their ability to fulfill these competencies when recruiting. In the last sub-section of our examination of recruitment, we look at the early work experiences of those staff who have worked in their careers for less than 6 years. We begin the investigation, however, with an examination of recruitment to the librarian profession.
D.2 Recruitment to the Librarian Profession
External influences on the library industry include growth in information-related industry sectors and develop-ments in information technology, both contributing to fundamental change within the industry in recent decades. As our nation moves towards a knowledge-based economy, and with the implementation of new technologies within libraries, demands have increased for a wider range of information at a faster pace and from a broader cli-ent base. But the perceived low status of librarians and common stereotypes about the profession have not neces-sarily altered accordingly, no doubt contributing to problems in attracting new recruits to the profession.
Perceptions about libraries and the profession underpin concerns about recruitment, since they play heavily into the question of what attracts people to or deters them from library occupations. The library community is well aware of public misconceptions over their roles and status. The question of negative images of librarianship has been endlessly debated amongst professionals, and this concern is not unique to North America, but appears to be a preoccupation for librarians around the globe (Wu, 2003; Prins and Gier, 1994; Usherwood et al., 2001). Poor perceptions of librarianship are thought to impact negatively on the understanding of librarians’ professional status by the general public, as well as by librarians themselves.
While the American literature tends to discuss a recruitment crisis in terms of numbers, the Canadian research points to a lack of knowledge about the profession. Canadian research completed by Harris and Wilkinson (2001) demonstrates that non-MLIS students tend to be confused about the real content of the librarian’s job; nearly half surveyed stated that librarians were not involved in the production, distribution or management of information, and further accorded this profession very little prestige. This general ignorance regarding the realities of the li-brary workplace and the opportunities within is very likely a contributing barrier to the successful recruitment to the profession as a whole, irrespective of whether the problem is one of quantity or quality of candidates. One of the major issues that Chmielewski’s (2002) research revealed with respect to Australia’s Northern Territory was
SECTION D: Recruitment 51The Future of Human Resources in Canadian Libraries
that marketing and promotion of library work in Australia as a whole is sporadic and uncoordinated, thus exac-erbating problems for rural and remote areas; this may be the case for Canada as a whole.
Research demonstrates that popular stereotypes of librarians persist. Nilsen and McKechnie (2002) have demonstrated these perceptions in their extensive literature review the long history of public miscon-ceptions about librarians and the actual work they perform as well as librarians’ own anxieties regard-ing these perceptions. Nilsen and McKechnie further state that particular functions, such as collection development, acquisitions and cataloguing are the “hidden intellectual work” of librarianship, with the more mundane duties of library support staff to be the public face of the library, and therefore, of librarianship. We cannot only learn about what attracts or deters people from the profession by examining the perspectives of the general populace, but also by asking current librarians themselves what initially attracted them to the profes-sion. Information from 1,823 current professional librarians responding to the 8Rs individual survey on reasons for their choice can help inform efforts to recruit university students to library schools.
The sample of librarians from the 8Rs study were the most likely (49%) to indicate simply that they thought they would like what they would be doing in the job (Figure D.1). Many librarians in our individual sample also re-sponded to this question as we would expect: because they liked the idea of working in a career that would allow them to serve the public and/or the public good (45%) or because of their love of information gathering, books and reading, and their value of the importance of literacy and learning (42%).
Other respondents stated that they were attracted to the profession because they believed libraries offered good working conditions and a positive work environment (32%). A similar proportion (27%) indicated that they felt that library work fit well with their personality and interests.
It is implied from many of the responses to this question that a large portion of librarians were attracted to the profession after having the experience of working in libraries. One in five respondents stated this explicitly; many of whom commented on the positive aspects of their prior experience, while others reported that their experi-ence working as a paraprofessional in libraries helped them to recognize the better promotional opportunities, extrinsic rewards, and the greater power and control held by librarians, thereby prompting their decision to enter library school. A further 7% indicated that they had adopted a positive view of librarianship through their exposure to librarians, who were often their friends or family members, but also through contact with librarians during library visits. Given the public misconceptions of librarianship which must, in part, explain whatever problems are experienced in attracting people to the profession, and given these findings that experience work-ing in a library or exposure to librarians appears to obviate this distraction, we can conclude that one of the best predictors of becoming a librarian is positive contact with librarians or libraries.
52 SECTION D: Recruitment CANADIAN LIBRARY HUMAN RESOURCE STUDY
Figure D.1 Major Reasons for Choosing Professional Librarian Career1
(Individual Survey; n=1,823)
49
45
42
32
27
20
10
10
10
7
Liked what job entailed
Liked public service aspect (e.g. help others)
Love of or value literacy, learning, research
Good working conditions / environment
Good fit with personality / interests
Prior experience working in library
Limited alternative options
Portability of degree across variety of fields
Career upgrade / become professional
Positive view of librarianship
0 10 20 30 40 50 60Percent
Source: 8Rs Canadian Library Human Resource Individual Survey1 Based on categorized open-ended responses from professional librarians to the question: “Thinking back to when you first decided you wanted to be a librarian, what were your three main reasons for choosing the librarian profession?”
Figure D.1 also shows that one in ten respondents noted that their decision to enter librarianship was based on limited alternative options available to them, the portability of the MLIS across many different fields of work, or because they wanted to upgrade their undergraduate degree to a more marketable and applied profession or career.
Responses to the question of why librarians originally entered the profession help us to understand the underly-ing attractions to librarianship. Also illuminating, however, is what is absent in the responses. To this end, it is notable that none of the respondents mentioned that their initial reasons for entering the profession had anything to do with an interest in managing libraries, supervising others or in assuming a leadership role within the profes-sion.
Furthermore, an analysis of the major reasons for choosing the professional librarian career between recent li-brarian entrants (i.e., those who had been in their career for less than 6 years) and more senior librarians revealed no significant differences. The reasons provided in Figure D.1, therefore, endure over time since they apply to all librarians irrespective of the time-period when they were making their librarianship career decision.
One idea that is frequently proposed in the literature is that paraprofessionals comprise one of the most logical and readily available pools of candidates for the librarian profession. With this in mind, we present the results of a questions posed to paraprofessionals about their interest in obtaining an MLIS degree. If we are, in fact, to view paraprofessional staff as a viable pool of future librarians, we must first ascertain the level of interest among this segment of the library workforce.
Overall, 30% (n=413) of paraprofessional staff indicated that they are interested in obtaining an MLIS degree. Of these, nearly half indicated that lack of time (49%) or lack of the financial resources required to return to school full time and to pay school-related costs (48%) as a barrier (Figure D.2). One-third indicated that the reason why they had not yet obtained an MLIS degree was because of the geographic distance to one of Canada’s seven library schools. Many of these same respondents mentioned that they would be more likely to enroll in a program if it were offered online or through distance education.
One in five stated that they were not eligible for graduate level studies because they did not have an undergradu-ate degree or because their experience was not recognized in their attempts to gain entrance into the program.
SECTION D: Recruitment 53The Future of Human Resources in Canadian Libraries
Interestingly, only 6% of the paraprofessionals interested in obtaining an MLIS degree stated that a barrier to their obtaining MLIS degree as their own indecisiveness or lack of initiative/motivation to go forward with furthering their library credentials to the professional level. Clearly, there are primarily structural barriers to pursuing an MLIS for current paraprofessionals.
Figure D.2 Major Barriers to MLIS degree Obtainment Among Paraprofessional Staff1
(Individual Survey; n=413)
49
48
33
21
Lack of Time
Lack of Money
Geographic Distance
Inadequate/Unrecognized Credentials
0 20 40 60 80 100
Percent
47
46
38
29
Too late in career
Job not attractive
Distance/time/money/credentials
Content with current job
0 10 20 30 40 50 60
Percent
41
20
16
22
17
Scarcity of Canadian Positions
Good Position/Opportunity Offered
Better Salary Elsewhere
To Gain Life/Work Experience
Applied Everywhere
0 10 20 30 40 50
Percent
Source: 8Rs Canadian Library Human Resource Individual Survey1 Based on categorized open-ended responses from paraprofessional staff indicating that they are interested in obtaining an MLIS degree, to the question: “What, if anything, has prevented you from obtaining an MLIS degree to date?”
Of the 929 (70%) paraprofessional staff who indicated that they are not interested in obtaining an MLIS degree, the predominant reason (47%) for their answer was simply that they are too late in their career to consider such a change (Figure D.3). A similar proportion (46%) indicated that they were not interested because they perceive the librarian career to be unattractive as, for example, it is an overworked, underpaid, and under-valued profession. A significant minority (38%) of those who are not interested in obtaining this degree cited geographic distance/inadequate time, finances, or credentials as their reasons. Viewed together, these distance, time, money, and cre-dential barriers are offered as reasons why paraprofessionals have not obtained an MLIS (irrespective of whether they are interested or not) by 5 in every 10 of the total paraprofessional sample.
Notably, 29% of those that did not express an interest in obtaining an MLIS degree stated that they felt this way because they are content with their current job.
Three in ten paraprofessionals are interested in becoming a professional librarian, but are often not doing so because of limited access to library schools.
Figure D.3 Major Reasons Paraprofessional Staff Not Interested in Obtaining MLIS Degree1
(Individual Survey; n=929)
47
46
38
29
Too late in career
Job not attractive
Distance/time/money/credentials
Content with current job
0 10 20 30 40 50 60
Percent
Source: 8Rs Canadian Library Human Resource Individual Survey1 Based on categorized open-ended responses from paraprofessional staff indicating that they are not interested in obtaining an MLIS degree, to the question: “Please explain why you are not interested in obtaining an MLIS degree?”
54 SECTION D: Recruitment CANADIAN LIBRARY HUMAN RESOURCE STUDY
These results about the paraprofessional’s attraction to pursuing an MLIS degree suggest that while many are simply not interested, a large portion are not doing so because of limited access to the programs. We might also extrapolate these findings to explain why non-library individuals do not pursue professional librarian careers. In contrast to such equivalent professions as teaching and nursing, with only seven library schools across a country as vast as Canada the librarian profession has a more closed gatekeeping device with respect to credentials. This is not to say that these credentials are without merit insofar as they promote and preserve the professional status of librarianship. However, even if an individual is interested in becoming a professional librarian, limited access to library programs is clearly a deterrent; candidates must first have a four-year undergraduate degree, more than likely be willing to relocate to one of the cities in which library programs are located, have the ability to finance their education, and have two consecutive years free needed to complete the program. As MLIS students are generally of an average age range from 30-34 years old (ALISE, 2002 and ALISE, 2003) the mobility and flexible time requirements may be even less realizable for an older and possibly married (or with children) demographic. Hence, when assessing recruitment to the librarian profession, consideration must not only be placed on public perception of the profession, but also on accessibility to the profession.
D.3 Demand Side Recruitment Issues (Organizational Recruitment)
I Recruitment Need, Activity, and Ability by SectorIn this section, we shift the analysis from recruitment to the profession to recruitment to the organization. Table D.1 presents the 2002 librarian recruitment needs and activities of Canadian libraries from the institutional sur-vey conducted in 2003. Answering a question that asked for comparison to 5 years previous, 40% of organiza-tions indicated an increased need to hire librarians (column 1), while a slightly smaller proportion (36%) actually recruited librarians in 2002 (column 2). An even smaller percentage (23%) of libraries reported that their current ability to recruit is “poor” (column 3).
Overall, these results suggest a somewhat stable need to recruit accompanied by modest recruitment activity and minor levels of recruitment difficulty. This conclusion, however, does not hold for all library sectors. Notably, a large proportion of CARL and CULC libraries had an increased need to hire librarians (73% and 81%, respec-tively) and were the most likely of all sectors to have hired (85% and 84%, respectively). In contrast, only 17% of government libraries expressed an increased need to recruit (compared to 5 years ago) and recruited librarians in 2002.
When examining the combined results of the need to recruit and actual recruitment, the most predominant pat-tern capturing 47% of libraries is one of a stable or decreased need to recruit and no recruitment activity in 2002 (see Appendix Table D.1). The second most common pattern exemplified by 23% of institutions is an increased demand for librarians and the recruitment of at least one librarian in 2002. Special libraries are most likely to follow the first pattern of no need and no recruitment activity, while CARL and CULC libraries predominantly follow the more active second recruitment pattern described here.
In 2002, Canadian libraries experienced modest recruitment activity and minor levels of recruitment difficulty.
When recruitment difficulties are factored into the analysis, several other patterns are evident. For example, CARL libraries have a high demand for new recruits, the majority were able to recruit, and only 8% expressed dif-ficulties recruiting. Other academic and non-profit libraries, on the other hand, while expressing a higher-than-average increased need to recruit, were less likely than other sectors to have recruited librarians in 2002; perhaps as a consequence, they were more likely to experience difficulties recruiting. The results for CULC, however, are a bit more complex; recruitment need appears to be met with actual recruitment, but at relatively higher levels of difficulty (28%).
SECTION D: Recruitment 55The Future of Human Resources in Canadian Libraries
Table D.1 Recruitment Need1 and Activity2 by Library Sector (Institutional Survey; n=278)
Percentage of Organizations
Library Sector Increased Need to Hire Librarians1 Hired Librarian(s) in 20022 Poor Current Ability
to Recruit3
TOTAL 40 36 23
TOTAL ACADEMIC 51 46 22
CARL 73 85 8
Other Academic 41 29 29
TOTAL PUBLIC 41 42 23
CULC 81 84 28
Other Public 29 31 22
TOTAL SPECIAL4 27 17 23
Government 17 17 17
Non-Profit 36 17 29
Source: 8Rs Canadian Library Human Resource Institutional Survey1Includes those responding “increased” to the question: “Has your organization’s need to hire new professional librarians increased, decreased, or remained stable compared to 5 years ago?”2Includes those hiring at least one professional librarian between January 1, 2002 and December 31, 2002.3 Based on “1” and “2” responses on a 5-point scale, with “1” meaning “poor” and “5” meaning “excellent” to the question: “How would you rate your current ability to recruit qualified professional librarians?” 4 Results for For-Profit libraries are not presented because of insufficient cases reporting, however, they are included in the Total Special results.
These findings suggest that problems with recruitment can either be associated with an unmet need to fill librar-ian positions (as in the case with other academic and non-profit libraries) or, as in the case of CULC members, from other factors. We explore these “other factors” or barriers to recruitment in the following section.
II Barriers to RecruitmentThe above results provide an indication of which library sectors are experiencing recruitment difficulties. Keeping in mind that the majority of libraries did not express a great deal of difficulty when recruiting librarians, we pres-ent an analysis of the major barriers to recruitment. This information permits a causal analysis of major reasons why libraries are facing difficulties recruiting. Respondents were invited to indicate the extent to which a list of 16 items prevented them from hiring qualified professional librarians. Tables D.2a and D.2b capture the percent-age of institutional respondents indicating the most commonly reported barriers (i.e., a barrier “to some” or “to a great extent”), for the total sample and for each library sector.
An analysis of the results in the two tables reveals a few key points. First, though some sector variation exists, budget restraints are the most significant for all library sectors. Second, CARL libraries are, as we might expect, less likely than other sectors to indicate that any of the barriers prevent them from hiring qualified professional librarians. Not only are CARL libraries hiring more extensively and not experiencing problems recruiting, but they are not faced with as many barriers to recruitment as the rest of the Canadian library community.
Third, the same conclusion unfortunately does not hold for CULC libraries. Although CULC libraries are hiring to meet their needs at a similar rate as CARL libraries, they are experiencing more difficulties in doing so and are faced with a greater range of barriers. Indeed, for some of the items, the greatest proportion of those reporting it as a barrier is found among CULC libraries. Several of these are related to the supply of candidates; two-thirds reported that an inadequate pool of qualified candidates prevented them from hiring professional librarians and 58% responded similarly with respect to the interest of candidates.11 CULC members were also the most likely (44%) to indicate “inadequate MLIS education” as a barrier. Another area of concern for CULC is competition
11 CULC libraries were also the most likely of all sectors to report that applicants for professional librarian positions are less qualified than they were 5 years ago (15% compared to 6% for the total sample—see Appendix Table D.4).
56 SECTION D: Recruitment CANADIAN LIBRARY HUMAN RESOURCE STUDY
for librarians from other Canadian libraries (62%) and from American libraries (54%). This large and important segment of the library community, therefore, appears to be faced with the problem of a supply shortage, in part because competition for librarians is won out from other sectors (both inside and outside of Canada).
The most logical major competitor for CULC libraries is academic libraries. Results from another question sup-port this conclusion: when asked about where departing librarians are most likely to work, the second most com-mon response among CULC members (after public libraries) was academic libraries (27%). But only 4% of CARL libraries indicated that their departing librarians left to work in a public library.
The major barrier to recruitment is that of budget restraints (80%); however, over half of libraries also cited the small size of their library, an organizational hiring freeze, inadequate librarian pay, geographical location, and an inadequate pool of interested and of qualified candidates as a barrier.
Table D.2a Barriers to Recruitment1 by Library Sector (Institutional Survey; n=250)
Percent Reporting as a Barrier to “Some” or “Great” Extent
Library SectorBudget
Restraints
OrganizationalHiring Freeze /
Limitation
Inadequate Librarian Pay
Inadequate Pool of
Qualified Candidates
Inadequate Pool of
Interested Candidates
Inadequate MLIS Education
TOTAL 80 54 54 51 50 29
TOTAL ACADEMIC 80 50 36 41 42 22
CARL 69 27 23 36 40 15
Other Academic 86 62 42 43 43 26
TOTAL PUBLIC 78 49 70 63 61 34
CULC 73 32 69 69 58 44
Other Public 80 54 70 61 62 31
TOTAL SPECIAL2 81 66 52 44 41 29
Government 83 60 46 33 37 26
Non-Profit 81 75 63 56 50 34
Source: 8Rs Canadian Library Human Resource Institutional Survey1 Based on “3,” “4,” and “5” responses on a 5-point scale with “1” meaning “to no extent” and “5” meaning “to a great extent” to the question: “To what extent do the following issues prevent you from hiring qualified professional librarians?”2 For-Profit results are not presented because of insufficient cases reporting; however, they are included in the Total Special results.
SECTION D: Recruitment 57The Future of Human Resources in Canadian Libraries
Table D.2b Barriers to Recruitment1 by Library Sector (Institutional Survey; n=250)
Percent Reporting as a Barrier to “Some” or “Great” Extent
Library SectorCanadian
CompetitionU.S.
Competition
Need to Hire
Bilingual Staff
External Hiring Policy Restrictions
Small Size of Library
Geographical Location
TOTAL 49 34 26 29 60 52
TOTAL ACADEMIC 37 20 13 18 46 47
CARL 36 19 19 23 12 35
Other Academic 38 20 10 16 63 54
TOTAL PUBLIC 60 45 22 29 62 63
CULC 62 54 23 39 27 46
Other Public 59 42 22 25 74 68
TOTAL SPECIAL2 45 33 44 41 70 41
Government 44 35 52 50 66 30
Non-Profit 47 34 44 39 78 50
Source: 8Rs Canadian Library Human Resource Institutional Survey1 Based on “3,” “4,” and “5” responses on a 5-point scale with “1” meaning “to no extent” and “5” meaning “to a great extent” to the question: “To what extent do the following issues prevent you from hiring qualified professional librarians?”2 For-Profit results are not presented because of insufficient cases reporting; however, they are included in the Total Special results.
Tables D.2a and D.2b further reveal that smaller public libraries are also experiencing similar supply-side barriers to their successful recruitment. In addition, however, the small size of the library and geographical location are viewed as recruitment barriers by a larger-than-average proportion of small public libraries. These findings need to be tempered with the understanding that, as shown previously in Table D.1, public libraries’ need to hire and their actual hiring is relatively limited, and their expressed difficulties with recruitment are not especially alarm-ing.
With respect to special libraries, issues that stand out as barriers to recruitment include working under a hiring freeze or limitation and the need to hire bilingual staff. The latter barrier is especially prevalent among govern-ment libraries, which are also much more likely to be faced with a policy that limits hiring from outside the or-ganization. Non-profit libraries are also further hampered by the inadequate pay provided to librarians and the small size of their organization, implying simply that there is no room to accommodate growth in their librarian staffing complement.
Overall, these results demonstrate that Canadian libraries cannot be viewed as a single, cohesive entity, at least with respect to their recruitment needs, activities, difficulties, and barriers. CARL libraries defy the experiences of most other libraries, so much so that we conclude that recruitment is not one of their 8Rs, at least in terms of meeting their numerical demand for librarians. CULC libraries, on the other hand, are faced with a tight labour market in which they are vying primarily with CARL and other academic libraries to access a sufficient number of adequately and appropriately trained librarians. In the smaller libraries of this nation is yet another story; one which is typified by little recruitment need and activity. These libraries are, however, faced with a perennial finan-cial problem and are handicapped simply because of their small size.
These findings portray the general landscape of recruitment in Canadian libraries, and in doing so reveal great variation across types of libraries. Given the variability in recruitment needs and experiences, a sector-wide call to modify recruitment strategies would be inappropriate. Having said this, however, distinct library sectors (e.g., special libraries, small public libraries in remote areas) could collectively look at strategies to improve their re-cruitment prospects and to communicate their particular circumstances to government and funding agencies.
58 SECTION D: Recruitment CANADIAN LIBRARY HUMAN RESOURCE STUDY
III Competency Demand-Supply MatchThe results on recruitment presented in this report so far speak only indirectly to the quality of candidates ap-plying for library positions. A small majority of libraries (but a larger majority of public libraries) feel that “an inadequate pool of qualified candidates” prevented them from hiring librarians. Results from another question asking about the qualifications of applicants compared to 5 years ago, however, suggest that the problem lies more so in the size of the candidate pool than it does in the quality of candidates themselves (although public libraries are less likely to hold this view).12 Adding another important element to the evaluation of librarian recruitment candidates are the competencies needed by organizations and their ability to fulfill these competencies when re-cruiting. The institutional survey results displayed below represent an analysis of the match or mismatch between competency supply and demand when recruiting professional librarians.
Respondents were provided with a list of 23 competencies and asked to rate the importance of each when making recruiting decisions as well as their ability to fulfill the competency. Table D.3 presents the ranked order of the 10 most important AND most difficult to fulfill competencies for the total sample of libraries.
An overall glance at the list of competencies shows that many of them are characteristics or personality traits rather than skills per se. This finding is in accordance with Goulding et al.’s (1999) research which revealed that “personality competencies” play an ever greater role in determining the placement of recent graduates into the library system.13
Turning back to the ranking of individual competencies presented in Table D.3, leadership potential is the most important and most difficult to fulfill competency reported by the largest proportion of libraries. Although fur-ther down the list, managerial skills are also important and difficult to fulfill requirements of libraries. These find-ings are one of many indicators provided throughout the report demonstrating that leadership and management are increasingly important competencies required by libraries across the country. The emphasis on leadership and management are also in accord with the British situation discussed in the introduction, in which these business and entrepreneurial qualities are increasingly found to be needed by libraries (Usherwood et al. 2001). To a large extent, therefore, the fit between the demand and supply of competencies is about the fit between the changing needs of libraries in the 21st century, and the ability of all librarians to carry this mandate forward with their leadership, management, and other core competencies.
12 Over 40% of institutional respondents reported that current applicants to professional librarian positions were more qualified than five years ago and only 6% indicated that they were less qualified. Public libraries and especially CULC members were less likely to provide this favourable opinion (only 28% of public libraries felt that applicants were more qualified).
13 Although the 8Rs findings correspond with the overall conclusions of Goulding et al (1999), we did not find, as did they, that commitment to the organizational goals, friendliness, reliability and being logical as traits that were important but difficult to fulfill. Both studies did, however, conclude that communication skills and flexibility were highly-demanded qualities that were lacking in candidates.
SECTION D: Recruitment 59The Future of Human Resources in Canadian Libraries
Table D.3 Ranking of the Ten Most Important1 AND Difficult to Fulfill2 Competencies (Institutional Survey; n=226)
RANKING3 COMPETENCY
1 Leadership potential
2 Can flexibly respond to change
3 Can handle high volume workload
4 Innovative
5 Technology skills
6 People skills
7 Managerial skills
8 Communication skills
9 Can deal with range of users
10 Entrepreneurial skills
Source: 8Rs Canadian Human Library Resource Institutional Survey1 Based on respondents’ ratings of each competency on a 5-point scale with “1” meaning “not at all important” and “5” meaning “very important” in response to the question: “Rate how important the competency is when you are making recruiting decisions about professional librarians.” 2 Based on respondents’ ratings of each competency on a 5-point scale with “1” meaning “very easy to fulfill” and “5” meaning “very difficult to fulfill” in response to the question: “Rate the level of ease or difficulty you have experienced in trying to fulfill these competencies.”3Respondents indicating the top 10 (out of 23) competencies as most important AND most difficult to fulfill are presented in this table.
The literature cites two common definitions for leadership skills and management skills, respectively:
Leadership involves taking initiative and making things happen through the effective action of others. Skills important for leadership include negotiating, networking, motivating, fundraising, having a future vision, and a strong community involvement.
Management involves structuring one’s own activities and those of others; coordinating the use of resources to maximize productivity and efficiency. Areas of concern include personnel (including staff development), planning and budgeting, and operations. (Young, Powell, and Hernon, 2002)
The ability to respond flexibly to change is ranked as the second most important and difficult to fulfill compe-tency. The importance of this capability is not surprising given the dynamic and changing nature of libraries and librarianship in the past decade. Next on the list of traits that are both desired and lacking in candidates is the abil-ity to handle a high volume of work. Again, the need for this ability is understandable given the greater demands placed on contemporary libraries, often under conditions of fewer resources. In fact, similar explanations can be found to justify the importance of other competencies listed in Table D.3.
When hiring, leadership potential, the ability to respond flexibly to change and the ability to handle a high volume of work are the most important and most difficult to fulfill competencies.
The fact that these competencies and characteristics are difficult to find in candidates, however, is an issue that should not be ignored by human resource administrators and organizational trainers. Library schools too would benefit from this information, not only when designing curriculum but also when recruiting students to their programs. Those considering entering the profession should recognize that their careers will not be limited to serving the public nor to immersing themselves in the world of books and information, but that they will be required to actively and innovatively participate in the creation of the 21st century library, and to manage all the elements implied by this change.
60 SECTION D: Recruitment CANADIAN LIBRARY HUMAN RESOURCE STUDY
Once again, the applicability of these overall conclusions needs to be assessed on a sector-by-sector basis. The se-ries of three tables below presents the ranked 10 most important and difficult to fulfill competencies for academic libraries (Table D.4a), public libraries (Table D.4b) and special libraries (Table D.4c).
Compared to prior sector analysis of differences in recruitment, the ranking results presented in the three tables demonstrate a much greater degree of inter-sector concurrence. All library sectors viewed the ability to flexibly respond to change and the ability to handle a high volume of work as important competencies that were difficult to find in librarian candidates. In all but non-profit libraries, leadership potential and managerial skills are ranked within the top three competencies. Although not as important and difficult to fulfill, communication and people skills made the list in all but CULC libraries. Technology skills were also found to be important to every sector but government.
Skills that were unique to sectors include specialist skills among CARL libraries, and organizational commit-ment and an MLIS degree among CULC libraries. Special libraries are notable for the importance attached to the ability to deal with a range of users and the perceived deficiencies in this ability among candidates for librarian postings.
Again, however, despite these sector variations we can conclude that virtually all types of libraries in the Canadian system are finding it the most difficult to fulfill their leadership, managerial, flexibility, innovativeness, technology and workload needs.
Table D.4a Ranking of Ten Most Important1 AND Most Difficult2 to Fulfill Competencies When Recruiting Librarians Among Academic Libraries
2. Can flexibly respond to change Can flexibly respond to change Managerial skills
3. Managerial skills Managerial skills Can flexibly respond to change
4. Innovativeness Innovativeness Innovativeness
5. Communication skills Communication skills Can handle high volume workload
6. Entrepreneurial skills Entrepreneurial skills People skills
7. People skills Specialist skills Technology skills
8. Technology skills Technology skills Communication skills
9. Can handle high volume workload People skills Entrepreneurial skills
10. Commitment to organizational goals Can handle high volume workload Generalist skills
Source: 8Rs Canadian Library Human Resource Institutional Survey1 Based on respondents’ ratings of each competency on a 5-point scale with “1” meaning “not at all important” and “5” meaning “very important” in response to the question: “Rate how important the competency is when you are making recruiting decisions about professional librarians.” 2 Based on respondents’ ratings of each competency on a 5-point scale with “1” meaning “very easy to fulfill” and “5” meaning “very difficult to fulfill” in response to the question: “Rate the level of ease or difficulty you have experienced in trying to fulfill these competencies.”3Respondents indicating the top 10 (out of 23) competencies as most important AND most difficult to fulfill are presented in this table.
SECTION D: Recruitment 61The Future of Human Resources in Canadian Libraries
Table D.4b Ranking of Ten Most Important1 AND Most Difficult to Fulfill2 Competencies When Recruiting Librarians Among Public Libraries
Source: 8Rs Canadian Library Human Resource Institutional Survey1 Based on respondents’ ratings of each competency on a 5-point scale with “1” meaning “not at all important” and “5” meaning “very important” in response to the question: “Rate how important the competency is when you are making recruiting decisions about professional librarians.” 2 Based on respondents’ ratings of each competency on a 5-point scale with “1” meaning “very easy to fulfill” and “5” meaning “very difficult to fulfill” in response to the question: “Rate the level of ease or difficulty you have experienced in trying to fulfill these competencies.”3Respondents indicating the top 10 (out of 23) competencies as most important AND most difficult to fulfill are presented in this table.
Table D.4c Ranking of Ten Most Important1 AND Most Difficult to Fulfill2 Competencies When Recruiting Librarians Among Special Libraries
(Institutional Survey; n=57)
Rank3 TOTAL SPECIAL4 GOVERNMENT NON-PROFIT
1. Can flexibly respond to change Innovativeness Can flexibly respond to change
2. Innovativeness Leadership potential Can deal with range of users
3. Can deal with range of users Managerial skills Can handle high volume workload
4. Can handle high volume workload Can handle high volume workload People skills
5. People skills Can flexibly respond to change Communication skills
6. Communication skills People skills Technology skills
7. Generalist skills Communication skills Generalist skills
8. Technology skills Can deal with range of users Innovativeness
9. Leadership potential Years of experience Can learn new skills
Source: 8Rs Canadian Library Human Resource Institutional Survey1 Based on respondents’ ratings of each competency on a 5-point scale with “1” meaning “not at all important” and “5” meaning “very important” in response to the question: “Rate how important the competency is when you are making recruiting decisions about professional librarians.” 2 Based on respondents’ ratings of each competency on a 5-point scale with “1” meaning “very easy to fulfill” and “5” meaning “very difficult to fulfill” in response to the question: “Rate the level of ease or difficulty you have experienced in trying to fulfill these competencies.”3 Respondents indicating the top 10 (out of 23) competencies as most important AND most difficult to fulfill are presented in this table.4 Results for For-Profit libraries are not presented because of insufficient cases reporting; however, they are included in the Total Special results.
IV Geographic Analysis of RecruitmentWe conclude our demand-side examination of recruitment by examining variations in the recruitment needs, activities, difficulties, and barriers between libraries located in different geographic zones of the country.
Beginning with the difference between provinces/regions, Table D.5 reveals some variation in recruitment need and activity. Although the provincial/regional differences are not as great as those found between sectors (Table D.1), a few notable distinctions can be made. British Columbia, for example, has a relatively high need to recruit
62 SECTION D: Recruitment CANADIAN LIBRARY HUMAN RESOURCE STUDY
(47% compared to 40% for the total sample), recruited at above-average levels in 2002 (47% compared to 36% for the total sample), and experienced below average difficulties in doing so (9% compared to 23% for the total sample). In contrast, libraries located in the provinces of Saskatchewan and Manitoba, though having a moderate increase in their need to hire (35%) and hiring at average rates (37%), were the most likely of all regions to experi-ence problems recruiting (38%).
Table D.5 Recruitment Need and Activity by Province/Region1
(Institutional Survey; n=278)
Percent of Organizations
Province/RegionIncreased Need
to Hire2Recruited Librarian(s) in
20023Poor Current Ability to
Recruit4
TOTAL 40 36 23
British Columbia 47 47 9
Alberta 48 32 22
Saskatchewan/Manitoba 35 37 38
Ontario 44 36 21
Quebec 31 22 27
Maritimes 30 46 26
Source: 8Rs Canadian Library Human Resource Institutional Survey1 Separate results are not presented for the northern territories because of insufficient cases reporting, but they are included in the totals. 2 Based on responses of “increased” to the question: “Has your organization’s need to hire new professional librarians increased, decreased, or remained stable compared to 5 years ago?”3 Includes those hiring at least one professional librarian between January 1, 2002 and December 31, 2002.4 Based on “1” and “2” responses on a 5-point scale with “1” meaning “poor” and “5” meaning “excellent” to the question: “How would you rate your current ability to recruit qualified professional librarians?”
Libraries located in Saskatchewan and Manitoba are the most likely to experience recruitment difficulties, primarily because of their geographic location.
Saskatchewan and Manitoba libraries are the most likely to report geographically-relevant barriers to their suc-cessful recruitment. As shown in Table D.6, libraries located in these two central Canadian provinces are very likely to be prevented from recruitment because of their geographical location (83%), small size of their libraries (74%), an inadequate pool of qualified (71%) and interested (71%) candidates and inadequate professional librar-ian pay (71%). British Columbia, Ontario, and Quebec are much less likely to report these items as barriers. The one exception is the recruitment influence of a hiring freeze or limitation in Ontario and Quebec (64% and 67%, respectively).
Libraries located in Alberta and the Maritimes are also somewhat more likely to indicate that their recruitment efforts are limited because of their geographical location (63% and 66% respectively), the small library size (69% for both), and inadequate pay (85% and 62%, respectively). The very high propensity of Alberta library adminis-trators indicating that the inadequate pay offered to professional librarians prevents their successful hiring does not equate with the salaries in this province. In Alberta, professional librarian salaries and librarians’ salary sat-isfaction levels do not significantly depart from the Canadian average (Tables I.7a and I.7b). The lower library salaries in the Maritimes shown in Table I.7a, however, do fit with the slightly larger than average proportion of administrators indicating that inadequate salary prevents them from hiring qualified librarians (Table D.6).
SECTION D: Recruitment 63The Future of Human Resources in Canadian Libraries
Table D.6 Major Barriers to Recruitment1 by Province/Region2
(Institutional Survey; n=250)
Percent Reporting as a Barrier to “Some” or “Great” Extent
Province/RegionGeographical
LocationSmall Size of
Library
Inadequate Pool of Qualified Applicants
Inadequate Pool of Interested Candidates
Hiring Freeze / Limitation Inadequate Pay
TOTAL 52 59 51 50 54 55
British Columbia 39 50 50 44 49 59
Alberta 63 69 48 52 44 85
Saskatchewan/Manitoba 83 74 71 71 38 71
Ontario 48 54 56 52 64 49
Quebec 38 56 35 34 67 33
Maritimes 66 69 55 59 35 62
Source: 8Rs Canadian Library Human Resource Institutional Survey1 Based on “3,” “4,” and “5” responses on a 5-point scale with “1” meaning “to no extent” and “5” meaning “to a great extent” to the question: ”To what extent do each of these 15 issues prevent you from hiring qualified professional librarians?” 2 Northern territory results are not presented separately because of insufficient cases reporting; however, they are included in the total.
These provincial analyses of recruitment tell a somewhat predictable story vis-a-vis the more difficult recruitment experiences of Saskatchewan and Manitoba libraries. A bit less expected, however, are the relatively trouble-free recruitment experiences of British Columbia libraries. The desirable geography and climate within much of Brit-ish Columbia (combined with the fact that it contains a library school) likely has some bearing on the below-aver-age recruitment difficulties in this province.
Table D.7 presents the same recruitment results for libraries located in rural and remote, mid-sized urban, and large urban regions of the country (see Fig. B.1 for a breakdown of the sample of libraries located in large urban, mid-sized urban, and rural regions for each province and Appendix Table B.1 for a list of Canada’s CMAs and CAs that comprise large and mid-sized urban libraries, respectively).
Though rural and remote libraries were half as likely as urban libraries to need to recruit more professional li-brarians (23% compared to 42% for mid-sized urban and 43% for large urban libraries), they are just as likely to have recruited in 2002 (33% compared to 32% for mid-sized urban and 37% of large urban libraries). But the important observation to make in Table D.7 is that rural and remote libraries are no more likely than large urban libraries to have experienced problems recruiting, with just over one in five (22%) libraries within both locations indicating that they have a “poor” ability to recruit librarians. These results, therefore, do not strongly support the notion that rural libraries are disproportionately experiencing greater recruitment problems than their ur-ban counterparts. Interestingly, however, mid-sized urban libraries are the most likely to report a poor ability to recruit (28%).
64 SECTION D: Recruitment CANADIAN LIBRARY HUMAN RESOURCE STUDY
Table D.7 Recruitment Need and Activity by Urban/Rural Location1
(Institutional Survey; n=278)
Percent of Organizations
Urban/Rural LocationIncreased Need
to Hire2Recruited Librarian(s) in
20023Poor Current Ability to
Recruit4
TOTAL 40 36 23
Rural / Remote Libraries 23 33 22
Mid-Sized Urban Libraries (CAs) 42 32 28
Large Urban Libraries (CMAs) 43 37 22
Source: 8Rs Canadian Library Human Resource Institutional Survey1 “Rural and Remote” is defined as communities with a core population of less than 10,000, plus the northern territories, “Mid-Sized Urban,” corresponds to Statistics Canada’s Census Agglomerate definition and has a population size between 10,000 and 99,999, including all neighbouring municipalities where 50% or more of the labour force commutes into the urban core, and “Large Urban” corresponds to Statistics Canada’s Census Metropolitan Area definition of a population of at least 100,000, including all neighbouring municipalities where 50% or more of the labour force commutes into the urban core.2 Based on responses of “increased” to the question: “Has your organization’s need to hire new professional librarians increased, decreased, or remained stable compared to 5 years ago?”3 Includes those hiring at least one professional librarian between January 1, 2002 and December 31, 2002.4 Based on responses of “1�ent ability to recruit qualified professional librarians?”
Keeping in mind that rural and remote libraries are not experiencing more difficulties recruiting than urban libraries, Table D.8 demonstrates that the source of their recruitment problems differ from urban libraries in a way that we would expect. In fact, for most barriers, as “rurality” increases, so too does the likelihood of it being a barrier to recruitment. For example, 42% of large urban libraries, 67% of mid-sized urban libraries, and 74% of rural and remote libraries report that the geographic location of their library prevents them from hiring qualified professional librarians. The results presented in Table D.8 indicate that rural libraries, because of their geographic location, typically smaller size, and lower salaries, are not able to attract a sufficiently-sized pool of interested candidates for positions when they arise.
Rural libraries are no more likely than their urban counterparts to experience difficulty recruiting, but they do experience more barriers to recruitment, especially those stemming from their geographic location and small library size.
We must remember, however, that these barriers are exhibited within an environment of relatively low recruit-ment need and activity. In short, although rural and remote libraries are more likely to have barriers that prevent them from recruiting, since their demand for librarians is relatively low, the barriers are of less consequence than they are for those library sectors that cannot meet their higher levels of librarian demand (e.g., CULC).
SECTION D: Recruitment 65The Future of Human Resources in Canadian Libraries
Table D.8 Major Barriers to Recruitment1 by Urban / Rural Location2 (Institutional Survey; n=250)
Percent Reporting as a Barrier to “Some” or a “Great Extent”
Barriers to Recruitment Total Rural and Remote Libraries
Mid-Sized Urban Libraries
Large Urban Libraries
Geographic location 52 74 67 42
Small size of library 59 81 74 49
Inadequate pool of qualified candidates 51 55 54 49
Inadequate pool of interested candidates 50 67 54 44
Hiring freeze / limitation 54 62 45 55
Inadequate librarian pay 55 76 57 48
Source: 8Rs Canadian Library Human Resource Institutional Survey1 Based on “3,” “4,” and “5” responses on a 5-point scale with “1” meaning “to no extent” and “5” meaning “to a great extent” to the question: “To what extent each of these 15 issues prevent you from hiring qualified professional librarians.” 2 “Rural and Remote” is defined as communities with a core population of less than 10,000, plus the northern territories, “Mid-Sized Urban” corresponds to Statistics Canada’s Census Agglomerate definition and have a population size between 10,000 and 100,000, and “Large Urban” corresponds to Statistics Canada’s Census Metropolitan Area definition of a population of more than 100,000.
D.4 Supply-side Recruitment Issues: Staff Sector and Geographic Interests and Activities
Having documented and discussed the recruitment needs and experiences of Canadian libraries, we now turn the focus of the analysis to the labour-supply side of the recruitment equation. By tracking where library staff have worked in the past and where they might be interested in working in the future, as well as the location and sector applied to among those who have recently begun their careers, we gain an understanding of the patterns of interests and activities that directly effect organizational recruitment.
The analysis of the international mobility of library staff captures another 8Rs factor, namely, repatriation. The movement of Canadian librarians to other countries clearly reduces the professional librarian supply and may exacerbate recruitment difficulties. Commonly referred to as the “brain drain” to connote the exodus of highly skilled and trained Canadians to the United States, the library community has also expressed concerns about the brain drain of their own human resource cadre. There are many factors that may influence (and may have influenced, to varying degrees) library professionals’ decisions to leave Canada for employment elsewhere; these include the inclusion of librarianship as a profession on the NAFTA list (allowing for greater ease in going south), the much larger and often more lucrative job market in the United States, a more diverse array of professional opportunities, and the strength of American currency for graduates seeking to relieve heavy education-incurred debt loads. But, the exact number of Canadian graduates working in the United States is not known, nor is the repatriation discussion supported by anything more than anecdotal evidence. Though we cannot answer all the questions about repatriation, in examining the departure rates and the motivations for leaving from and for re-patriating to Canada among the sample of librarians and paraprofessionals, we gain a better understanding of the extent to which the human resource loss from out-migration is problematic to the library community.
Also included in this section is an evaluation of the characteristics of the first jobs of new librarians and parapro-fessionals, which provides an indication of the ease or difficulty with which the transition is made into the library labour force.
The section begins, however, with an examination of the sector interests of library staff. These data bear directly on the findings from the institutional survey on recruitment insofar as they explain the greater recruitment dif-ficulties of certain library sectors.
66 SECTION D: Recruitment CANADIAN LIBRARY HUMAN RESOURCE STUDY
I Sector InterestsTo begin, we present the percentage of recent librarian entrants applying to each of the library sectors when look-ing for their first professional librarian position (Table D.9). Recent librarian entrants are defined as those who have been working in their career for less than six years. These data can be viewed as a proxy for the interests of all librarians in terms of which sectors they prefer to work in.
Almost seven in ten recent librarian entrants applied to academic libraries, and six in ten to public and special libraries. Only one in every ten recent librarians applied to a school library, while twice as many (23%) applied to a non-traditional library setting (including library consulting firms, vendors or special research projects).
Though graduates were most likely to apply to the sector that they are currently working in (e.g., 87% of academic librarians applied to academic libraries), the proportion of those who initially applied outside of their current sector are the more revealing statistics. Current public librarians were more likely to apply to academic libraries than were current academic librarians to apply to public libraries. More than 60% of public librarians initially applied to at least one academic library when looking for their first position, but only 41% of academic librarians applied to a public library. Special librarians were also more likely to initially apply to an academic than a public library (67% compared to 42%). Even more revealing is the fact that a slightly greater proportion of all graduates applied to special libraries than they did to public libraries (60% compared to 58%).14 This finding is particularly noteworthy given the relatively low levels of recruitment (and presumably open positions) in special libraries dur-ing 2002, compared to the greater recruitment activity within public libraries. However, since non-profit libraries do experience somewhat greater difficulties recruiting than government libraries, we might presume that many of the applications to the special sector were for government positions.
These findings provide support for the earlier analysis demonstrating that public libraries are in a tight labour market because of the competition for librarians primarily from academic libraries (i.e., CARL libraries), but also apparently from special libraries. Though CARL and CULC libraries both employ similar numbers of librarians, have a high demand for librarians, and hired at similar rates in 2002, librarians’ greater attraction to large aca-demic libraries creates a more challenging recruitment situation for large public libraries.
Table D.9 Library Sector Applied to1 by Library Sector2
(Recent Professional Librarian Entrants Only3, Individual Survey; n=359)
Percent Applying to Sector
Current Library Sector Academic Public Special School Non-Traditional4
TOTAL SAMPLE 72 58 60 10 23
TOTAL ACADEMIC 87 41 53 10 21
CARL 89 38 55 11 23
Academic 83 45 49 9 17
TOTAL PUBLIC 61 86 51 10 22
CULC 61 87 49 7 21
Public 60 85 52 15 23
TOTAL SPECIAL 67 42 86 8 29
Government 61 37 85 7 24
Non-Profit 74 44 89 11 26
Source: 8Rs Canadian Library Individual Survey1 Based on responses to the question: “Which of the following types of libraries and organizations did you apply to when looking for your first professional librarian job?”2 Results for For-Profit and for School librarians are not presented separately because of insufficient cases reporting; however, they are included in the Total Sample results. For-Profit library results are also included in the Total Special results.3 Recent Professional Librarian Entrants are defined as individuals who have been working as a professional librarians for less than 6 years.4 Non-Traditional Library workplace includes consulting firms, vendors or research projects.
14 It is also noteworthy that academic libraries were more likely to have previously worked in a special library than a public library (see Appendix Table D.5)
SECTION D: Recruitment 67The Future of Human Resources in Canadian Libraries
That only 10% of recent graduates applied to school libraries is also noteworthy. Whether this is a result of fewer professional librarian job openings in schools or because librarians choose not to work in this setting is not clear (since we do not have any institutional data on recruitment needs and activities of school libraries). Given the retrenchment of the school librarian labour force in the past decade and the high levels of job rewards and job satisfaction among school librarians (see Tables I.6b and I.13), the evidence suggests that the 10% figure is pre-dominantly a function of job unavailability. That the library community is abundantly aware of the contraction in the number of positions for school librarians also suggests, however, that new graduates may be reluctant to enter an environment with little job security.
CULC libraries are in a tighter librarian labour market than other sectors, especially given their relatively high-volume workforce needs.
Lastly, the 23% of graduates applying to non-traditional library settings is also worth highlighting since it repre-sents the expansion of the library community in the knowledge economy. Though the figure is not large, it still contributes to a situation of greater competition for librarians within an ever-widening spectrum of career pos-sibilities.
II Geographical InterestsTable D.10 displays the results of a question posed to recent librarian entrants about the geographical location applied to when looking for their first professional librarian position. Virtually all new librarians applied to a Canadian city and about one in five (22%) applied to a library located in a rural or remote region of Canada, providing an indication of moderate interest in working in such regions of the country (see Appendix Table D.6 for the specific Canadian location applied to). An even greater proportion (30%) applied to an American library. One in ten applied to a library outside of North America, and 15% outside the library sector altogether.15
Table D.10 Location of Library Applied to1 by Library Sector2
Recent Professional Librarian Entrants Only3, Individual Survey; n=356)
Percent Applying to Location
Library Sector Canadian City Rural/Remote Canada
United States
OutsideNorth America
Outside Library Sector
TOTAL SAMPLE 95 22 30 9 15
TOTAL ACADEMIC 97 17 32 9 14
CARL 97 13 36 8 17
Academic 96 24 26 11 9
TOTAL PUBLIC 95 24 26 10 15
CULC 97 13 26 8 15
Public 94 42 25 13 17
TOTAL SPECIAL 97 25 25 7 19
Government 98 25 30 10 18
Non-Profit 86 27 27 8 15
Source: 8Rs Canadian Library Human Resource Individual Survey1 Based on responses to the question: “Which of the following locations did you apply to when looking for your first professional librarian job?”2 Results for For-Profit and for School librarians are not presented separately because of insufficient cases reporting; however, they are included in the Total Sample results. For-Profit library results are also included in the Total Special results.3 Recent Professional Librarian Entrants are defined as individuals who have been working as a professional librarians for less than 6 years.
15 The most recent 2004 University of Alberta SLIS survey of the class of 2003 graduates found that, in contrast to the findings of earlier graduate surveys, none of the 28 responding graduates (out of 40 graduates) went to work in the United States. We have no indication at this point, however, of whether this is an anomaly year or an indication of a future trend.
68 SECTION D: Recruitment CANADIAN LIBRARY HUMAN RESOURCE STUDY
Since effectively all of the individuals who applied outside of North America also applied to an American library, the combined proportion of librarians applying for their first position outside of Canada is 30%. This number is significant particularly when viewed in light of the previously-presented results on barriers to recruitment (Table D.3b). One-third of the libraries reported that U.S. competition prevented them from hiring qualified professional librarians, with sector variation ranging from a low of 19% among CARL libraries to a high of 54% in CULC li-braries. With CULC libraries often facing the most fierce competition for librarians, the influence of the American librarian labour market on recruitment is clearly of greater consequence for the urban public library sector.16
The reasons for applying to a non-Canadian library provided by the 30% of recent librarian entrants who did so shed light on the Canadian librarian labour market scene within the past 5 years (Figure D.4). Over three-quarters of those applying for their first job outside of Canada did so because of a tight Canadian labour market, because of a better position, or because the position offered a higher salary than was perceived to be the case domestically (the first three reasons). Among these, the predominant explanation (41%) for leaving Canada was that there was either a scarcity of Canadian positions available, or that the job market was perceived to be better elsewhere. These results suggest that, if anything, there was an over-supply of librarians in Canada within the past 5 years.
Figure D.4 also indicates that about one in five recent librarian entrants applied outside of Canada simply for the life and/or work experience that such a job would offer. And 17% reported that they wanted to increase their chances of finding a job by applying for as many openings as they could, irrespective of where the position was located.
Figure D.4 Why Applied Outside of Canada1
(Recent Professional Librarian Entrants Only2, Individual Survey; n=112)
41
20
16
22
17
Scarcity of Canadian Positions
Good Position/Opportunity Offered
Better Salary Elsewhere
To Gain Life/Work Experience
Applied Everywhere
0 10 20 30 40 50Percent
Source: 8Rs Canadian Library Human Resource Individual Survey1 Based on categorized responses to the open-ended question: “What is the major reason you applied for a job in a library outside of Canada?”2 Recent Professional Librarian Entrants are defined as individuals who have been working as professional librarians for less than 6 years. The results presented in this figure are for those who had applied to a non-Canadian library when looking for their first professional librarian job.
Other results asking all professional librarians if they had previously worked in a non-Canadian library offer ad-ditional insight into the repatriation issue. Of the 2,076 professional librarians responding to this question, only 7% had previously worked outside of Canada (5% in the U.S. and 2% in a non-North American library).17 This sub-group of librarians were asked to explain why they had made the decision to relocate to a non-Canadian library and the major reason why they returned to work in Canada.
Figure D.5 demonstrates that 44% of respondents previously worked in a non-Canadian library because of condi-tions within the Canadian librarian labour market (first two explanations). Specifically, three in ten indicated that they left Canada because of a shortage of Canadian jobs (with half specifying a shortage of entry-level jobs) and 15% cited a “better or higher paying position.”
16 Somewhat contrary to this conclusion, however, is the fact that new entrants who are currently working in CULC libraries were slightly less likely, than on average, to have applied to a non-Canadian library (26%). In fact, CARL librarians were the most likely of all to have applied for their first job outside of Canada (36%). This difference may be a function of the greater labour market opportunities and quality of jobs provided in non-Canadian academic libraries than in non-Canadian public libraries.
17 These figures exclude librarians immigrating to Canada for the first time (i.e., they had never previously worked in Canada).
SECTION D: Recruitment 69The Future of Human Resources in Canadian Libraries
Figure D.5 Why Previously Work in Non-Canadian Library1 and Why Returned to Work In Canadian Library2
Source: 8Rs Canadian Library Human Resource Individual Survey1 Based on categorized responses to the open-ended question: “What is the major reason why you previously worked in a non-Canadian library?” 2 Based on categorized responses to the open-ended question: “What is the major reason why you returned to work in Canada?”
But the majority of the sub-sample indicated that they left Canada for non-labour-market-related reasons. Just over three in ten (34%) provided the general response that they simply worked in the country in which they lived, suggesting that it was neither the push of the Canadian labour market nor the pull of other labour markets that compelled them to leave Canada. Nineteen percent worked elsewhere to gain work or life experience, suggesting that it was a temporary endeavour. A further 14% were explicit about the temporary nature of their departure explaining that they left to work on a temporary basis in a contract or exchange position, internship, practicum or fellowship.
When asked why they returned to work in Canada, the results displayed in the bottom half of Figure D.5 show that only 17% did so because they found a better job here. By far the most prevalent response (73%) was because of personal reasons, such as spousal relocation or the perception that Canada offered a better quality of living. About one-quarter also indicated that their time away was always viewed as temporary, often because the position was on a project or contract basis. But since all of these emigrating librarians eventually repatriated to Canada, the analysis is only of temporary leaves.
Just over 1 in 5 recent librarians applied for their first position in a rural/remote library and 3 in 10 librarians at all career stages would consider working in a rural/remote library. About the same proportion expressed an interest in working in a non-Canadian library, but only 7% of our sample previously worked in a non-Canadian library, which they did primarily for non-labour-market-related reasons.
The combined results to both questions presented in Figure D.5 indicate that labour market conditions explain emigration more so than they explain repatriation. Labour market conditions explained why 44% of librarians left Canada, but only why 17% returned to Canada. The implication of this difference is that improvements to the Canadian librarian labour market will serve primarily as a deterrent to emigration and not so much as an encour-
70 SECTION D: Recruitment CANADIAN LIBRARY HUMAN RESOURCE STUDY
agement to repatriation. Another instructive story underlying these decision-based responses is that, regardless of the reasons for leaving, the return of librarians is primarily a benefit to the Canadian library community, since repatriating librarians bring with them experience that they may not have gained had they not left Canada.
We should also bear in mind that this decisional analysis pertains to a minority of librarians (30% of new entrants applied outside of Canada and only 7% of all librarians previously worked outside of Canada), such that the pro-portional loss of librarians due to emigration is not of great consequence when estimating the match between the supply of and demand for librarians. Without an indication of the proportion of librarians who never return to Canada, however, there is a large missing piece of information pertaining to the repatriation issue.18 The partial analysis presented here suggests that a longitudinal study of the number of Canadian librarians working outside domestic soil and the numbers who eventually repatriate (or not) is warranted. Furthermore, the somewhat sig-nificant proportion of librarians stating they would consider working in an American library at some point in the future (30% as shown in Figure D.6) indicates that the potential future “brain drain” of Canadian professionals is an issue that merits closer scrutiny.
Figure D.6 Percentage of Librarians Who Would Consider Working in U.S. Library1 by Library Sector
(Individual Survey; n=2,034)
TOTAL
TOTAL ACADEMIC
CARL
Other Academic
TOTAL PUBLIC
CULC
Other Public
TOTAL SPECIAL
Government
Non-Profit
For-Profit
SCHOOL
Percent
0 10 20 30 40 50
30
31
31
32
28
28
28
31
29
35
33
22
Source: 8Rs Canadian Library Human Resource Individual Survey1 Based on categorized responses to the open-ended question: “Would you consider working in a U.S. library at some point in the future?”
The entire professional librarian sample were also asked about their interest in working in a rural/remote library and what would attract them to such a location. Excluding the 18% of librarians who currently work in a rural or remote library, one-third (32%) indicated that they would consider working in a rural or remote library. As shown in Figure D.7, half of these individuals indicated that they would work in a rural or remote region because of the more attractive lifestyle often associated with smaller communities. A further 20% said they would consider
18 Since we are only able to examine the decisions of librarians who returned to Canada, the analysis is, by default, of a temporary nature. Without knowing anything about the proportion of librarians who never return to Canada, this analysis is one-sided and therefore limited.
SECTION D: Recruitment 71The Future of Human Resources in Canadian Libraries
working in a smaller community simply for the experience (implying that they would do so temporarily). Even fewer (16%) reported that the better working conditions in rural/remote libraries attracted them, with many specifically stating that they would be allowed to use a greater range of their skills or that they would be in an environment that afforded closer contact with library patrons. A small minority would be willing to move to a rural or remote region for altruistic reasons: namely, to improve the local library service or fulfill the needs of the community. Lastly, 10% provided a conditional response; they would only move if the job was temporary, if it was the right kind of job in the right location, or if their spouse was willing and able to relocate with them.
Figure D.7 Major Reasons Why Would Work in Rural/Remote Canadian Library1 (Professional Librarians Only; Individual Survey; n=547)
51
20
16
10
10
More attractive lifestyle
For experience sake
Better working conditions
Altruistic reasons (e.g. to help library/community
Conditional: if temporary, right job/location, etc
0 10 20 30 40 50 60
Percent
Source: 8Rs Canadian Library Human Resource Individual Survey1 Among the 32% of librarians who would consider working in rural/remote library.
These findings can be used by rural libraries that are experiencing difficulties recruiting by highlighting, for ex-ample, the positive lifestyle aspects of living and working in a smaller community and the opportunities to use a wider range of skills when advertising job postings.
III Early Job Characteristics and Experiences of New Library StaffInformation on the initial work experiences of library staff also provides a supply-side perspective on recruit-ment. An evaluation of the characteristics of the first jobs of new librarian and paraprofessional entrants who have been working in their careers for less than 6 years provides an indication of the ease or difficulty with which the transition is made into the library labour force and a supply-side view of the current labour market. To more fully capture the characteristics of new entrants, we begin the analysis with a brief summary of the demographic profile of new librarian entrants.
Interestingly, recent librarian recruits are equally likely as mid-career and senior librarians to be female.19 Eight in ten new librarians are female, as are mid-career librarians and senior librarians. New recruits are, on average, 37 years of age (with very little variation between sectors). The age profile of new recruits is not surprising, given that MLIS graduates tend to be slightly older than other Masters students; for example, Alberta Master of Arts graduates are 33 years of age, on average (Sorensen, 2002) although recent data shows a lowering of age of MLIS graduates (ALISE, 2003). The somewhat older age of new recruits has both positive and negative implications for human resource planning. First, the age profile of new librarians suggests a certain maturity that should play into easier adjustments to the workplace when hired. Further, since often recent MLIS graduates appear to have some pre-graduate library experience (Schrader, 2002), transitions into the workplace should be relatively smooth. On the other hand, a later start in the career cycle creates abbreviated careers and abridged opportunities for manage-ment and leadership grooming.
19 Mid-career librarians are defined as those who have been working in their careers for more than 5 years, but less than 15 years, while senior librarians are those who have been in their careers for more than 15 years.
72 SECTION D: Recruitment CANADIAN LIBRARY HUMAN RESOURCE STUDY
Entrance into the library labour force by MLIS graduates is relatively quick, but it is also somewhat unstable, with 57% working on a temporary basis in their first professional librarian position.
Table D.11 below provides responses to a set of questions asked of recent librarian entrants (i.e., those who have been in career for less than 6 years) about their library-related work experience prior to graduating, and the length of time taken to find their first professional librarian position.
A large majority (87%) of new librarians had experienced working in a library prior to graduating. This experi-ence ranges from a low of 78% among government librarians to a high of 93% working in non-profit libraries. These figures are also an indication of library students’ participation in practicum programs while enrolled in their program. Almost six in ten (58%) new librarian entrants reported having participated in such a program (results not shown in table or figure).
With respect to the length of time taken to find their first professional librarian position, the statistics are quite positive, with 84% finding a job within six months of graduating (37% of whom already had a job lined up before graduation). Though these figures are down slightly from the 1998, 1999, and 2000 figures provided by library school data collected on graduates’ early work experiences, they are comparable to those found in the early- to mid- 1990s.
Table D.11 Experience Prior to First Job and Time Taken to Find First Job by Library Sector
(Recent Professional Librarian Entrants Only1, Individual Survey; n=359)
Percent
Had Library Experience Before Graduating
Time Taken to Find First Librarian Position
Library Sector2 Before Graduating Within 6 Months of Graduating
More than 6 Months after Graduating
TOTAL SAMPLE 87 37 47 16
TOTAL ACADEMIC 89 35 51 14
CARL 90 35 52 13
Academic 86 35 49 16
TOTAL PUBLIC 87 31 47 22
CULC 86 32 50 18
Public 90 29 43 28
TOTAL SPECIAL 85 48 40 12
Government 78 54 37 10
Non-Profit 93 56 30 15
Source: 8Rs Canadian Library Human Resource Individual Survey1 Recent Professional Librarian Entrants are defined as individuals who have been working as a professional librarians for less than 6 years.2 For-Profit and School library results are not presented separately because of insufficient cases reporting; however, For-Profit results are included in the Total Special results, and School results are included in the Total Sample results.
Moving to Table D.12, it is clear that the initial work status of new librarian entrants is not quite as positive. The 21% incidence of part-time labour for new librarian entrants is nearly twice that of other Canadian graduates, of whom only approximately 10% work in part-time jobs shortly after graduating (Sorensen, 2002 and Finnie, 2002). CULC librarians are notable for their higher-than-average rates of part-time positions (44% compared to 21% for the total sample).
An even greater proportion of new librarian entrants initially worked in temporary employment situations, ir-respective of library sector. Nearly six in every ten new positions are temporary with most sectors following this
SECTION D: Recruitment 73The Future of Human Resources in Canadian Libraries
high rate. This is a much higher rate than is typical for other recent graduates. For example, a survey of 2000 graduates from Alberta’s post-secondary system revealed that only 19% were working in a temporary job two years after graduating (Sorensen, 2002).
The work is temporary, but the pattern is also temporary. When comparing the initial and current job status of new entrants, it is clear that the initial contingent job status is temporary for many librarians. The proportion working on a part-time basis reduces by one-third (from 21% to 7%) and the proportion of those initially work-ing on a temporary basis by more than half (from 57% to 22%). These findings are supported by longitudinal research on the work experiences of university graduates across the country, which shows that contingent work arrangements often characterize positions for new entrants into their field but that this propensity decreases sharply after about 5 years’ experience in the labour market (Finnie, 2002).
Table D.12 Work Status1 of Initial and Current Job by Library Sector2
(Recent Professional Librarian Entrants Only3, Individual Survey; n=359)
Source: 8Rs Canadian Library Human Resource Individual Survey1 Part-Time status includes individuals who normally working less than 30 hours per week. Temporary includes individuals where there is an indication of when the employment will end.2 Results for For-Profit and for School librarians are not presented separately because of insufficient cases reporting; however, they are included in the Total Sample results. For-Profit library results are also shown in the Total Special results.3 Recent Professional Librarian Entrants are defined as individuals who have been working as a professional librarians for less than 6 years.
The incidence of temporary labour for the current jobs of recent entrants, however, is still almost two times higher than the national average (10%) and three times higher than the entire librarian labour force (7%--see Table C.4). There are, furthermore, higher-than-average rates of contingent labour in some sectors. CULC recent librarian entrants still have slightly higher part-time rates (12%) and CARL librarians are still quite likely to be working in a non-permanent position (31%).
Overall, most of the results presented in Tables D.11 and D.12 indicate that the transition into the labour market for recent graduates is smooth, although it is not as stable as it could be. The data demonstrate the important point that the library community is able to accommodate the influx of new graduates in a timely fashion and fur-ther, to accommodate most eventually as full-time staff, but the higher incidence of current temporary employ-ment suggests a lower level of job security for recent professional librarians.20
20 Whether the incidence of temporary jobs among recent librarian recruits reflects a sector-wide shift towards this form of employment or whether it has traditionally been how new librarians begin their careers is not something that can be determined with the snapshot data we are using in this analysis. Future measurement of the incidence of temporary employment among new recruits is therefore indicated.
74 SECTION D: Recruitment CANADIAN LIBRARY HUMAN RESOURCE STUDY
We conclude this chapter of the report on recruitment with a brief examination of the early labour market expe-riences of recent entrants to library technician careers (Table D.13). Compared to librarians, 20% fewer recent library technician graduates had experience working in a library prior to their graduation. Still, nearly two-thirds (66%) report having such experience. Interestingly, however, recent paraprofessional staff are more likely to have a job lined up before completing their library technician program.
Overall, Table D.13 provides evidence that the transition into the workforce for the majority of library technicians is not particularly difficult. These conclusions, it should be noted, are only with respect to finding a job and do not speak to the quality of the job or to the work status of the job. While we do not have data on the initial job status of new library technicians, it is worth noting that contingent labour is more prevalent among this group than it is among all technicians in the sample (Table C.4). Nearly two in five recent library technicians are currently working on a part-time basis (compared to 25% of the total sample of technicians) and 16% are in a temporary job (compared to 6% of all technicians). Hence, while temporary jobs are more prevalent among recent profes-sional librarian entrants, part-time labour appears to more accurately characterize the early work experiences of technicians.
Table D.13 Experience Prior to First Job and Time Taken to Find First Job by Library Sector
Library Sector2 Had Library Experience Before Graduating Before Graduating Within 6 months of
graduatingMore than 6 months
from graduating
TOTAL SAMPLE 66 48 39 13
TOTAL ACADEMIC 62 35 52 13
CARL 65 47 47 6
Academic 60 28 55 17
TOTAL PUBLIC 71 46 42 12
CULC 70 45 45 10
Public 73 50 30 20
TOTAL SPECIAL 67 63 26 12
Government 75 65 25 10
Non-Profit 58 75 17 8
TOTAL SCHOOL 67 53 33 13
Source: 8Rs Canadian Library Human Resource Individual Survey1 Recent Library Technician Entrants are defined as individuals who have been working as a library technician for less than 6 years.2 For-Profit library results are not presented separately because of insufficient cases reporting; however, they are included in the Total Special results.
D.5 Strategic Human Resource Planning Implications
• Current librarians tend to say that they chose the field because they thought they would like what the work entailed (though they do not state what these early assumptions were), and that they were interested in serving the public and/or the public good, as well as because of the value they place on literacy and learn-ing. While these demonstrate a clear understanding of the core values of librarianship, they do not neces-sarily include the real functions of the job. Insofar as recruitment to the librarian profession is hampered by misperceptions about the work content of this profession, marketing directives should include an edu-cational component that highlights the actual job functions and levels of responsibility held by librarians.
SECTION D: Recruitment 75The Future of Human Resources in Canadian Libraries
• Library schools, MLIS students, HR administrators, and organizational trainers should also be made aware of libraries’ unmet needs for librarians to be equipped to perform management and leadership roles and to be able to respond flexibly to change.
• Since structural barriers are the main reason why paraprofessionals do not pursue MLIS education (though about one-third are interested), access to library education needs to be further examined while still main-taining the professional status of librarians.
• Since recruitment need, activity, and level of difficulty widely range between sectors and geographic re-gions of the country , strategies should also be sector- and geography-specific.
• For example, while CARL libraries as a whole do not seemingly need to make major changes to their recruitment strategies, CULC libraries are advised to consider marketing more rigorously to MLIS stu-dents (and perhaps to library school professors) about the benefits of working in public libraries (and supporting practicum programs, internships, co-op programs). The extent to which MLIS programs focus on librarianship within the public sector should also be examined.
• Rural libraries (which are predominantly public libraries) should focus their efforts upon promoting the desirable lifestyle of smaller communities and the opportunity for staff to use a wider range of skills. Knowing that retirements are coming up, rural libraries might foster a relationship with library schools and library technician programs that allows for practicum and other opportunities in their libraries.
• There is also the possibility that rural and remote libraries might consider “growing their own” and working with local schools to identify career opportunities in libraries for local community members.
• The continued use of temporary jobs for new librarian entrants, while better than the alternative of not offering a job at all, is a pattern that should be closely watched. The possible long-term negative effects on staff who continually work in a contract position include the erosion of loyalty and trust and dissatisfac-tion over the fact that most temporary jobs do not engender a sense of being part of the organization, garnering neither training opportunities nor other employer benefits that are provided to others in the workplace.
• Since 41% of recent professional librarian entrants stated they applied to a U.S. job due to a perceived scar-city of Canadian positions, it appears that generally, Canadian librarians would tend to stay in Canada if the initial jobs were here and perhaps in a permanent capacity. A much smaller proportion of respondents worked internationally, and then returned to Canada (primarily for personal reasons); this suggests that job market factors are not the only influence on international work. It also suggests that if there are an ad-equate number of good jobs for librarians in Canada, they may be less likely to leave in the first instance.
• The question remains as to how many institutions have reconsidered the MLIS hiring requirement for positions traditionally held by librarians. The Association of Research Libraries states that about one-third of North American research libraries do not require candidates to hold the MLIS (2000). If institutions are reconsidering this base credential for a greater number of positions, this could have a greater impact on recruitment.
SECTION E: Staff Retention 77The Future of Human Resources in Canadian Libraries
S E C T I O N E
Retirement
E.1 Introduction
Many in the library community have expressed concern over the aging demographic of the workforce, par-ticularly with respect to the number of retirements that are predicted to occur over the next five to 10
years. Curran (2003), for example, has noted that the decreased capacity for hiring younger librarians over the last twenty years (due in part to sustained budget cuts) has created a situation where the majority of the librarian workforce is concentrated into an older age demographic, thus potentially creating a situation where a greater number of professionals will retire within a short time period.
Estimates of the number of retirements among librarians vary greatly. According to Wilder (2003), 6.7% of Ca-nadian librarians in research libraries will have reached retirement age by 2005, an additional 21.8% by 2010, and 26.8% by 2015, for a total of 56.2% of the research library workforce over the next twelve years. Other estimates regarding retirement rates include 48% of librarians across the country by the year 2005 (Weiler, 2000), and 52% of Quebec librarians over the next fifteen years (Ramangalahy, Villalonga and Durocher, 2003). Comparisons between these projections are encumbered by differences in type of library or geographic area studied, but they do point out the variability in estimated retirements that library administrators have had to draw upon, no doubt adding to the confusion when developing human resource strategies.
The available quantitative retirement research has fueled concerns about how libraries are going to replace their departing senior staff. Some support for the view that libraries are not prepared to replace upcoming retiring professionals can be found in a recent survey of 124 Canadian libraries (Summerfield, 2002). When asked about their level of preparedness for replacing retiring librarians, 21% of respondents felt “not at all prepared,” and 53% felt “somewhat prepared.”
The goal of this project is not simply to “predict” the size of the next wave of future retirements. While this is important information to garner, it is equally important to ground the numbers in the existing human resource conditions of Canadian libraries. Examining the most recent retirement situation (including retirement events between 1997 and 2002) and current succession planning preparedness, will help lay the foundation for an in-formed understanding of how any retirement bulge will be experienced by Canadian library sector in the future. These elements are examined in our analysis of retirements.
Concerns about retirement have primarily been focused on the professional librarian workforce. Indeed, very little research exists about paraprofessional retirements. Since paraprofessionals continued to be hired (and in some cases, hired to replace librarian positions) during the 1990s, their age demographic is somewhat lower than it is for professional librarians (Table C.9). But they are still, on average, older than the Canadian workforce (21% of paraprofessionals compared to 11% of the national average are 55 years and over). The past, current, and future retirement trends for paraprofessionals are therefore also examined in this section.
78 SECTION E: Staff Retention CANADIAN LIBRARY HUMAN RESOURCE STUDY
E.2 Recent Retirement Trends
Before predicting future retirements it is informative to examine library staff retirements that have already oc-curred. By comparing the proportion of library staff members that have recently retired with the proportion that are predicted to retire, we gain an understanding of how much greater an issue retirements will be in the future, compared to what libraries have already dealt with. In other words, we can use recent history as a benchmark for evaluating the level of concern that should be placed on future predicted retirements.
Table E.1 presents librarian retirements that occurred between 1997 and 2002 as indicated by the institutional survey respondents. Beginning with the total sample, one-third of Canadian libraries experienced retirements over the past 5 years, representing a loss of approximately 11% of the total current professional librarian work-force. An average of 4.2 full-time equivalent (FTE) librarians retired within each library experiencing retirements (or 1.3 FTE retirements for each library in the sample).21
Retirements are much more likely to have taken place within the two largest sectors: 100% of CARL and 88% of CULC institutions had at least 1 FTE librarian retirement in the past 5 years. Though CARL and CULC retire-ments are both at higher rates (7.2 and 4.1 retirements on average in each institution), the proportional loss in CARL libraries is somewhat higher (16% in CARL compared to only 7% in CULC). In fact, compared to almost all other library sectors, CULC institutions lost a smaller proportion of their librarian labour force from retire-ments, even though they were more likely to experience retirements, and in much higher numbers. By compari-son, though only 26% of public libraries experienced retirements in the past 5 years, the loss through retirements comprised 10% of their professional librarian cadre.
Between 1997 and 2002, the majority of librarians retired before the age of 65. There are, however, signs that the age of retirement will increase in the future.
Table E.1 Librarian Retirements Between 1997 and 2002 by Library Sector1
(Institutional Survey; n=286)
Library Sector% Orgs. with Retiring
LibrariansRetirements as % of Current Librarians
Mean # FTE Retirements Per Org.2
TOTAL 34 11 4.2
TOTAL ACADEMIC 43 19 7.4
CARL 100 16 7.2
Academic 19 8 --
TOTAL PUBLIC 38 8 2.6
CULC 88 7 4.1
Public 26 10 1.3
TOTAL SPECIAL3 18 9 1.2
Government 22 9 --
Non-Profit 14 7 --
Source: 8Rs Canadian Library Human Resource Institutional Survey1 Separate sub-sector results are not presented when there are fewer than 15 cases reporting.2 Librarian staff figures are provided in full-time equivalent (FTE), but since we know that not all respondents provided staff numbers in FTE, although they were instructed to do so, these figures are an over-estimation of FTE. Furthermore, average retirements are among libraries with retirements only. If the total sample is used as the denominator, the number of average retirements per library is 1.3.3 For-Profit library results are not presented separately because of insufficient cases reporting; however, they are included in the Total Special results.
21 Though we report librarian staff figures in full-time equivalent (FTE), this is an over-estimation, since we know that not all respondents provided staff numbers in FTE, although they were instructed to do so.
SECTION E: Staff Retention 79The Future of Human Resources in Canadian Libraries
Table E.2 presents the same recent retirement data for paraprofessional library staff. Compared to librarian retire-ments, about 10% fewer libraries have had at least one paraprofessional retire within the past 5 years, representing only 7% of the current paraprofessional staff. Again, however, these retirements are most predominant in CARL and CULC libraries (76% of CARL and 68% of CULC institutions experienced retirements with an average of 4.0 and 6.7 FTE paraprofessionals retiring in each CARL and CULC institution, respectively).
Table E.2 Paraprofessional Staff Retirements Between 1997 and 2002 by Library Sector
(Institutional Survey; n=280)
Library Sector% Orgs. With Retiring
ParaprofessionalsRetirements as % of
current ParaprofessionalsMean # FTE Retirements
Per Org.1
TOTAL 23 7 2.7
TOTAL ACADEMIC 39 6 2.9
CARL 76 7 4.0
Academic 24 5 1.4
TOTAL PUBLIC 21 7 3.2
CULC 68 9 6.7
Public 16 5 1.3
TOTAL SPECIAL2 14 6 1.0
Government 8 3 1.0
Non-Profit 17 7 1.0
Source: 8Rs Canadian Library Human Resource Institutional Survey1 Paraprofessional staff figures are provided in full-time equivalent (FTE), but since we know that not all respondents provided staff numbers in FTE, although they were instructed to do so, these figures are an over-estimation of FTE. Furthermore, average retirements are among libraries with retirements only. If the total sample is used as the denominator, the number of average retirements per library is 1.3.2 For-Profit library results are not presented separately because of insufficient cases reporting; however, they are included in the Total Special results.
These figures are important to keep in mind as benchmark data when examining future retirement estimates (Section E.3), particularly in terms of the rate of retirements within a five-year period.
E.3 Age of Retirement
The age at which library staff have retired in the past and are estimated to retire in the future are important com-ponents of predicting future retirements, since age of retirement can vary considerably across individuals and over time. We begin this section by examining the age of retirement among librarians in the recent past. Equiva-lent data are not presented for paraprofessionals because of insufficient responses and unreliable results from the institutional survey on these questions. For the same reason, these data are presented for librarians in only some sectors.
As shown in Table E.3, between 1997 and 2002, a majority (79%) of librarians retired before the age of 65, and only 21% retired at or after 65 years of age. The rather large number of librarians retiring before age 65 may reflect a Canadian labour force trend in the 1990s, where retirements occurred, on average, at an earlier age (Gower, 1997). Other research has shown that employees with a retirement or pension plan (92% of our sample of libraries provide such a plan) are more likely to retire earlier than those without a plan (Statistics Canada, 2002). The age of retirement figure might also reflect the tendency for this predominantly female professional librarian workforce to retire at the same time as their older male spouses exit the workforce.
Comparing across sectors, CULC librarians were the least likely to retire before age 65 (although this figure is still high at 71%) and special librarians were the most likely of the three sectors to retire before the age 65 (88%).
80 SECTION E: Staff Retention CANADIAN LIBRARY HUMAN RESOURCE STUDY
Table E.3 Librarian Age of Retirement by Library Sector (Institutional Survey; n=95)
Percent
Library SectorBefore 65
Years of AgeAt 65
Years of AgeAfter 65
Years of Age
TOTAL 79 13 8
TOTAL ACADEMIC1 82 14 4
CARL 82 13 5
TOTAL PUBLIC 73 13 14
CULC 71 10 19
Public 80 0 20
TOTAL SPECIAL2 88 0 12
Source: 8Rs Canadian Library Human Resource Institutional Survey1 Non-CARL Academic library results are not presented separately because of insufficient cases reporting; however, they are included in the Total Academic results.2 Government, Non-Profit, and For-Profit library results are not presented separately because of insufficient cases reporting; however, they are included in the Total Special results.
There are strong signs that age of retirement may be reversing. Indeed, the individual survey results which depict senior librarians’ estimates of when they will retire indicate a future scenario of later age of retirement. Table E.4 shows that 29% of current senior librarians estimate they will retire at or after 65 years of age compared to the figures in Table E.3 where only 21% of the librarians retired within this later age period.22
Although both survey findings suggest that the vast majority of retirements will take place before the age of 65, the smaller proportion in the individual survey (which was conducted in 2004), compared to the institutional survey (which reflects 1997 to 2002 trends), may indicate the onset of a future trend where librarians retire at a later age. There are also other substantive reasons why age of retirement will increase in the future. Given recent downturns in investments of retirement and pension plan holdings, senior librarians may be realizing they are not able to afford to retire as early as they would like. A recent Canada-wide poll of a random sample of 1,003 adults in March 2004 revealed that while 82% said health care issues were their biggest concern, 73% indicated that their second biggest worry was not having enough income after age 65. That was a dramatic jump over find-ings two years earlier, when just 54% told pollsters they worried about post-retirement income (Canadian Labour Congress, 2004).
22 Different methods of extracting age of retirement might also explain the difference.
SECTION E: Staff Retention 81The Future of Human Resources in Canadian Libraries
Table E.4 Senior Librarian1 Estimation of Retirement Age Category2 by Library Sector
(Individual Survey; n=1,024)
Age Category of Estimated Retirement
Library SectorEarlier than 55
Between 55 and 60
Between 61 and 64 At 65 After 65
TOTAL 1 40 30 23 6
TOTAL ACADEMIC <1 38 33 24 5
CARL 0 37 33 25 5
Academic 1 39 34 20 6
TOTAL PUBLIC 2 38 30 24 6
CULC 2 38 28 26 6
Public 1 38 34 20 7
TOTAL SPECIAL3 2 46 25 22 5
Government 3 56 18 19 4
Non-Profit 0 39 27 29 5
SCHOOL 5 63 11 16 5
Source: 8Rs Canadian Human Resource Library Individual Survey1 Senior Librarians are defined as those who are currently 50 years of age and older (48% of total sample of librarians).2 Excludes respondents reporting “Don’t know” (4%).3 For-Profit library results are not presented separately because of insufficient cases reporting; however, they are included in the Total Special results.
Another recent study by Schellenberg and Silver (2004) found that six in ten Canadians who retired in the past 10 years did so involuntarily or would have continued working if their circumstances were different. The results of this Canada-wide study of 25,000 individuals suggest that librarians do not need to be encouraged to defer their retirement, but enabled to do so. For example, one-quarter of premature retirees reported that they would have delayed their retirement if they had been able to reduce their work week without affecting their pension (Schel-lenberg and Silver, 2004).
Changes in provincial legislation on mandatory age of retirement also provide the framework for a later retire-ment age. Whereas many regions of the country abolished mandatory retirement some time ago, the issue is cur-rently under review in Ontario (Government of Ontario, 2004). With 43% of librarians working in Ontario, this change could have a strong influence on the age of retirement for the Canadian librarian workforce.
With respect to sector differences, government and school librarians “realistically” think they will retire, on aver-age, at an earlier age than librarians working in other sectors. Sixty-eight percent of school librarians and 59% of government librarians estimate that they will retire before the age of 61. This same early retirement pattern is observed among government and school paraprofessionals (Table E.5): 75% of school paraprofessionals predict they will retire before 65, and 62% of government paraprofessionals estimate this retirement age (compared to 43% in the total sample of paraprofessionals).
82 SECTION E: Staff Retention CANADIAN LIBRARY HUMAN RESOURCE STUDY
Table E.5 Senior Paraprofessional1 Estimation of Retirement Age Category2 by Library Sector
(Individual Survey; n=673)
Age Category of Estimated Retirement
Library SectorEarlier than 55
Between55 and 60
Between61 and 64 At 65 After 65
TOTAL 2 41 25 26 6
TOTAL ACADEMIC 3 36 27 29 5
CARL 3 37 29 26 5
Academic 1 35 23 37 4
TOTAL PUBLIC 2 34 28 30 6
CULC 2 32 30 31 5
Public 2 41 23 25 9
TOTAL SPECIAL3 0 48 21 17 14
Government 0 62 14 12 12
Non-Profit 0 30 25 30 15
SCHOOL 7 68 12 12 1
Source: 8Rs Canadian Library Human Resource Individual Survey1 Senior Paraprofessionals are defined as those who are currently 50 years of age and older.2 Excludes respondents reporting “Don’t know” (4%).3 For-Profit library results are not presented separately because of insufficient cases reporting; however, they are included in the Total Special results.
E.4 Predicted Future Retirement
The retirement results presented so far tell us about what has occurred in Canadian libraries in the recent past (1997 to 2002), but we also have a good indication from library staff themselves and from other indicators that retirements will be later in future years. Accordingly, in predicting the proportion of current librarians and para-professionals who will retire within the next 5 and 10 years (2009 and 2014), we provide three scenarios based on three different assumptions about age of retirement. The first scenario assumes a minimum age of retirement of 60 years, the age which most closely approximates a static situation in which age of retirement does not change.23 The second and third scenarios account for the possibility of a future where retirements are delayed and assume a minimum retirement age of 62 and 65 years of age, respectively.24
The first two rows of figures in Table E.6 depict scenario 1, and demonstrate that an estimated 25% of current librarians will retire within the next 5 years (2009) and 48% within the next 10 years (2014). Compared to retire-ments that occurred within the past 5 years (Table E.1), the future predicted retirements over the next 5 years in this scenario is more than double (11% retired in past 5 years compared to 25% in the next 5 years). Based on an estimate of 9,000 FTE Canadian professional librarians, 2,250 FTE librarians are predicted to retire within the next 5 years, and 4,320 FTE within the next 10 years.25 Assuming a static situation with respect to age of retire-ment, therefore, these estimates suggest that the library community make it an important priority to prepare for future retirements.
23 When comparing retirement rates derived from librarians’ own accounts of when they realistically think they retire (Table E.4) and rates based on an assumption of 60 years of age of retirement (Table E.6), very similar proportions of librarians are predicted to retire.
24 Since there are no substantive reasons to suggest that librarians will retire at an earlier age than they are currently, we do not provide such a scenario.
25 Based on available data, there is no definitive method of estimating the total number of librarians in Canada. According to Statistics Canada 2001 census data, there are over 12,000 professional librarians in Canada, but this estimate is not very accurate, since we are not certain how many of these meet the MLIS (or historical equivalent) standard nor does it include library administrators. When extrapolating from our own institutional survey, estimates are 8,500 FTE librarians, not including school librarians. The National Core Library Statistics program arrives at a similar estimate of 8,360 FTE librarians, not including school librarians which is equivalent to about 20% of all FTE staff (Schrader and Brundin, 2002). They further estimate 7,800 FTE total staff in school libraries. Our data suggest that professional librarians, as a proportion of library school staff, is decreasing (e.g., there are now roughly 4 paraprofessionals for every 1 professional librarian working in school libraries). We, therefore, add 10% of the school total staff of 7,800 FTE to the 8,500 FTE to arrive at a rounded figure of 9,000 FTE librarians working in Canada.
SECTION E: Staff Retention 83The Future of Human Resources in Canadian Libraries
Table E.6 Predicted Librarian Retirements Within the Next 5 and 10 Years1 (Assuming age of retirement of 65, 62, and 60 years)
(Individual Survey; n=1,886)
Librarian Workforce Retirement
Retirement Scenario Percent Estimated FTE # in
Librarian Population2
Scenario 1: Assuming retire at 60 years of age
Retirements by 2009 25 2,250
Retirements by 2014 48 4,320
Scenario 2: Assuming retire at 62 years of age
Retirements by 2009 16 1,440
Retirements by 2014 39 3,510
Scenario 3: Assuming retire at 65 years of age
Retirements by 2009 6 540
Retirements by 2014 25 2,250
Source: 8Rs Canadian Library Human Resource Individual Survey1 Calculated by adding 5 and 10 years to current age.2 Based on a roughly-estimated total full-time equivalent Canadian librarian workforce of 9,000.
When examining all the estimates in Table E.6, it is clear that as age of retirement increases, considerably smaller proportions of librarians are predicted to retire between 2004 and 2014. Assuming an average retirement age of 62 years, 16% (1,440 FTE) are estimated to retire by 2009 and 39% (3,510 FTE) by 2014. At 65 years of age, estimates reduce even more significantly to 6% (540 FTE) and 25% (2,250 FTE) by the year 2009 and 2014, re-spectively. In short, if the age of retirement increases over the next decade by only a few years, the compounded proportion of professional librarians retiring will no longer reach critical levels. One reason for this conclusion is that numerically speaking, the latter scenarios do not depict a retirement situation that departs significantly from what has just occurred between 1997 and 2002 (with 11% of librarians—990 individuals--retiring between 1997 and 2002, and 16% and 6% estimated to retire in the next 5 years under scenarios 2 and 3, respectively). Further, as we will see in Section E.5, most libraries did not report experiencing “crisis-level” difficulties in dealing with the nearly 1,000 retirements that already occurred between 1997 and 2002. As shown in Table E.14, only 36% of libraries in the institutional sample indicated that they experienced difficulties replacing the leadership qualities lost by departing senior librarians, and even fewer (28%) responded similarly with respect to replacing skills and knowledge.
Using an average age of retirement of 62 years, 4 in 10 current librarians are predicted to retire by the year 2014.
Given that we are using a total difference of only 5 years in age of retirement, the rather large variation between the three future scenarios is itself an interesting finding and highlights the demographic concentration of librar-ian staff in the older age categories. With nearly half of current librarians 50 years of age and older, combined with such a large range of possible retirement ages (from before 55 to after 65), future retirement rates are highly dependent on the actual age that librarians retire. Accurate predictions of future retirements are, therefore, ex-tremely vulnerable to age of retirement. This conclusion is important to keep in mind when we examine librar-ians’ attitudes towards retirement and their implications for retirement policy within libraries.
Another important observation that can be made by comparing the retirement rates between the three scenarios is that in scenario 1 the bulk of retirements will occur by the year 2009, whereas under scenarios 2 and 3 retire-ments will predominantly fall between 2009 and 2014. An older age of retirement not only reduces retirement rates, but also shifts into the next decade most of the immediacy of the retirement issue.
84 SECTION E: Staff Retention CANADIAN LIBRARY HUMAN RESOURCE STUDY
Yet another important point to make from the data in Table E.6 is that when the number of retirements is calcu-lated for each individual library, a very different picture emerges. Given that there are approximately 2,000 librar-ies in Canada that employ professional librarians, we can further estimate that under scenario 1 each Canadian library can expect to have an average of 1.1 librarians retire over the next 5 years (2,250/2,000), and 2.1 over the next decade (4,320/2,000).26 Scenario 2 estimates are that each library will have an average of 0.6 retirements in 5 years and 1.5 in 10 years, while scenario 3 estimates are 0.2 and 0.9 in 5 and 10 years, respectively.
These two levels of analysis clearly present two very different perspectives on retirements: one for the library sec-tor as a whole and the other for individual libraries. When retirements are viewed at the sector-wide level they are more alarming than they are for individual libraries. But, the individual library must interpret their retirements within the broader scope of the industry. One or two retirements over the next 10 years may not present a human resource crisis for any individual library; however, when retirements are occurring at a similar rate across the sec-tor, competition for recruitment becomes more intense. Further, retirements cannot be viewed in isolation but must be seen as part of the larger demand-supply nexus within any organization. If a single library can expect to have 2 librarians retire over the next 10 years, but they are also experiencing difficulties recruiting new librarians, the human resource loss from retirements will be of greater concern. And, as discussed later on in this chapter (Section E.6), dealing with retirements is not simply a matter of replacing librarians, but is more importantly a matter of cultivating and developing the kinds of skills and abilities that are needed by libraries.
In summarizing the data and discussion of predicted future retirements presented so far, it is clear that the age at which librarians are predicted to retire is the pivotal point of estimating retirement rates. Although we would like to provide a more definitive single-case scenario to the community, predictions simply cannot be made with such certainty. In fact, a review of average age of retirements among the Canadian labour force within the past two decades reveals considerable fluctuation over time with a wide range of explanations for the shifts (Statistics Canada, 2002).
Having said this, however, we can provide what we think will be the most likely of all scenarios, given what we currently know the situation to be, with the caveat that a change in only one influential factor can alter this con-clusion. We have already discussed the signs that age of retirement will increase in the future, suggesting that the non-crisis scenarios depicted in Table E. 6 (2 and 3) are the more likely to occur. Further, it could be argued that increasing the minimum age of retirement from 60 to 65 within 5 years is too drastic a shift to realistically expect within such a short period of time. Hence, for the remaining analysis in this report we use the middle scenario and the more conservative assumption of 62 years of age of retirement.
Using this minimum retirement age, only 16% of current librarians are predicted to retire within the next 5 years. Again, since this does not depart significantly from librarian retirement rates in recent history (11%), human re-source efforts to replace these senior staff members should strategically continue along a similar path as has hap-pened in the recent past. Four in every 10 current librarians are predicted to retire by the year 2014. Since nearly 2 in 10 librarians will have already retired by 2009, the distribution of retirements is somewhat evenly spread between the next 5 and 10 years. The recommended path for the library community, therefore, is one that involves long-term and continuous human resource planning that allows for a smooth transition during the generational change that is taking place in libraries.
The library community is advised to employ long-term and continuous human resource planning, to allow for a smooth transition during the generational change that is taking place in libraries.
26 The number of libraries in Canada is based on the number of libraries in the institutional sampling frame, less those that we know do not employ professional librarians because they either did not participate in the study (stating that they did not employ librarians) or because they did participate (but indicated no professional librarians on staff). The number of libraries is likely an overestimation since it includes an unknown number of libraries (that we did not hear from) that do not currently employ professional librarians.
SECTION E: Staff Retention 85The Future of Human Resources in Canadian Libraries
If they haven’t already, libraries must begin efforts to groom the next generation of leaders and managers, not only with mid-level librarians, but with recent entrants into the profession. With 22% of mid-career librarians at least 60 years of age in 10 years, we cannot assume that replacements will always come from this group (since about 1 in 5 current mid-career librarian will themselves need to be replaced within 10 years). These data demonstrate that human resource planning with respect to retirement is not an issue that can be merely dealt with by motivat-ing, cultivating, and training mid-career librarians to fit the management and leadership needs of libraries; it is a strategic and ongoing process that must also target recent entrants.
Having examined predicted retirements for the library sector as a whole, we now turn to an analysis of sector differences in retirements for management and non-management librarians, based on an assumed retirement age of 62 years. As shown in Table E.7, a somewhat greater proportion of management than non-management librarians are predicted to retire in the next 5 and 10 years. Only 13% of non-management librarians will be at least 62 years of age in 5 years (by the year 2009) compared to 17% of management librarians. Similarly, a much greater proportion of management than non-management librarians are predicted to retire by the year 2014 (43% compared to 31%).
As we might expect, CARL librarians (both management and non-management) are predicted to retire in higher rates than librarians in most other sectors. Librarians in a few other sectors, however, are also predicted to retire at higher rates. The most notable of these are the very high retirement rates found among school librarians, 66% of whom are estimated to retire by 2014. Given the recent staffing history within the school sector, we may well see a future where nearly two-thirds of the professional librarian staff in the school sector are not replaced when they retire. Simply put, school libraries will no longer be run by professional librarians, unless they begin to receive a greater share of public school funding, and the value of the professional degree is recognized when recruiting.
Somewhat surprising are the higher-than-average retirement rates among non-management librarians in small public libraries. Most the retirements in this sector will take place within the next 5 years (26% compared to the total sample of 13%). In contrast, the bulk of retirements within all other sectors will occur in the latter half of the next 10 years. For example, CULC non-management librarian retirements are expected to be lower than the total sample average within 5 years, but jump dramatically within 10 years (from 9% to 31%).
86 SECTION E: Staff Retention CANADIAN LIBRARY HUMAN RESOURCE STUDY
Table E.7 Predicted Librarian Retirements within the Next 5 and 10 Years by Career Level and Library Sector
(Based on minimum age of retirement of 62 Years) (Individual Survey; n=1,886)
Percent over 61 Years of Age1
Within 5 Years (by 2009) Within 10 Years (by 2014)
Library SectorTotal
LibrariansNon-
Management Management2Total
LibrariansNon-
Management Management2
TOTAL SAMPLE 16 13 17 39 31 43
TOTAL ACADEMIC 19 17 20 42 33 48
CARL 20 19 22 43 35 48
Other Academic 16 11 18 41 27 48
TOTAL PUBLIC 14 12 14 36 31 38
CULC 11 9 13 35 31 37
Other Public 19 26 17 38 35 39
TOTAL SPECIAL 14 9 16 37 23 43
Government 14 12 15 38 26 45
Non-Profit 11 3 16 35 21 41
For-Profit 16 7 21 34 21 42
SCHOOL3 19 -- 22 66 -- 74
Source: 8Rs Canadian Library Human Resource Individual Survey1 Calculated by adding 5 and 10 years to current age.2 Management includes supervisors, middle management, and senior administration.3 Separate career level results are not presented when there are fewer than 15 cases reporting; however, they are included in the Total Sample results.
At the other end of the retirement spectrum are non-management special librarians, all three sub-sector types of which are estimated to retire in smaller proportions than the total sample within both time periods. Non-profit and for-profit librarians (who are not working in management) have especially low retirement rates, where only one in five are predicted to retire by 2014 compared to three in ten for the total sample. Management librarians in these sectors, however, are predicted to retire at rates that more closely approximate the total sample.
Table E.8 presents predicted retirement rates for paraprofessional staff by sector, again using the 62 minimum age of retirement cutoff.27 Compared to professional librarians, a slightly smaller proportion of paraprofessionals are estimated to retire within the next decade. As was the case for professional librarians, the 13% of paraprofes-sionals predicted to retire within the next 5 years does not depart significantly from the 7% who retired within the past 5 years (Table E.2). With a somewhat younger age profile than librarians, however, the largest wave of retirements among paraprofessionals will occur between 2009 and 2014 (13% between 2004 and 2009, and 21% between 2009 and 2014).
27 We are not able to provide the number of paraprofessionals expected to retire because we do not have a reliable estimate of the total number of paraprofessionals currently working in Canada.
SECTION E: Staff Retention 87The Future of Human Resources in Canadian Libraries
Table E.8 Predicted Paraprofessional Staff Retirements within the Next 5 and 10 Years by Library Sector
(Based on minimum age of retirement of 62 Years) (Individual Survey; n=1,560)
Percent over 61 Years of Age1
Library Sector Within 5 Years Within 10 Years
TOTAL SAMPLE 13 34
TOTAL ACADEMIC 16 36
CARL 16 39
Other Academic 16 31
TOTAL PUBLIC 14 31
CULC 15 31
Other Public 12 31
TOTAL SPECIAL 8 29
Government 5 28
Non-Profit 10 33
For-Profit 15 24
SCHOOL 9 43
Source: 8Rs Canadian Library Human Resource Individual Survey1 Calculated by adding 5 and 10 years to current age.
Sectoral patterns of retirement rates, for the most part, replicate those found among professional librarians. Again we observe that CARL paraprofessionals will retire at higher rates than on average, especially during the next de-cade. The largest wave of retirements (43%) is predicted to occur among school paraprofessionals after 2009. And again, paraprofessionals working in special libraries are estimated to retire at lower rates than on average, but with most of the retirements occurring between 2009 and 2014 (8% in 5 years and increasing to 29% in 10 years).
In conclusion, though paraprofessional retirements overall will not likely be quite as high as professional librar-ians, they still imply the need for continuous succession planning efforts over the foreseeable future. Moreover, when retirement rates for both professional librarians and paraprofessional staff are viewed in their entirety, suc-cession management becomes more complex. The experience, skills, talents, and knowledge lost by the two most predominant occupational groups within libraries presents a compounded situation that warrants careful scru-tiny. If, for example, paraprofessionals are viewed as a possible pool of future professional librarians, the parapro-fessional workforce will be subject to further losses which, as the retirement data suggest, the library community can ill afford. Together then, these results suggest that the library community needs to focus more strongly on attracting lay individuals to libraries in both professional and paraprofessional capacities.
Having said this, we should not make the mistake of concluding that the library workforce will reduce by 37% within the next 10 years (the combined retirement rate for librarians and paraprofessionals) since this does not account for new entrants into the system. In other words, a very important factor to consider when determining the seriousness of retirements is the entrance of recent graduates into the system. We present this more compre-hensive demand-supply analysis in Section J.
With respect to regional differences in retirement rates, Table E.9 demonstrates few differences. Librarians in Al-berta and especially those working in the Territories are, however, predicted to retire at slower rates than average within the next 5 and 10 years.
88 SECTION E: Staff Retention CANADIAN LIBRARY HUMAN RESOURCE STUDY
Table E.9 Predicted Librarian Retirements within the Next 5 and 10 Years by Geographic Location
(Based on minimum age of retirement of 62 Years) (Individual Survey; n=1,886)
Percent over 61 Years of Age1
Geographic Location Within 5 Years Within 10 Years
TOTAL SAMPLE 16 39
Province/Region
British Columbia 19 43
Alberta 12 30
Saskatchewan/Manitoba 18 44
Ontario 16 39
Quebec 19 42
Maritimes 14 37
Northern Territories 6 13
Rural & Remote/Urban2
Rural and Remote 16 39
Urban 16 32
Source: 8Rs Canadian Library Human Resource Individual Survey1 Calculated by adding 5 and 10 years to current age.2 Rural and Remote is based on “no” responses to the question “Is your library located in an urban centre with a municipal population of more than 10,000 people?” Because not all respondents provided an answer to this question, rural designation was also assigned to respondents indicating that they “already work in a rural/remote region of Canada,” plus respondents residing in one of Canada’s northern territories.
E.5 Retirement Attitudes and Retirement Policy Implications for Predicted Retirements
The retirement information indicates that not all library sectors will experience the same retirement rates. But these data do not capture the varied perspectives that might exist from one library to another in terms of whether retirements are viewed as a problem, or perhaps as an opportunity. In-depth interviews and focus group sessions revealed that some administrators see retirements as a chance to restructure the organization and reconfigure the staffing complement in order to provide better developmental and promotional opportunities for those remain-ing. With this in mind, we present a series of tables depicting responses to questions asked of senior librarians on their attitudes towards retirement. The section begins, however, with an examination of early retirement offerings among libraries.
Figure E.1 demonstrates that one in five libraries offer professional librarians an early retirement package. Such packages are half as prevalent in public libraries, but CARL libraries are especially likely to offer early retirement opportunities to their librarians. For academic libraries, these packages are often part of the overall university or college human resource strategy. With respect to CARL libraries, therefore, we should not assume that the high figure correlates directly with a high interest in replacing senior librarian staff. Overall, however, the data in Fig-ure E.1 provide an indication that, for whatever reason, retirements are encouraged by offering early retirement packages and that some libraries will benefit from retirements.
The flexibility of retirement timing for librarians is largely a function of their financial situation.
SECTION E: Staff Retention 89The Future of Human Resources in Canadian Libraries
Figure E.1 Percentage of Organizations Offering Early Retirement Package1 by Library Sector
(Institutional Survey; n=268)
Total Sample 21
Total Academic 34
CARL 54
Other Academic 26
Total Public 11
CULC 12
Other Public 11
Total Special2 20
Government 21
Non-profit 23
0 10 20 30 40 50 60 Percent
Source: 8Rs Canadian Library Human Resource Institutional Survey1 Based on “yes” responses to the question: “Does your organization offer an early retirement package?”2 For-Profit library results are not presented separately because of insufficient cases reporting; however, they are included in the Total Special results.
When senior staff were asked about the extent to which they are looking forward to retirement, the results sug-gest that most senior librarians do not feel strongly either way about their retirement (Table E.10). Overall, only three in ten senior librarians are looking forward to retirement to a “great extent” while most (56%) reported “to some extent.” Sector variation is not great, although government librarians appear to be looking forward to their retirement more so than other librarians, with 39% indicating “to a great extent.”
Table E.10 Extent Senior Librarians1 Looking Forward to Retirement by Library Sector
(Individual Survey; n=1,015)
Percent Looking Forward to Retirement
Library Sector2 To a Great Extent To Some Extent To No Extent
TOTAL SAMPLE 29 56 14
TOTAL ACADEMIC 28 58 14
CARL 31 55 14
Academic 22 66 12
TOTAL PUBLIC 28 56 16
CULC 27 57 16
Public 29 54 17
TOTAL SPECIAL 35 54 11
Government 39 55 6
Non-Profit 33 43 24
TOTAL SCHOOL 33 61 6
Source: 8Rs Canadian Library Human Resource Individual Survey1 Senior professional librarians are defined as those who are currently 50 years of age and older.2 For-Profit library results are not presented separately because of insufficient cases reporting; however, they are included in the Total Special results.
90 SECTION E: Staff Retention CANADIAN LIBRARY HUMAN RESOURCE STUDY
Senior librarians were also asked if they would consider delaying or accepting an early retirement package (Table E.11). It is somewhat surprising that such large proportions answered positively to both questions. These results provide strong evidence that the retirement timing can be influenced by organizational policies and practices. Only a few librarians, it seems, are steadfast in their retirement plans (only 6% indicated they would neither delay their retirement or accept an early retirement plan). Again, government librarians were more likely than on aver-age to express an interest in taking an early retirement (79%), as were school librarians (80%).
Table E.11 Percentage of Senior Librarians1 Who Would Consider Delaying Retirement or Accepting Early Retirement Package by Library Sector
(Individual Survey; n=1,018)
Percent2
Library Sector3Consider
Delaying RetirementConsider Early
Retirement Package
TOTAL 75 68
TOTAL ACADEMIC 76 68
CARL 71 66
Academic 85 71
TOTAL PUBLIC 76 64
CULC 76 62
Public 77 69
TOTAL SPECIAL 70 74
Government 74 79
Non-Profit 62 68
SCHOOL 60 80
Source: 8Rs Canadian Library Human Resource Individual Survey1 Senior Librarians are defined as those who are currently 50 years of age and older.2 Excludes respondents reporting “Don’t know” (4%).3 For-Profit library results are not presented separately because of insufficient cases reporting; however, they are included in the Total Special results.
The senior librarians in our sample were further asked about the specific conditions that would make them consider delaying their retirement (results not shown in table or figure). For the majority of these senior staff members (56%), this consideration stems from their need for the compensation (salary and benefits) that would come from continuing to work. When the 68% of senior librarians were asked why they would accept an early retirement package, 65% indicated that they would like the chance to enjoy their life more or they want to pursue other leisure and career interests. Three in ten librarians provided a conditional response: they would accept an early retirement package if the money offered in the package was sufficient. Equally illuminating are the reasons provided by the 32% of senior librarians who would not accept an early retirement package: a significant minority (47%) reported that they cannot afford to retire early, mostly because they need more time to contribute to their pension funds.
Once again, therefore, we have support for the hypothesis that age of retirement is most strongly determined by monetary needs. A possible contravening influence on retirement timing is current job dissatisfaction. A high level of job dissatisfaction among senior librarians might outweigh the financial need to continue working and result in early retirement. Although we found some evidence of a relationship between low levels of job satisfac-tion and a greater interest in retiring at a younger age than on average, this finding accounts for only a very small proportion of current senior librarians (only 5% of senior librarians report being dissatisfied with their job).
In situations where the loss of senior librarians would signify a human resource deficit (either quantitatively or qualitatively), these data suggest that library administrations could encourage the postponement of retirement among their senior librarian workforce. Conversely (assuming budgets permit), in situations where retirements
SECTION E: Staff Retention 91The Future of Human Resources in Canadian Libraries
are viewed as opportunities for restructuring or redefining the staffing complement, it appears that most librar-ians would be receptive to accepting an early retirement package, although some of these individuals would only do so given an adequate package. Either way, the single most influential factor is that the librarians perceive a financial ability to retire early or to delay their retirement.
As for paraprofessional staff attitudes towards retirement, Table E.12 demonstrates very similar responses to those found among librarians, with 28% looking forward to retirement to a “great extent.” And again, there is not a great deal of sector variation in responses to this question. Still, as is the case for librarians, government and school paraprofessionals are the most likely to report that they are looking forward to their retirement to any extent (93% and 91%, respectively, indicating to “a great” or “some” extent).
Table E.12 Extent Senior Paraprofessional Staff1 Looking Forward to Retirement by Library Sector
(Individual Survey; n=666)
Percent Looking Forward to Retirement
Library Sector2 To a Great Extent To Some Extent To No Extent
TOTAL SAMPLE 28 58 14
TOTAL ACADEMIC 29 57 14
CARL 28 59 13
Other Academic 33 53 14
TOTAL PUBLIC 28 56 16
CULC 28 60 12
Other Public 29 46 25
TOTAL SPECIAL 26 61 13
Government 27 66 7
Non-Profit 18 55 27
TOTAL SCHOOL 27 64 9
Source: 8Rs Canadian Library Human Resource Individual Survey1 Senior Paraprofessionals are defined as those who are currently 50 years of age and older.2 For-Profit library results are not presented separately because of insufficient cases reporting; however, they are included in the Total Special results.
Two-thirds of senior paraprofessional staff would both consider delaying their retirement or accepting an early retirement package (Table E.13). The conditions that would make these individuals consider delaying their retire-ment are very similar to those found among professional librarians. For example, 7 in 10 cited the need for money. Similarly, when the 68% of senior paraprofessionals were asked why they would accept an early retirement pack-age the most predominant response was so they could pursue other interests (52%), followed by an adequate financial package (22%).
92 SECTION E: Staff Retention CANADIAN LIBRARY HUMAN RESOURCE STUDY
Table E.13 Percentage of Senior Paraprofessional Staff1 Who Would Consider Delaying Retirement or Accepting Early Retirement Package by Library Sector
(Individual Survey; n=676)
Percent2
Library Sector Consider Delaying Retirement Accept Early Retirement Package
TOTAL 69 68
TOTAL ACADEMIC 71 69
CARL 70 69
Other Academic 72 70
TOTAL PUBLIC 63 66
CULC 59 65
Other Public 74 67
TOTAL SPECIAL3 70 72
Government 64 75
SCHOOL 72 67
Source: 8Rs Canadian Library Human Resource Individual Survey1 Senior Paraprofessionals are defined as those who are currently 50 years of age and older.2 Excludes respondents reporting “Don’t know” (31%).3 Non-Profit and For-Profit library results are not presented separately because of insufficient cases reporting; however, they are included in the Total Special results.
E.6 Replacing Retiring Professional Librarians
The quantitative estimation of retirements presented in Section E.4 is an important component of the human re-source picture facing the Canadian libraries in the future. It does not, however, say anything about the qualitative aspects of human resource loss that might occur when librarians retire. Presumably, a good portion of retiring librarians are creating more than just empty positions, but they are also creating a vacancy in important knowl-edge, skills, and experience that individual libraries must replace. A series of responses from the institutional survey speaks precisely to this aspect of retirements, focusing on the ability to replace the lost skills, knowledge, and leadership qualities from departing senior librarians.
To what extent are Canadian libraries planning for the succession of their departing senior staff and to what extent do they anticipate having difficulties replacing critical competencies? By identifying the experiences of libraries in replacing core competencies, and by revealing if libraries are proactively planning for succession, this section portrays the current state of the library sector’s readiness to embrace the future retirement scenario.
Table E.14 presents the percentage of libraries experiencing difficulties replacing the skills/knowledge and leader-ship qualities lost by departing senior professional librarians; it also shows libraries that estimate an inadequate current pool of candidates eligible to replace these lost competencies in the future. Hence, the first and third columns represent historical difficulties experienced by libraries, and the second and fourth columns future dif-ficulties.
Libraries experienced greater difficulties replacing the leadership qualities lost when librarians retired than they did replacing their technical skills and knowledge. Anticipated future concern is also greater for leadership replacement than for skills and knowledge.
Two major points can be made from the results presented in Table E.14. First, as a whole, libraries not only ex-perienced greater difficulties replacing leadership qualities than skills and knowledge lost from departing senior librarians, but they are also more concerned about the inadequacy of their current pool of internal candidates in replacing leadership qualities than they are about replacing technical skills and knowledge.
SECTION E: Staff Retention 93The Future of Human Resources in Canadian Libraries
Second, special libraries are significantly more likely than the other sectors to report that their current pool of internal candidates is inadequate to replace either the skills and knowledge or the leadership competencies lost when senior librarians leave their organizations. In contrast, CARL and CULC institutions appear to be the most optimistic about their future ability to replace these qualities with their current pool.
Table E.14 Past and Future Ability to Replace Skills/Knowledge and Leadership Qualities Lost from Departing Senior Librarians1 by Library Sector
(Institutional Survey; n=245)
Percent
Skills/Knowledge Leadership Qualities
Library Sector2Experienced Difficulty
Replacing3Current Pool Inadequate
to Replace4Experienced Difficulty
Replacing3Current Pool Inadequate
to Replace4
TOTAL SAMPLE 28 40 36 46
TOTAL ACADEMIC 29 32 29 41
CARL 31 23 31 35
Other Academic 28 36 27 44
TOTAL PUBLIC 30 33 42 42
CULC 35 19 46 35
Other Public 29 37 40 44
TOTAL SPECIAL 21 62 38 59
Government 18 61 36 57
Non-Profit 26 59 47 58
Source: 8Rs Canadian Library Institutional Survey1 Senior Librarians are defined as those who are currently 50 years of age and older.2 For-Profit library results are not presented separately because of insufficient cases reporting; however, they are included in the Total Special results.3 Based on “yes” responses to the question: “Have you had any difficulties replacing the skills and knowledge and leadership qualities lost by departing senior professional librarians?” 4 Based on responses of “1” and “2” on a �ent pool of internal suitable candidates that could replace the skills and knowledge and leadership qualities lost by departing senior librarians?”
Tables E.15a and E.15b illustrate the significance of the most important barriers to replacing the competencies lost through departing senior librarians by library sector. Institutions report similar barriers to replacing lost competencies from retirements as they report barriers to recruitment (Tables D.3a and D.3b). Overall, at least half of Canadian libraries face any number of barriers when trying to replace competencies of senior staff.
However, within individual sectors, libraries demonstrate some interesting variations in the specific barriers they face. For example, almost three-quarters of public libraries say they have an inadequate pool of interested candi-dates, indicating issues with respect to attracting applicants to this sector. Approximately 70% of public libraries report an inadequate pool of qualified candidates, inadequate internal leadership/management training, or not having a succession plan as barriers, and 66% indicated that the inability to fast-track strong candidates were bar-riers to the replacement of the competencies held by departing senior librarians. Further, CULC libraries tend to encounter barriers with their current or potential staff, rather than institutional barriers (with the exception of their inability to fast-track strong candidates). Of all sectoral libraries, CARL institutions were least like to report an item as a barrier. These replacement patterns among CARL and CULC libraries are similar to those found for recruitment. Hence, CULC libraries tend to experience greater problems than do CARL libraries in filling their human resource needs, both from outside their organizations as well as from within their current professional librarian workforce.
94 SECTION E: Staff Retention CANADIAN LIBRARY HUMAN RESOURCE STUDY
Table E.15a Barriers to Replacing Competencies Lost by Retiring Librarians by Library Sector1
(Institutional Survey; n=226)
Percent
Library Sector
Inadequate Pool of
Qualified Candidates
Inadequate Pool of
Interested Candidates
Inadequate Leadership Training by
MLIS Programs
Inadequate Leadership/
Mngmnt. Training by
Organization
No Identification of Leadership Potential When
HiringBudget
RestraintsInadequate
Pay
TOTAL 66 65 53 66 56 68 58
TOTAL ACADEMIC 62 60 53 63 51 65 39
CARL 58 54 58 60 39 54 23
Other Academic 65 63 50 65 58 71 48
TOTAL PUBLIC 70 73 55 71 56 69 73
CULC 73 73 58 69 58 46 54
Other Public 69 73 54 71 56 78 80
TOTAL SPECIAL2 66 57 51 61 61 71 55
Government 52 44 50 60 68 71 52
Non-Profit 79 67 50 67 63 71 58
Source: 8Rs Canadian Library Human Resource Institutional Survey1 Based on responses”3,” “4,” and “5” on a 5-point scale, with “1” meaning “not at all” and “5” meaning “to a great extent”, to the question: “To what extent do the following issues prevent your organization from replacing the competencies lost by departing senior professional librarians?” 2 For-Profit library results are not presented separately because of insufficient cases reporting; however, they are included in the Total Special results.
Table E.15b Barriers to Replacing Competencies Lost by Retiring Librarians by Library Sector1
(Institutional Survey, n=223)
Percent
Library Sector
Inability to Fast Track Strong Candidates
Elimination of Middle-Level
PositionsNo Succession
PlanHiring Freeze /
LimitationSmall Size of
Library
Geographical Location of
Library
TOTAL 60 53 66 50 53 52
TOTAL ACADEMIC 55 54 61 46 45 46
CARL 58 50 58 31 15 31
Other Academic 53 56 63 54 60 54
TOTAL PUBLIC 66 51 70 45 56 63
CULC 77 42 58 31 19 42
Other Public 62 54 74 50 69 70
TOTAL SPECIAL2 55 55 67 66 60 44
Government 56 50 64 58 56 44
Non-Profit 67 64 72 67 64 44
Source: 8Rs Canadian Library Human Resource Institutional Survey1 Based on responses “3,” “4,” and “5” on a 5-point scale with “1” meaning “not at all” and “5” meaning “to a great extent”, to the question: “To what extent do the following issues prevent your organization from replacing the competencies lost by departing senior professional librarians?” 2 For-Profit library results are not presented separately because of insufficient cases reporting; however, they are included in the Total Special results.
The last survey results presented in this section on retirement are responses to the question asking institutions whether or not they have a succession planning strategy in place for professional librarians. Figure E.2 shows that
SECTION E: Staff Retention 95The Future of Human Resources in Canadian Libraries
less than one in ten Canadian libraries currently has a plan to make provisions for the development and replace-ment of professional librarians over a period of time and to ensure leadership continuity, with CULC libraries the most likely to have such a plan (31%).28
Only 1 in 10 libraries currently has a succession plan in place. This fact is one of the major contributors to experiencing difficulty replacing competencies that are lost when senior librarians retire.
These findings indicate one of three possible interpretations about libraries and their current readiness to em-brace future retirements. Canadian libraries are not implementing succession planning strategies, either because they do not perceive the need to do so, because they are overlooking the importance of preparing for retirements, or because they do not have the resources or know-how to do so. In perhaps only a minority of situations is the former explanation valid (e.g., in some small non-profit libraries). Rather, given the 11% retirement rate in the past 5 years and the predicted 39% retirement rate over the next 5 years, the need to prepare for these retirements is clear.
The low number of organizations with succession plans also suggests that libraries are not, by and large, viewing succession planning in the broader context that is warranted with the results from this study. Insofar as succession planning entails the recruitment, development, and replacement of all staff and at all levels (in other words the entire matrix of the human resource cycle), it is clear that Canadian libraries need to make it more of a priority to proactively plan for their long-term human resource needs. This conclusion is especially applicable to CARL libraries, which have the highest labour force needs and the highest recruitment and retirement rates.
Figure E.2 Organizations with Succession Plan by Library Sector (Institutional Survey; n=276)
TOTAL 9
TOTAL ACADEMIC 10
CARL 23
Other Academic 3
TOTAL PUBLIC 10
CULC 31
Other Public 6
TOTAL SPECIAL 8
Government 14
Non-Profit 5
For-Profit 0
0 10 20 30 40 Percent____________________________________________________________________________________________ Source: 8Rs Canadian Library Human Resource Institutional Survey
28 The 9% of libraries with a succession plan were also asked about the adequacy of the plan and if the plan was long-term. The majority (64%) felt that their succession planning strategy was adequate, and 82% reported having a succession plan that covers at least the next 5 years.
96 SECTION E: Staff Retention CANADIAN LIBRARY HUMAN RESOURCE STUDY
E.7 Strategic Human Resource Planning Implications
• Age and rate of retirement of the librarian workforce is an exceedingly complex planning issue for librar-ies.
• It is influenced at the macro level by a federally regulated pension plan and age-based social benefits with the issue of mandatory retirement still an outstanding question in many jurisdictions.
• It is vulnerable to local institutional policies that promote or delay retirements. HR planners would be advised to be very aware of age demographics and years of service of library staff. Most staff contribute to local pension schemes where entitlements are normally based upon an age/service factor for “full” pension. Attainment of this factor will also undoubtedly influence individual decisions to retire.
• It is very much a matter of individual choice; many retirement decisions could be based upon personal factors that are not predictable in planning. The 8Rs survey data suggest a number of critical factors that lead to great uncertainty for library organizations.
• Individuals’ predictions of retirement age seem to indicate that anticipated age of retirement is increas-ing, rather than decreasing, and that most individuals will be influenced by monetary variables, such as performance of investments and pension funds, which are very dynamic as well as differentially valued by individuals. This is substantiated by a recent poll of the Canadian labour force showing that the aver-age age of retirement is trending upwards (Canadian Labour Congress, 2004).
• Most senior librarians (those who would be nearing retirement age) do not feel strongly either way about their age of retirement.
• Paraprofessional retirement rates will not be quite as high as librarian retirement rates but will be hap-pening within the same timeframe, thus compounding the number and impact of retirements that library organizations are dealing with.
• Libraries should develop and support communication and planning processes that allow individuals to discuss their retirement planning and its attendant impact upon the library organization as openly as they feel able to do so. This is especially critical in instances where retirement is no longer mandatory at age 65.
• Currently, only 10% of libraries have a succession plan. Knowing that the bulk of most institutions’ retire-ments (librarians and paraprofessionals) will take place from 2009-2014, organizations should consider undertaking a 10-year succession management process for human resources designed to anticipate and focus effort upon managing the effects of retirement. Succession planning and management will be com-plex for many library organizations. Libraries must develop the “know how” and commit the resources to do continuous planning and management. Some of the key considerations could include:
• required competencies within libraries and within the individual institution (for both professional and paraprofessional positions);
• potential for restructuring positions to fulfill institutional needs and employing new competencies, for both professional and paraprofessional positions;
• recruitment incentives and marketing (both to the institution, and to library work in general) in light of the implied increased competition that will occur throughout the library community as a result of retirements. This becomes more urgent for institutions such as CULC libraries, who have stated that they face greater problems filling human resource needs both from within and beyond their current workforce pool.
SECTION E: Staff Retention 97The Future of Human Resources in Canadian Libraries
• Library associations will be wise to think in similar terms, as retirements will impact membership and the resultant change in demographics will undoubtedly reflect different expectations of the role of associa-tions.
• Retirees take with them knowledge and skills that have been acquired through years of experience. Librar-ies will have to judge how critical this loss will be and how to ameliorate the effects. Succession planning will have to consider graduated retirement plans, mentorship programs, internships and other schemes that allow transfer of essential knowledge and skills.
• Grooming efforts for leadership/management should be taking place at all levels of the library organiza-tion, including new entrants (both professionals and paraprofessionals). Again, library associations must think in similar terms.
• Some sectors in particular (CARL libraries, school libraries) are predicted to experience retirement rates above the norm. This must be communicated to decision-makers and funders as it will place a large bur-den upon organizations to respond strategically, whether through recruitment or restructuring.
SECTION F: Staff Retention 99The Future of Human Resources in Canadian Libraries
S E C T I O N F
Staff Retention: Inter- and Intra-organizational Mobility
F.1 Introduction
It is well known that librarians, particularly in academic libraries, tend to stay at the same workplace for many years, and sometimes for their entire careers. This longevity is of benefit to libraries since it provides greater
human resource predictability, both qualitatively and quantitatively. Low turnover rates are, for example, of mini-mal influence on the numerical demand-supply model. But a degree of turnover is also healthy, particularly in environments typified by innovation and change. As we will see, limited turnover also prohibits opportunities for promotion. The challenge for human resource managers is to establish a balance between staff stability and turnover, insofar as they are able.
Whether or not librarians stay at or leave their place of employment can also tell us something about their level of job satisfaction. That librarians are often noticed to stay in their positions long-term has been found to be based on satisfaction with particular areas of library service. Findings from Millard’s (2003) survey of academic librar-ians who had remained at a single institution for fifteen years or more also suggest that commitment to librarian-ship as a career is a primary motivator for retention.
Yet, the high proportion of women in the library workforce means that family responsibilities may have tradi-tionally precluded them from changing jobs and inhibited their ability to capitalize on opportunities for career advancement elsewhere in the sector (Montgomery, 2002). Moreover, as noted by British researchers Usherwood, et al. (2001), staff retention can also occur by default because workers feel they do not have transferable skills, or that few opportunities exist for them outside their current jobs.
The Association of Research Libraries’ Ad Hoc Task Force on Recruitment and Retention Issues (2002) findings indicate that within academic libraries, retention motivators differ throughout the course of an individual’s ca-reer. Newer professionals may be more influenced by salary, job duties, professional development, and mentoring or by gaining additional credentials. While mid-career and senior professionals and managers are also motivated by salary, they are also more likely to stay at their current library because of contextual or broader issues such as the work environment, relationships with colleagues, reputation of the library, and geographic location.
We address retention issues in this section of the report by examining organizational tenure rates and respon-dents’ explanations for why they stay at their current organization and why they have left their prior organization. The section concludes with an analysis of the match between the career interests and aspirations of professional librarians and the promotional opportunities provided within their libraries insofar as these factors are linked to
100 SECTION F: Staff Retention CANADIAN LIBRARY HUMAN RESOURCE STUDY
job satisfaction and ultimately, retention. Since we only have results for paraprofessional staff from the individual survey on these topics, they are presented in Appendix Table F.1 with no further comment.
F.2 Departure and Tenure Rates
Table F.1 displays the percentage of organizations that have had librarians leave in the year prior to the institution-al survey (2002) and a breakdown of the proportion that voluntarily departed or involuntarily left. In total, only 25% of libraries in the sample had at least one librarian leave in the past year, not including those who retired. Just under three-quarters (73%) left voluntarily and 27% left involuntarily.
One in every five libraries experienced a librarian departure in 2002 (excluding retirements): 73% left voluntarily and 27% left involuntarily.
In terms of sector differences, CARL and CULC libraries were much more likely to have a librarian leave (58% and 88%, respectively), with the greatest proportion departing on a voluntary basis (77% and 76%, respectively). The departure rates among the other academic and public sectors are much smaller, as are the proportion leaving on a voluntary basis. In contrast, the few departures in special libraries were primarily voluntary. The higher-than-average involuntary departures in non-CARL academic libraries of 42% and in non-CULC public libraries of 36% may reflect organizational downsizing in these sub-sectors in 2002.
Table F.1 Departing Professional Librarians in 20021 by Library Sector (Institutional Survey; n=288)
Percent
Departure Circumstances
Library Sector% Orgs. w/ Departing
Librarians in 2002Percent Departures
Voluntary Percent Departures
Involuntary2
TOTAL SAMPLE 25 73 27
TOTAL ACADEMIC 30 72 28
CARL 58 77 23
Other Academic 17 58 42
TOTAL PUBLIC 32 73 27
CULC 88 76 24
Other Public 17 64 36
TOTAL SPECIAL3 11 82 18
Government 14 83 17
Non-Profit 11 88 12
Source: 8Rs Canadian Library Institutional Human Resource Survey 1 Includes professional librarians leaving the organization in the past year (between January 1, 2002 and December 31, 2002), excluding retirements.2 Involuntary departures may include dismissals or relocations to other institutions within the same larger organizational structure (e.g., secondments within government).3 For-Profit library results are not presented separately because of insufficient cases reporting; however, they are included in the Total Special results.
Figure F.1 further demonstrates that inter-organizational librarian mobility is limited. More than three-quarters of senior librarians have worked at the same organization for at least 11 years. CARL and CULC librarians are especially likely to work for long periods in the same library (83%), while organizational longevity is not quite as apparent among non-profit senior librarians (56%). Results from another question show that 17% of these same senior librarians have never worked at a library other than the one they are in currently (results not shown in table).
SECTION F: Staff Retention 101The Future of Human Resources in Canadian Libraries
Figure F.1 Percentage of Senior Librarians1 Working at Current Library for More than 10 Years
(Individual Survey; n=1,110)
TOTAL 77
ACADEMIC LIBRARIES 78
CARL 83
Other Academic 68
PUBLIC LIBRARIES 80
CULC 83
Other Public 72
SPECIAL LIBRARIES 67
Government 70
Non-Profit 56
For-Profit 76
SCHOOL LIBRARIES 76
0 20 40 60 80 100 Percent
Source: 8Rs Canadian Library Individual Human Resource Survey 1 Senior Librarians are defined as those who have worked as a professional librarian for more than 15 years.
The greater organizational longevity of CARL and CULC senior librarians is an interesting finding given the greater-than-average number of departures that occurred in 2002 in these two sectors. These combined findings likely reflect the much bigger librarian staff employed by CARL and CULC libraries.
Overall, the career longevity of library staff suggests that turnover rates are not particularly high. In fact, when library administrators were asked if they were concerned about turnover rates, only 2 in 10 responded in the af-firmative (with little variation between sectors).
F.3 Inter-Organizational Mobility Interests
As mentioned in the introduction to this section, the organizational longevity of librarians might be a function of limited alternatives. The results presented in Table F.2, however, do not strongly support this explanation, since many librarians appear to stay out of choice. Four in ten new entrants, 47% of mid-career librarians, and 70% of senior librarians indicated that they would be “very happy to spend the rest of my career at this organization.”
These results speak positively to the levels of job satisfaction among most librarians. Interestingly, CARL librar-ians at all three stages of their careers were the most likely to agree with this statement.
The organizational longevity of librarians is an historical pattern that will likely continue into the future insofar as the current high quality work environment is also maintained.
102 SECTION F: Staff Retention CANADIAN LIBRARY HUMAN RESOURCE STUDY
Table F.2 Percentage of Librarians Interested in Spending Remainder of Career at Current Organization1 by Career Stage2 and Library Sector3
(Individual Survey; n=1,882)
Percent
Library Sector Recent Entrants Mid-Career Senior
TOTAL 40 47 70
TOTAL ACADEMIC 49 48 75
CARL 55 56 77
Other Academic 37 35 69
TOTAL PUBLIC 39 48 68
CULC 45 49 68
Other Public 29 46 69
TOTAL SPECIAL 30 45 60
Government 28 47 58
Non-Profit 32 49 56
For-Profit -- -- 75
SCHOOL -- -- 84
Source: 8Rs Canadian Library Individual Human Resource Survey 1 Based on responses of “4” and “5” on a 5-point scale with “1” meaning “strongly disagree” and “5” meaning “strongly agree” to the statement: “I would be very happy to spend the rest of my career at this organization.”2 Recent Professional Librarian Entrants are individuals who have been working as a professional librarian for less than 6 years, Mid-Career Professional Librarians have been working as a librarian for 6 to 15 years, and Senior Librarians have been working as a librarian for more than 15 years.3 Separate sub-sector results are not presented when there are fewer than 15 cases reporting.
Eighty-three percent of librarians had worked in at least one library prior to their current workplace (results not shown in table or figure). This group was further asked to indicate why they left their last place of employment. Just over half (52%) indicated that they left for personal reasons: 60% because they found a better job elsewhere, 43% because they were dissatisfied with their current job, and 20% because they had been laid off or their contract had ended.
But since we have found that most librarians tend to stay at their current organization for long periods, it is perhaps more fruitful to examine their explanations for why they stay. Tables F.3a, F.3b , and F.3c provide the personal, “pull,” and job market reasons, respectively, for librarians staying at their current library.
A quick glance at all three tables reveals that “pull” factors, such as liking their job, workplace, and co-workers, are the most compelling reasons why professional librarians stay at their workplace. Personal reasons, such as having a spouse who works in the same geographical area, wanting to stay in the community, and having friends or fam-ily who need the respondent’s attention were the second most likely reasons for staying. Job market reasons such as the unavailability of other jobs and not having time to look for another job were viewed as reasons for staying at their current workplace by a much smaller proportion of librarians.
As we would expect, job satisfaction (i.e., liking one’s job and workplace) is a strong retention motivator, and as Montgomery (2002) concluded, family and friend considerations are motivators for a large minority of librarians. Unlike Usherwood et al.’s (2001) findings, however, we do not have strong support for their conclusion that reten-tion is a function of lack of opportunities elsewhere.
Specifically, Table F.3a shows that 85% of librarians remain at their current workplace simply because they like the job, 79% because they like the workplace, and 84% because they like the people they work with. While employer loyalty is a motivating factor for only 56% of librarians, loyalty to patrons is somewhat stronger at 64%. With one exception (school librarians), there are few sector differences in “pull” reasons for staying.
SECTION F: Staff Retention 103The Future of Human Resources in Canadian Libraries
Table F.3a “Pull” Reasons for Staying at Current Job1 by Library Sector (Individual Survey; n=2,041)
Percent
Library Sector Like Job Like WorkplaceLike
Co-WorkersLoyalty to Employer
Loyalty to Library Patrons
TOTAL SAMPLE 85 79 84 56 64
TOTAL ACADEMIC 87 79 82 54 62
CARL 86 79 83 56 63
Academic 88 80 80 51 60
TOTAL PUBLIC 84 77 85 56 65
CULC 83 76 85 56 66
Public 86 81 86 57 63
TOTAL SPECIAL 86 79 82 57 66
Government 87 79 81 51 61
Non-Profit 84 81 83 65 75
For-Profit 83 79 85 65 67
TOTAL SCHOOL 94 88 94 50 67
Source: 8Rs Canadian Library Human Resource Individual Survey1 Based on responses “4” and “5” on a 5-point scale with “1” meaning “strongly disagree” and “5” meaning “strongly agree” to the question: “To what extent do you agree/disagree with the following statements about why you remain at your current organization?”
Moving onto Table F.3b, between one-third and one-half of respondents agreed that specific personal reasons motivate them to stay at their current jobs. The most prevalent motivator (51%) among the personal reasons is having a spouse or significant other that works in the same geographic area.
Table F.3b Personal Reasons for Staying at Current Job1 by Library Sector (Individual Survey; n=2,041)
Percent
Library Sector Spouse Works HereChildren/ Friendship
ReasonsWant to Stay in
CommunityFamily/Friends
Need Me
TOTAL SAMPLE 51 35 48 36
TOTAL ACADEMIC 47 32 44 34
CARL 46 29 44 34
Academic 48 37 43 35
TOTAL PUBLIC 53 41 53 38
CULC 53 43 56 40
Public 52 35 48 33
TOTAL SPECIAL 53 28 47 37
Government 52 28 47 38
Non-Profit 53 30 52 38
For-Profit 60 25 44 34
TOTAL SCHOOL 52 30 35 36
Source: 8Rs Canadian Library Human Resource Individual Survey1 Based on “4” and “5” responses on a 5-point scale with “1” meaning “strongly disagree” and “5” meaning “strongly agree” to the question: “To what extent do you agree/disagree with the following statements about why you remain at your current organization?”
104 SECTION F: Staff Retention CANADIAN LIBRARY HUMAN RESOURCE STUDY
Table F.3c Job Market Reasons for Staying at Current Job1 by Library Sector (Individual Survey; n=2,041)
Percent
Library SectorNo other jobs
available
Could not get other job at
current salaryNo success
finding other jobNo time to look
for other job
Need experience at current job before applying elsewhere
TOTAL SAMPLE 21 42 11 15 22
TOTAL ACADEMIC 19 45 9 12 17
CARL 17 44 8 13 19
Academic 21 47 12 11 14
TOTAL PUBLIC 22 38 11 15 26
CULC 22 39 11 15 27
Public 24 35 11 15 23
TOTAL SPECIAL 25 45 15 18 25
Government 26 50 12 19 24
Non-Profit 26 37 22 19 26
For-Profit 20 48 8 10 21
TOTAL SCHOOL 18 43 6 14 9
1 Based on “4” and “5” responses on a 5-point scale with “1” meaning “strongly disagree” and “5” meaning “strongly agree” to the question: “To what extent do you agree/disagree with the following statements about why you remain at your current organization?”
The small proportion of librarians indicating job market reasons for staying displayed in Figure F.3c suggest that the vast majority of librarians do not feel that a lack of alternatives results in the default decision to stay. In other words, the findings suggest that the librarian labour market is sufficiently open for those already working in the system. Furthermore, that four in ten librarians reported they could not easily get another job at their current sal-ary or benefits indicates that many librarians feel their salaries are above average. This interpretation is interesting given the very adequate salaries that were reported in the survey across sectors (See Table I.6a). Nonetheless, the pattern of sector variance in response to this question very closely follows the sector variation in median incomes. For example, academic librarians, who earn the highest median salaries, are among those most likely to agree that they stay in their library because they couldn’t get another job at the same salary.
The findings presented in this section indicate that many librarians have worked at the same organization for long periods and many also appear to be interested in remaining at the same organization for the duration of their careers, simply because they enjoy the work and environment. In contrast to prior research, librarians’ interest in continuing to work at the same library does not occur by default, stemming from a lack of alternate workplace choices or interests. The results, in fact, provide strong evidence that the Canadian librarian workforce is content and for the most part satisfied with their current employment situations.
F.4 Intra-Organizational Mobility: The Match between Career Aspirations and Promotional Opportunities
Though we do not find particularly high levels of turnover resulting from job dissatisfaction or limited alternative workplace options, the ability of librarians to move within an organization is worth examining, since it can influ-ence not only whether they stay in their organization but often enhances performance and serves as an achieve-ment motivator. Not having opportunities for mobility, however, can stifle performance, and in extreme cases result in work apathy or resignation. A lack of promotional opportunities might also prohibit an organization‘s ability to provide librarians with opportunities to gain leadership skills which, as the data from this study demon-strate, is an increasingly important but difficult to fulfill competency.
SECTION F: Staff Retention 105The Future of Human Resources in Canadian Libraries
Of course, the provision of promotional opportunities are only beneficial if library staff are interested in taking up these offers to advance their careers. An overall aim of this section, therefore, is to assess the match between the career aspirations of library staff and the promotional opportunities provided by libraries.
Table F.4 presents the proportion of professional librarians agreeing with the statement “I am interested in mov-ing into a more responsible position.” The results are presented by career stage and career level for three broad library sectors (see Table C.6 for a breakdown of library staff by career stage).
The data reveal that the majority of recent entrants (57%), half of mid-career librarians (50%), and just over one-third (36%) of senior librarians are interested in moving into a more responsible position than they are in currently. That career interests decrease as career stage and career level increase is understandable. It is a bit puz-zling that four in ten new librarians working in non-management positions, who presumably have another 10 to 20 years in their careers, are not interested in a more responsible position (which, for current non-management likely means “management”); however, it should be understood that these results represent the immediate career interests of respondents. As we will see in Table F.5, the longer-term career aspirations of new librarians are much more in line with the managerial needs of libraries.
Table F.4 Career Interests of Professional Librarians by Career Stage1, Career Level, and Broad Library Sector2
(Individual Survey; n=1,857)
Percent Interested in Moving into More Responsible Position3
Sector
Career Stage and Level Total Academic Public Special
New Librarian Entrants: 57 53 60 60
Non-Management 60 54 64 70
Supervisor / Middle Management 57 -- 58 55
Senior Administrator 37 -- -- --
Mid-Career Librarians: 50 42 58 51
Non-Management 53 44 60 58
Supervisor / Middle Management 50 41 58 47
Senior Administrator 42 40 44 47
Senior Librarians: 36 32 21 32
Non-Management 37 31 43 43
Supervisor / Middle Management 34 28 20 18
Senior Administrator 39 40 37 39
Source: 8Rs Canadian Library Human Resource Individual Survey1 Recent Professional Librarian Entrants are individuals who have been working as a professional librarian for less than 6 years, Mid-Career Professional Librarians have been working as a librarian for 6 to 15 years, and Senior Librarians have been working as a librarian for more than 15 years.2 Results are not presented by sub-sector because of insufficient cases reporting; results for school librarians are not presented at all for the same reason but are included in calculations of the totals.3 Based on responses of “4” and “5” on a 5-point scale with “1” meaning “strongly disagree” and “5” meaning “strongly agree” to the statement: “I am interested in moving into a position with more responsibility.”
106 SECTION F: Staff Retention CANADIAN LIBRARY HUMAN RESOURCE STUDY
Sector differences in Table F.4 indicate that academic librarians tend to be less interested in furthering their ca-reers by assuming more responsibility. All career levels of new, mid-career, and non-management senior librar-ians in academic libraries are the least interested in furthering their careers (when compared to their career-stage and career-level equivalents in other sectors).29 Given that academic libraries indicate a high need for their staff to perform management roles (See Table K.3), the results for academic libraries signal a potential problem in terms of the grooming of new entrants and mid-career librarians for senior-level management positions, as the latter are vacated through retirements.
Also of note in Table F.4 are the much stronger career aspirations of new librarian entrants in non-management positions who are working in special libraries (70%). At this point, we can only speculate on possible reasons for this finding. One explanation that can be eliminated is that the promotional opportunities within special libraries are much better at the entry level than they are elsewhere. The results presented in Table F.7 do not support this possibility since the same special librarians are less likely than new entrants within other sectors to indicate that they have good promotional opportunities.
Table F.5 provides a more detailed picture of the long-term (10-year) career aspirations of non-management new professional librarian entrants. One-third (32%) indicated that they would like to continue working at the same non-managerial level as they are in currently. But half of new librarians stated that they would like to move into a supervisory or middle management position (40%) or a senior administrative position (10%). A further 18% indicated an “other” response (e.g., retirement, teaching, specialist, non-traditional library work, or non-library work).
Table F.5 Future Career Level Aspirations1 of Non-Management Recent Professional Librarian Entrants2 by Library Sector3
Source: 8Rs Canadian Library Human Resource Individual Survey1 Based on responses to the question: “What kind of work would you like to be doing in 10 years from now?”2 Recent Professional Librarian Entrants are defined as individuals who have been working as a professional librarian for less than 6 years.3 Results for For-Profit, Non-Profit, and for School librarians are not presented separately because of insufficient cases reporting; however, they are included in the Total Sample results. For-Profit and Non-Profit librarian results are also shown in the Total Special results.4 Other includes retirement, teaching, specialist, non-traditional library work, and non-library work.
29 One might suggest that the results reflect the fact that academic librarians were most strongly affected by a shortage of promotional opportunities offered during the 1990s as a result of hierarchical flattening and workforce downsizing that occurred at that time. In short, those working in academic libraries at that time may have lost interest in furthering their careers in response to this organizational restructuring. Since we have no evidence to suggest that academic libraries were any more likely to have restructured than other libraries and since new librarians working in academic libraries are also less likely than their public and special counterparts to express an interest in increasing their responsibility levels, however, this explanation, does not carry a great deal of validity.
SECTION F: Staff Retention 107The Future of Human Resources in Canadian Libraries
The sector differences reveal an interesting story with respect to special librarians. As shown in the previous table, 70% of special librarians who have been in their careers for less than 6 years expressed an interest in taking on more responsibility in their jobs, but as shown in Table F.5 only one-third (35%) indicated that they would like to be working in a supervisor, middle management, or senior administrative position in 10 years from now. With 31% stating that they would like to be working in an “other” capacity, it is clear that the “responsibility” interest among special librarians often lies outside the parameters of management within a traditional library environment. A closer look at these respondents revealed that they are primarily interested in doing non-tra-ditional librarian work (e.g., “something information related, but outside the library,” “information brokering,” “information architecture”). Though the “responsibility” interests of new librarians working in special libraries may include management positions, they also cover a more diverse set of interests outside the traditional sphere of the library.
In contrast, the future career aspirations of academic and public librarians shown in Table F.5 exactly match those reporting that they are interested in moving into a more responsible position (Table F.4). For example, 54% of academic, non-management, recent librarian entrants indicated that they would like more responsibility in their jobs and as shown in Table F.5 the exact same proportion (54%) responded that they would like to see themselves in a management position in 10 years from now. Again, however, the future career aspirations among academic librarians are less likely than public librarians to be in the realm of management (54% compared to 60% of public librarians). The results provided in Table F.6 provide at least a partial explanation for this difference.
Table F.6 captures the proportion of librarians who feel they are qualified to move into a higher position. Overall, a significant majority (69%) of all professional librarians report that, given their education, training, and experi-ence, they are qualified to move into a higher position. The combined results from Tables F.4, F.5, and F.6 suggest that a majority of professional librarians are both interested and qualified to move into more responsible positions in management.
Table F.6 Percentage of Librarians Self-Reporting as “Qualified” for Higher Position1 by Career Stage2 and Library Sector
(Individual Survey; n=1,824)
Percent “Agreeing”
Library Sector Recent Entrants Mid-Career Senior
TOTAL 55 68 75
TOTAL ACADEMIC 49 63 73
CARL 48 61 73
Other Academic 50 67 73
TOTAL PUBLIC 57 75 77
CULC 52 77 79
Other Public 65 67 73
TOTAL SPECIAL 61 65 72
Government 58 69 70
Non-Profit 59 58 68
For-Profit3 -- -- 84
SCHOOL3 -- -- 83
Source: 8Rs Canadian Library Human Resource Individual Survey1 Based on responses of “4” and “5” on a 5-point scale with “5” meaning “strongly agree” to the statement: “Given my education, training, and experience, I am qualified to move into a higher level position.”2 Recent Professional Librarian Entrants are individuals who have been working as a professional librarian for less than 6 years, Mid-Career Professional Librarians have been working as a librarian for 6 to 15 years, and Senior Librarians have been working as a librarian for more than 15 years.3 Separate career stage results are not presented when there are fewer than 15 cases reporting; however, they are included in the Total results.
108 SECTION F: Staff Retention CANADIAN LIBRARY HUMAN RESOURCE STUDY
Furthermore, the sector differences shown in Table F.6 reveal that compared to other sectors, academic librarians feel less prepared to move up the hierarchy. This finding may explain the somewhat lower career aspirations of academic librarians, since one is more likely to want to move up the ladder if one is qualified to do so. The results also suggest that the education, training, and experience demands that are required for management positions may be more intense in academic libraries than they are elsewhere. If this is so, then the training of academic library staff is of even greater importance, especially given the very high managerial needs within the academic sector. We have no data, however, to completely eliminate the possibility that academic librarians are simply less interested in working in management positions. In fact, as displayed in Table K.5, interest among academic librarians (and particularly those working in CARL institutions) in managing or supervising others is below the interest expressed by librarians in other sectors.
So far, the results presented in this section indicate that most professional librarians are interested in (and quali-fied to) move into more responsible, higher-level, and management positions. But does this interest match with the opportunities for promotion that are offered within libraries? Table F.7 presents the percentage of librarians agreeing that they are provided with opportunities to advance their careers. Overall, the results are fairly positive, with 65% or more “agreeing” or “strongly agreeing” that they have opportunities for advancement. Put another way, the proportion of librarians interested and qualified to move into more responsible positions is very close to the proportion indicating they have opportunities for advancement. For example, 65% of recent entrants agree that they have opportunities to advance their careers, 57% are interested in taking on more responsibilities, and 55% report that they are qualified to do so. Furthermore, even though recent entrants are slightly more interested than longer-term librarians in furthering their careers and are slightly less likely to be provided with opportuni-ties to do so, the differences are not great, and we can still conclude overall that there is a good match between interest, qualifications, and opportunities among new librarians.
Librarians’ interest in moving into more responsible positions that often entail managing match well with the perceived promotional opportunities provided in their workplaces.
SECTION F: Staff Retention 109The Future of Human Resources in Canadian Libraries
Table F.7 Librarian Perceptions of Career Advancement Opportunities1 by Career Stage2 and Library Sector
(Individual Survey; n=2,001)
Percent “Agreeing” “Job Provides Opportunities for Career Advancement”
Career Stage
Library Sector Recent Entrants Mid-Career Senior
TOTAL 65 74 76
TOTAL ACADEMIC 68 79 82
CARL 66 81 81
Other Academic 73 75 85
TOTAL PUBLIC 66 78 74
CULC 69 77 73
Other Public 60 80 76
TOTAL SPECIAL 60 57 71
Government 58 60 74
Non-Profit 63 50 67
For-Profit3 -- -- 69
SCHOOL3 -- -- 65
Source: 8Rs Canadian Library Individual Human Resource Survey1 Based on responses to the question: “In my job I am provided with opportunities to advance my career.”2 Recent Professional Librarian Entrants are individuals who have been working as a professional librarian for less than 6 years, Mid-Career Professional Librarians have been working as a librarian for 6 to 15 years, and Senior Librarians have been working as a librarian for more than 15 years.3 Separate career stage results are not presented when there are fewer than 15 cases reporting; however, they are included in the Total results.
A further observation to be made from the three tables is that the lower career aspirations and qualifications of academic librarians is not a function of poorer advancement opportunities in this sector. Again, focusing on new entrants, 68% of those working in the academic sector agree they have career advancement opportunities, com-pared to 66% in public and 60% in special libraries. In fact, the career advancement opportunities among senior academic administrators appear to be the greatest (82% compared to 74% in public, and 71% in special libraries). The somewhat lower career advancement opportunities in special libraries, on the other hand, might explain the tendency for new librarians in this sector to be interested in working outside the traditional library realm in the future.
Though the opportunities for career advancement are fairly positive from the librarian perspective, it is interest-ing that a much smaller proportion (35%) of library administrators reported that they are able to offer “good” or “excellent” promotional opportunities (Table F.8). Still, the cross-sectoral trends are the same. In both surveys, promotional opportunities are the greatest in the academic sector and the lowest in the special library sector.
Library administrators were provided with a list of four possible reasons that contribute to a lack of promotional opportunities at their libraries. Table F.8 also presents the sectoral results for the most-often cited reason. Two-thirds of library administrations agreed that limited librarian turnover hampers the promotional opportunities they are able to offer their staff. Hence, these findings illustrate the negative edge of the turnover sword. The re-sults also have implications for the finding that 20% of institutional respondents were concerned about turnover rates. Specifically, some administrators may have expressed concern over turnover rates not because they are too high, but, as the results in Table F.8 suggest, because they are too low.
110 SECTION F: Staff Retention CANADIAN LIBRARY HUMAN RESOURCE STUDY
Table F.8 Percentage Offering “Good” or “Excellent” Promotional Opportunities1 and Limited Librarian Turnover as a Barrier to Promotional Opportunities2 by Library Sector3
(Institutional Survey; n=274)
Percent
Library SectorAble to Offer “Good” or Excellent”
Promotional OpportunitiesLimited Librarian Turnover Contributes to a Lack of Promotional Opportunities
TOTAL 35 69
TOTAL ACADEMIC 48 68
CARL 62 64
Other Academic 42 70
TOTAL PUBLIC 36 79
CULC 50 81
Other Public 32 78
TOTAL SPECIAL 22 56
Government 18 57
Non-Profit 29 49
Source: 8Rs Canadian Library Human Resource Institutional Survey1 Based on “4” and “5” responses on a 5-point scale with “1” meaning “poor” and “5” meaning “excellent” to the question: “How would you rate the current promotional opportunities for professional librarians?” 2 Based on “4” and “5” responses on a 5-point scale with “1” meaning “not at all” and “5” meaning “to a great extent” to the question: “To what extent do the following items contribute to a lack of promotional opportunities for professional librarians in your organization?” 3 For-Profit library results are not presented separately because of insufficient cases reporting; however, they are included in the Total Special results.
While high turnover rates are not a concern, limited librarian turnover is a major barrier to offering promotional opportunities.
The results also have important implications for the degree of concern that should be directed to retirements, in-sofar as retiring librarians create opportunities for advancement among remaining staff. This does not mean that organizations should neglect to develop strategies to replace the competencies and corporate “memories” lost by retirements. But it does put a different spin on retirements; rather than being viewed strictly as a human resource loss problem, retirements might be viewed as an opportunity to create a more flowing and dynamic human re-source environment. This opportunity can only be exploited, however, if accompanied by appropriate training, development and mentorship.
It should also be noted that public libraries were most likely (79%) to view limited turnover as a contributor to a lack of promotional opportunities. Though limited turnover was not found to be a major barrier to promotional opportunities for special libraries, budgetary restrictions were cited by 60% of special library administrators as the major reason for limited librarian turnover (results not shown in table).
In summary, the findings in this section on inter- and intra-organizational mobility and retention highlight some important interrelated human resource issues that are affecting all sectors of libraries, albeit to varying degrees. High turnover rates do not appear to be a concern, although limited librarian turnover clearly serves as an im-pediment to upward mobility for librarians. Since Canadian libraries appear to be benefiting from having the loyalty of a long-term and fairly content workforce, increasing turnover rates just to provide more promotional opportunities is not a recommendation borne out by the data. Rather, the existing promotional opportunities match fairly well with the current career interests of the librarian workforce. Though we take a closer look at the match between the specific competency needs of libraries with the competencies held by librarians in Section K, these results suggest that the parameters exist for the mobility of many librarians into more responsible manage-ment positions.
SECTION F: Staff Retention 111The Future of Human Resources in Canadian Libraries
These conclusions, while perhaps most accurately capturing the situation for the public library sector, do not ap-ply equally to all sectors. Specifically, if the lower levels of perceived preparedness to move into more responsible positions explains the finding that academic librarians hold somewhat lower career aspirations, the conditions re-quired for the upward mobility of librarians is a matter that warrants further attention in this sector. The findings elsewhere in this report that academic libraries are especially in need of management and leadership functions also imply that a more rigorous management and leadership grooming initiative be part of the academic sector human resource agenda. But since many academic librarians are, for whatever reason, simply not interested in working in more responsible positions, escalating management and leadership grooming initiatives may not help bridge the gap between the needs of the organization and the interests of staff. Perhaps academic libraries could benefit from educating their staff, and particularly new entrants, about the high probability that they will be ex-pected to perform a managerial role at some point in their careers.
Special libraries present an altogether different scenario with respect to the match (or mismatch) between the organizational needs and staff career aspirations. Though relatively few special librarians experienced a librar-ian departure in 2002, there is evidence that this group of librarians is looking outside their sector, and indeed outside traditional library environments altogether for career opportunities. The data suggest that this interest is in part driven by the somewhat lower promotional opportunities provided within the sector. It is also very pos-sible, however, that the slightly younger age profile of special librarians means they are more aware of and more interested in working in new fields of librarianship that are more directly and visibly aligned with the growing knowledge economy.
F.5 Strategic Human Resource Planning Implications
• Turnover of staff is not a problem for most libraries. Factors contributing to retention include positive work relationships and challenging work environments, loyalty to the organization and its users, support and recognition for what librarians contribute, support for professional development and growth, more-than-adequate salaries and benefits, personal ties to the community, and location and reputation of the organization.
• As libraries tend to retain staff members for large portions of their entire careers, recruitment decisions are critical. Institutions need to set selection criteria that assess potential and ability to grow with the needs of the organization. New recruits need to understand how their career aspirations “match” the needs of the institution and assess whether the organization is a good fit for them.
• Lack of turnover is not a concern except insofar as it has affected upward mobility or promotion oppor-tunities for librarians. Libraries can encourage employee growth by providing challenging assignments and additional professional development throughout their careers. If this is not immediately possible, individuals wishing to expand their skill sets and professional competencies can also look to professional and other associations for opportunities to build skill sets while making a professional contribution.
• Conditions exist for many new librarians to move into management positions early in their careers. Most librarians are interested in and feel qualified to move into more responsible and more senior positions. Upon recruitment, individuals need to be apprised of the management needs of the organization and library organizations can support them through appropriate training, development and mentorship. Op-portunities to experience and practice management tasks should be made available to new recruits so that knowledge and skill levels can be assessed early and appropriate career planning done. Library schools and library associations similarly have a role to play in ensuring that education and development opportunities are offered from first career choice and throughout the career span.
112 SECTION F: Staff Retention CANADIAN LIBRARY HUMAN RESOURCE STUDY
• Collective agreements and internal policies, as well as internal organizational and work structures, can impede or promote progression and professional growth. Institutions would be well-advised to examine these structures.
• Libraries must develop and support a culture where every individual is encouraged to play a leadership role in whatever position they hold. Institutions need to communicate what leadership looks like in their setting, what is expected and how it will be recognized within their organization.
SECTION G: Education 113The Future of Human Resources in Canadian Libraries
S E C T I O N G
Education
G.1 Introduction
Library education is a significant factor in the supply side of the human resource equation. As competency needs shift within the profession, expectations of graduates shift, and presumably, so does curricula content.
The library education system may be said to be the key point of entry into library work, providing both an intel-lectual grounding and a socialization into the ethics and values of librarianship. Recruitment into educational programs is then, the real point of entry into the human resource equation.
As the MLIS is the typical minimum hiring requirement for professional librarians, curriculum content is obvi-ously of concern to those making human resource decisions. Frequently, discussions within the literature focus on the relevancy of the MLIS curriculum to the needs of the workplace. While it is generally acknowledged that the MLIS provides socialization into the profession of librarianship, the management elements are perhaps less pronounced than other educational dimensions. There is, for example, an often-stated need by practitioners for content that relates to management and leadership skills. Savard and Laplante (2001) indicate that important competencies identified by employers in all library sectors in Quebec include public services and management. While personnel management was ranked lower by school and special libraries, it rated high for all other types of libraries. Budgetary management was of greater importance within regional public library systems. Still, schools have been presenting a greater number of courses on management, marketing and entrepreneurship (Haycock and Oh, 1999). The only other area accorded lesser status historically is that of a research dimension in both the profession and the academic curriculum, although there are signs that this is beginning to change as well.
The differences between library “education” and library “training” have been under discussion for at least the past generation, with training identified as how to perform specific responsibilities or tasks, and education as a broader intellectual approach to ethics, values and principles (Canadian Association of Research Libraries, 1982). A review of much of the material available regarding MLIS and library technician programs suggests that many in the library world view the Masters level program within the definition of “education” and the library technician program within “training.” The literature also indicates that this is changing to a small extent, as some “knowl-edge-based” course content is emerging within both types of programs. Still, knowledge-based courses in library technician programs are more limited, and do not typically include such topics as policy development, material selection, and complex information analysis (Davidson-Arnott, 1998).
114 SECTION G: Education CANADIAN LIBRARY HUMAN RESOURCE STUDY
While library technician programs are very much oriented towards providing students with the more concrete skills for employment, graduate MLIS programs are more focused on research and advancement of knowledge in the LIS field generally. The result for MLIS programs is the recognition of multiple stakeholders and accountabili-ties. In other words, the key stakeholder in graduate programs is not necessarily the employer, as MLIS programs must adhere to both professional accreditation standards and to university research and curriculum standards.
However, formal education for library work is not simply a question of what is learned within a library-specific program. As we see postings that require candidates to possess advanced technology skills, additional languages, or subject specializations, we recognize that some of the success of the library profession can be measured by those who have been attracted, and/or recruited to the field. For example, MLIS graduates traditionally tend to be older than in other fields, as do paraprofessionals, who may hold other degrees and are choosing their program as part of a career change (Robertson, 2000). While this will make for shorter careers, it can also mean that new professionals are coming to the field with tested competencies that can be transferred to the library workplace.
We know that job functions that were formerly the sole responsibility of the librarian have shifted to parapro-fessional library staff (including technicians), and that a number of Canadian library directors have stated they would like to see this trend continue by employing librarians for managerial positions only (Harris and Marshall, 1998). Library technician programs have also changed their curriculum content significantly, incorporating new technologies, and broader subject areas (Robertson, 2000).
The section begins with a presentation of librarians’ and paraprofessionals’ educational backgrounds; however, the major focus of the analysis is an assessment of library schools and library technician programs captured in Section G.3.
G.2 Educational Background
Table G.1 provides the year range in which the professional librarians in our sample received their MLIS degree. Interestingly, despite that hiring has not been consistent over the past three decades, MLIS degree attainment is remarkably even across time. Roughly 3 in 10 librarians received their degree before 1980, three in ten in the 1980s and again, three in ten during the 1990s.
These data, on their own, suggest that over the previous 30 years or so, there have been steady injections of li-brarians into the Canadian library workforce. However, there are several reasons why this apparent symmetry is not likely. First, these data defy the older age profile which is not evenly distributed. Table C.10 shows that 35% of librarians are under the age of 45, 40% are ages 45-54, and 25% are 55 years old or older. We also know that hiring rates of librarians have not been stable over the previous thirty years. In other words, the graduation dates presented in Table G.1 do not reflect the lag in hiring that librarians experienced in some time periods more than others. Moreover, these figures do not include graduates who left librarianship altogether because they could not get a job.
SECTION G: Education 115The Future of Human Resources in Canadian Libraries
Table G.1 Year Received MLIS Degree by Library Sector (Individual Survey; n=1,944)
Year Range Received MLIS Degree
Library Sector Pre 1980 1980-1989 1990-1999 2000-2004
TOTAL 29 31 27 13
TOTAL ACADEMIC 29 32 26 13
CARL 30 33 24 13
Other Academic 27 30 31 12
TOTAL PUBLIC 30 32 27 11
CULC 30 33 27 10
Other Public 28 31 27 14
TOTAL SPECIAL 28 26 29 17
Government 33 27 27 14
Non-Profit 17 25 38 20
For-Profit 33 31 19 17
SCHOOL 28 41 24 7
Source: 8Rs Canadian Library Human Resource Individual Survey
The librarians in the individual sample were asked to list other types of education they have, in addition to their MLIS degrees. Only 29% of all librarian respondents stated that they possessed other education (in addition to their undergraduate and MLIS degrees).
As shown in Table G.2, a second Masters degree is the most-frequently-stated credential, with academic and non-profit librarians the most likely to have this additional education (27% and 28%, respectively, compared to 19% of the total sample). Very few librarians hold either a library technician certificate/diploma (3%), or a PhD (2%), but greater proportions (11%) also have an Education degree (mostly, of course, among school librarians—59%). Overall, however, the results in Table G.2 suggest that while librarians may have worked in other careers, they appear to follow a fairly straight educational path toward librarianship.30
30 This analysis was also done by career stage, but little difference was found in other education credentials between early entrants, mid-career, and senior librarians. However, recent entrants and mid-career librarians were slightly more likely to have other education than senior librarians, which is a logical finding in light of our increasingly credentialist society.
116 SECTION G: Education CANADIAN LIBRARY HUMAN RESOURCE STUDY
Table G.2 Other Education Among Librarians by Library Sector (Individual Survey; n=2,242)
Percent
Library SectorLibrary Tech. Cert./
DiplomaEducation Degree Other Masters Degree PhD
TOTAL 3 11 19 2
TOTAL ACADEMIC 3 12 26 3
CARL 2 11 27 2
Other Academic 5 15 23 4
TOTAL PUBLIC 2 9 11 1
CULC 3 8 11 1
Other Public 2 10 10 <1
TOTAL SPECIAL 4 9 18 1
Government 5 11 14 1
Non-Profit 3 5 28 1
For-Profit 0 8 14 4
SCHOOL 12 59 12 0
Source: 8Rs Canadian Library Human Resource Individual Survey
Half of paraprofessionals have earned a university degree.
Paraprofessional staff were asked to provide the highest level of education they have attained (Table G.3). Most notably, half of the paraprofessionals possess a university degree (45% at the undergraduate level and 5% at the graduate level). Only 36% earned a post-secondary certificate or diploma, with seven in ten of these from a library technician program. Even fewer (14%) reported “high school diploma” as their highest level of education.
As was the case for professional librarians, the most highly-educated paraprofessionals work within school librar-ies (61% with an undergraduate degree and 11% with a graduate degree). Though we might expect that many of these undergraduate degrees are in education, only 26% specified that they received an education degree.
SECTION G: Education 117The Future of Human Resources in Canadian Libraries
Table G.3 Highest Level of Education Among Paraprofessional Staff by Library Sector
(Individual Survey; n=1,884)
Percent
Library Sector High School Diploma Post-Sec. Dip./Cert. Undergrad Degree Graduate Degree
TOTAL 14 36 45 5
TOTAL ACADEMIC 13 32 49 6
CARL 14 26 52 8
Other Academic 10 41 45 4
TOTAL PUBLIC 17 39 41 4
CULC 14 36 46 4
Other Public 23 45 29 3
TOTAL SPECIAL 9 54 33 4
Government 11 59 27 3
Non-Profit 6 47 39 8
For-Profit 8 49 43 0
SCHOOL 3 25 61 11
Source: 8Rs Canadian Library Human Resource Individual Survey
CARL paraprofessionals are also somewhat more likely to have a university degree (52% with an undergraduate degree and 8% who earned a graduate degree). Conversely, paraprofessionals working in small public libraries were most likely to report having a high school degree as their highest level of education (23%), though they are also respectably represented in the post-secondary diploma/certificate category (45%). Overall, Table G.3 dem-onstrates that most paraprofessional staff are likely to have obtained some sort of post-secondary education.
Table G.4 provides more detailed information about the library technician education among paraprofessionals. Four in ten paraprofessional staff hold a library technician diploma or certificate, with most obtaining this credential in the 1990s (37%). On the whole, the time period of earning library technician credentials roughly follows their librarian counterparts (Table G.1), with two-thirds of either staff having received their accreditation between 1980 and 1999.
118 SECTION G: Education CANADIAN LIBRARY HUMAN RESOURCE STUDY
Table G.4 Library Technician Certificate/Diploma Holders and Year Obtained Among Paraprofessional Staff by Library Sector
(Individual Survey; n=1,895)
Year Received Cert./Diploma
Library Sector Lib. Tech.Cert./Dip. Pre 1980 1980-1989 1990-1999 2000-2004
TOTAL 41 17 28 37 18
TOTAL ACADEMIC 39 24 23 39 14
CARL 28 27 28 36 9
Other Academic 57 22 20 41 17
TOTAL PUBLIC 34 12 31 38 19
CULC 34 12 34 35 19
Other Public 34 13 25 43 18
TOTAL SPECIAL 68 15 32 35 19
Government 68 15 30 37 18
Non-Profit 64 18 26 39 17
For-Profit 77 7 43 23 27
SCHOOL 37 18 22 33 37
Source: 8Rs Canadian Library Human Resource Individual Survey
Table G.4 further indicates that library technicians are considerably more likely (68%) to be employed in special libraries. Further, library technicians in academic libraries are more likely to have received their certificate before 1980 (24% compared to 17% for the total sample), suggesting an older paraprofessional cohort in this sector. School libraries’ higher-than-average tendency for hiring recent library technician graduates (37% of whom re-ceived their credential within the past 4 years) underscores the trend in these workplaces toward hiring parapro-fessionals, rather than MLIS degree holders.
As they should be, the educational credentials of professional librarians are higher than those of paraprofession-als. The differences, however, are perhaps as great as we might expect, considering that half of paraprofessionals have a university degree.
SECTION G: Education 119The Future of Human Resources in Canadian Libraries
G.3 Evaluation of Education
I Evaluation of Library School ProgramsOur evaluation of library school programs is from the perspective of the library organization as well as of those who have recently completed their programs.
Beginning with the organizational view, Figure G.1 demonstrates that three-quarters of libraries responded posi-tively when asked if “the education provided in MLIS programs equips graduates with the competencies required to be professional librarians in your organization.” Consensus on this favourable evaluation is apparent for most library sectors, although we note the less-favourable CULC response of only 56%.
Figure G.1 Percent of Library Administrators Agreeing MLIS Programs Equip Graduates with Needed Competencies1 by Library Sector
(Institutional Survey; n=264)
��
��
��
��
��
��
��
��
��
��
�������������
���������������
�����
���������������
�������������
����
������������
��������������
����������
���������
� ���������
�� �� �� �� �� �� �� �� ���
Source: 8Rs Canadian Library Human Resource Institutional Survey1 Based on “yes” responses to the question: “Do you think the education provided in MLIS programs equips graduates with the competencies required to be professional librarians at your organization?”2 For-Profit library results are not presented separately because of insufficient cases reporting; however, they are included in the Total Special results.
Although the majority of libraries positively rated MLIS programs, the most common suggestion for improving library school education was to increase management, leadership, and business skills training.
Despite the positive assessment of MLIS programs by most respondents, there was no shortage of suggestions for how to improve MLIS education (Table G.5). The majority (58%) of suggestions revolved around management, business and leadership skill training, with particular emphasis on management. These results are very much in line with the finding that management and leadership skills were ranked as two of the most important and difficult to fulfill competencies when hiring (Table D.3). That academic and public libraries were most likely to rank both management and leadership competencies as important to have and difficult to find also parallels the results in Table G.5.
120 SECTION G: Education CANADIAN LIBRARY HUMAN RESOURCE STUDY
Table G.5 Top 5 Suggestions for How to Improve Library Science Programs1 by Library Sector2
(Institutional Survey; n=181)
Percent
More Management/Business/Leadership Skills Training
Library Sector Total
More Mngmt.Skills
Training
More Business
Skills Training
More Leadership
Training
More Core
Technical Skills Training
More Practical
Experience
More Soft Skills Training
TOTAL 58 37 31 14 38 21 20
TOTAL ACADEMIC 60 42 17 17 52 17 13
CARL 61 61 6 17 44 17 17
Other Academic 59 32 24 18 56 18 12
TOTAL PUBLIC 68 47 45 16 24 22 24
CULC 74 42 47 37 21 37 42
Other Public 67 48 45 10 25 17 18
TOTAL SPECIAL 40 16 24 8 44 22 20
Government 41 18 18 14 41 23 23
Non-Profit 11 6 6 6 50 22 17
Source: 8Rs Canadian Library Human Resource Institutional Survey 1 Based on categorized responses to the open-ended question “How could the curriculum content of MLIS programs be improved?”2 For-Profit library results are not presented separately because of insufficient cases reporting; however, they are included in the Total Special results.
But there were also many suggestions provided regarding the improvement of core technical skills training in-cluding information technologies, acquisitions, research, teaching, and cataloguing (38%). Academic libraries and especially non-CARL ones, were the most likely to provide this suggestion. Again, these findings parallel the earlier reported results demonstrating technology skills as one of the most important but difficult to fulfill com-petencies when hiring librarians (Table D.3).
As well, two in ten (21% of libraries would like to see greater opportunities for students to be exposed to the prac-tical aspects of being a librarian through internship programs that are targeted specifically to their sector. One in five also expressed an interest in improving library education by offering more training in soft or interpersonal skills. Again, CULC libraries were the most likely of all sectors to provide these two suggestions; 37% recom-mended more practical experience and 42% more training in soft skills.
The results presented in Figure G.1 and Table G.5 combine with the finding that CULC libraries were much more likely than on average to indicate that a barrier to the successful recruitment of librarians was “inadequate MLIS education” (44% CULC libraries agreed with this statement compared to only 29% of the total sample) to suggest that CULC libraries in particular are less satisfied with MLIS education.
In response to the question asking about the level of input libraries have into the curriculum content of MLIS programs, Table G.6 clearly indicates that it is minimal. Predictably, academic libraries were the most likely to report that they had at least some input in the curriculum (35%) and again we see that a large majority (88%) of CULC libraries have little or no input.
SECTION G: Education 121The Future of Human Resources in Canadian Libraries
Table G.6 Level of Input into Curriculum Content of MLIS Programs1 by Library Sector
(Institutional Survey; n=276)
Percent
Library Sector Little or No Input Some Input Much Input
TOTAL 76 7 17
TOTAL ACADEMIC 65 15 20
CARL 69 19 12
Other Academic 63 12 25
TOTAL PUBLIC 81 4 15
CULC 88 8 4
Other Public 79 2 19
TOTAL SPECIAL2 81 4 15
Government 77 6 17
Non-Profit 83 0 17
Source: 8Rs Canadian Library Human Resource Institutional Survey 1 Based on responses of “1” and “2”, and “4” and “5” base�does your organization have into the curriculum content at any of Canada‘s 7 MLIS programs?” 2 For-Profit library results are not presented separately because of insufficient cases reporting; however, they are included in the Total Special results.
The results on library education do not depict a situation of great displeasure with the training provided by MLIS programs (other than among CULC libraries). While most libraries are satisfied with the instruction provided, there is still a clear sense that improvements could be made primarily by offering more management-related training. Giving students the opportunity to experience hands-on training in libraries through internship pro-grams might also increase the opportunity for library schools and libraries to discuss curriculum issues, a practice which does not currently appear to be standard in the profession. Continual change in the expertise needed to successfully practice librarianship directly influences the need for ongoing communications between libraries and library schools.
Levels of satisfaction with MLIS programs overall were rated lower by librarians than by institutions (Figure G.2). Whereas three-quarters of library administrations agreed that graduates have the necessary competencies for their jobs, only 64% of individuals indicated they were satisfied with the quality of education they received in their MLIS programs.31 The discrepancy between the two views, however, is not always consistent. While CARL administrators are among the most positive (80%), librarians working in this sector are the least likely to be sat-isfied with their education (53%). CULC administrators, on the other hand, were the least positive (56%), but their librarians were more likely than on average to express satisfaction with the quality of education provided in MLIS programs (68%). But no matter where these inconsistencies emerge, they highlight a cleavage between administrators and librarians, suggesting that it is important to garner the views of both groups when evaluating MLIS programs.
31 The levels of satisfaction among the librarians in our sample are also lower than graduates from other Masters level programs. Using the exact same wording as we used in our survey, a study of Alberta graduates found that 85% of Master of Arts graduates were satisfied with the overall quality of their education (Sorensen, 2002).
122 SECTION G: Education CANADIAN LIBRARY HUMAN RESOURCE STUDY
Figure G.2 Percent of Recent Professional Librarians1 Satisfied with Overall Quality of Education in MLIS Program2 by Library Sector
(Individual Survey; n=357)
��
��
��
��
��
��
��
��
��
��
������
���������������
�����
���������������
�������������
����
������������
��������������
����������
���������
� ���������
�� �� �� �� �� �� �� �� ���
Source: 8Rs Canadian Library Human Resource Individual Survey1 Recent Professional Librarian Entrants are individuals who have been working as a professional librarian for less than 6 years.2 Based on “satisfied” and “very satisfied” responses to the question: “Overall, how satisfied are you with the quality of education you received in your MLIS program?” 3 For-Profit and School library results are not presented separately because of insufficient cases reporting; however, Non-Profit results are included in the Total Special results.
Table G.7 provides more specific results on recent librarian entrants’ evaluations of their MLIS education. Gener-ally, recent entrants into the profession do not believe there is a good match between the course content of their MLIS programs and the demands of the job. While just under two-thirds (63%) felt their graduate program had provided the general skills and abilities required for library work, less than one-half stated that the problem-solv-ing and information technology skills provided were adequate to effectively perform their jobs (45% and 46%, respectively). Even fewer agreed that their programs provided them with the necessary management (25%), lead-ership (20%), and business skills (12%). Management and leadership are two of the competencies that employers appear to be most concerned about, particularly with respect to the knowledge lost as senior staff retire. The evaluations of MLIS programs both from the perspective of the employer and the employee, therefore, strongly indicate that curricula content needs to be revisited.
The results, however, should be viewed with the understanding that respondents’ perceptions of the adequacy of their programs’ offerings is clearly contingent upon the demands of their particular workplace and/or their spe-cific job position. For example, as depicted in column 1 of Table G.7, the general skills training provided in MLIS programs appears to be better suited to the needs of public and special libraries than it is to the job requirements within academic libraries. Government librarians, on the other hand, are more positive in their assessments of all the skills and abilities listed in the table, suggesting that the curriculum is better matched to the requirements of their particular jobs.
SECTION G: Education 123The Future of Human Resources in Canadian Libraries
Table G.7 Percent of Recent Librarian Entrants Agreeing that MLIS Program Provided Skills to Effectively Perform their Jobs1 by Library Sector2
(Individual Survey; n=361)
“My Program Provided Me With ... ”
Library Sector
General Skills/Abilities
Problem-solving skills
IT Skills
Management Skills
Leadership Skills
Business Skills
TOTAL 63 45 46 25 20 12
TOTAL ACADEMIC 55 42 45 23 16 7
CARL 51 39 42 23 16 6
Other Academic 65 48 50 23 16 9
TOTAL PUBLIC 68 46 52 27 23 16
CULC 67 45 51 30 25 16
Other Public 69 46 52 23 20 17
TOTAL SPECIAL 66 52 44 29 24 12
Government 71 61 45 28 30 15
Non-Profit 67 48 44 36 19 8
Source: 8Rs Canadian Library Human Resource Individual Survey1 Respondents were asked to indicate on a 1 to 5 scale, with “1” meaning “strongly disagree” and “5” meaning “strongly agree” with a list of several statements about being provided with specific skills and abilities in their MLIS programs required to effectively perform their jobs. Scores of “4” and “5” are combined and presented in this table.2 For-Profit and School library results are not presented separately because of insufficient cases reporting; however, For-Profit results are included in the Total Special results, and School results are included in the Total results.
Table G.8 reveals that a minority of recent librarian entrants also agreed that their program provided them with “a realistic depiction about what it is like to work as a librarian” or “what it is like to work in my sector.” Notable differences between academic, public, and special librarians again demonstrate the uniqueness of each sector. Special librarians on the whole were more likely to agree that their programs provided both a realistic picture of library work in general, and in their sector specifically. Interestingly, librarians working in smaller public librar-ies were more likely to agree with statements on accurate depictions of library work than were CULC librarians. More positive is the finding that almost 3 in 5 recent librarian entrants believe that their coursework can be ap-plied to their jobs today. In accordance with the evaluations of library programs presented so far, special librar-ians were the most likely to agree with this statement (68%).
124 SECTION G: Education CANADIAN LIBRARY HUMAN RESOURCE STUDY
Table G.8 Percent of Recent Librarian Entrants Agreeing that MLIS Program Provided Realistic Depiction of Job1 and Ability to Apply Education to Job by Library Sector2
(Individual Survey; n=361)
Percent
Library Sector
Realistic Depiction of Library Work
Realistic Depiction of Library Work in My
Library Sector3
I Can Apply What I Learned to My Library Job4
TOTAL 44 36 59
TOTAL ACADEMIC 44 35 55
CARL 44 33 52
Other Academic 46 39 59
TOTAL PUBLIC 42 34 58
CULC 39 30 60
Other Public 46 40 54
TOTAL SPECIAL 51 41 68
Government 54 46 63
Non-Profit 57 48 67
Source: 8Rs Canadian Library Human Resource Individual Survey1 Based on responses of “4” and “5” on a 5-point scale with “1” meaning “strongly disagree” and “5” meaning “strongly agree” to with a list of several statements about being provided with specific skills and abilities in their MLIS programs required to effectively perform their jobs. 2 Results for For-Profit and School librarians are not presented because of insufficient cases reporting. However, For-Profit responses are included in the Total Special results.3 Based on responses of “4” and “5” on a 5-point scale with “1” meaning “strongly disagree” and “5” meaning strongly agree” to the statement: “The program provided me with a realistic depiction about what it is like to work as a librarian.”4 Based on responses of “4” and “5” on a 5-point scale with “1” meaning “strongly disagree” and “5” meaning strongly agree” to the statement: “The program provided me with a realistic depiction about what it is like to work as a librarian in my library sector.”
Overall, librarians’ evaluations of their MLIS education is perhaps not as positive as we would hope. Research suggests, however, that concern should not lie solely within the halls of academe. Curry (2000) found in her study of Canadian library school directors that convincing students (and even new professionals) of the importance of management as a core competency is often an uphill battle. Furthermore, Curry adds,
[M]any prospective employers exacerbate the problem by emphasizing the importance of man-agement skills and expecting new graduates to possess them, but rarely targeting this area during employment interviews since it is easier to assess technological skills” (p. 333).
While the Alliance of Libraries, Archives, and Records Management (1996) noted the shift in need for the “soft skills” (including management) a decade ago, the issue may rest as much with a lack of awareness on the part of new practitioners as it does with the library schools and employers.
These rather negative evaluations can also be contextualized by examining American employers’ views of Ca-nadian MLIS education. The statement from a Canadian library program head suggests a more positive view of Canadian education:
[…] American employers consider Canadian graduates from two-year or eighteen month programs to be highly desirable because they are “plug and play”, meaning that compared to graduates of the shorter US programs, they usually require little additional training and can often assume a manage-ment position or run a one-person library immediately” (Curry, 2000, p. 332).
SECTION G: Education 125The Future of Human Resources in Canadian Libraries
So while both American and Canadian employers indicate a certain level of satisfaction with MLIS education, new professionals are less convinced about whether they possess the skills that are necessary. Notably, though, the education-job requirement match is much closer among special librarians.
We conclude this section on the evaluation of library programs with a list of the top five suggestions for improv-ing library programs provided by recent librarian entrants. On this account, the views of administrators and librarians are in greater concordance. As shown in Figure G.3, one-third of recent librarian entrants indicated they would like to see a more practical component to their education, some of whom specified the development of more practicum and co-op programs. The interest in improving training in management, business administra-tion, and leadership also corresponds with the views of library administrators, as does the suggestion to provide more training in technology-related skills. Eighteen percent of recent librarians also added, however, that they would like to see more competent or experienced instructors in the MLIS programs.
Figure G.3 Top 5 Suggestions by Recent Librarian Entrants1 for How to Improve MLIS Programs2
Source: 8Rs Canadian Library Human Resource Individual Survey 1 Recent Professional Librarian Entrants are individuals who have been working as a professional librarian for less than 6 years.2 Based on categorized responses to the open-ended question: “What, if anything, could be done to improve the quality of education offered in MLIS programs?”
II Evaluation of Library Technician ProgramsLibrary technicians are much more favourable in their assessments of the quality of education they received in their library technician programs than are librarians about their MLIS programs. A greater majority of parapro-fessionals (81%) noted that they are satisfied with the quality of education in their library technician program, as compared to librarians (64%, Figure G.2). This is true across sub-sectors, with the exception of government library staff, of which 71% of librarians but only 60% of paraprofessionals were satisfied.
126 SECTION G: Education CANADIAN LIBRARY HUMAN RESOURCE STUDY
Figure G.4 Percentage of Recent Library Technician Entrants1 Satisfied2 with Library Technician Program by Library Sector3
(Individual Survey; n=144)
��
��
��
��
��
��
��
��
��
������
���������������
�����
���������������
�������������
����
�������������
����������
������
� ���������
�� �� �� �� �� �� �� �� ���
Source: 8Rs Canadian Library Human Resource Individual Survey 1 Recent Library Technician Entrants are individuals who have been working as a library technician for less than 6 years.2 Based on “satisfied” and “very satisfied” responses to the question: “Overall, how satisfied are you with the quality of education you received in your library technician program?” 3 Results for Other Public, Non-Profit, and For-Profit librarians are not presented because of insufficient cases reporting. However, Other Public results are included in the Total Public results, and Non-Profit and For-Profit responses are included in the Total Special results.
Library technicians are also far more positive in their assessment of their programs’ ability to provide education relevant to their current jobs (Tables G.9 and G.10). Paraprofessionals rated their programs very highly in pro-viding general skills (87%), information technology skills (71%), and realistic depictions of library work (72%), as well as the general applicability to the job (83%). Problem-solving skills were rated slightly lower, but still over half said they were adequate. But as was the case for professional librarians, paraprofessionals were much less likely to believe that their programs provided them the management, leadership, and business skills necessary for their jobs.
SECTION G: Education 127The Future of Human Resources in Canadian Libraries
Table G.9 Percent of Recent Library Technician1 Entrants Agreeing that Library Technician Program Provided Skills to Effectively Perform their Jobs2 by Library Sector3
(Individual Survey; n=144)
“My Program Provided Me With ...”
Library Sector
General Skills/Abilities
IT Skills
Problem-solving skills
Management Skills
Leadership Skills
Business Skills
TOTAL 87 71 57 42 40 38
TOTAL ACADEMIC 91 73 58 54 49 44
CARL 82 88 60 47 50 46
Other Academic 97 66 57 59 49 44
TOTAL PUBLIC 77 70 53 35 34 33
CULC 83 83 59 42 37 39
TOTAL SPECIAL 91 70 56 31 33 35
Government 95 70 56 29 29 39
SCHOOL 93 71 64 54 46 43
Source: 8Rs Canadian Library Human Resource Individual Survey1 Recent Library Technician Entrants are individuals who have been working as a library technician for less than 6 years.2 Based on responses of “4” and “5” on a 5-point scale with “1” meaning “strongly disagree” and “5” meaning “strongly agree” to with a list of several statements about being provided with specific skills and abilities in their library technician programs required to effectively perform their jobs. 3 Results for Other Public, Non-Profit, and For-Profit librarians are not presented because of insufficient cases reporting. However, Other Public results are included in the Total Public results, and Non-Profit and For-Profit responses are included in the Total Special results.
Table G.10 Percent of Recent Library Technician Entrants1 Agreeing that Library Technician Program Provided Realistic Depiction of Job and Ability to Apply Education to Job2 by Library Sector3
(Individual Survey; n=144)
Percent
“My Program Provided Me with a ...”
Library Sector
Realistic Depiction of Working in Library
Realistic Depiction of Working in My Library Sector
I Can Apply What I Learned to My Library Job
TOTAL 72 63 83
TOTAL ACADEMIC 72 65 83
CARL 67 62 75
Other Academic 75 67 88
TOTAL PUBLIC 61 59 82
CULC 67 65 86
TOTAL SPECIAL 86 63 84
Government 85 60 85
SCHOOL 64 67 83
1 Recent Library Technician Entrants are individuals who have been working as a library technician for less than 6 years.2 Based on responses of “4” and “5” on a 5-point scale with “1” meaning “strongly disagree” and “5” meaning “strongly agree” to with a list of several statements about being provided with specific skills and abilities in their library technician programs required to effectively perform their jobs.3 Results for Other Public, Non-Profit, and For-Profit librarians are not presented because of insufficient cases reporting. However, Other Public results are included in the Total Public results, and Non-Profit and For-Profit responses are included in the Total Special results.
128 SECTION G: Education CANADIAN LIBRARY HUMAN RESOURCE STUDY
The closer fit between library technician course content and workplace requirements might be partly explained by what Davidson-Arnott (2003) notes as the ability of these programs to respond quickly to shifts in job competen-cies as employers and paraprofessionals communicate them. However, a greater understanding of the differences between MLIS programs and library technician programs is beyond the scope of this report, and indeed, merits its own study.
G.4: Strategic Human Resource Planning Implications
• Few librarians hold a library technician degree, suggesting that in the past, paraprofessionals seldom chose to pursue the MLIS. At the same time, in section D we saw that one-third of paraprofessionals were inter-ested in pursuing an MLIS, but half of these faced structural barriers. These two results present a situation in which movement from paraprofessional to professional status could be difficult within the field. The library profession needs to question how these difficulties might be ameliorated, and how recruitment of this interested group might be promoted. Individual institutions need to assess how their needs can be met by encouraging paraprofessional members of staff to acquire a professional degree.
• Institutional satisfaction with the MLIS education is sector-dependent, showing that curricula may be less easily aligned with jobs in large urban public libraries. CULC libraries’ dissatisfaction with the MLIS de-gree as a basic competency warrants further study to identify how that workplace is significantly different. CULC administrators and library educators should consider discussing the gaps between MLIS education and CULC libraries’ needs; while MLIS programs have other stakeholders and requirements and cannot tailor their entire curricula to the needs of particular sector employers, programs such as public library internships or practicum placements, co-op programs, linked assignments to public library practice, and more discussion of the difference between sectors may be useful here.
• The assessments of recent graduates should not be overlooked in evaluating the applicability of library school curricula, which is generally less favourable than those of the employer. That the sector differences in evaluations from the institutional perspective do not parallel the sector patterns found among recent graduates suggests that the viewpoints of both stakeholders are important to gather when conducting a comprehensive evaluation of library schools. Additionally, new librarians and employers would ben-efit from learning about the evaluative viewpoints of each, thereby furthering their understanding of the other’s expectations in the workplace.
• An important exception to the divergent assessments of library school education between institutions and recent librarian entrants is the consensus of an increased need to incorporate management, leadership, and business training into the curriculum. The implications of this finding for library school curricula are clear.
• While libraries believe they have little or no input into MLIS education, we know there are different kinds of partnerships that can provide practical experience (e.g., practicum placements, co-op programs, in-ternships, assignments linked to the “real world” of library work). Educators and employers may consider working together to build these opportunities. Also, while librarians have historically to come to librarian-ship as a second or third career, recent statistics from ALISE suggest that the average age of MLIS students is decreasing (from 34 years of age in 2001 to 30 years of age in 2003). Insofar as this means that contem-porary students have less experience in the general workforce, further importance is placed on practicum programs or other forms of direct experience as part of the degree.
• Technicians show greater levels of satisfaction with their base education than do professional librarians which may be due, in part, to the fact that college programs have the ability to change their course offerings on a much more timely basis. Still, technicians are less likely to learn leadership and management skills through their programs. For technician positions that require management competencies (27% of para-professionals work in supervisory or management positions), employers should ensure adequate training is provided.
SECTION H: Continuing Education 129The Future of Human Resources in Canadian Libraries
S E C T I O N H
Continuing Education
H.1 Introduction
Continuing education is essential for professional librarians to keep pace with ever-changing skill demands. Learning initiatives also have ramifications for job performance and satisfaction insofar as they equip librar-
ians with the skills and abilities that allow them to successfully accomplish their work. Throughout the report, findings suggest that librarians are increasingly required to assume leadership roles and perform managerial functions, and therefore require training in these areas. As noted earlier, training among middle-level librarians may be particularly needed in libraries experiencing or predicted to experience significant human capital losses from retirements.
Further, as librarianship increasingly becomes a high-tech profession, training in technology skills is a continu-ous necessity. Indeed, one of the conclusions from the recent study by the Cultural Human Resources Council (2002) was that the increasing variety of information formats and delivery methods, as well as the increase in in-terdisciplinary information sources and practices, combine with rapid changes in technology to require ongoing training for workers, both in new technologies and in management. The dynamic environment in libraries means that ongoing training for all levels of librarians is perhaps needed now more than ever.
While libraries are positioned to take primary responsibility for the continuing education of librarians, associa-tions and library schools should also play a role. Of course, librarians themselves must also be responsible for exploiting the continuing education opportunities provided by their employers. But these opportunities can be offered in such a way as to increase the likelihood of participation. As the results from a Quebec study suggest, librarians are most likely to pursue training opportunities when they can defer costs to their employer and when they are provided sufficient time to participate in training activities, especially when they are offered during working hours (Bergeron, Deschalets, and Nauche, 1998).
H.2 Organizational Training of Professional Librarians
Tables H.1 and H.2 present the institutions’ reported training requirements for four types of librarians and for three career stages by library sector.
Beginning with Table H.1, libraries were most likely to report that IT librarians require significant amounts of training (64%); this finding is not surprising, given the rate of change in technology. Still, about half of institu-tional respondents felt that technical service librarians, management, and public service librarians also require training. Training requirements of these staff members is lower in special libraries. CARL and CULC administra-tors, on the other hand, were most likely to agree that IT librarians and managers require training.
130 SECTION H: Continuing Education CANADIAN LIBRARY HUMAN RESOURCE STUDY
Table H.2 clearly shows that all sectors tend to agree that recent librarian entrants require the greatest amount of training, although CULC libraries were overwhelmingly likely to indicate this response (97%). This finding relates to the previously noted results from Figure G.1 that CULC libraries were least likely of all sectors to agree that MLIS programs equip graduates with the necessary competencies for their positions.
Table H.1 Librarians Needing Significant Training1 by Type of Librarian by Library Sector
(Institutional Survey; n=180)
Percent2
Library SectorIT
LibrariansTechnical Service
LibrariansManagement
LibrariansPublic Service
Librarians
TOTAL 64 54 50 47
TOTAL ACADEMIC 76 65 51 52
CARL 80 65 69 58
Other Academic 72 65 39 47
TOTAL PUBLIC 63 50 57 47
CULC 74 46 65 58
Other Public 59 52 53 43
TOTAL SPECIAL3 46 45 34 38
Government 53 41 41 40
Non-Profit 44 44 37 39
Source: 8Rs Canadian Library Human Resource Institutional Survey 1 Based on “4” and “5” responses on a 5-point scale with “1” meaning “no training” and “5” meaning “a great amount of training” to the question: “To what extent do the following groups of staff require ongoing training to meet the needs of your organization?” 2 Percentages are calculated only for those reporting that they have these types of librarians on staff. The number of respondents for each type of staff is 170, 185, 198, and 186 for IT, technical service, management, and public service librarians, respectively.3 For-Profit library results are not presented separately because of insufficient cases reporting; however, they are included in the Total Special results.
Interestingly, training needs do not significantly differ between mid- and senior-level librarians. Again, however, CARL and CULC libraries are the most likely to report that these more senior staff require training.
SECTION H: Continuing Education 131The Future of Human Resources in Canadian Libraries
Table H.2 Librarians Needing Significant Training1 by Career Level of Librarian by Library Sector
(Institutional Survey; n=270)
Percent Needing a Significant Amount of Training
Library SectorRecent Librarian
EntrantsMid-Level Librarians
Senior-LevelLibrarians
TOTAL 72 43 36
TOTAL ACADEMIC 77 46 36
CARL 89 54 40
Other Academic 69 39 33
TOTAL PUBLIC 72 44 39
CULC 97 56 46
Other Public 62 39 35
TOTAL SPECIAL2 66 35 33
Government 63 35 26
Non-Profit 74 40 43
Source: 8Rs Canadian Library Human Resource Institutional Survey 1 Based on “4” and “5” responses on a 5-point scale with “1” meaning “no training” and “5” meaning “a great amount of training” to the question: “To what extent do the following groups of staff require ongoing training to meet the needs of your organization?” 2 For-Profit library results are not presented separately because of insufficient cases reporting; however, they are included in the Total Special results.
Turning to the librarian’s perspective on training opportunities, Table H.3 demonstrates that the training oppor-tunities provided to new librarians does not strongly correlate with the organization’s need to train librarians at this early career stage. While Table H.2 shows that 72% of institutions agreed that new professional staff require significant amounts of training, only 56% of new recruits agreed that their organization provides adequate op-portunities for training (60% of all professional librarians agreed with this statement).
Table H.3 also shows that more than half of mid-level and senior librarians agree with this statement, with a slightly higher proportion of senior librarians agreeing. This matches better to the institutions, indicating that significant amounts training are required for these two career levels (Table H.2).
132 SECTION H: Continuing Education CANADIAN LIBRARY HUMAN RESOURCE STUDY
Table H.3 Organization Provides Sufficient Opportunities to Participate in Training1 by Career Stage2 by Library Sector3
Source: 8Rs Canadian Library Human Resource Individual Survey 1 Based on “4” and “5” responses on a 5-point scale with “1” meaning “strongly disagree” and “5” meaning “strongly agree” to the question: “My organization provides me with sufficient opportunities to participate in training.” 2 Recent Professional Librarian Entrants are individuals who have been working as a professional librarian for less than 6 years, Mid-Career Professional Librarians have been working as a librarian for 6 to 15 years, and Senior Librarians have been working as a librarian for more than 15 years.3 Some results for For-Profit and School librarians are not presented because of insufficient cases reporting; however, they are included in the Total Special results.
CARL librarians at all three career stages were most likely of all sector to agree that their institution provided suf-ficient training opportunities. On the other hand, the proportion of CULC librarians agreeing with this statement is below the overall average. Hence, it appears that the training needs within CULC libraries (as demonstrated in Table H.2) are not well-matched with the opportunities to participate in training; this is perhaps most notable among recent librarians (Table H.3).
Although adequate training is being provided for technology and job-oriented skills, there is room for improvement in leadership and management training.
Tables H.4a through H.4c display professional librarians’ experiences with organizational training in specific job function areas (see Appendix Table H.1 for training initiatives offered by organizations from the institutional survey). Librarians are most likely to have participated in job skills and technology skills training, with over 4 in 5 librarians reporting that they have participated in these types of training at some point in their careers. Somewhat fewer, but still a majority (56%) participated in customer-service training and management training (51%). Just under 3 in 10 professional librarians participated in leadership training, with 4% specifying Northern Exposure to Leadership (NEL). One in ten participated in mentorship training or worked in a job rotation program while even fewer (6%) shared a job with their peers.
Of those who received training, in most cases, over half reported that it improved their job performance. There are, however, noteworthy differences in these training evaluations. The small proportion of librarians who had participated in the NEL program were most likely to report that it improved their ability to perform their job (82%). Comparatively, only 48% of those engaging in mentorship training, and 44% receiving customer-service training, felt that their participation had improved their job performance.
SECTION H: Continuing Education 133The Future of Human Resources in Canadian Libraries
Table H.4a Training Experiences of Professional Librarians1 by Library Sector2
(Individual Survey; n=1,780)
Percent
Job Skills Training Technology Skills Training Customer-Service Training
Library SectorReceivedTraining
Training Improved Job Performance
ReceivedTraining
Training Improved Job Performance
ReceivedTraining
Training Improved Job Performance
(n=1,469) (n=1,498) (n=963)
TOTAL 82 54 84 61 56 44
TOTAL ACADEMIC 80 56 87 60 47 43
CARL 85 56 90 61 50 42
Other Academic 71 54 82 60 41 44
TOTAL PUBLIC 86 54 85 60 76 44
CULC 89 54 88 61 83 43
Other Public 78 53 76 60 59 48
TOTAL SPECIAL 77 50 76 61 34 47
Government 81 50 78 62 34 47
Non-Profit 74 43 74 64 30 45
For-Profit 69 67 78 53 28 --
SCHOOL 71 55 90 74 11 --
Source: 8Rs Canadian Library Individual Survey1 Responses on improvement to job performance are based on “4” and “5” responses on a 5-point scale with “1” meaning “to no extent” and “5” meaning “to a great extent” to the question: “For the following list, first indicate if you have participated in the type/format of training through your current organization, and if so, the extent to which the training improved your ability to perform your job.” 2 Separate sub-sector results are not presented when there are fewer than 15 cases reporting; however, they are included in the Total results.
134 SECTION H: Continuing Education CANADIAN LIBRARY HUMAN RESOURCE STUDY
Table H.4b Training Experiences of Professional Librarians1 by Library Sector2 (Individual Survey; n=1,780)
Percent
Management Training Leadership Training NEL
Library Sector Received TrainingTraining Improved Job Performance
Received TrainingTraining Improved Job Performance
Received TrainingTraining Improved Job Performance
(n=858) (n=458) (n=67)
TOTAL 51 55 28 59 4 82
TOTAL ACADEMIC 53 52 31 59 6 76
CARL 58 51 34 60 6 71
Other Academic 43 54 26 54 5 --
TOTAL PUBLIC 52 58 26 62 5 86
CULC 49 58 27 58 5 --
Other Public 57 57 23 73 5 --
TOTAL SPECIAL 45 56 27 57 2 --
Government 51 53 31 58 2 --
Non-Profit 35 61 20 39 1 --
For-Profit 41 73 25 -- 3 --
SCHOOL 31 -- 29 -- 0 N/A
Source: 8Rs Canadian Library Individual Survey1 Responses on improvement to job performance are based on “4” and “5” responses on a 5-point scale with “1” meaning “to no extent” and “5” meaning “to a great extent” to the question: “For the following list, first indicate if you have participated in the type / format of training through your current organization, and if so, the extent to which the training improved your ability to perform your job.” 2 Separate sub-sector results are not presented when there are fewer than 15 cases reporting; however, they are included in the Total results.
SECTION H: Continuing Education 135The Future of Human Resources in Canadian Libraries
Table H.4c Training Experiences of Professional Librarians1 by Library Sector2 (Individual Survey; n=1803)
Percent
Mentorship Training Job Rotation Job Sharing
Library SectorReceived Training
Training Improved Job Performance
Received Training
Training Improved Job Performance
Received Training
Training Improved Job Performance
(n=126) (n=126) (n=72)
TOTAL 9 48 10 63 6 68
TOTAL ACADEMIC 10 54 9 66 5 68
CARL 10 50 10 59 5 --
Other Academic 11 61 8 85 6 --
TOTAL PUBLIC 7 50 11 60 7 65
CULC 8 47 14 60 7 65
Other Public 6 -- 5 -- 8 --
TOTAL SPECIAL 12 38 7 63 7 77
Government 11 33 9 -- 5 --
Non-Profit 14 -- 5 -- 12 --
For-Profit 7 -- 5 -- 10 --
SCHOOL 14 -- 0 N/A 4 --
Source: 8Rs Canadian Library Individual Survey1 Responses on improvement to job performance are based on “4” and “5” responses on a 5-point scale with “1” meaning “to no extent” and “5” meaning “to a great extent” to the question: “For the following list, first indicate if you have participated in the type / format of training through your current organization, and if so, the extent to which the training improved your ability to perform your job.” 2 Separate sub-sector results are not presented when there are fewer than 15 cases reporting; however, they are included in the Total results.
Of importance to note from Tables H.4b and H.4c are the relatively small proportions of librarians who have received leadership and mentorship training (28% and 9%, respectively). Though many more participated in management training (51%), these training levels are not congruent with the need for librarians to perform these roles. Additionally, when professional librarians were asked to provide the type of training they felt they would need to move into a higher-level position, by far the most predominant response was training in management, leadership, and business skills (70%; results not shown in table or figure). The second most prevalent answer was personal development training, which was offered by only 20% of the sample.
We might ask the question, however, about the extent to which leadership can be taught through training. Inas-much as leadership is defined as taking the initiative on developing and implementing creative practices, provid-ing future vision, and motivating the personnel needed to complete such initiatives, the ability to perform this role is to some extent dependent upon the personal characteristics and motivation level of the individual librar-ian.
On the other hand, providing librarians with opportunities to assume leadership roles is one method of culti-vating leadership qualities. And this is exactly what many organizations are doing. More than two-thirds (68%) of libraries believed that they were able to offer “good” or “excellent” opportunities for librarians to experience leadership roles. Public and academic libraries were significantly more likely than special libraries, however, to provide such opportunities (47% of special libraries, compared to 80% of public and 75% of academic libraries).
Arguably, management training is somewhat more amenable (although not completely) to formal training. Hence, an obvious recommendation from these findings would be for libraries to provide increased training op-portunities, but also to explore how they can provide management and leadership training through experiential means such as mentorship, job rotation, and job sharing programs.
136 SECTION H: Continuing Education CANADIAN LIBRARY HUMAN RESOURCE STUDY
All three formats of experiential training can also permit the individual a greater understanding of how their job fits within the organization, as well as an expedited socialization into both the organization and the profession. Otherwise, the positive results of participating in leadership programs like NEL suggest that other non-organiza-tional initiatives such as this should be considered by the library community. As well, serving on library associa-tion Boards or committees provides an excellent opportunity for leadership training, and staff are encouraged to pursue this avenue.
A further observation about sector differences in management and leadership training can also be made from Ta-ble H.4b. The provision of training in these two areas within CARL and CULC libraries, which have an expressed need for managers and leaders in their organizations, did not significantly depart from the norm.
Results to two other questions add to our evaluation of organizational training. Only 30% of libraries reported having a routine method for determining training needs for professional librarians, with even fewer (13%) hav-ing a routine method for evaluating the outcomes of professional librarian training. Given that under two-thirds of librarians taking any kind of training believe it has improved their job performance, libraries may consider exploring training evaluation and applicability at the institutional level.
On the other hand, that 8 in 10 librarians agreed that they have “sufficient education, training, and experience to allow me to perform my job effectively” is a reminder that job performance is not solely dependent on training opportunities.
Lastly, while ongoing training may be vital to the organization, barriers remain to providing necessary training. Figure H.1 shows that a significant proportion of libraries state budgets prevent training for librarians. Public (55%) and non-CARL academic libraries (57%) were most likely to state that budgets prevented them from offer-ing training to their professional staff. CARL and government libraries were least likely to state the same, at 31% and 26%, respectively.
Figure H.1 Organizations Reporting that Budgets Prevent Provision of Training to Librarians1 by Library Sector
(Institutional Survey; n=281)
��
��
��
��
��
��
��
��
��
��
�������������
���������������
�����
���������������
�������������
����
������������
��������������
����������
���������
� ���������
�� �� �� �� �� �� �� �� ���
Source: 8Rs Canadian Library Human Resource Institutional Survey1 Based on responses of “4” and “5” on a 5-point scale with “1” meaning “to no extent” and “5” meaning “to a great extent” to the question: “To what extent do budgets prevent your organization from offering needed training to professional librarians?”2 For-Profit library results are not presented separately because of insufficient cases reporting; however, they are included in the Total Special results.
SECTION H: Continuing Education 137The Future of Human Resources in Canadian Libraries
H.3 Organizational Training of Paraprofessionals
Having examined the organizational training provided to professionals, we now turn our focus to the available data for paraprofessionals. Figure H.2 displays the proportion of paraprofessionals agreeing that their organi-zation provides them with sufficient opportunities to participate in training. With the exception of librarians working in non-profit libraries, less than half of paraprofessionals working in all other sectors felt their training opportunities were sufficient. This is somewhat lower than the 60% of librarians who responded positively to the same question.
Figure H.2 Organization Provides Sufficient Opportunities to Participate in Training1 by Library Sector
Source: 8Rs Canadian Library Human Resource Individual Survey 1 Based on “4” and “5” responses on a 1 to 5 scale with “1” meaning “strongly disagree” and “5” meaning “strongly agree” to the question: “My organization provides me with sufficient opportunities to participate in training.”
Slightly smaller proportions of paraprofessionals also indicated that they participated in job skills training (Table H.5). But, paraprofessionals were equally likely to have participated at some point in their careers in technology skills and customer-service training. The professional–paraprofessional differences are most remarkable for man-agement and leadership training, with only 16% of paraprofessionals having participated in management training and 10% in leadership training.
138 SECTION H: Continuing Education CANADIAN LIBRARY HUMAN RESOURCE STUDY
Table H.5 Training Experiences of Paraprofessional Staff1 by Library Sector (Individual Survey; n=1,450)
Percent of Organizations Offering Training in Past Year
Library SectorJob Skills Training
Technology Skills Training
Customer Service Training
Management Training
Leadership Training
TOTAL 74 83 52 16 10
TOTAL ACADEMIC 76 85 54 18 9
CARL 77 90 55 20 8
Other Academic 74 76 53 14 9
TOTAL PUBLIC 80 86 71 14 10
CULC 80 86 76 12 10
Other Public 80 85 61 19 11
TOTAL SPECIAL 61 75 32 15 8
Government 66 78 30 14 8
Non-Profit 51 67 41 12 8
For-Profit 64 82 12 19 3
SCHOOL 66 83 13 13 15
Source: 8Rs Canadian Library Human Resource Individual Survey 1 Based on “yes” responses to the question: “During the past year, did your organization provide any of the following types of job-related training to paraprofessional staff?”
H.4 Professional Association Training
Most in the library community feel that there is a training role to be played by library associations.
The vast majority (90%) of libraries in the sample currently subsidize, assist, or reimburse professional librarian attendance at library association meetings (results not shown in table or figure). Virtually all (98%) of academic libraries, 91% of public, and 81% of special libraries responded similarly. Further, nearly two-thirds (64%) pro-vided their librarians with professional development training offered by library associations. A greater proportion (85%), however, indicated that professional library associations should assist in training professional librarians. Of these, the most common suggestion was for professional library associations to provide general training (i.e., training that is not sector-specific, but that is applicable to any library’s circumstances, such as training for devel-opmental purposes). Other suggestions included providing training needs assessments, training at annual con-ferences, and course assistance (e.g., providing speakers, promoting courses in partnership with post-secondary institutions).
H.5 Human Resource Planning Implications
• Significant proportions of librarians at all levels and across various types of positions continue to require significant amounts of training for their jobs. While new recruits require the most training, a significant minority of mid-career and senior librarians do as well. This suggests that individuals and institutions must commit to continuing education as an ongoing necessity. Institutions will most likely take up the fi-nancial costs of training and must plan for this budgetary commitment. Librarians must take the personal responsibility for participation and return of the investment in training to the organization.
SECTION H: Continuing Education 139The Future of Human Resources in Canadian Libraries
• At the same time, just over half of new professional librarians surveyed stated that there are adequate op-portunities for training at their institutions. This suggests some potentially serious gaps in these librarians’ opportunities to gain the knowledge and skills necessary for their work.
• The largest gaps between institutional need and new librarians’ perceptions of training opportunities fall within CULC libraries. At the same time, CULC libraries are also most likely to say that budgets prevent them from offering needed training. CULC libraries are therefore in a situation in which their need for staff training is high, but their ability to offer training appears to be low. CULC libraries need to investigate their institutional barriers to training and determine ways to overcome these barriers, perhaps by working in conjunction with other organizations (associations, partnering with other libraries, etc.)
• Of the institutional training offered to librarians, most frequently offered was that of job skills and tech-nology training, with about half receiving customer skills and/or management training. However, only one-third undertook leadership training. While leadership is a more difficult competency to “teach,” insti-tutions’ stated needs for leadership abilities suggests that this is an area that warrants greater attention by individuals and institutions. Further, librarians interested in moving into higher positions state that lead-ership and management training are necessary for them to feel confident in performing these new roles.
• While 80% of librarians agreed that they have sufficient education, training and experience to perform their jobs effectively, when asked about the impact of training on their jobs, somewhat lower levels agreed that professional development allowed them to perform their jobs well. Also, relatively few institutions had formal structures for either determining what training is needed, or evaluating that training. Libraries and library staff should both question the return on investment from training activities and how this can be improved through training outcomes that serve the needs of both the individual and the institution. This return will assume even greater importance with increased retirements and as recruiting occurs.
• While a very small proportion of librarians participated in the Northern Exposure to Leadership (NEL) Institute, they rated it as having a higher impact on job performance than other areas of training. Con-sidering that leadership is a significant training need throughout Canadian libraries, more “leadership institute” models may be effective.
• Paraprofessionals overall are less satisfied with the training opportunities offered to them. Equal pro-portions of librarians and paraprofessionals receive technology skills or customer service training, but far fewer paraprofessionals than librarians receive leadership and/or management training. Leadership in particular is a competency that should be held by staff throughout the organization.
• Most libraries believe that library associations should play a training role. While they suggested that “gen-eral training” be provided by associations, respondents did not define this area any further. Associations would be advised to work with their memberships and other stakeholders in order to determine specifi-cally what kinds of training is in demand for their sector/region, if they are to build upon their professional development programs.
SECTION I: Quality of Work and Job Satisfaction 141The Future of Human Resources in Canadian Libraries
S E C T I O N I :
Quality of Work and Job Satisfaction
I.1 Introduction
The extent to which an organization supports the people who work there contributes significantly to the or-ganization’s effective functioning. Quality of work life (e.g., good remuneration and work that is family-
friendly, meaningful, interesting, challenging, rewarding, and participatory) bears heavily on job satisfaction and staff retention, as does the quality of employer-employee relationships (e.g., relations of trust and loyalty). If jobs are challenging, interesting, and rewarding, and if library staff have satisfactory relationships with their employ-ers, they are more likely to be satisfied with their jobs, perform their jobs more effectively, and be more moti-vated to innovate. Quality of work life also has implications for recruitment (e.g., being an employer of choice). Conversely, a less-than-desirable environment, weak employer-employee relationships, and low job satisfaction may result in early retirement, exits from the organization, less-than-optimal job performance, and difficulty in recruiting new staff.
Leckie and Brett’s (1997) study on the job satisfaction of Canadian university librarians found them to be highly satisfied with their jobs overall, compared to Canadians on average. Librarians were the most satisfied with tradi-tional elements of librarianship itself: a strong emphasis on service with ample opportunities for independence, challenge, creativity, and participation in professional activities. As shifts are taking place within the field (with a greater emphasis on management, for example), how has job satisfaction been affected?
Given that attracting new recruits and retaining staff do not appear to be of great concern among most libraries in our study, the positive spin-offs from creating a quality work environment are perhaps most relevant as they apply to the satisfaction, morale, rejuvenation, and productivity levels of the current workforce. We begin our investigation of job satisfaction by examining the overall levels of job satisfaction among library staff. Sections I.3 and I.4 provide a more detailed analysis of the extrinsic and intrinsic rewards offered to library staff.
142 SECTION I: Quality of Work and Job Satisfaction CANADIAN LIBRARY HUMAN RESOURCE STUDY
I.2 Overall Job Satisfaction
As already noted, other research has found that librarians are somewhat more satisfied with their jobs than the average Canadian (Leckie and Brett, 1997). The results presented in Table I.1 confirm this finding. About 8 in 10 librarians indicated they were “satisfied” or “very satisfied” with their current job. Satisfaction levels, however, tend to increase as occupational level increases: while 72% of non-management librarians state they are satisfied with their jobs, 87% of senior administrators state the same. Satisfaction is especially high among academic and school librarians at all occupational levels.
Table I.1 Librarian Job Satisfaction1 by Occupational Level2 by Library Sector (Individual Survey; n=1,948)
Percent “Satisfied”
Library Sector Total Non-ManagementSupervisors / Middle
Management Senior Administrators
TOTAL 79 72 81 87
TOTAL ACADEMIC 82 76 83 92
CARL 82 75 85 93
Other Academic 81 77 78 91
TOTAL PUBLIC 77 71 80 80
CULC 76 69 82 76
Other Public 79 79 76 82
TOTAL SPECIAL 77 66 80 89
Government 76 66 79 89
Non-Profit 79 65 80 93
For-Profit 78 67 86 82
SCHOOL 85 -- 82 --
Source: 8Rs Canadian Library Human Resource Individual Survey1 Based on “satisfied” and “very satisfied” responses to the question: “Overall, how satisfied are you with your current job?” 2 Separate occupational level results are not presented when there are fewer than 15 cases reporting; however, they are included in the Total results.
Given the slightly lower levels of job satisfaction among non-management librarians, we might expect similar levels of jobs satisfaction among recent entrants. The results presented in Table I.2, however, do not support this supposition. Librarians who have been in their careers for less than 6 years are, in fact, slightly more satisfied than mid-career librarians (those who have been in their careers for 6 to 15 years). This is the case, in particular, among academic and government librarians. Senior librarians, many of whom would be in management and se-nior administrative positions, are the most satisfied (81%). Overall, however, the differences in satisfaction levels are quite small between all three career stages.
SECTION I: Quality of Work and Job Satisfaction 143The Future of Human Resources in Canadian Libraries
Table I.2 Librarian Job Satisfaction1 by Career Stage2 by Library Sector3
(Individual Survey; n=1,948)
Percent “Satisfied”
Library Sector Total Recent Entrants Mid-Career Senior
TOTAL 79 78 75 81
TOTAL ACADEMIC 82 84 75 84
CARL 82 81 77 84
Other Academic 81 90 71 83
TOTAL PUBLIC 77 73 75 79
CULC 76 70 74 79
Other Public 79 77 79 80
TOTAL SPECIAL 77 76 74 79
Government 76 87 70 75
Non-Profit 79 71 79 83
For-Profit 78 -- -- 88
SCHOOL 85 -- -- 80
Source: 8Rs Canadian Library Human Resource Individual Survey1 Based on responses to the question: “Overall, how satisfied are you with your current job?” Those responding “very satisfied” or “satisfied” are combined and presented in this table.2 Recent Professional Librarian Entrants are individuals who have been working as a professional librarian for less than 6 years, Mid-Career Professional Librarians have been working as a librarian for 6 to 15 years, and Senior Librarians have been working as a librarian for more than 15 years.3 Separate sub-sector results are not presented when there are fewer than 15 cases reporting; however, they are included in the Total results.
Table I.3 demonstrates that paraprofessionals are equally satisfied with their jobs as are professionals (79%). Though library assistants/associates/aides and library technicians express similar levels of satisfaction, manage-ment paraprofessionals are the most satisfied of the three job types. Somewhat notable is the fact that, in contrast to their very satisfied professional counterparts, academic paraprofessionals are slightly less satisfied than other paraprofessionals. Within CARL libraries, this is the case among library assistants, associates, and aides, and within other academic libraries, it appears that library technicians are the least satisfied. But again, the satisfaction levels across types of jobs and sectors are remarkably similar. With few exceptions, this same conclusion can be drawn about the variation in satisfaction levels between the three career stage groups among paraprofessionals (Table I.4).
144 SECTION I: Quality of Work and Job Satisfaction CANADIAN LIBRARY HUMAN RESOURCE STUDY
Table I.3 Paraprofessional Job Satisfaction1 by Type of Position by Library Sector2
(Individual Survey; n=1,615)
Percent “Satisfied”
Library Sector Total Library Assistants,
Assocs., AidesLibrary
Technicians Management
TOTAL 79 75 77 85
TOTAL ACADEMIC 75 72 75 81
CARL 74 70 78 78
Other Academic 76 79 71 84
TOTAL PUBLIC 81 78 79 87
CULC 78 75 76 91
Other Public 86 90 86 83
TOTAL SPECIAL 79 70 78 91
Government 82 76 81 93
Non-Profit 75 60 76 85
For-Profit 77 -- 67 --
SCHOOL 86 88 88 84
Source: 8Rs Canadian Library Human Resource Individual Survey1 Based on “satisfied” and “very satisfied” responses to the question: “Overall, how satisfied are you with your current job?” 2 Separate position type results are not presented when there are fewer than 15 cases reporting; however, they are included in the Total results.
Table I.4 Paraprofessional Job Satisfaction1 by Career Stage2 by Library Sector3
(Individual Survey; n=1,615)
Percent “Satisfied”
Library Sector Total Recent Entrants Mid-Career Senior
TOTAL 79 77 79 79
TOTAL ACADEMIC 82 73 74 75
CARL 82 74 72 75
Other Academic 81 73 78 76
TOTAL PUBLIC 77 80 81 81
CULC 76 78 78 79
Other Public 79 85 86 87
TOTAL SPECIAL 77 66 81 87
Government 76 73 82 87
Non-Profit 79 68 71 86
For-Profit 78 -- -- 93
SCHOOL 85 92 85 82
Source: 8Rs Canadian Library Human Resource Individual Survey1 Based on “satisfied” and “very satisfied” responses to the question: “Overall, how satisfied are you with your current job?” 2 Recent Professional Librarian Entrants are individuals who have been working as a professional librarian for less than 6 years, Mid-career Professional Librarians have been working as a librarian for 6 to 15 ears, and Senior Librarians have been working as a librarian for more than 15 years.3 Separate sub-sector results are not presented when there are fewer than 15 cases reporting; however, they are included in the Total results.
SECTION I: Quality of Work and Job Satisfaction 145The Future of Human Resources in Canadian Libraries
Despite the few differences in job satisfaction between librarians and paraprofessionals, between different sectors, and between different occupational and career stages, the overall story of the results presented in this section are very positive. In the next two sections we take a closer look at the extrinsic and extrinsic components that bear on job satisfaction.
I.3 Extrinsic Benefits and Job Satisfaction
Increasing evidence suggests that employees value intrinsic factors (such as having relationships of respect, trust and loyalty with employers, having a job that is rewarding, interesting and participatory) more than extrinsic factors (such as pay, benefits, and job security). Lowe’s (2000) research, for example, has found that above salary, employees are interested in career-advancement opportunities, training and development, and in employers who are supportive of their experiences with these initiatives. Still, having a job that pays well is important to most employees.
Interestingly, it is often believed that employees in the non-profit sector hold a different orientation toward ex-trinsic and intrinsic work factors than those in the for-profit sector. This is based on the assumption that employ-ees are willing to accept lower salaries in return for working in a job that has social or cultural value. Known as the “donative-labour hypothesis,” researchers argue that individuals who seek out employment with non-profit organizations are willing to forego higher wages in return for work that they view as being more socially worth-while than available elsewhere (Rose-Ackerman, 1996). Some have even argued that the offering of lower wages will actually attract staff who have a more single-minded commitment to the cause of the non-profit organization (Handy and Katz, 1998).
I SalaryThe earnings of librarians in our sample, however, do not support Handy and Katz’s assumptions about wages. Table I.5a provides the median yearly full-time salaries for all librarians, for non-management librarians, for supervisors and middle management and for upper-level management librarians. On average, all full-time li-brarians earned $60,000 per year. Non-management librarians earned $51,620 compared to supervisors/middle management who earned $60,000, and senior administrators who earned a median annual salary of $75,000.
These salaries are somewhat more favourable than those offered in for-profit organizations where professionals make an average of $48,000 year, for a difference of $12,000 (McMullen and Schellenberg, 2003). Since these comparative figures are based on a very different calculation method, however, caution should be taken in in-terpreting these numbers. Perhaps a more comparable occupational group is that of public school educators (in-cluding teachers, principals, and other school professionals) who in 2002/2003 earned an average annual salary of $58,680 (Nault, 2004).
146 SECTION I: Quality of Work and Job Satisfaction CANADIAN LIBRARY HUMAN RESOURCE STUDY
Table I.5a Median Yearly Librarian Salary1 by Occupational Level by Library Sector2 (Full-Time Only; Individual Survey; n=1,779)
$ Median Yearly Salary (Full-Time Only)
Library Sector Total Non-ManagementSupervisors/ Middle
ManagementSenior
Administrators
TOTAL 60,000 51,620 60,000 75,000
TOTAL ACADEMIC 65,000 57,000 68,000 85,000
CARL 67,000 57,000 70,000 92,000
Other Academic 63,000 54,500 62,475 77,000
TOTAL PUBLIC 55,000 48,000 57,000 71,000
CULC 55,000 48,280 59,000 85,000
Other Public 52,000 43,500 52,000 63,000
TOTAL SPECIAL 58,000 48,000 59,000 68,000
Government 60,000 55,000 60,800 70,025
Non-Profit 53,000 51,461 51,072 65,000
For-Profit 60,000 -- -- 72,000
SCHOOL 60,000 -- 60,000 --
Source: 8Rs Canadian Library Human Resource Individual Survey1 80% of respondents reported on salary.2 Separate sub-sector results are not presented when there are fewer than 15 cases reporting.
As for sector differences in earnings, academic librarians (especially those working in CARL libraries) earn the highest salaries in all occupational levels. At the bottom end of the earnings scale are public librarians (particu-larly those working in non-CULC libraries), though the differences between public and special librarians are not large.
As we might expect, virtually all (93%) of librarians agree that “It is important to me to have a job that earns a fair salary.” Table I.5b captures the proportion of librarians “agreeing” that they earn a fair salary. Just over seven in ten librarians responded positively, indicating that they are satisfied with their salaries. Generally, the differences in satisfaction levels by occupational level and library sector correspond with the actual salaries shown in Table I.5a. Senior administrators are the most satisfied as are academic librarians. Overall, non-management public librarians are the least likely to feel they earn a fair salary (55%). An exception to this pattern is found among school librarians, who earned average salaries, but were more satisfied with them. This is true for all occupational levels of school librarians, but notably, 100% of senior administrators working in school settings felt their salaries were fair.
SECTION I: Quality of Work and Job Satisfaction 147The Future of Human Resources in Canadian Libraries
Table I.5b Percentage of Librarians Satisfied with Salary1 by Occupational Level by Library Sector
(Individual Survey; n=2,000)
Percent “Agreeing” Salary Fair2
Library Sector Total Non-ManagementSupervisors / Middle
Management Senior Administrators
TOTAL 72 67 75 78
TOTAL ACADEMIC 80 76 82 84
CARL 80 76 82 87
Other Academic 80 78 82 79
TOTAL PUBLIC 65 55 70 74
CULC 65 54 69 88
Other Public 66 57 71 66
TOTAL SPECIAL 72 71 73 73
Government 80 77 82 79
Non-Profit 62 58 63 64
For-Profit 65 67 47 78
SCHOOL 85 86 82 100
Source: 8Rs Canadian Library Individual Human Resource Survey 1 Based on responses of “4” and “5” on a 5-point scale with “1” meaning “strongly disagree” and “5” meaning “strongly agree” to the statement: “In my job I earn a fair salary.”2 Although salaries are not provided for part-time librarians by library sector because of insufficient cases, the satisfaction levels provided in this table include part-time librarians. The total median yearly income of part-time librarians is $31,375.
Tables I.6a and I.6b provide the median yearly salaries and the satisfaction levels by career stage, respectively. Li-brarians who have been working in their careers for less than 6 years (recent entrants) earn, on average, $45,000 annually, those working between 6 and 15 years (mid-career librarians) earn $55,115, and those who have worked in their careers for more than 15 years (senior librarians) earn a median yearly salary of $66,700. Again, sector differences in salaries at all career stages are such that academics earn the highest salaries and public librarians the lowest. And again, variations in salary satisfaction parallel salaries (Table I.6b). The group least likely to view their salaries as fair are recent entrants in non-profit libraries (43%), who earn $42,500 annually.
148 SECTION I: Quality of Work and Job Satisfaction CANADIAN LIBRARY HUMAN RESOURCE STUDY
Table I.6a Median Yearly Librarian Salary by Career Stage1 and by Library Sector2
(Full-Time Only; Individual Survey; n=1,779)
$ Median Yearly Salary (Full-Time Only)3
Library Sector Total Recent Entrants Mid-Career Senior
TOTAL 60,000 45,000 55,116 66,700
TOTAL ACADEMIC 65,000 47,000 60,000 74,470
CARL 67,000 48,000 61,000 75,000
Other Academic 63,000 45,000 56,000 73,000
TOTAL PUBLIC 55,000 43,000 50,000 61,000
CULC 55,000 43,000 50,000 63,000
Other Public 52,000 42,000 51,000 58,000
TOTAL SPECIAL 58,000 46,000 56,800 65,000
Government 60,000 50,000 57,240 66,000
Non-Profit 53,000 42,500 54,000 62,000
For-Profit 60,000 -- -- 67,000
SCHOOL 60,000 -- -- 63,550
Source: 8Rs Canadian Library Individual Human Resource Survey 1 Recent Professional Librarian Entrants are individuals who have been working as a professional librarian for less than 6 years, Mid-Career Professional Librarians have been working as a librarian for 6 to 15 years, and Senior Librarians have been working as a librarian for more than 15 years.2 Separate career stage results are not presented when there are fewer than 15 cases reporting.3 80% of respondents reported on salary.
Table I.6b Percentage of Librarians Satisfied with Salary1 by Career Stage2 and by Library Sector3
(Individual Survey; n=2,000)
Percent “Agreeing” Salary Fair4
Library Sector Total Recent Entrants Mid-Career Senior
TOTAL 72 64 69 77
TOTAL ACADEMIC 80 70 77 85
CARL 80 71 80 83
Other Academic 80 68 73 89
TOTAL PUBLIC 65 59 60 69
CULC 65 59 60 69
Other Public 66 59 60 72
TOTAL SPECIAL 72 63 73 77
Government 80 79 79 80
Non-Profit 62 43 62 74
For-Profit 65 -- -- 70
SCHOOL 85 -- -- 85
Source: 8Rs Canadian Library Individual Human Resource Survey 1 Based on responses of “4” and “5” on a 5-point scale with “1” meaning “strongly disagree” and “5” meaning “strongly agree” to the statement: “In my job I earn a fair salary.”2 Recent Professional Librarian Entrants are individuals who have been working as a professional librarian for less than 6 years, Mid-Career Professional Librarians have been working as a librarian for 6 to 15 years, and Senior Librarians have been working as a librarian for more than 15 years.3 Separate career stage results are not presented when there are fewer than 15 cases reporting.4 Although salaries are not provided for part-time librarians by library sector because of insufficient cases, the satisfaction levels provided in this table include part-time librarians. The total median yearly income of part-time librarians is $31,375.
SECTION I: Quality of Work and Job Satisfaction 149The Future of Human Resources in Canadian Libraries
Table I.7a provides the median yearly salary by occupational level and for librarians working in the various prov-inces/regions of the country, and Table I.7b shows satisfaction levels for the same groups. Salary variation across the country is not great, ranging from a high of $66,480 in the northern Territories to a low of $53,000 in the Maritime provinces. The relatively higher salaries in the north is likely a function of the higher cost of living in these areas, but it also may reflect employers’ attempts to attract professional librarians to work in this predomi-nantly rural and remote region of Canada. The lower median incomes in the Maritimes also reflect the generally lower incomes of residents of these provinces.
Table I.7a Median Yearly Librarian Salary1 by Occupational Level2 by Province/Region
(Full-Time Only; Individual Survey; n=1,779)
$ Median Yearly Salary
Province / Region Total Non-ManagementSupervisors/ Middle
Management Senior Administrators
TOTAL 60,000 51,620 60,000 75,000
British Columbia 58,000 48,000 57,000 75,000
Alberta 58,500 50,000 60,100 78,000
Saskatchewan/Manitoba 58,000 52,000 56,000 69,500
Ontario 62,000 53,000 66,000 79,000
Quebec 62,000 55,000 62,500 78,250
Maritimes 53,000 45,000 52,000 61,000
Northern Territories 66,480 -- -- --
Source: 8Rs Canadian Library Individual Human Resource Survey 1 77% of respondents reported on salary. 2 Separate occupational level results are not presented when there are fewer than 15 cases reporting.
Other than the very high satisfaction levels (94%) with salary among librarians working in the northern Territo-ries (which corresponds with their higher salaries), little variation is observed in salary satisfaction levels between the remaining provinces/territories. Nonetheless, the groups most likely to disagree that their salaries are fair are non-management librarians working in the Maritimes and senior administrators in Saskatchewan/Manitoba (Table I.7b).
150 SECTION I: Quality of Work and Job Satisfaction CANADIAN LIBRARY HUMAN RESOURCE STUDY
Table I.7b Percentage of Librarians Satisfied with Salary1 by Occupational Level2 by Province/Region
(Individual Survey; n=2,000)
Percent “Agreeing” Salary Fair3
Province/Region Total Non-ManagementSupervisors / Middle
Management Senior Administrators
TOTAL 72 67 75 78
British Columbia 71 58 75 87
Alberta 69 66 69 71
Saskatchewan/Manitoba 70 83 71 53
Ontario 76 70 77 85
Quebec 69 69 71 75
Maritimes 69 57 76 68
Northern Territories 94 -- -- --
Source: 8Rs Canadian Library Individual Human Resource Survey 1 Based on responses of “4” and “5” on a 5-point scale with “1” meaning “strongly disagree” and “5” meaning “strongly agree” to the statement: “In my job I earn a fair salary.”2 Separate occupational level results are not presented when there are fewer than 15 cases reporting.3 Although salaries are not provided for part-time librarians by library sector because of insufficient cases, the satisfaction levels provided in this table include part-time librarians. The total median yearly income of part-time librarians is $31,375.
In tables I.8a and I.8b we present median incomes and satisfaction levels by rural/urban location. Rural non-management and supervisors/middle management librarians earn 90% of the incomes of their urban counter-parts, but only 82% of their senior administrator urban librarian comparative group. Though the satisfaction levels are also lower for all occupational types of rural librarians, they are most noticeably lower among senior administrators.
Table I.8a Median Yearly Librarian Salary1 by Occupational Level by Rural/Urban Location
(Full-Time Only; Individual Survey; n=1,779)
$ Median Yearly Salary
Rural/Urban Total Non-ManagementSupervisors/ Middle
Management Senior Administrators
TOTAL 60,000 51,620 60,000 75,000
Rural 56,000 46,700 55,000 65,000
Urban 60,000 52,000 61,000 79,500
Source: 8Rs Canadian Library Individual Human Resource Survey 1 72% of respondents reported on income and rural/urban designation
SECTION I: Quality of Work and Job Satisfaction 151The Future of Human Resources in Canadian Libraries
Table I.8b Percentage of Librarians Satisfied with Salary1 by Occupational Level by Rural / Urban Location
(Full-Time Only; Individual Survey; n=2,000)
Percent “Agreeing” Salary Fair2
Province / Region Total Non-ManagementSupervisors / Middle
Management Senior Administrators
TOTAL 72 67 75 78
Rural 70 68 71 72
Urban 72 70 75 79
Source: 8Rs Canadian Library Individual Human Resource Survey 1 Based on responses of “4” and “5” on a 5-point scale with “1” meaning “strongly disagree” and “5” meaning “strongly agree” to the statement: “In my job I earn a fair salary.”2 Although salaries are not provided for part-time librarians by library sector because of insufficient cases, the satisfaction levels provided in this table include part-time librarians. The total median yearly income of part-time librarians is $31,375.
Despite the variations across sectors, regions/provinces, occupational levels, and career stage depicted in Tables I.5a through I.8b, the overall story of librarian salaries is a very positive one. The same positive assessment, how-ever, is not as easily made for salaries earned by paraprofessional staff.
Table I.9a presents the median yearly paraprofessional salary by sector and type of position. Earning a yearly me-dian income of $37,500, paraprofessionals earn about 63 cents for every dollar made by a professional librarian. The salary variations between sectors are also less noticeable for paraprofessionals than they are for professionals. Furthermore, in contrast to librarians (of which academic professionals made the highest salaries), paraprofes-sionals working in special libraries were the highest earners among this group, on average. The differences in salaries between library assistants/associates/aides and library technicians and management paraprofessionals is also not great. Still, as depicted in Table I.9b, management paraprofessionals are slightly more likely than other paraprofessionals to express satisfaction with this salaries (64% compared to the total sample of 61%). The excep-tion to this pattern is found among school technicians and managers who earn $27,750 and $55,500, respectively. The satisfaction levels of these two groups reflect this disparity; only 39% of school library technicians compared to 76% of school library managers felt they earned a fair salary.
152 SECTION I: Quality of Work and Job Satisfaction CANADIAN LIBRARY HUMAN RESOURCE STUDY
Table I.9a Median Yearly Paraprofessional Salary1 by Type of Position by Library Sector2
(Full-Time Only; Individual Survey; n=1,159)
$ Median Yearly Salary
Library Sector Total Library Assistants,
Assocs., AidesLibrary
Technicians Management
TOTAL 37,500 35,240 37,000 41,000
TOTAL ACADEMIC 37,000 36,000 37,000 41,000
CARL 38,000 36,500 38,055 41,765
Other Academic 36,000 35,000 36,000 40,000
TOTAL PUBLIC 36,000 34,000 38,000 39,800
CULC 37,065 35,000 38,110 41,000
Other Public 34,000 28,000 34,000 35,000
TOTAL SPECIAL 40,000 35,620 39,890 41,500
Government 40,490 -- 40,605 41,000
Non-Profit 35,950 -- 36,400 36,750
For-Profit 40,000 -- 38,500 --
SCHOOL 39,000 30,000 27,750 55,500
Source: 8Rs Canadian Library Individual Human Resource Survey 1 78% of respondents reported on salary. 2 Separate sub-sector results are not presented when there are fewer than 15 cases reporting; however, they are included in the Total results.
Table I.9b Percentage of Paraprofessionals Satisfied with Salary1 by Type of Position and Library Sector2
(Full-Time Only3; Individual Survey; n=1,666)
Percent “Agreeing” Salary Fair
Library Sector Total Library Assistants,
Assocs., Aides Library
Technicians Management
TOTAL 61 59 61 64
TOTAL ACADEMIC 58 55 59 59
CARL 56 55 59 52
Other Academic 61 56 59 70
TOTAL PUBLIC 62 63 66 59
CULC 64 62 65 68
Other Public 59 67 68 52
TOTAL SPECIAL 62 56 63 68
Government 62 54 65 64
Non-Profit 61 60 58 70
For-Profit 64 63 -- --
SCHOOL 64 62 39 76
Source: 8Rs Canadian Library Individual Human Resource Survey 1 Based on responses of “4” and “5” on a 5-point scale with “1” meaning “strongly disagree” and “5” meaning “strongly agree” to the statement: “In my job I earn a fair salary.”2 Separate sub-sector results are not presented when there are fewer than 15 cases reporting; however, they are included in the Total results.3 Although salaries are not provided for part-time paraprofessionals by library sector because of insufficient cases, the satisfaction levels provided in this table include part-time librarians. The total median yearly income of part-time paraprofessionals is $20,000.
SECTION I: Quality of Work and Job Satisfaction 153The Future of Human Resources in Canadian Libraries
Evan less variation is observed between paraprofessionals who have worked in their careers for less than 6 years and those working longer (Tables I.10a and I.10b). While recent entrants earned an average salary of $34,000, mid-career paraprofessionals who had been working in their careers for 6 to 15 years earned only $36,000, and those working for more than 15 years earned $40,000 annually, on average. In fact, within the school sector, re-cent entrants earned significantly higher salaries than senior paraprofessionals ($51,500 compared to $38,500). This disparity is reflected in the high satisfaction levels among recent entrants and the relatively low satisfaction levels among senior paraprofessionals in this sector (Table I.10b; 73% and 54%, respectively).
Table I.10a Median Yearly Paraprofessional Salary1 by Career Stage2 and Library Sector3
(Full-time Only; Individual Survey; n=1,159)
$ Median Yearly Salary
Library Sector Total Recent Entrants Mid-Career Senior
TOTAL 37,500 34,000 36,000 40,000
TOTAL ACADEMIC 37,000 32,470 35,000 40,000
CARL 38,000 35,500 34,705 40,000
Other Academic 36,000 30,000 36,000 38,700
TOTAL PUBLIC 36,000 34,000 35,000 38,000
CULC 37,065 34,000 36,000 39,000
Other Public 34,000 32,605 32,000 36,500
TOTAL SPECIAL 40,000 34,500 40,000 41,105
Government 40,490 36,740 40,000 41,000
Non-Profit 35,950 34,000 37,200 42,000
For-Profit 40,000 -- -- 41,500
SCHOOL 39,000 51,500 39,000 38,500
Source: 8Rs Canadian Library Individual Human Resource Survey 1 78% of respondents reported on salary. 2 Recent Professional Librarian Entrants are individuals who have been working as a professional librarian for less than 6 years, Mid-Career Professional Librarians have been working as a librarian for 6 to 15 years, and Senior Librarians have been working as a librarian for more than 15 years.3 Separate sub-sector results are not presented when there are fewer than 15 cases reporting; however, they are included in the Total results.
154 SECTION I: Quality of Work and Job Satisfaction CANADIAN LIBRARY HUMAN RESOURCE STUDY
Table I.10b Percentage of Paraprofessionals Satisfied with Salary1 by Career Stage by Library Sector2
(Individual Survey; n=1,666)
Percent “Agreeing” Salary Fair
Library Sector Total Recent Entrants Mid-Career Senior
TOTAL 61 62 61 59
TOTAL ACADEMIC 58 62 59 56
CARL 56 69 56 53
Other Academic 61 55 64 62
TOTAL PUBLIC 62 62 63 62
CULC 64 68 64 61
Other Public 59 51 61 63
TOTAL SPECIAL 62 54 63 67
Government 62 64 59 63
Non-Profit 61 46 64 73
For-Profit 64 -- -- 75
SCHOOL 64 73 63 54
Source: 8Rs Canadian Library Individual Human Resource Survey 1 Based on responses of “4” and “5” on a 5-point scale with “1” meaning “strongly disagree” and “5” meaning “strongly agree” to the statement: “In my job I earn a fair salary.”2 Separate sub-sector results are not presented when there are fewer than 15 cases reporting; however, they are included in the Total results.
When examining paraprofessional salaries by level of education, an even more disturbing pattern emerges (Tables I.11a and I.11b). Paraprofessionals with a high school diploma earn 97% of the incomes earned by those with a post-secondary diploma or certificate and 95% of the incomes earned by those with a university degree. These findings strongly suggest that the credentials of paraprofessionals are not factored into salary determinations in many libraries across the country. The exception again is within school libraries, where university graduates earn much higher incomes than do post-secondary certificate/diploma recipients. Despite the salaries presented in Table I.11a, university graduates are equally likely as those with less education to feel they earn a fair salary (Table I.11b).
SECTION I: Quality of Work and Job Satisfaction 155The Future of Human Resources in Canadian Libraries
Table I.11a Median Yearly Paraprofessional Salary1 by Highest Level of Education by Library Sector2
(Full-Time Only; Individual Survey; n=1,159)
$ Median Yearly Salary
Library Sector High School Diploma Post-Sec. Diploma/Cert. University Degree
TOTAL 36,000 37,000 38,000
TOTAL ACADEMIC 37,000 37,155 37,000
CARL 37,400 37,700 38,000
Other Academic 36,000 36,750 35,650
TOTAL PUBLIC 35,000 36,000 37,000
CULC 35,000 36,565 38,000
Other Public 33,000 34,000 34,500
TOTAL SPECIAL 38,675 40,000 40,000
Government -- -- 42,000
Non-Profit -- -- 38,000
For-Profit -- -- 40,000
SCHOOL -- 29,000 54,000
Source: 8Rs Canadian Library Individual Human Resource Survey 1 78% of respondents reported on salary. 2 Separate sub-sector results are not presented when there are fewer than 15 cases reporting; however, they are included in the Total results.
Table I.11b Percentage of Paraprofessionals Satisfied with Salary1 by Highest Level of Education by Library Sector2
(Individual Survey; n=1,666)
Percent “Agreeing” Salary Fair
Library Sector High School Diploma Post-Sec. Diploma/Cert. University Degree
TOTAL 60 61 61
TOTAL ACADEMIC 62 55 59
CARL 59 51 58
Other Academic 70 60 61
TOTAL PUBLIC 61 63 61
CULC 68 64 62
Other Public 50 62 61
TOTAL SPECIAL 52 66 62
Government 50 66 63
Non-Profit -- 61 63
For-Profit -- 74 60
SCHOOL -- 58 68
Source: 8Rs Canadian Library Individual Human Resource Survey 1 Based on responses of “4” and “5” on a 5-point scale with “1” meaning “strongly disagree” and “5” meaning “strongly agree” to the statement: “In my job I earn a fair salary.”2 Separate sub-sector results are not presented when there are fewer than 15 cases reporting; however, they are included in the Total results.
156 SECTION I: Quality of Work and Job Satisfaction CANADIAN LIBRARY HUMAN RESOURCE STUDY
In summarizing Tables I.5a through I.11b, while the salaries of professional librarians defy the “donative-labour hypothesis” discussed at the beginning of this section, paraprofessional staff appear to be willing to accept lower salaries because of the benefits of working in a job that carries social or cultural value. This may be especially true for highly-educated management paraprofessionals. But since the satisfaction levels are somewhat lower among paraprofessionals than professionals, it seems that not all of the latter library staff willingly make this labour deal.
II BenefitsEarnings are only one part of the overall compensation package. Benefits also provide an indication of the extent to which employees are recognized for their labour. Since the majority (90%) of librarians work on a full-time, permanent basis, we focus on the benefits provided to these staff in this section. The results for temporary librar-ians are, however, provided in Appendix Tables I.1a and I.1b, and for part-time librarians in Appendix Tables I.2a and I.2b with no further comment.
Tables I.12a and I.12b indicate that most libraries are able to offer a wide range of benefits to their librarians. A majority of libraries (and virtually all academic libraries) provide retirement or pension plans and life/disability insurance. Workers‘ compensation and supplemental medical/dental plans are also provided by a large majority of libraries. Somewhat fewer institutions (but still a majority) offer an employee assistance plan. With the excep-tion of academic libraries, the remaining benefits are provided by a much smaller proportion of organizations in the sample. The tables also reveal that these extrinsic benefits are offered less frequently in small public libraries while academic librarians are more likely to receive such benefits.
Table I.12a Benefits Offered to Full-Time, Permanent Librarians by Library Sector1 (Institutional Survey; n=270)
Percent of Organizations Offering Benefit
Library Sector Worker’s Comp. Dental Plan MedicalLife/ Disability
InsuranceRetirement/ Pension Plan Group RRSP
TOTAL 87 84 88 95 92 39
TOTAL ACADEMIC 92 86 92 98 98 42
CARL 100 89 100 100 100 42
Other Academic 88 84 88 97 97 42
TOTAL PUBLIC 90 82 86 91 92 30
CULC 92 96 96 100 100 31
Other Public 90 78 83 89 90 30
TOTAL SPECIAL 78 85 87 97 94 47
Government 84 81 91 97 97 41
Non-Profit 77 87 83 97 80 43
Source: 8Rs Canadian Library Human Resource Institutional Survey1 For-Profit library results are not presented separately because of insufficient cases reporting; however, they are included in the Total Special results.
SECTION I: Quality of Work and Job Satisfaction 157The Future of Human Resources in Canadian Libraries
Table I.12b Benefits Offered to Full-time, Permanent Librarians by Library Sector1
(Institutional Survey; n=270)
Percent of Organizations Offering Benefit
Library SectorEmployee
Assistance Program Education LeaveSabbatical/
Research Leave Tenure
TOTAL 69 44 33 13
TOTAL ACADEMIC 80 68 59 39
CARL 96 77 73 65
Other Academic 72 63 53 26
TOTAL PUBLIC 59 28 18 2
CULC 89 46 16 0
Other Public 51 23 18 2
TOTAL SPECIAL 72 41 26 3
Government 81 63 34 3
Non-Profit 77 28 23 0
Source: 8Rs Canadian Library Human Resource Institutional Survey1 For-Profit library results are not presented separately because of insufficient cases reporting; however, they are included in the Total Special results.
Overall, these benefits compare very favourably to those offered among Canadian workplaces in general. For ex-ample, only one-half of the labour force has employer-sponsored pension plans (Lowe, 2000), compared to 92% of librarians. The proportion of libraries offering benefits is also somewhat higher than in other non-profit orga-nizations. While 79% of non-profit organizations offer supplemental medical benefits to their full-time employees (McMullen and Schellenberg, 2003), 88% of libraries in our sample provided this benefit.
As depicted in Table I.13, 4 in 5 librarians expressed satisfaction with their benefit packages (see Appendix Table I.3 and I.4 for satisfaction levels with benefits by career stage and work status). Somewhat smaller proportions of non-management are satisfied, with CULC non-management professionals the least satisfied of all librarians (57%). Interestingly, however, CULC senior administrators are among the most satisfied with the benefits pro-vided by their libraries (90%).
158 SECTION I: Quality of Work and Job Satisfaction CANADIAN LIBRARY HUMAN RESOURCE STUDY
Table I.13 Percentage of Librarians Satisfied with Benefits1 by Occupational Level by Library Sector2
(Individual Survey; n=2,006)
Percent “Agreeing” Benefits Adequate
Library Sector Total Non-ManagementSupervisors/ Middle
ManagementSenior
Administrators
TOTAL 80 73 84 85
TOTAL ACADEMIC 85 82 88 89
CARL 86 82 88 93
Other Academic 84 82 86 84
TOTAL PUBLIC 73 58 80 82
CULC 72 57 81 90
Other Public 74 63 77 78
TOTAL SPECIAL 84 80 87 84
Government 91 84 97 90
Non-Profit 75 78 73 75
For-Profit 82 87 69 89
SCHOOL 91 -- 100 --
Source: 8Rs Canadian Library Human Resource Individual Survey1 Based on respondents agreeing with the statement: “In my job I receive adequate benefits.”2 Separate sub-sector results are not presented when there are fewer than 15 cases reporting; however, they are included in the Total results.
Though we do not have information about the benefits provided to paraprofessional staff, we do have data show-ing the extent to which they are satisfied with the benefits offered in their jobs (Table I.14). Overall, parapro-fessionals are somewhat less likely to agree that the benefits they receive in their jobs are fair (70%). Library assistants, associates, and aides are the least satisfied, as are public sector paraprofessionals.
SECTION I: Quality of Work and Job Satisfaction 159The Future of Human Resources in Canadian Libraries
Table I.14 Percentage of Paraprofessional Staff Satisfied1 with Benefits by Type of Position by Library Sector2
(Individual Survey; n = 1,680)
Percent “Agreeing” Benefits Adequate
Library Sector Total Library Assistants,
Assocs., Aides Library
Technicians Management
TOTAL 70 64 74 73
TOTAL ACADEMIC 78 77 77 84
CARL 79 79 77 81
Other Academic 77 70 77 88
TOTAL PUBLIC 56 48 65 60
CULC 59 51 59 79
Other Public 50 38 83 44
TOTAL SPECIAL 75 60 79 77
Government 81 65 85 83
Non-Profit 63 50 65 68
For-Profit 86 -- 83 --
SCHOOL 77 82 65 81
Source: 8Rs Canadian Library Human Resource Individual Survey1 Based on respondents agreeing with the statement: “In my job I receive adequate benefits.”2 Separate sub-sector results are not presented when there are fewer than 15 cases reporting; however, they are included in the Total results.
Overall, the results in this section suggest that the extrinsic benefits provided to professional librarians are supe-rior to those offered to paraprofessionals. Despite these differences, however, satisfaction levels among parapro-fessionals are comparable to those of professionals. But extrinsic factors only present part of the job satisfaction story, since we know that employees tend to put more value on the intrinsic factors offered in their jobs. We look at some of the most important intrinsic factors provided to library staff in the following section.
Somewhat high levels of job satisfaction among librarians and para-professionals is in part attributable to the very good extrinsic rewards offered in most Canadian libraries.
I.4 Intrinsic Benefits and Job Satisfaction
The examination of the relationship between intrinsic rewards, productivity, and job satisfaction is a pervasive element of the human resource literature. Central to contemporary management approaches are work reform schemes such as job enlargement, job enrichment, quality circles, and participative management. Implementing such initiatives can result in mutual gains for employers and employees in terms of increased productivity and job satisfaction, respectively.
I Job Strategies and Job SatisfactionThe work organization practices presented in Table I.15 suggest that while many libraries have implemented the previously-mentioned types of programs that contribute to a quality of work life, room for improvement clearly exists.
160 SECTION I: Quality of Work and Job Satisfaction CANADIAN LIBRARY HUMAN RESOURCE STUDY
Problem-solving teams are practiced by half of the libraries, and most predominantly so in the CARL and CULC sectors (81% and 65%, respectively). But job enrichment, job sharing, or job rotation are practiced by only a minority of libraries, though again they are more common practices in CARL and CULC libraries. Since these types of job strategies are known to enhance skill flexibility (and our analysis indicates that librarians are increas-ingly required to learn new skills and to focus more on becoming generalists), libraries might benefit from their implementation. These job strategies can also rejuvenate and motivate staff by providing task variety, as well as furnishing them with a greater range of marketable skills that can be transferred from position to position or organization to organization.
Table I.15 Percentage of Organizations Employing Job Strategies for Professional Librarians by Library Sector1
(Individual Survey; n=272)
Percent of Organizations Employing Job Strategy
Library SectorProblem-
Solving Teams Job
MentoringJob
EnrichmentJob
Rotation
TOTAL 50 30 26 11
TOTAL ACADEMIC 59 41 36 15
CARL 81 58 58 27
Other Academic 48 33 26 10
TOTAL PUBLIC 50 25 25 13
CULC 65 46 36 31
Other Public 46 18 21 8
TOTAL SPECIAL 41 27 17 5
Government 44 31 13 6
Non-Profit 43 26 21 6
Source: 8Rs Canadian Library Human Resource Institutional Survey1 For-Profit library results are not presented separately because of insufficient cases reporting; however, they are included in the Total Special results.
II Job Empowerment and Job SatisfactionHuman resource practitioners have increasingly recognized that the participation and empowerment of employ-ees is of benefit to both parties. Leckie and Brett (1997), who studied the job satisfaction of Canadian university librarians, concluded that adding greater involvement of librarians in organizational development (i.e., high-level decisions) counters the routine nature of the profession and is a solution to rejuvenating employees. The research further revealed that salary is only weakly related to overall satisfaction. Instead, the best predictors of overall job satisfaction are participation variables--for example, feeling involved, informed, consulted, and in control of daily activities. Empowerment also bears on our findings of the increased need for librarians to perform leader-ship roles. Insofar as leadership involves self-initiative and the ability to develop and implement goals and visions, the more librarians are involved in the decision-making process, the better able they will be to carry out these initiatives.
Table I.16 presents a series of individual survey responses that pertain to librarians’ participation in the decision-making process. Clearly, it is important to professional librarians that they be able to participate in decisions that directly affect their area of work, with 9 in 10 agreeing with this statement. However, only 77% of those indicating that this level of participation is important are in jobs that allow them to participate in local-level decision mak-ing. The interest in participating in higher-level decisions that affect the overall library, however, is significantly lower, as are those reporting that their job allows them to participate in these higher-level decisions. The differ-ence between interest levels and actual participation is not greater for local than it is for global decisions. These
SECTION I: Quality of Work and Job Satisfaction 161The Future of Human Resources in Canadian Libraries
findings, therefore, indicate a closer match between the interest and actual participation for higher-level decisions than that for local decisions.
Sectoral differences in empowerment also demonstrate that the structures of most large organizations (e.g., CARL and CULC) serve as barriers to the full participation of their librarian staff. Conversely, the flatter organizational structures typical of smaller libraries (e.g., non-CULC, non-profit, and for-profit libraries) permit a greater pro-portion of librarians to participate in decisions at both levels. Still, with few exceptions, the empowerment of librarians does not appear to be a problem in most libraries across the country.32 Though interest in participating in decision-making is lower among paraprofessionals, the same sector conclusions can be applied to this work-force (Table I.17)
Table I.16 Librarian Empowerment and Involvement in Decision Making1 by Library Sector
(Individual Survey; n=2,007)
Percent “Agreeing” that “I participate in…”
Decisions About My Area Decisions About the Overall Library Strategy
Library SectorInvolvement in
Decisions ImportantJob Allows Involvement
in DecisionsInvolvement in
Decisions ImportantJob Allows Involvement
in Decisions
TOTAL 90 77 76 65
TOTAL ACADEMIC 91 78 76 66
CARL 88 74 70 59
Other Academic 96 86 86 77
TOTAL PUBLIC 90 73 73 60
CULC 91 68 72 50
Other Public 89 86 77 82
TOTAL SPECIAL 88 81 80 73
Government 84 76 73 68
Non-Profit 93 85 89 75
For-Profit 96 87 92 86
SCHOOL 94 81 97 78
Source: 8Rs Canadian Library Human Resource Individual Survey1 Among those reporting involvement important.
32 Contrary to what we might expect, the measures of library empowerment in the institutional survey were not quite as positive as those presented in Table I.16. While 65% of librarians indicated they participated in overall library decisions, only 48% of library administrators responded similarly (see Appendix Table I.5). We have no logical explanation for this discrepancy, except that perhaps these librarians are not aware of all the different types of higher-level decisions that they could participate in.
162 SECTION I: Quality of Work and Job Satisfaction CANADIAN LIBRARY HUMAN RESOURCE STUDY
Table I.17 Paraprofessional Empowerment and Involvement in Decision Making1 by Library Sector
(Individual Survey; n=1,677)
Percent “Agreeing” that “I participate in…”
Decisions About My Area Decisions About the Overall Library Strategy
Library SectorInvolvement in
Decisions ImportantJob Allows Involvement
in DecisionInvolvement in
Decisions ImportantJob Allows Involvement
in Decisions
TOTAL 71 60 47 52
TOTAL ACADEMIC 71 53 39 37
CARL 68 49 34 32
Other Academic 75 60 49 41
TOTAL PUBLIC 65 57 40 46
CULC 64 50 32 30
Other Public 68 71 56 66
TOTAL SPECIAL 74 69 57 63
Government 67 63 51 58
Non-Profit 85 74 60 63
For-Profit 74 77 71 80
SCHOOL 89 78 82 77
Source: 8Rs Canadian Library Human Resource Individual Surveys1 Among those reporting involvement important.
III Workload, Stress, and Work-Life BalanceExcessive job-related stress can inhibit productivity through job dissatisfaction. Health and disability claims and stress-related leaves are on the rise in Canada (Lowe, 2000). Higgins and Duxbury (2002), for example, found that the demands of the workplace have increased over the past decade, and that workloads are especially high among managers and professionals, as well as among those working in the non-profit sector. The health implications of stress are also widely acknowledged. Hence, our assessment of the quality of work includes an examination of workload manageability, job stress levels, and the ability of library staff to balance work with their family and personal lives.
The intrinsic benefits provided to librarians and paraprofessionals suggest a very good quality of work life is provided in Canadian libraries. The one caveat to this conclusion is the somewhat high levels of job-related stress that are reported, perhaps stemming from excessive workloads.
The results presented in Table I.18 are not nearly as positive as other measures of the quality of work. Only 2 in 5 librarians indicated that their workloads are manageable, and 1 in 4 agreed that they have little work-related stress. Considerably more (62%) reported that they are provided with the opportunity to balance work and fam-ily/personal life in their jobs, although this proportion is not as high as would be desirable. A slightly higher pro-portion of special librarians report manageable workloads and stress levels, and these librarians were also more likely to state they were able to balance work and family. Perhaps predictably, however, very few (18%) school librarians report having “little work-related stress.”
These signs of job stress among professional librarians should not be overlooked by human resource managers and library administrators. Recalling that the ability to handle a high-level workload is one of the top most im-portant and difficult to fulfill competencies when hiring librarians (Tables D.4a-c), it is clear that administrators and human resource managers recognize that workloads are demanding.
SECTION I: Quality of Work and Job Satisfaction 163The Future of Human Resources in Canadian Libraries
Table I.18 Librarian Workload Manageability, Job Stress, and Work-Family Balance by Library Sector
(Individual Survey; n=2,001)
Percent “Agreeing”
Library SectorWorkload
Manageable1 Little
Job Stress2Job Allows Work, Family, Personal Life Balance3
TOTAL 39 24 62
TOTAL ACADEMIC 36 23 60
CARL 35 22 61
Other Academic 38 23 60
TOTAL PUBLIC 38 23 60
CULC 38 22 60
Other Public 38 26 60
TOTAL SPECIAL 47 27 67
Government 47 29 63
Non-Profit 46 27 73
For-Profit 46 19 66
SCHOOL 42 18 63
Source: 8Rs Canadian Library Human Resource Individual Survey1 Based on responses of “4” and “5” on a 5-point scale with “1” meaning “strongly disagree” and “5” meaning “strongly agree” to the statement: “In my job I have a manageable workload.”2 Based on responses of “4” and “5” on a 5-point scale with “1” meaning “strongly disagree” and “5” meaning “strongly agree” to the statement: “In my job I have little work-related stress.”3 Based on responses of “4” and “5” on a 5-point scale with “1” meaning “strongly disagree” and “5” meaning “strongly agree” to the statement: “In my job I am provided with the opportunity to balance work and family or personal life.”
Results from several other questions support these findings and suggest that workloads and stress levels have recently increased. Compared to 5 years ago, 55% of mid-career and senior librarians indicate they work harder now, and 67% agreed that their job is more stressful.
The paraprofessional results from our survey were slightly more positive, although still only half (53%) indicated that their workloads are manageable and even fewer (35%) that their job-related stress is low (Table I.19). Public paraprofessionals are marginally more likely to agree with these statements, but paraprofessionals working in school environments appear to be especially stressed because of their workloads and inability to balance work and family life.
164 SECTION I: Quality of Work and Job Satisfaction CANADIAN LIBRARY HUMAN RESOURCE STUDY
Table I.19 Paraprofessional Workload Manageability, Job Stress, and Work-Family Balance by Library Sector
(Individual Survey; n=1,673)
Percent “Agreeing”
Library Sector Workload Manageable1 Little Job Stress2Job Allows Work, Family, Personal Life Balance3
TOTAL 53 35 75
TOTAL ACADEMIC 53 37 75
CARL 51 37 74
Other Academic 57 38 77
TOTAL PUBLIC 57 34 75
CULC 57 30 74
Other Public 58 41 79
TOTAL SPECIAL 53 38 78
Government 49 39 78
Non-Profit 54 42 80
For-Profit 66 31 75
SCHOOL 43 29 66
Source: 8Rs Canadian Library Human Resource Individual Survey1 Based on responses of “4” and “5” on a 5-point scale with “1” meaning “strongly disagree” and “5” meaning “strongly agree” to the statement: “In my job I have a manageable workload.”2 Based on responses of “4” and “5” on a 5-point scale with “1” meaning “strongly disagree” and “5” meaning “strongly agree” to the statement: “In my job I have little work-related stress.”3 Based on responses of “4” and “5” on a 5-point scale with “1” meaning “strongly disagree” and “5” meaning “strongly agree” to the statement: “In my job I am provided with the opportunity to balance work and family or personal lib.”
Respectful treatment by co-workers has recently been found to be one of the most important elements valued by employees. Respectful relationships are, furthermore, even more important for women than for men (Maxwell and Saunders, 2003). It is, therefore, no surprise that virtually all the librarians and paraprofessionals in our study indicated that it is important to them that they are treated with respect by their superiors (Table I.20). Compara-tively, however, only 77% of librarians and 75% of paraprofessionals agreed that this respect is conferred by their superiors in their jobs.
SECTION I: Quality of Work and Job Satisfaction 165The Future of Human Resources in Canadian Libraries
Table I.20 Respectful Treatment of Librarians and Paraprofessionals by Library Sector
(Individual Survey)
Percent “Agreeing”
Important to be Treated with Respect by Superiors1 Superiors Treat me with Respect2
Library SectorLibrarians(n=1,932)
Paraprofs.(n=1,602)
Librarians(n=1,890)
Paraprofs.(n=1,567)
TOTAL 98 98 77 75
TOTAL ACADEMIC 98 98 77 71
CARL 98 97 77 72
Other Academic 98 99 77 70
TOTAL PUBLIC 97 98 74 77
CULC 97 99 72 76
Other Public 98 98 80 79
TOTAL SPECIAL 99 98 81 79
Government 100 98 80 76
Non-Profit 99 100 86 84
For-Profit 100 97 77 81
SCHOOL 100 98 66 75
Source: 8Rs Canadian Library Human Resource Individual Survey1 Based on responses of “4” and “5” on a 5-point scale with “1” meaning “strongly disagree” and “5” meaning “strongly agree” that “It is important to have a job in which I am treated with respect by my superiors.”2 Among those reporting that it is important to be treated with respect by superiors, based on responses of “4” and “5” on a 5-point scale with “1” meaning “strongly disagree” and “5” meaning “strongly agree” that “In my job I am treated with respect by my superiors.”
IV Most Important Contributors to Job SatisfactionA multivariate regression analysis of the major contributors to job satisfaction revealed that the two single most important factors for both professionals and paraprofessionals are that they are treated with respect by their superiors, and that they work in a job that allows them to grow and learn new skills.33 The former results are in line with a growing body of human resource research demonstrating that respect is often, above all else, the most important reward that can be provided to employees to enhance job satisfaction and productivity (Lowe, 2000). That it is so important to library staff to be able to develop professionally is a very positive finding as well since it fits well with the dynamic needs of a changing library sector.
Library staff are most satisfied with jobs that are allow them to grow and learn new skills in an environment that is characterized by respectful relationships with superiors.
33These two elements explain 32% of the variation in job satisfaction, and are the most important elements for both librarians and paraprofessionals. Specifically, regression coefficients for “treated with respect by superiors” is 0.352 and for “job allows me to grow and learn new skills” is 0.342.
166 SECTION I: Quality of Work and Job Satisfaction CANADIAN LIBRARY HUMAN RESOURCE STUDY
I.4 Strategic Human Resource Planning Implications
• Job satisfaction for both librarians and paraprofessionals is fairly high. For librarians, this satisfaction is slightly higher for recent entrants and senior librarians than for mid-career librarians. Across occupational levels, overall job satisfaction for all library staff tends to grow slightly as occupational levels increase. Still, the overall measure of job satisfaction and the many job satisfaction sub-indicators examined in this sec-tion suggest a very positive rating of the quality of work offered within Canadian libraries. This conclusion might be used as a promotional element to help attract individuals to the profession.
• Salary satisfaction levels, however, are a slightly different story. While 72% of librarians agree that they earn a fair salary, non-management public librarians are least likely to be satisfied, with only 55% agreeing their salary is fair. Overall, paraprofessionals are much less satisfied with their salaries (61%) than librar-ians. At the same time, the majority of paraprofessionals have high levels of education, with 50% possess-ing a university degree. And, we have noted that roles between librarians and paraprofessionals have been shifting within the workplace. When reviewing salary scales, administrators should be conscious of the impact of educational credentials and shifting roles.
• While salaries should be linked to both educational credentials and position responsibilities, if libraries’ ability to pay higher salaries is circumscribed by budget limitations, they should examine the intrinsic benefits within the workplace and see how these can help offset lower salaries.
• Library paraprofessionals working in schools have much lower satisfaction levels with salaries as compared to school librarians. As the school library system attempts to survive the impact of cuts, school administra-tors should be very aware of not only the shrinking component of librarians in school libraries, but also the low satisfaction level of library technician staff (who may be taking responsibility for the library at a lower salary).
• While library staff empowerment overall does not appear to be a problem, it is higher for librarians than it is for paraprofessional staff. Again, considering the education levels of paraprofessionals, and their chang-ing roles, libraries should examine how local and global decisions are made in the workplace, and endea-vour to involve staff throughout the organization, where feasible.
• Library administrators need to carefully watch both the workload and the job stress levels of their staff which appear to be increasing for both professionals and paraprofessionals.
• Key contributors to job satisfaction for library staff are respect from supervisors and the desire to grow and learn new skills. These are congruent with library institutional needs to continue to innovate as they respond to changing user demands and new technologies. In order to build healthy workplaces, senior managers need to understand where their staff are both satisfied and dissatisfied, and provide opportuni-ties to staff throughout the organizational hierarchy, while clearly communicating the limitations within which the institution must function.
SECTION J: Numerical Librarian Demand-Supply Match 167The Future of Human Resources in Canadian Libraries
S E C T I O N J
Numerical Librarian Demand-supply Match
J.1 Introduction
A primary goal of this project is the provision of a research-based investigation into claims of an impending crisis in the supply of librarians. Is the anecdotal evidence of a crisis representative of the Canadian library situation? Does the American perception of a crisis apply to Canadian libraries? Specifically, will libraries be vying for scarce human resources or will they be able to meet their future need for librarians?
Answers to these questions will be addressed by first examining the predicted future demand for librarians, fol-lowed with an assessment of the match to this demand by the predicted supply. In ascertaining demand, one needs to consider the wider contextual elements of Canada’s social, cultural, and economic climate that affects libraries’ expressed need to increase their librarian corps, or not. In our demand assessment, however, we draw upon the expressed predictions of those in the community itself. The numerical supply of librarians can be pre-dicted with a simple formula that takes the existing staffing complement, subtracts numbers of retirements and adds numbers of graduates. The most important intervening variable, however, is the administrative and financial ability of libraries to facilitate the demand-supply equation. This analysis involves the fusion of a wide assortment of data. Some of this information has already been presented in this report; however, we draw upon additional 8Rs survey data and other existing research to answer the demand-supply question.
In addressing each of these elements it is important to first examine historical trends. We begin the analysis, therefore, with a presentation of data depicting the contraction/expansion of librarian staff in 2002.
J.2 Librarian Staff Growth in 2002
Based on the results from the institutional survey, Table J.1 presents the net gain or loss between the number of librarians leaving and the number hired in the year 2002, for the total sample and for each library sector. These data allow us to determine the extent to which organizations have experienced librarian mobility in and out of their libraries, as well as provide an estimate of expansionary (as opposed to replacement) hiring.
Only half of the libraries had at least one librarian depart, or recruited one librarian in 2002. Not surprisingly, non-profit libraries were the least likely (28%) to experience librarian mobility in or out of their organizations in 2002. All CARL and CULC libraries, on the other hand, experienced a departure or hire.
168 SECTION J: Numerical Librarian Demand-Supply Match CANADIAN LIBRARY HUMAN RESOURCE STUDY
For the total sample, the difference between the number of librarians leaving and those being hired was +91, for a 2002 growth rate in the librarian workforce of 3.0 percentage points. As we might expect, the two largest segments (CARL and CULC libraries) together accounted for the vast majority of growth (84%). Only government libraries experienced a contraction in their librarian workforce of 4.5 percent in 2002.
Table J.1 Net Gain/Loss of Librarians1 in Past Year by Library Sector (Institutional Survey; n=288)
Library Sector % Orgs with Librarian Departures or Hires
Numerical Net LibrarianGain/Loss Proportional Librarian
TOTAL SAMPLE 50 +91 +3.0%
TOTAL ACADEMIC 60 +50 +3.8%
CARL 100 +41 +3.7%
Other Academic 43 +9 +4.4%
TOTAL PUBLIC 53 +43 +2.8%
CULC 100 +35 +2.8%
Other Public 41 +8 +2.7%
TOTAL SPECIAL2 34 -2 -1.0%
Government 42 -5 -4.5%
Non-Profit 28 1 +1.2%
Source: 8Rs Canadian Library Human Resource Institutional Survey1 Based on the difference between the number of librarians hired in the past year (between January 1, 2002 and December 31, 2002) and the number of librarians leaving the organization in the past year, which includes an estimate of retiring librarians based on retirements in past 5 years divided by 5.2 For-Profit library results are not presented separately because of insufficient cases reporting; however, they are included in the Total Special results.
The table demonstrates that libraries hired more librarians than they lost (from voluntary or involuntary depar-tures, or retirements). These results indicate overall sector growth in the number of librarians in the Canadian library system. But this growth is occurring disproportionately across sectors; academic libraries grew the most rapidly in 2002 (3.8%), followed by public libraries (2.8%). Non-profit libraries grew at a much smaller rate of 1.2%, while government libraries contracted by 4.5 percentage points. It should be remembered, however, that this small growth represents a snapshot of one year and likely recaptures only part of the librarian shrinkage that occurred over the 1990s. Recently released data from Durand (2004) indicates that between 1991 and 2002, the number of librarian jobs shrank an average of 3.6% each year, equaling a total change of 33% fewer jobs in 2002 than 10 years previously.34 The National Core Library Statistics Program also found that professional librarians comprised a smaller portion of all staff in 1999 than they did in 1994, at 22% in 1999, down from 26% in 1994 (Schrader and Brundin, 2002). Furthermore, Canadian academic research libraries lost almost 12% of their pro-fessional staff between 1994 and 1998 (Wilder, 2000).
The ability of the system to accommodate new librarians should also not be overlooked. From the perspective of the recent librarian graduate looking for work, the results are promising, since it appears that the system is able to accommodate some growth, not solely by hiring to replace departing librarians, but also through the creation of new librarian positions.35 From the point of view of recent graduates or currently-employed librarians looking to change employers, opportunities to find employment are highly dependent upon the library to which they are
34 Since Statistics Canada uses a much broader definition of “librarian” (e.g., it includes non-MLIS graduates), comparisons between our findings and Statistics Canada’s figures must be made with caution.
35 Given the contraction environment that characterized many libraries in the early-to-mid 1990s, these apparent new positions might simply be old positions that have been vacant for some time, which are only now being filled, as hiring freezes are lifted and budgets improved.
SECTION J: Numerical Librarian Demand-Supply Match 169The Future of Human Resources in Canadian Libraries
applying. A logical strategy would be to cast one‘s application net as wide as possible when looking for work in the library sector. This, indeed, already appears to be the case among recent graduates (Table D.10). A review of MLIS graduate surveys reveals that new professionals have had stronger recent success in obtaining work than they did in the early 1990s.36 The likelihood of employment for recent graduates appears to be most promising in the academic and public sectors.
In 2002, public and academic libraries experienced net increases in their numbers of librarians, whereas special libraries experienced a small net loss.
That the sector experienced expansion also has implications for the aging workforce and for the ability to com-pensate for retirements. If the growth continues at a similar rate as observed in 2002, the numerical loss of profes-sionals from retirements should be offset (if retirements occur as is predicted in Section E.4).
Overall growth in the number of librarians in the Canadian library system also has important implications for the age profile of librarians, since new entrants inject a younger age demographic into the system. As new librar-ians enter the system and senior librarians retire, the continuation of an aging librarian demographic is curbed to some extent. But, again, since this growth comes after a decade of staffing cutbacks, expansion will need to continue at a similar (or perhaps even greater) pace for several years before we see a significant limiting effect on aging. Indications are, however, that the majority of libraries feel an increased need for more librarians over the next 5 years (see Table J.2). Insofar as libraries are able to meet this increased need, then we might project a future librarian age profile that is slightly younger than we see currently. This projected future is tenuous at this point, given the many factors that play into libraries’ ability to meet an increased demand. Still, this likelihood is the most plausible for academic libraries since they are experiencing higher numbers of librarian retirements and new recruits, and are more likely to have the resources to fulfill an increased need for librarians.
With these results in mind, we now turn our attention to the recent historical and future numerical demand for librarians.
J.3 Past and Future Numerical Librarian Demand
Within the largest framework, the determination of future librarian demand should consider the social, cultural, and economic environment in Canada. In this light, the position of libraries in the knowledge economy and their utilization of information technology are paramount influences on the future growth, contraction, or stability of libraries’ staffing complements. If libraries become an integral part of the knowledge economy, then demand for the librarian role will increase. For example, Hoffert (1998) argues that librarians will strengthen their roles in the information society by organizing and validating the flood of information and becoming the conduit for users to gather and analyze the information they receive.
From the position of library administrators themselves, it is clear that there has been, and will continue to be, an increased demand for librarians. Table J.2 shows that three-quarters of all libraries in the institutional sample experienced an increased demand for more professional librarians in the past 5 years to some extent. Academic li-braries (especially CARL institutions) were the most likely to indicate such an increase (86%), followed by public (75%) and non-profit (78%) libraries. The much lower librarian demand in government libraries (58%) conforms to the contraction that occurred in this sector in 2002 (Table J.1).
36 For example, McGill reports 96% of 2002 graduates had found employment one year after graduating compared to 82% in 1994. Toronto graduates report similar placement levels; while only 66% of 1996 graduates were working in the field a year after leaving the school, 93% of those from the class of 2000 could make the same statement.
170 SECTION J: Numerical Librarian Demand-Supply Match CANADIAN LIBRARY HUMAN RESOURCE STUDY
Table J.2 Past and Future Demand Increase1 for Professional Librarians by Library Sector
(Institutional Survey; n=276)
Percent reporting increased demand for librarians “to some” or “a great” extent
Library Sector Past 5 Years Next 5 Years
TOTAL 76 77
TOTAL ACADEMIC 86 83
CARL 96 96
Other Academic 81 76
TOTAL PUBLIC 75 77
CULC 77 89
Other Public 75 74
TOTAL SPECIAL2 69 71
Government 58 70
Non-Profit 78 77
Source: 8Rs Canadian Library Human Resource Institutional Survey1 Based on responses of “4” and “5” on a 5-point scale with “1” meaning “not at all” and “5” meaning “to a great extent” to the question: “To what extent has the need for more professional librarians increased in the past 5 years?” and “To what extent will the need for more professional librarians occur at your organization over the next 5 years?” 2 For-Profit library results are not presented separately because of insufficient cases reporting; however, they are included in the Total Special results.
The increase in the librarian workforce in 2002 suggests that many libraries were able to meet their increased demand in this particular year. Furthermore, since most libraries did not experience great difficulty recruiting (as demonstrated in Section D.3), the findings allow us to conclude a fairly good match between supply and demand in recent years. But what of the future?
The same proportion (77%) of libraries also indicated that their demand for librarians will continue to increase over the next 5 years (at least to some extent). As was the case for past demand, academic libraries are significantly more likely to report that their need will continue to increase (96%), but so too are CULC libraries (89%). Though government libraries were less likely to indicate past demand, their predictions of future demand are more in line with other sectors. The results presented in Table J.2, therefore, paint an overall picture of increasing future librarian demand.
The results of the question on the future demand are supported by our in-depth interviews with 17 library di-rectors and administrators. However, while many of these individuals felt they would need more professional librarian positions, they were uncertain about whether their budgets would permit this development. Some re-spondents commented that they would be required to restructure positions and reassign the roles of retiring librarians instead of creating new positions or filling positions made vacant through retirements.
The increased future demand has obvious implications for recruitment. If librarians retire during the same period that they are needed in increasing numbers, further strain on the system may be apparent in terms of having to re-cruit both to replace retiring librarians, as well as to fill newly-created positions. The extent to which recruitment activity will need to be enhanced, however, depends upon whether libraries will be in a position to create new positions to meet their increased demand, with funding being the most influential factor. Whether the supply of librarians will be able to meet the demand is the second key feature of this analysis that is examined below.
SECTION J: Numerical Librarian Demand-Supply Match 171The Future of Human Resources in Canadian Libraries
J.4 Can Supply Meet Increased Demand?
Having concluded that the demand for librarians will increase in the near future, the pivotal question to be ad-dressed is whether the supply of professional librarians will be sufficient to meet this demand. We begin, first, by estimating the future librarian supply.
The two most important considerations in estimating the future numerical supply of librarians are the numbers departing the sector through retirements and the influx of new entrants based on graduation data. While depar-tures for non-retirement reasons may also occur, this is not a strong likelihood considering the low levels of con-cern regarding librarian retention, itself evidenced by the preponderance of individuals who have remained at a single institution for most of their careers. Similarly, the contributing effect of immigrant librarians on the supply does not bear very much weight on the equation given the small proportion of immigrant librarians in our indi-vidual sample (2%). The absence of these numbers is a limitation of the librarian supply calculations; however, it is assumed that the loss of librarians due to non-retirement reasons could be offset from the gain of immigrant librarians, resulting in a negligible influence on librarian supply. But, since we know that a certain portion of new MLIS graduates emigrate to other countries (mostly, the United States), and a certain portion find employment outside of the traditional sector, these numbers are removed from our estimation of the number of graduates.
The short-term professional librarian demand-supply match does not suggest a crisis situation; however, all other factors bearing equal weight on the field, the longer-term picture suggests a librarian shortage.
Table J.3 captures this formula and provides an estimate of the librarian supply over the next 5 and 10 years. The formula starts with an estimate of the current librarian workforce, plus an estimation of graduates who will be working in the Canadian traditional library sector, less an estimation of the number of retirements. Beginning with a current librarian workforce of 11,700, adding the estimated 1,600 MLIS graduates who will enter the li-brary sector within the next 5 years, and subtracting the estimated 1,870 librarians who will retire during this same time period, we arrive at a final librarian workforce of 11,430 by 2009. This represents 98% of the original librarian workforce, indicating that there will be relative stability in the supply of librarians in 5 years.
Table J.3 Predicted Future Librarian Supply
Time Period
Current Librarian
Workforce1
New Librarian Entrants2
Departures from Retirement3
Future Librarian Workforce
Future Librarians as % of Current
Librarians
In 5 years (2009) 11,700 +1,600 - 1,870 11,430 98%
In 10 years (2014) 11,700 + 3,250 - 4,560 10,390 89%
1 The estimated current number of librarians is based on the 9,000 FTE estimates used to predict retirements, multiplied by a conversion factor of 1.3 to provide number of librarians from FTE. The 9,000 FTE estimate is based on a number of data extrapolations. First, when extrapolating from our own institutional survey, estimates are 8,500 FTE librarians, not including school librarians. The National Core Library Statistics program arrives at a similar estimate of 8,360 FTE librarians, not including school librarians, which is equivalent to about 20% of all FTE staff. They further estimate 7,800 FTE total staff in school libraries. Our data suggest that professional librarians, as a proportion of library school staff, is decreasing (e.g. there are now roughly 4 paraprofessionals for every 1 professional librarian working in school libraries). We, therefore, add 10% of the school total staff of 7,800 FTE to the 8,500 FTE to arrive at a rounded figure of 9,000 FTE librarians working in Canada. 2 Based on a compilation of graduate survey results from SLIS programs, we estimate a total of 433 graduates per year (or an average of 62 graduates per school) which equates to 2,165 graduates over 5 years and 4,300 over the next 10 years. The graduate survey results also provide an indication of how many students found work in the U.S. and in other non-traditional library sectors. Based on these results, we c�= 3,250). 3 Retirement figures are from Table E.7 and are based on a 5-year retirement rate of 16% of the current labour force and a 10-year rate of 39%.
With the greatest proportion of retirements predicted to occur between the next 5 and 10 years (i.e., between 2009 and 2014), the 10-year scenario provided in Table J.3 shows the librarian workforce at only 89% of what it is currently. Hence, while the short-term supply of librarians is predicted to be very similar to what it is now, the long-term picture is more troubling. This is perhaps especially so in light of the fact that we do not have any substantive reason to believe that the demand for librarians will decrease to match the reduction in supply. As we concluded in the prior section, there is strong reason to believe that, in fact, the librarian demand will increase.
172 SECTION J: Numerical Librarian Demand-Supply Match CANADIAN LIBRARY HUMAN RESOURCE STUDY
With the supply decreasing at the same time as demand increases, the future situation for the Canadian library sector is one of a librarian shortage.
This conclusion is made, however, with several caveats. First, while we are more confident about the short term prediction of the number of librarians, the 10-year prediction is less reliable, simply because the chances that the influence of any one variable will change increases over time. As we have already demonstrated in Section E on retirements, the concentrated demographic of librarians in the older age categories, combined with the wide range of possible ages that librarians will actually retire, means that the estimated number of retirements could easily be lower or higher than we have predicted. The capacity of library schools could also quite easily change within the next 10 years. Also important to consider is the changing environment of the library sector, which continues to restructure itself to accommodate new technologies, diverse service demands, and the retirements themselves.
Furthermore, though we have strong evidence to suggest that libraries believe their demand for librarians will increase in the future, another matter altogether is whether or not they have the financial resources to create these new positions. With six in ten libraries citing “limited budgets” as a barrier to recruitment, it is not likely that most libraries will be in a position to create new positions as needed. Rather, it may be that positions are restruc-tured to accommodate increased demand. However, careful consideration should be placed on the workloads assigned to individual librarians that result from restructuring since over half of professional librarians report that they are already carrying unmanageable workloads (Table I.18).
Lastly, examining libraries’ experiences in the recent past with respect to the size of their librarian workforce helps to contextualize the level of concern that is appropriate to place on a reduction in the librarian workforce. Largely due to budget cuts and restructuring, the librarian workforce shrunk during the 1990s by up to one-third, according to at least one estimate (Nault, 2004). This is much higher than our prediction of a 11% reduction over the next 10 years (Table J.3). We also know that a wave of retirements has already occurred, resulting in the departure of about one in ten librarians between 1997 and 2002 (Table E.1). Under these conditions, however, most libraries appeared able to cope with reductions in their librarian workforce as indicated by their relatively low levels of difficulty recruiting. Although they have experienced greater problems replacing the competencies held by retiring librarians, the problems are not yet extensive nor widespread. Again, however, the restructuring of positions to accommodate the workforce reduction during the 1990s may have resulted in undue workloads and stress (Section I.3 III).
J.5 Paraprofessional Demand-Supply Projections
As is the case for professional librarians, determination of the future demand for paraprofessionals must be couched in the larger information demands arising from the social, economic and cultural Canadian context. The future position of libraries in the knowledge economy bears heavily on the future demand for paraprofes-sionals just as it does for professionals, and the library administrators in our survey reported that the past and future demand increase for paraprofessional staff was and will be similar to that of professional librarians. Table J.4, in fact, demonstrates a slightly higher demand for paraprofessionals than for professionals. While 76% of respondents reported an increased demand for librarians in the past 5 years (Table J.2), 79% reported similarly with respect to paraprofessionals. And while 77% of institutional respondents predicted the librarian demand to continue increasing over the next 5 years, 81% felt that the paraprofessional demand would increase during this future time frame.
SECTION J: Numerical Librarian Demand-Supply Match 173The Future of Human Resources in Canadian Libraries
Table J.4 Past and Future Demand Increase1 for Paraprofessional Staff by Library Sector
(Institutional Survey; n=350)
Percent Reporting Increased Demand for Paraprofessionals “To Some” or “To A Great” Extent
Library Sector Past 5 Years Next 5 years
TOTAL 79 81
TOTAL ACADEMIC 83 87
CARL 81 81
Other Academic 84 89
TOTAL PUBLIC 80 83
CULC 89 85
Other Public 79 83
TOTAL SPECIAL2 75 72
Government 71 72
Non-Profit 82 77
Source: 8Rs Canadian Library Human Resource Institutional Survey1 Bases on responses “3,” “4,” and “5” on a 5-point scale with “1” meaning “not at all” and “5” meaning “to a great extent” to the question asking the extent to which “the need for more professional librarians has increased in the past 5 years” and the extent to which “the need for more professional librarians will occur at your organization over the next 5 years.”2 For-Profit library results are not presented separately because of insufficient cases reporting; however, they are included in the Total Special results.
Sector patterns, however, vary somewhat between the librarian and paraprofessional demand estimations. While CARL libraries are more likely to predict a future increase in librarians (Table J.2), they are less likely to predict a future increase in their need for paraprofessionals (96% compared to 81%). Non-CARL academic libraries and both types of public libraries are the most likely to indicate future increased demand for paraprofessionals.
Some of the sector variation may reflect differences in the financial ability to respond to changing needs. Howarth (1998), for instance, maintains a financial impetus for shifting roles between librarians and paraprofessionals, but also states that this financial impetus acts as justification for hiring paraprofessionals over professionals. The lower wages of paraprofessionals presents an attractive scenario for administrators, resulting in a shift in the proportions of librarians and paraprofessionals within institutions. Hence, it may be that smaller academic and public libraries have added to their paraprofessional cadre at the expense of their professional one and predict the need to continue this staffing scenario.
Nonetheless, the results in Table J.4 strongly indicated a future increased demand for paraprofessionals across all library sectors of the nation. But, can the estimated future supply meet this increased demand?
Because of the varying educational qualifications of library assistants, associates, and aides, we are not able to provide estimates of the number of new entrants into these occupational groups. With a known number of library technical schools and their related graduate information, however, projected future library technician supply can be calculated.
As shown in Table J.5, the predicted future library technician supply is remarkably similar to the future profes-sional librarian supply. In both instances, the 5-year (2009) estimate is virtually the same as the current work-force, but the 10-year (2014) estimate is 89% of the current workforce.
Once again, therefore, the short-term future picture does not depart significantly from what the library system is currently dealing. By 2014, however, the Canadian library sector is predicted to be facing a library technician shortage.
174 SECTION J: Numerical Librarian Demand-Supply Match CANADIAN LIBRARY HUMAN RESOURCE STUDY
Future Library Technicians as % of Current Technicians
In 5 years (2009) 10,360 1,200 - 1,350 10,210 99%
In 10 years (2014) 10,360 2,400 - 3,500 9,260 89%
The estimated current number of library technicians is derived from the National Core Library Statistical Program estimates of 7,220 FTE library technicians (not including school staff) in 1991 plus a rough estimate of 750 school library technicians (only 3 in 10 school paraprofessionals are library technicians) multiplied by a conversion factor of 1.3 to arrive at the number of library technicians.2 Based on a compilation of graduate survey results from library technician programs, we estimate an average of 320 graduates per year over the past 5 years which equates to 1,600 graduates over 5 years and 3,200 over the next 10 years.�U.S. and in other non-traditional library sectors. We, therefore, employ the same 75% figure used to estimate the number of MLIS graduates destined to work in the Canadian traditional sector libraries (1600 X 75% = 1,200; 3200 X 75% = 2,400). 3 Retirement figures are based on a 5-year retirement rate of 13% of the current library technician workforce and a 10-year rate of 34%.
The same caveats discussed in the case of professional librarians apply to the predictions outlined in Table J.5. For instance, the longer-term estimates are extremely vulnerable to a change in any one variable, with retirement rates most notable among these. In addition, the predictions only apply to library technicians and we have no data to help predict how the supply of library assistants, associates, and aides will play out in the future. With library technicians comprising only 4 in 10 paraprofessionals, a large piece of the supply-equation is missing in this analysis.
Nonetheless, the combined 10-year future shortages of professional librarians and library technicians signal a situation that warrants attention by all members of the Canadian library community. Given the time and fore-warning provided here, however, the future shortage is not so much a looming crisis as it is a challenge that can be managed with careful human resource planning by employers and other stakeholders in the library community.
J.6 Strategic Human Resource Planning Implications
• Libraries have an expressed increased future demand for librarians and paraprofessionals. Whether they can meet this demand by expanding their workforce depends in large part on the supply of librarians and paraprofessionals, but also on budgets and the ability to recruit.
• Above all, libraries need to develop a sound awareness of how their staffing complement is functioning, and to consider how their institution fits into the larger Canadian context of demand and supply. An un-derstanding of how potential applicants are attracted to or deterred from their library and/or sector will assist with recruitment on an institutional level.
• For Canadian libraries as a whole, the short-term (5-year) prediction does not depart significantly from what has already occurred with respect to loss of librarians through retirements. Although 11% of the librarian workforce retired between 1997 and 2002, most libraries did not experience great difficulty in replacing retirement losses.
• The long-term (10-year) prediction is more troubling. But since it is a long-term prediction, it means that library stakeholders have more time to prepare for the shortage. Some of the suggestions are to continue to:
• Look to see how recruitment to the profession can be improved upon. A coalition of libraries, library associations and library schools must act to promote both a current view and a vision for the profes-sion – one that expresses the potential of librarianship as a career of choice and is attractive enough to capture students of high quality and commitment to the practice of a dynamic and changing profession. In looking to improve recruitment, the need for diversity within the profession must be of paramount concern.
SECTION J: Numerical Librarian Demand-Supply Match 175The Future of Human Resources in Canadian Libraries
• Consider developing recruitment strategies for paraprofessional staff, with the understanding that de-mand for these workers will continue to grow at a similar rate to that of librarians, and that the future supply may also be dwindling. This can be a point of potential collaboration for librarian and library technician associations, educators, and individuals.
• Look at current paraprofessional corps as possible pool of future librarians. This is not only a mat-ter of encouraging paraprofessional staff to consider a library degree but also of working to reduce the identified barriers to obtaining the MLIS degree. Libraries, library associations and library schools need to work in partnership to develop and promote a model of professional education that is both of high quality and easily accessible. On-line programming and distance education programs are obvious directions to explore. Financial support whether through scholarships and bursaries or “earn as you learn” employer-funded incentives will be critical.
• Look at increasing the number of spaces in library schools (both MLIS and library technician programs), or increasing the number of schools themselves. This will involve intensive lobbying of post-secondary institutions and competition for government funding. Again, libraries and library associations must act in coalition with library schools to present the case for the profession.
• Look at immigrants as possible pool of future librarians. This speaks to the question of diversity in li-braries but also to how libraries will be prepared to assess and recognize library credentials from other countries. Library associations must also to play a role in both the assessment of credentials and by ascertaining how they might fill any identified educational “gaps”. Similarly, library schools could play a role in appropriate educational upgrading.
• Look at defining roles for “other” professionals within libraries. Many libraries now utilize the skills of other professionals, whether accountants, human resource professionals or training officers. These oth-er professional groups need to see libraries as a desirable environment for exercising their professional skills and abilities. As noted, management skills are necessary competencies for librarians. However, other professionals can take complementary roles in libraries, adding to the depth of expertise avail-able.
• In recognizing that the creation of new professional librarian positions is not always possible, look at reengineering processes and functions to ensure that “meaningless” work is eliminated and all library staff are employing their education and skills set at appropriate levels. Librarians and paraprofessional staff as with all staff should be assured that they will be able to employ their skills and abilities to the fullest possible extent.
• Constraints of budget and size will always exist. Therefore, libraries should also look to sharing of staffing resources through consortia and other local arrangements where two or more libraries might realize benefits and share costs. Sharing of resources has been the hallmark of the library profession for many years; this thinking needs to extend to the sharing of human resources - whether one webmaster for a college/university library partnership, one children’s literature specialist for two regional library systems, or one training officer for a consortium of libraries.
SECTION K: Competency Demand-Supply Match 177The Future of Human Resources in Canadian Libraries
S E C T I O N K
Match Between Organizational Job Function Demand and Individual Staff
Supply of Skills, Abilities, Talents, Interests
K.1 Introduction
Librarianship is premised on and defined by the role, value and structure of information in the society in which it is practiced. It is no surprise, then, that stakeholders in the profession want to know how our present infor-
mation society will impact the restructuring of libraries and the roles of librarians. As libraries become increas-ingly understood as complex organizations in the marketplace, competing for the attention of the consumer and for the right to broker information, how will the role of the professional librarian change, if at all?
For many of the administrators participating in our telephone interviews, role changes were discussed in the context of a perceived present shift in the function of the library in general, from a closed organization serving a small cluster of functions to a more permeable one embedded in a larger community. These changes are largely attributed to the information age, which puts the library in a position of influence and responsibility within the larger community.
Findings from the Harris and Marshall (1998) survey of 7 directors and 182 librarians (including front-line professionals, middle management, and senior managers) in major public and academic libraries, suggest that librarians are increasingly expected to perform generalist management roles to the diminishment of their core skill sets that have traditionally defined the profession. The skills and decision-making responsibilities that were once the domain of professional librarians, it is argued, have been re-deployed down the staff hierarchy to para-professionals.
178 SECTION K: Competency Demand-Supply Match CANADIAN LIBRARY HUMAN RESOURCE STUDY
Through the analysis of job descriptions and postings of research libraries in the United States and Canada, the Association of Research Libraries (Schwartz, 1997) sought to examine changes during the previous decade with respect to the roles of librarians and paraprofessionals. The study revealed clear signs of increasing emphasis on new technologies (web developer, instructional technologist, digital projects technologist, etc.). It was also noted that most of the posted positions were redefined in order to fit new organizational structures in the institutions. The study concludes that this demonstrates a trend away from traditional library skills and education in research libraries.
This section of the report examines changing librarian role demand and an assessment of the supply of compe-tencies required to fill these demand. Results from all surveys, interviews, and focus group sessions highlight the strong need of libraries to have their staff perform management and leadership roles. Throughout the report, we have also made reference to many findings suggesting that this need is not being met as well as it could. We there-fore provide a full analytical assessment of how well Canadian libraries are meeting their managerial competency needs by drawing together results that have already been presented in a number of different sections, and linking these to findings that have not yet been presented. The technology competencies needed of librarians have also been indicated throughout the report, and we provide a similar analysis of how well these needs are being met.
Both of these analyses begin by establishing the importance of the competencies as indicated by organizations’ needs, followed by a series of indicators showing how well the supply meets this demand (presently and predicted for the future). We present an examination of the shifting role responsibilities of professional librarians versus paraprofessionals, and conclude the section with an analysis of the effects of role change on job demands and on the job attitudes of library staff.
Before these assessments are made, however, we begin with what libraries view as the most important drivers of librarian role change and a brief look at libraries’ need for generalist versus specialist skills.
K.2 Drivers of Librarian Role Change
We begin the section on organizational change with the results of a question asking institutional respondents to indicate which of 11 possible organizational changes contributed the most to shifting librarian roles (Table K.1). Increased utilization of information technology clearly stands out as the most influential determinant of librarian role change for all library sectors (87%). Just over half (51%) of the sample also viewed re-engineering as a major contributor to role change, followed by functional area integration (38%). A smaller proportion indicated that downsizing (28%) or increased centralization (17%) had the greatest impact on librarian role change.
According to most library administrators, the changing roles of professional librarians have been primarily, but not exclusively, driven by the introduction of new information technologies.
Though CULC libraries were somewhat less likely to indicate increased use of information technology as an important contributor to librarian role change, the vast majority of libraries from the remaining sectors felt this way. CARL libraries were most likely of all sectors to report that reengineering (65%) and greater integration of different functional areas (62%) contributed to role change. A somewhat larger proportion of CULC libraries also indicated functional integration (52%) was a driver of librarian role change.
SECTION K: Competency Demand-Supply Match 179The Future of Human Resources in Canadian Libraries
Table K.1 Top 5 Contributors to Changing Librarian Roles1 by Library Sector (Institutional Survey; n=278)
Percent
Library SectorIncreased Use of IT
Re-engineering
Functional Area Integration Downsizing
Increased Centralization
TOTAL 87 51 38 28 17
TOTAL ACADEMIC 85 51 51 38 11
CARL 88 65 62 35 12
Other Academic 83 44 46 39 11
TOTAL PUBLIC 85 51 32 53 17
CULC 72 44 52 20 32
Other Public 89 53 27 53 12
TOTAL SPECIAL2 91 52 33 30 25
Government 88 53 34 34 9
Non-Profit 97 59 32 24 29
Source: 8Rs Canadian Library Human Resource Institutional Survey1 Based on responses to the question asking respondents to indicate which three organizational changes (out of a possible 11) “contributed the greatest amount of change in the roles of professional librarians at your organization?”2 For-Profit library results are not presented separately because of insufficient cases reporting; however, they are included in the Total Special results.
K.3 Librarians as Generalists and Specialists
As indicated by the results in Table K.1, the introduction of new information technologies has triggered the most fundamental change to the roles of professional librarians, but a variety of restructuring initiatives have also influ-enced this change. We have already touched on several of these role changes throughout the report; these include the need for librarians to perform an ever-widening array of tasks, to increasingly perform management and leadership roles, and to increasingly utilize information technology. The match between the demand for and sup-ply of managerial/leadership and technology skills are examined in detail in Sections K.4 and K.5, respectively. We begin the investigation of librarian role change, however, with a look at the somewhat paradoxical need for librarians to be both generalists and specialists.
Just over four in five (83%) institutional respondents reported that it is important that job candidates possess generalist skills, with 26% of these indicating that these skills were difficult to fulfill when hiring. Furthermore, seven in ten mid-career and senior librarians agreed that they are currently required to perform a “wider variety of tasks” compared to 5 years ago (results not shown in table or figure).
Table K.1 below further and resoundingly demonstrates the importance that libraries place on librarians being able to work in a number of different areas. More than nine in ten libraries indicated both that they had experi-enced an increased need for librarians to perform a wider variety of tasks in the past 5 years, and that this need would continue to increase in the future. Though a slightly smaller proportion, a solid majority (88%) still re-ported that they had an increased need for librarians to perform more specialized tasks over the past 5 years and that this need would continue to increase over the next 5 years. These findings suggest a strong shift in librarian roles has occurred recently, and that just as fundamental a shift in roles is predicted to occur in the near future.
180 SECTION K: Competency Demand-Supply Match CANADIAN LIBRARY HUMAN RESOURCE STUDY
Table K.2 Past and Future Demand Increase for Generalist and Specialist Librarians by Library Sector
(Institutional Survey; n=275)
Percent reporting increased demand for Roles “to some” or “a great” extent
Increased Need for Wider Variety of Tasks1 Increased Need for Specialists2
Library SectorOver Past 5 years
(1999-2003)Over Next 5 years
(2003-2008)Over Past 5 years
(1999-2003)Over Next 5 years
(2003-2008)
TOTAL 93 94 88 88
TOTAL ACADEMIC 95 94 89 90
CARL 100 100 92 96
Other Academic 93 91 87 87
TOTAL PUBLIC 93 95 86 87
CULC 96 100 85 88
Other Public 92 93 86 87
TOTAL SPECIAL3 90 91 89 89
Government 85 82 84 85
Non-Profit 94 97 89 89
Source: 8Rs Canadian Library Human Resource Institutional Survey1 Based on responses “3,” “4,” and “5” on a 5-point scale with “1” meaning “not at all” and “5” meaning “to a great extent” to the question asking the extent to which “the need for more professional librarians to perform a wider variety of tasks has increased in the past 5 years” and the extent to which “the need for more professional librarians to perform a wider variety of tasks will increase over the next 5 years.” 2 Based on responses “3,” “4,” and “5” on a 5-point scale with “1” meaning “not at all” and “5” meaning “to a great extent” to the question asking the extent to which “the need for more professional librarians to perform a more specialized functions has increased in the past 5 years” and the extent to which “the need for more professional librarians to perform more specialized functions will increase over the next 5 years.”3 For-Profit library results are not presented separately because of insufficient cases reporting; however, they are included in the Total Special results.
An obvious question resulting from these findings is how librarians can be expected to perform both generalist and specialist roles. An historical review of librarian role expectations suggests that the one-time need for librar-ians to perform in one role or work in a specialized area for their entire careers has been largely replaced with the need for them to be capable of working in a number of different roles or of performing a number of tasks outside their area of specialization. This does not mean that specialists are not still required. Librarians who can function as language specialists, or who possess knowledge about maps and other non-book formats, rare books and archives, or data and GIS, are still identified as necessary; however, the librarians who possess a specialized knowledge base are also required to work in other areas of the library. The impetus for the “multi-tasking” librar-ian likely comes from the downsizing and budget restraints typifying the 1990s, and from the general need for libraries to do more with less. In many smaller libraries, of course, librarians have always filled a variety of roles. Still, it is interesting that the vast majority of the typically smaller public and special libraries also indicated that their need for generalists and specialists increased in the past and that it is projected to increase in the future (Table K.2).
Librarians increasingly need to be generalists, specialists, and information-technology savvy and to perform management and leadership roles. The supply of these competencies is better matched to the demand with respect to technology and leadership than it is to managing and supervising.
SECTION K: Competency Demand-Supply Match 181The Future of Human Resources in Canadian Libraries
K.4 Meeting the Management, Leadership, and Business Skill Demands of Libraries
I Indicators of Demand for Management, Leadership, and Business SkillsMany of the findings in this report imply that librarians are increasingly required to assume managerial, business, and leadership roles. For example, we know that three of every five librarians work in management positions (Ta-ble C.2). Further, 71% of library administrators reported management skills as an important competency to look for when hiring, and 76% felt the same way about leadership potential. Tables K.3 and K.4 further demonstrate that managerial functions, leadership capabilities, and business functions are increasingly required of librarians and that these competencies will continue to be in greater demand in the future (see Appendix Table K.1 for a se-lection of specific management and leadership functions currently being performed by professional librarians).
Beginning with the institutional perspective provided in Table K.3, it is overwhelmingly clear that over the past 5 years, librarians have been required to perform more managerial functions and to assume more leadership roles; further, over the next 5 years these role demands will continue to increase. These findings can be applied to all sectors, but especially to CARL libraries and perhaps slightly less so to government libraries.
Table K.3 Indicators of Demand for Management and Leadership Skills by Library Sector
(Institutional Survey; n=274)
Percent of Libraries Reporting Increased Need for Librarians to . . .
Perform More Managerial Functions1 Assume More of a Leadership Role2
Library Sector In Past 5 Years Over Next 5 Years In Past 5 Years Over Next 5 Years
TOTAL 86 85 89 88
TOTAL ACADEMIC 89 85 90 94
CARL 100 96 100 100
Other Academic 84 80 86 91
TOTAL PUBLIC 86 86 89 88
CULC 89 92 92 96
Other Public 85 84 87 85
TOTAL SPECIAL3 83 82 89 85
Government 75 73 88 79
Non-Profit 89 86 92 86
Source: 8Rs Canadian Library Human Resource Institutional Survey1 Based on responses “3,” “4,” and “5” on a 5-point scale with “1” meaning “not at all” and “5” meaning “to a great extent” to the question asking the extent to which “the need for professional librarians to perform more managerial functions has increased in the past 5 years” and the extent to which “the need for professional librarians to perform more managerial functions will occur at your organization over the next 5 years.” 2 Based on responses “3,” “4,” and “5” on a 5-point scale with “1” meaning “not at all” and “5” meaning “to a great extent” to the question asking the extent to which “the need for professional librarians to perform more leadership roles has increased in the past 5 years” and the extent to which “the need for professional librarians to perform more leadership roles will occur at your organization over the next 5 years.” 3 For-Profit library results are not presented separately because of insufficient cases reporting; however, they are included in the Total Special results.
Though less evident than the institutional results, the majority of mid-career and senior librarians in all sectors agreed that they are currently performing more management (56%) and leadership roles (60%) than they did 5 years ago (Table K.4). Sectoral differences are not as apparent as they are in Table K.3, and CARL librarians them-selves did not support Table K.3’s findings that CARL librarians are the most likely to perform more managerial and leadership functions. That the individual survey results are lower than those of the institutional survey is likely due to differences in question phrasing, as well as the scale used to measure responses, rather than a true difference in perceptions between the two groups. We have no explanation for why the sector patterns differ be-tween the two tables, however.
182 SECTION K: Competency Demand-Supply Match CANADIAN LIBRARY HUMAN RESOURCE STUDY
Table K.4 also provides the proportion of mid-career and senior librarians agreeing that they currently perform more business functions than they did 5 years ago. Business functions generally include such skills as the ability to read a financial statement, prepare a business case, or develop a prospectus for fund-raising or a marketing plan, for example. Not quite as many of these librarians (38%) responded in agreement that they perform more business functions, though librarians working in non-CULC public libraries and for-profit libraries were the most likely to report that they are currently performing more of these functions.
Table K.4 Indicators of Demand for Management, Leadership, and Business Skills1 by Library Sector
(Mid-Career and Senior Librarians; Individual Survey; n=1,488)
Percent of Librarians “Agreeing” “Compared to 5 Years Ago My Job Currently Requires Me to Perform More…”
Library SectorManagerial Functions
Of a Leadership Role
Business
Functions
TOTAL 56 60 38
TOTAL ACADEMIC 53 57 34
CARL 51 54 32
Other Academic 57 61 38
TOTAL PUBLIC 59 63 39
CULC 58 61 36
Other Public 61 66 48
TOTAL SPECIAL 58 58 43
Government 56 55 41
Non-Profit 60 61 44
For-Profit 58 65 50
SCHOOL 58 78 24
Source: 8Rs Canadian Library Human Resource Individual Survey1 Based on responses “4” and “5” on a 5-point scale with “1” meaning “strongly disagree” and “5” meaning “strongly agree” asking the extent to which librarians are currently required to perform more of these tasks, compared to 5 years ago.
II Can Supply of Management, Leadership, and Business Skills Meet Demand?Having fully established that most Canadian libraries increasingly require librarians to perform management, leadership and business roles, we now examine the extent to which the supply of these skills meets the demand. Most of the relevant indicators provided elsewhere in the report suggest that at least some libraries are experienc-ing difficulty meeting their managerial and leadership requirements, and that the education opportunities in this area should be examined. (see Appendix Tables K.2a through K.2d which consolidate these findings).
To summarize the earlier findings; in Section D, we noted that the possession of managerial skills and leadership potential are two of the most important and difficult to fulfill competencies (Table D.3). Section E demonstrated that leadership skills were more difficult to replace than general skills and knowledge, and institutions express even greater concern over the ability to replace leadership skills in the future given the current pool. Assessments of MLIS education in Section G also showed that both institutions and recent librarian graduates felt more em-phasis should be placed on these management-type skills in the curriculum. And in Section H, the provision of training in these skills at the organizational level is somewhat better, but respondents indicated that leadership training is not provided as frequently as it should be, since librarians themselves feel that for them to move into higher level positions they especially need training in management, leadership, and business skills.
SECTION K: Competency Demand-Supply Match 183The Future of Human Resources in Canadian Libraries
Another aspect of assessing the fit between the demand for managerial, leadership, and business skills and their supply is librarians’ levels of interest in both performing these functions, and in training for them. Table K.5 presents the percentage of professional librarians agreeing that it is important for them to have a job that allows them to perform these roles, and Table K.6 the proportion interested in participating in management and busi-ness skills training.
Beginning with Table K.5, more than four in ten (44%) librarians indicated that it is important that they are able to manage a service or department, while slightly fewer (36%) provided the same response for supervising others. Greater interest, however, was expressed in performing leadership roles in general (62%), in motivating others (64%), and in seeking out new project opportunities (74%). Hence, professional librarians are more interested in performing various leadership roles than they are in managing and supervising. According to these data, we can conclude that the fit between the demand for leaders and the interest in performing in a leadership capacity is better than the demand-interest fit for managing.
Table K.5 also shows that public librarians are more interested in managing and supervising than are other librar-ians, suggesting a better demand-supply match in this sector. The demand-supply fit within CARL libraries is not as positive; virtually all institutional respondents reported a greater past and future need for managers (Table K.4), but only one-third of librarians indicated that it is important to have a job allowing them to manage and supervise. With respect to leadership roles in CARL libraries, however, the fit between demand and interest is much better. The somewhat lower demand within government libraries shown in Table K.4 also corresponds to the lower interest in performing leadership type roles and functions that are displayed in Table K.5.
Table K.5 Supply Indicators of Librarian Interest in Performing Management and Leadership Roles1 by Library Sector
(Individual Survey; n=2,000)
Percent Reporting “It is Important to... have a job that allows me to . . . “
Leadership Role Motivate OthersSeek Out New Project
Opportunities
TOTAL 44 36 62 64 74
TOTAL ACADEMIC 37 32 60 63 77
CARL 34 32 59 59 76
Other Academic 43 34 63 70 79
TOTAL PUBLIC 52 44 67 68 73
CULC 51 44 66 65 71
Other Public 53 43 67 76 78
TOTAL SPECIAL 41 30 59 55 72
Government 37 28 54 52 68
Non-Profit 45 35 60 58 77
For-Profit 53 33 77 60 77
SCHOOL 49 18 58 79 79
Source: 8Rs Canadian Library Human Resource Individual Survey1 Based on “4” and “5” responses on a 5-point scale with “1” meaning “strongly disagree” and “5” meaning “strongly agree” to the question asking to what extent librarians agreed that it is important that their job includes these elements.
The results in Table K.6 are more promising in terms of librarians’ interest in management training. While only 44% expressed an interest in managing a service or department and 36% in supervising others (Table K.5), fully six in ten would like to participate in management skills training. The findings suggest that while the managerial
184 SECTION K: Competency Demand-Supply Match CANADIAN LIBRARY HUMAN RESOURCE STUDY
function does not garner a high level of interest among most librarians, they may recognize the benefit from more training in this area.
As for business skills training, a significantly smaller proportion (45%) reported that they are interested in par-ticipating in training for this specific area of management. Since we do not have indicators that measure the need for business skills nor the actual performance of business-related tasks, these lower results may simply reflect the fact that fewer librarians are performing business functions, and therefore feel they do not require business-re-lated training. This conclusion, however, does not appear to apply to librarians working in for-profit libraries, 66% of whom are interested in such training.
Table K.6 Supply Indicators of Librarian Interest in Participating in Management and Business Skills Training1 by Library Sector
(Individual Survey; n=1,910)
Percent Agreeing “I am Interested in Participating in…”
Library Sector Management Skills Training Business Skills Training
TOTAL 60 45
TOTAL ACADEMIC 56 38
CARL 55 37
Other Academic 57 40
TOTAL PUBLIC 64 49
CULC 62 49
Other Public 70 50
TOTAL SPECIAL 60 50
Government 59 48
Non-Profit 63 48
For-Profit 64 66
SCHOOL 39 26
Source: 8Rs Canadian Library Human Resource Individual Survey1 Based on responses on a 5-point scale with “1” meaning “strongly disagree” and “5” meaning “strongly agree” to the question asking to what extent that they are interested in participating in these types of skill training.
Again, however, we see public librarians asserting a somewhat higher level of interest in management and busi-ness skills training, whereas CARL librarians were less likely to express this interest. Though we have no indica-tion of the demand for these skills within school libraries, the results in Tables K.5 and K.6 indicate that librarians in this sector are more interested in leadership than they are in managing or in performing business functions.
The need for libraries to cultivate librarians’ management, leadership, and business skills is driven by changes in the roles of libraries; however, institutions recognize added pressure to do so by virtue of the fact that there will be a deficit in these skills as senior staff retire. The human resource planning implication of this is that libraries should consider grooming librarians soon after they are hired. With this in mind, we now look at the interest in performing these roles and participating in training for recent librarian entrants, mid-career librarians, and senior librarians. In doing so, we focus on the interests of recent librarian entrants insofar as they represent the future situation of the librarian workforce.
Table K.7 presents the percentage of librarians agreeing that it is important that their jobs include a managerial, supervisory, or leadership role, and that they are interested in participating in this training, shown for each of the three career stages. Though the interest levels are generally higher among librarians who have been in their careers longer than 5 years, in general, career stage differences are not very large. Hence, although interest in per-forming managerial tasks among all librarians is not matched well with libraries’ demand for these functions, an
SECTION K: Competency Demand-Supply Match 185The Future of Human Resources in Canadian Libraries
assessment of the fit for recent librarians is no worse considering that many of these new entrants (61% of whom are currently in non-management positions) are at the beginning of their careers, and not yet ready to assume the challenges associated with managing. Moreover, as we noted in Section F on career aspirations, half of recent li-brarian entrants would like to see themselves working in a management position in 10 years from now. The future prospects for libraries are, therefore, perhaps not as alarming as the short-term data suggest.
A bit more disconcerting, however, are the interest levels among mid-career and senior librarians who comprise 80% of the librarian workforce. Close to 7 in 10 senior librarians are currently working as supervisors or manag-ers, but less than half are interested in managing a service or department, and only 38% interested in supervising others in their jobs. The findings for mid-career librarians are not much better; 60% are currently working in a managerial capacity, but only 42% feel it is important in their jobs to be able to manage a department or service, and even fewer (36%) felt this way with respect to supervising others.
With respect to leadership, the results are more positive for all career stages. New and mid-career librarians make up a significant proportion of those interested in jobs that allow them to seek out new project opportunities. These results suggest a good fit for libraries, which may allow them to fulfill their leadership demands in the near future, as mid-career staff assume the responsibilities of retiring senior librarians.
Table K.7 also demonstrates that recent librarian entrants are the most interested in participating in management and business skills training. Though this likely reflects the fact that they are most in need of these types of train-ing, we should not ignore the fact that the interest is still apparent.
Table K.7 Supply Indicators of Librarian Interest in Performing and Participating in Training for Management, Leadership and Business by Career Stage1
(Individual Survey; n=1,910)
Percent “Agreeing”
Supply Indicators TOTALRecent Librarian
EntrantsMid-Career Librarians
Senior Librarians
“It is important to me to have a job that allows me to…”
Manage a service/department 44 36 42 48
Supervise others 36 34 36 38
Perform a leadership role 62 57 62 65
Motivate others 56 51 52 60
Seek out new project opportunities 74 76 79 71
“I am interested in participating in…”
Management skills training 60 73 66 52
Business skills training 45 54 49 39
Source: 8Rs Canadian Library Human Resource Individual Survey1 Recent Professional Librarian Entrants are individuals who have been working as a professional librarian for less than 6 years, Mid-Career Professional Librarians have been working as a librarian for 6 to 15 years, and Senior Librarians have been working as a librarian for more than 15 years.
To summarize the results of this section in terms of our assessment of how well the supply is meeting the demand for management, business, and leadership skills, it is clear that some aspects of these skills and roles are better matched than others. Though current and predicted demand for librarians to perform managerial functions is high, and though six in ten librarians are currently working as managers/supervisors, the interest in doing so provides more evidence to suggest a demand-supply mismatch, rather than a match. This conclusion is more ap-plicable to the managerial function of supervising others than it is to the function of managing a department or service. The mismatch between management demand and supply, furthermore, is most apparent within CARL libraries.
186 SECTION K: Competency Demand-Supply Match CANADIAN LIBRARY HUMAN RESOURCE STUDY
But, there are indications that the future situation will be more positive. Most recent librarian entrants do not feel that it is important for them to manage or supervise at this early point in their careers, but they are interested in participating in management skills training, and have expectations to perform managerial roles in the future.
Our rating of the demand-supply match for leadership skills is somewhat more promising. Again, juxtaposed against a very high current and predicted future demand, the interest in assuming leadership roles among the majority of librarians at all stages of their careers is clear. The results suggest that libraries should not experience too much difficulty in meeting their leadership demands (as long as leadership expectations are clearly commu-nicated and fostered in staff). That nearly half of library administrators are concerned about replacing the lost leadership qualities of retiring professionals in the future is, however, a finding that tempers this rather optimistic conclusion.
Though we do not have as many indicators for business skills specifically, the data we do have suggest that the demand for business skills is not quite as strong as it is for management and leadership skills and abilities. Signifi-cantly smaller proportions of librarians reported that they had increased their performance of business functions over the past 5 years, as compared to management and leadership roles. This may explain the lower interest in participating in business skills training.
The role of education and organizational training in the demand-supply equation should also not be overlooked. Of course, we cannot maintain that the insufficient provision of management education is related to the relatively low levels of interest in performing managerial functions. It might be suggested, however, that the early exposure in MLIS programs to the management and supervisory aspects of being a librarian will help new librarians rec-ognize that they will, in most cases, be expected to perform these roles. This suggestion could also be applied to the early management training provided to new recruits.
K.5 Meeting the Demands of Information Technology
I Indicators of Demand for Information Technology SkillsHistorically, new technologies have precipitated huge changes in the organization of work, and libraries are no exception. According to most library administrators, information technology has had the strongest influence on librarians’ processes and functions. Furthermore, when library administrators were asked to comment on the most pressing human resource challenges facing the library sector, one-quarter provided the (unsolicited) re-sponse of new technologies. The continuous pressure to adopt, implement, and maintain technology, as well as to train in information technologies was a dominant theme within these responses. Additional findings suggesting the demand for information technology skills in libraries is both high and increasing are provided in Appendix Tables K.3a and K.3b. In brief, these supportive findings include:
1. Virtually all (95%) institutional respondents reported that they had increased their use of information technology in the past 5 years.
2. Virtually all (94%) of institutional respondents reported that candidates’ technology skills were an impor-tant consideration when recruiting librarians.
3. Of all types of librarians, institutional respondents indicated that IT librarians require the most amount of training.
4. Just over 7 in 10 librarians indicated that they had opportunities to use information technology.
5. Just over half of mid-senior librarians indicated that they are required to perform more high technology tasks now than they did 5 years ago.37
37 This figure is perhaps not quite as high as we might expect, but it may reflect the fact that most new technologies were introduced earlier than 5 years ago in some libraries. This is supported by the fact that CARL librarians were the least likely to agree with this statement suggesting that large academic libraries were already relying heavily on information technology in the early to mid 1990s. On the other hand, the much higher proportion of librarians in for-profit libraries responding positively to this question may reflect the fact that new technologies are continually evolving in this sector. In other words, it is highly possible that the for-profit sector employs and can afford to employ technologies as they become available more so than other sectors.
SECTION K: Competency Demand-Supply Match 187The Future of Human Resources in Canadian Libraries
II Can Supply of Technology Skills Meet Demand?The technology indicators that have already been presented suggest a better demand-supply match for informa-tion technology skills than we found for management and leadership. For example, compared to the provision of management skills in MLIS programs, Table G.7 shows that recent librarian entrants were somewhat more likely to agree that they were provided with “the information technology skills required to effectively perform my cur-rent job” (46% compared to 25%). And while 84% of librarians participated in IT training, only 51% had done so with respect to management training, and even fewer (28%), to leadership training.
The results presented in Table K.8 further demonstrate that the supply of technology skills fits well with the de-mand for these skills. Only one-third of institutional respondents reported that information technology skills were difficult to find in librarian candidates when hiring. Smaller public libraries, however, were more likely to state that it was difficult to fulfill these competencies when hiring. Interest in performing jobs that involve information technology and in participating in IT training is also much higher than we found for managerial endeavours and training. Though interest in utilizing IT is slightly lower than average in public libraries (65%), the interest in training in this sector more closely approximates the average. Otherwise, non-profit and school librarians are most likely to express an interest in information technology.
Table K.8 Indicators of Supply of Information Technology Skills by Library Sector (Institutional and Individual Surveys)
Percent
Institutional Survey(n=231)
Individual Survey (n=1,910)
Library SectorIT Skills Difficult to Fulfill
When Recruiting1Important that Use IT in Job2
Interested in Participating in IT Training3
TOTAL 33 70 62
TOTAL ACADEMIC 27 70 60
CARL 19 69 58
Other Academic 31 73 65
TOTAL PUBLIC 41 65 60
CULC 27 64 59
Other Public 46 67 62
TOTAL SPECIAL 27 77 69
Government 17 73 68
Non-Profit 28 81 76
For-Profit -- 77 62
SCHOOL N/A 82 73
Source: 8Rs Canadian Library Human Resource Institutional and Individual Surveys1 Based on ‘4’ and ‘5’ responses on a 5-point scale with ‘1’ meaning “very easy to fulfill” and ‘5’ meaning “very difficult to fulfill” to the question” “Rate the level of ease or difficulty you have experienced in trying to fulfill this competency.”2 Based on ‘4’ and ‘5’ responses on a 5-point scale with “1” meaning “strongly disagree” and “5” meaning “strongly agree” to the question asking to what extent librarians agreed that it is important that their job includes this element.3 Based on’4’ and ‘5’ responses on a 5-point scale with “1” meaning “strongly disagree” and “5” meaning “strongly agree” to the question asking to what extent that they are interested in participating in this type of skills training.
Professional librarians in the early and middle stages of their careers are more interested in using IT in their jobs and in partaking in IT training than are senior librarians (Table K. 9). This finding is underscored by our director telephone interviews, many of whom commented on the resistance from senior staff to engage in the use of new technology. Often, these comments were placed in the context of the stress felt by senior librarians from trying to adapt to a number of changes in their roles (not just those strictly related to technology).
188 SECTION K: Competency Demand-Supply Match CANADIAN LIBRARY HUMAN RESOURCE STUDY
Table K.9 Indicators of Supply of Information Technology Skills by Career Stage1
(Individual Survey; n=1,910)
Percent
IT Supply Indicators TOTALRecent Librarian
EntrantsMid-Career Librarians
Senior Librarians
Important that use IT in job 70 76 75 64
Interested in Participating in IT Training 62 71 65 57
Source: 8Rs Canadian Library Human Resource Individual Survey1 Recent Professional Librarian Entrants are individuals who have been working as a professional librarian for less than 6 years, Mid-Career Professional Librarians have been working as a librarian for 6 to 15 years, and Senior Librarians have been working as a librarian for more than 15 years.
The results presented in this section indicate a good fit between the need for librarians to utilize new information technology and the education and training skills and the interest levels among librarians in doing so. Our overall conclusion, therefore, is that the system is generally meeting its demand for IT skills. This fit, however, is not as well-matched when examining senior librarians, who comprise nearly half of all librarians.
K.6 Changing Roles of Librarian and Paraprofessional Staff
The changing roles of librarians have meant that in many libraries, paraprofessionals have taken on some of the duties once performed exclusively by librarians. Responses shown in Table K.10 demonstrate overall agreement with this statement. More than three-quarters of institutions report both that the need for paraprofessionals to perform tasks once done by professional librarians has increased in the past 5 years, and that this need will con-tinue over the next 5 years. These results signal a significant shift in roles. Somewhat puzzling, however, is the much smaller proportion of mid-career and senior paraprofessionals who agreed that, compared to 5 years ago, they are currently required to perform tasks once performed by professional librarians. We have no apparent ex-planation for the disparity in responses between institutional and individual respondents. One possibility is that responsibilities have been segmented, so that paraprofessionals are performing tasks to a limited point of comple-tion, with a librarian holding final responsibility for the completion, coordination, or quality control of the task.
SECTION K: Competency Demand-Supply Match 189The Future of Human Resources in Canadian Libraries
Table K.10 Paraprofessional Adoption of Professional Roles by Library Sector1
Increased Need for Paraprofessionals to Perform Professional Librarian Tasks2
Library Sector In Past 5 Years Over Next 5 YearsCurrently Required to Perform
More Librarian Tasks3
TOTAL 78 77 28
TOTAL ACADEMIC 83 83 27
CARL 85 85 26
Other Academic 82 82 28
TOTAL PUBLIC 80 74 28
CULC 77 72 26
Other Public 81 74 31
TOTAL SPECIAL 71 77 27
Government 71 70 24
Non-Profit 77 83 31
For-Profit -- -- 30
SCHOOL N/A N/A 42
Source: 8Rs Canadian Library Human Resource Institutional and Individual Surveys1 Separate sub-sector results are not presented for For-Profit library because of insufficient cases reporting; however, they are included in the calculation of the Total Special results.2 Based on responses “3,” “4,” and “5” on a 5-point scale, with “1” meaning “not at all” and “5” meaning “to a great extent,” to the question asking respondents the extent to which “the need for more professional librarians has increased in the past 5 years” and the extent to which “the need for more professional librarians will occur at your organization over the next 5 years.”3 Based on “4” and “5” responses on 5-point scale with “1” meaning “strongly disagree” and “5” meaning “strongly agree” of senior and mid-career paraprofessionals to the question: “I am currently required to perform tasks once done by professional librarians.”
There are several potential causes for this shift in roles. First, the additional expectations of librarians to perform generalist, managerial, supervisory, and leadership roles means that they must relinquish at least some of their traditional functions to paraprofessional staff. Others acknowledge the influence of technology on shifting roles. Johnson (1996), for example, points out that as new technologies are introduced, formerly complex but now routine menial work is shifted onto paraprofessionals. Further still, Harris and Marshall (1998) maintain that many traditional duties are being offloaded to lower-paid paraprofessionals, primarily as a response to budget cuts. Several of the administrators interviewed for our study felt, however, that role restructuring was not strictly a financial decision. While some libraries certainly reduce and restructure roles for budgetary reasons, others do so to become more efficient and to better meet the needs of their changing client base. The relative roles of profes-sional librarians and paraprofessional staff, it was argued, need to be fluid and experimental to meet the changing needs of the library and its users.
In analyzing the specific job functions performed by professionals and paraprofessionals, we can discern com-mon functions between the two groups and their discrete roles. Table K.11 presents a list of job functions and the proportion of professional librarians and paraprofessional staff reporting that they frequently perform each of these functions.
The first observation to be made from this table is that by virtue of the sheer number (36) and breadth of job func-tions listed, it is clear that both paraprofessionals and professionals are potentially performing a large number of diverse functions (the latter particularly so). As for professional/paraprofessional comparisons, for 12 of the 36 functions there is little or no difference between the two types of staff. Most of these functions fall within the realm of public services and information technology. Otherwise, paraprofessionals are more likely to be perform-ing children’s programming and all types of technical and/or bibliographic services. Conversely, librarians are more likely to be working on collection development, performing liaison activities and managerial functions, and to be participating in professional development.
190 SECTION K: Competency Demand-Supply Match CANADIAN LIBRARY HUMAN RESOURCE STUDY
Table K.11: Percentage Frequently Performing Job Function1 by Type of Staff (Individual Survey; n=3,795)
Job Function Professional Librarians Paraprof. Staff
I COLLECTIONS
Collection development, evaluation and management 60 34
Copyright clearance 4 6
Electronic licensing 11 4
Digitization of collections 5 7
II PUBLIC SERVICE AND OUTREACH
Reference, information service and research support 63 63
Adult programming, reference, readers advisory, information and research 47 46
Teens programming, reference, readers advisory, information and research/ homework support 22 28
Children’s programming, reference, readers advisory, information and homework support 15 26
Instructions in library use, resource & research 52 55
Programming & services to special populations (e.g. workplace employees, people with disabilities) 15 18
Liaison activities (e.g. with individual faculty, assigned departments, community groups or agencies) 47 24
III TECHNICAL & BIBLIOGRAPHIC SERVICES (Paras more likely to perform all)
Cataloguing, database management and organization of information resources (including metadata schemes and Online Public Access Catalogues (OPACs) 25 40
Creation and maintenance of bibliographic records 18 35
Processing interlibrary loan requests 8 31
Acquisition, receipt and payment of library materials 15 32
Circulation and discharge of library materials 14 55
Sorting, shelving and filing of library materials 6 44
Bindery and materials processing 4 23
Repair and conservation of library materials 3 17
IV INFORMATION TECHNOLOGY
Library systems, hardware, and software support 20 20
Network management and technical support 9 9
Web development and applications 20 9
Database creation and maintenance (e.g. OPACs) 16 13
V PROFESSIONAL DEVELOPMENT / PARTICIPATION (Libs more likely to participate in all)
Participation in professional organizations 44 18
Attendance at conferences and workshops 44 20
Research and publishing in the field of librarianship 8 2
VI ADMINISTRATION & MANAGEMENT (Libs more likely to perform vast majority)
Training and development 45 22
Managing library units/activities 56 24
Supervision and evaluation of personnel 54 20
Organizational planning and decision-making 59 25
SECTION K: Competency Demand-Supply Match 191The Future of Human Resources in Canadian Libraries
Policy development 50 16
Human resources planning and management 37 8
Budgeting and financial management 43 16
Managing space, facilities and building operations 35 15
Fund-raising and donor support 9 8
Marketing and public relations 28 13
Source: 8Rs Library Canadian Human Resource Individual Survey1 Based on “4” and “5” responses on a 5-point scale with “1” meaning “never” and “5” meaning “frequently” to the question: “Please indicate how often you perform the following job functions?”
K.7 Effects of Changing Roles on Work Levels and Job Attitudes
The results presented in this section of the report strongly support the notion that the functions and roles of li-brarians have altered dramatically. Relatively little is known, however, about how these changes have affected the work levels and job attitudes of staff. A common sentiment among administrators in our telephone interviews was that due to changing roles, librarians are often faced with higher volumes of work than in the past and as a result, are largely understood to be overwhelmed and overworked. The job satisfaction findings in Table I.18 sup-port the viewpoint that librarians are feeling over-worked and stressed.
The results of a multivariate analysis pinpoint four major contributors to increased stress levels among mid-career and senior librarians in our sample including (see Appendix Table K.4 for the individual results of each of the following items by library sector):38
1. The requirement to work harder compared to 5 years ago.
2. The requirement to perform more difficult tasks compared to 5 years ago.
3. The requirement to perform a wider variety of tasks compared to 5 years ago.
4. The requirement to perform more managerial functions compared to 5 years ago.
Notably, the requirements to perform more high tech tasks, to perform more leadership functions, and to per-form more business functions did not correlate significantly with stress and are not, therefore, indicated as causes of job-related stress.
At the same time, we should not forget that the vast majority of librarians are satisfied with most aspects their jobs (Section I). The administrators interviewed also stated that changes in technology, in the culture of information and in the function of libraries in general have created a more interesting, more challenging, and more rewarding workplace.
Indeed, another multivariate analysis revealed that some of the same contributors to stress noted above also lead to more positive elements of the librarian job. Specifically, the performance of both a wider variety of tasks and more difficult tasks were found to be significantly and positively related to jobs that are more enjoyable, reward-ing, interesting, and challenging (see Appendix Tables K.4 and K.5). In addition, the increased performance of leadership roles was found to be significantly and strongly related to these positive job attributes.
On the whole, our findings suggest that the increasing requirements for librarians to be generalists and manag-ers, and to work harder and at more complex levels, result in increased stress levels. But working as generalists and at more difficult tasks also makes the job more satisfying. Furthermore, librarians who are performing more of a leadership role than in the past are the most likely to find their jobs interesting, challenging, rewarding, and
38 The regression (beta) coefficient for working harder is 0.286, for performing more difficult tasks is 0.139, for performing more managerial functions is 0.117, and for performing a wider variety of tasks is 0.073. All three variables are significant at the .01 level and explain 24% of the variation in stress.
192 SECTION K: Competency Demand-Supply Match CANADIAN LIBRARY HUMAN RESOURCE STUDY
enjoyable. In short, working harder and managing lead to stress, but working in a more varied capacity, at more complex levels, and in a leadership role all contribute to a more fulfilled librarian workforce. We do not have evidence, however, to suggest that the requirements to perform more technology- and business-related tasks strongly relate to either job stress or job satisfaction.
Increasing job-related stress is largely a result of working harder and of managing. However, the fact that librarians are performing a wider variety of more complex tasks is a significant contributor to the enjoyment, reward, challenge and interest that librarians find in their jobs.
We might expect, however, that abilities to adapt to change and the greater expectations of library work are less apparent among more senior staff. According to some administrators, the positive aspects of the contemporary librarian’s job are more applicable to junior staff, who tend to anticipate and may even thrive on volatility and change. The impact of workplace instability on senior librarians, however, is seen by administrators to be less positive. Rapid changes in roles and in expectations contribute to a more unstable and hence, more stressful workplace, particularly for those librarians embedded in traditional roles and values. The ability of the librarian to adapt to the rapid pace of change is thus understood by the sample of administrators to be largely a function of career stage.
We are not able to conduct the same multivariate causal analysis of stress for recent librarian entrants, and thus cannot comment on the administrators’ views that more junior staff are better able to cope with change. However, in examining the relationship between increasing work and increasing stress, we found no noteworthy differences between mid-career and senior librarians. In fact, no differences were found at all between librarians in these later stages of their careers in terms of their increasing stress levels.39 Specifically, the levels and causes of stress are equally apparent for librarians who have been working in their careers for up to 6 and 10 years, as they are for those working 11 to 15 years, as they are for those working as librarians for more than 15 years. We, therefore, find no evidence to support the notion held by many administrators that more senior staff are experiencing change in a more stressful way than are their less senior counterparts.
Though we have fewer indicators demonstrating that paraprofessional staff have undergone a similar degree of change in their job functions as have professional librarians, we see some evidence that paraprofessionals are expected to assume a larger share of traditional librarian tasks. In exploring the effects of these changes on work levels and job attitudes, we also need to consider that, like their librarian colleagues, the majority of paraprofes-sionals are satisfied with their jobs, but they are slightly less likely to agree that their current job is more stressful than it was 5 years ago (58% compared to 67%). The causal analysis of stress, furthermore, revealed that only working harder and performing more high-tech tasks contributed to increasing stress levels among mid-career and senior paraprofessionals. Increasing skill requirements of their jobs and a more varied set of tasks, on the other hand, render paraprofessionals’ jobs more interesting, enjoyable and rewarding.
According to some authors, the changing roles of professionals and paraprofessionals has resulted in tension between the two types of staff. Oberg, Mentges and McDermott 1992) contend that the library publicly presents no visible delineation between librarians and paraprofessionals, which he states contributes to the perception that there is little difference between the work performed by librarians and that performed by support staff. Attempts to draw clear lines between the positions take on new interest, since the shifting of roles in library work demon-strates that in reality, these clear lines do not always exist. Further, this sentiment illustrates some of the tension between these two groups of workers, as it expresses the professional librarian‘s disdain that they are thought of as “just support staff ” and the paraprofessional’s resentment of being under-valued.
We might, therefore, expect increasing tension between professionals and paraprofessionals, insofar as librar-ians may feel resentful for having to give over traditional tasks to paraprofessionals, and as paraprofessionals may feel they are not accorded the status and respect that should accompany their increasing responsibilities.
39 Nor did we find career stage differences in the likelihood of librarians to agree that, compared to 5 years ago, they are currently less motivated to do their work. Only about one in five of librarians at all stages of their careers agreed with this statement.
SECTION K: Competency Demand-Supply Match 193The Future of Human Resources in Canadian Libraries
We found, however, that more than half (56%) of paraprofessionals feel they are treated with the same amount of respect as librarians. Even more illuminating is the fact that 8 in 10 paraprofessionals agreed that they have a good relationship with professional librarian staff. Overall, therefore, while performing more high-tech tasks and working harder have contributed to increased stress, we do not have strong evidence to suggest that the adoption of traditional librarian tasks has, by and large, detrimentally affected the relationship between professional and paraprofessional staff members. Since this analysis of job change for paraprofessionals is not as complete as it is for librarians, we hesitate to conclude that there have been no detrimental effects at all from shifting roles and that there is no degree of professional/paraprofessional tension (or how it compares to historical tension levels). A complete and confident understanding of this subject warrants a more detailed level of research that is beyond the scope of this broad-level study.
K.8: Strategic Human Resource Planning Implications
• Role change will continue to take place in libraries. Institutions need to carefully plan how they will re-structure their staffing complements as retirements occur. The first step is to define needed competencies and determine what mix of staff will meet the present and (insofar as possible) future needs of the orga-nization. However, we can say overall that the ability for staff to adapt flexibly to change will clearly be a necessary competency throughout Canadian libraries.
• Libraries clearly need to cultivate librarians’ management, leadership, and in some instances, business skills. Interest in and potential for performing in management and leadership roles could be a factor in recruitment of new librarians and grooming needs to begin shortly after recruitment so that potential can be assessed and appropriately directed.
• Libraries’ emphasis on leadership and management also have implications for library education, with re-spect to both recruitment of students and curricula content. Opportunities for management and leader-ship within the field of library work can be highlighted as one method of attracting individuals with the desire to pursue these career goals.
• Mid career librarians, particularly, need to send clear signals about their interest in managing. The lack of interest in supervising needs closer attention, suggesting that the supervisory role is not necessarily a role of choice for many librarians and that supervisory models and structuring of the staff complement in libraries needs to be closely examined.
• The large degree to which librarians and paraprofessionals overlap in job functioning is apparent. In designing jobs for both librarians and paraprofessionals, libraries need to carefully consider the level of responsibility attached to the job task or function. Clearly, paraprofessionals should not be performing to the same level of responsibility as professional librarians if they are not recognized or paid for doing so.
• Almost half of paraprofessionals indicate that they do not perceive they are treated with the same respect as librarians. Supervisors and managers need to ensure that they build and/or promote a respectful work-place that recognizes the contributions of all staff, and acknowledges the increasingly demanding respon-sibilities these staff perform.
• In designing jobs, the balance between the elements of managing/leading and working harder/working at a variety of more complex tasks, needs to be carefully considered. The balance can be tipped and jobs made more stressful or more fulfilling, depending upon the relative proportion of the elements.
SECTION L: Report Summary of Major Findings 195The Future of Human Resources in Canadian Libraries
S E C T I O N L :
Report Summary of Major Findings
This study originally arose in response to concerns about how an expected swell of librarian retirements would affect the well-being of the Canadian library community. In recognizing that retirements could not be viewed
in isolation from a number of other factors, the focus of the research soon expanded to encompass such related matters as recruitment, retention, education and training, and quality of work, all within a context of the chang-ing roles of libraries and library staff, as well as changes in the size of the workforce itself. This report has been structured along these conceptual lines. At the same time, results from different sections of the report have been linked together when possible, and appropriate with an eye to generating more inclusive and fully grounded conclusions. For example, in Section J we noted that a potential future shortage of librarians could be subverted by addressing issues that would support the recruitment of paraprofessionals and immigrant librarians as a pos-sible pool of future librarians, or by increasing the number of spaces in library schools (or the number of schools themselves).
But, perhaps one of the most recurring and reliable themes uncovered in this study is that of the need for librar-ians to perform managerial functions and to assume leadership roles. In Section K, the shifting demand towards managing was clearly demonstrated as was the need for training in these areas, and the lack of interest among librarians in performing some of these roles. In addition, the continuing shifts in the roles of librarians has im-plications for retirement, recruitment, retention, education and training, and job satisfaction. We outline these implications below.
First, the retirement of senior staff with experience in managing and leading clearly sets the stage for a new gen-eration of managers and leaders. With two in five current librarians and over 3 in 10 current paraprofessionals predicted to retire by 2014, the library community is well-advised to begin examining their own institutional demographics and planning for the future (by, for example, restructuring staff positions and/or grooming current staff to assume the managerial and leadership roles of departing senior staff). As revealed in Section K, however, positional restructuring initiatives should be sensitive to the challenge of balancing workloads with task variety. Moreover, the overall well-being of the library in the future is contingent upon the continuous cultivation of both management and leadership competencies through in-house and external training. Though the organizational longevity of librarians limits promotional opportunities, it confers the added benefit of long-term, management and leadership grooming possibilities that can begin with new recruits.
Second, and on a promising note, the results of this study revealed that the current workforce is open to assuming leadership roles and, indeed, tend to find that these roles bestow an interesting, challenging, and rewarding ele-ment to their jobs. On the other hand, those less motivated to engage in managing and supervising may benefit
196 SECTION L: Report Summary of Major Findings CANADIAN LIBRARY HUMAN RESOURCE STUDY
from knowing that managers, and especially senior administrators, are the most satisfied with their jobs. Still, it should also not be overlooked that indicators from this study demonstrate a fairly high level of job satisfaction and contentment among most librarians and paraprofessionals irrespective of their occupational position. While there may be areas of concern (e.g., somewhat high stress levels) and some elements that require attention (e.g. the high rates of temporary employment among recent librarian recruits), our overall assessment of the quality of work provided in Canadian libraries is a very positive one.
Third, an increased demand for managers and leaders does have implications for recruitment of individuals to the profession. Efforts to attract individuals to the profession should not only highlight the literacy, learning, and public service values of librarianship, but also the fact that most librarian jobs will eventually involve some form of supervising and managing. The exciting opportunity to work as a leader in a dynamic and changing environ-ment that is marching alongside technological advancements could also be highlighted to prospective future librarians.
Fourth, on the whole, the recruitment situation in Canadian libraries is not one that can be clearly labeled as a “problem” situation. Our data demonstrate, however, that human resources officers should not ignore candidates’ prior experience, training, and education in managing and leading nor their potential and interest in performing these roles.
Finally, the need for library schools to place a greater curriculum emphasis on managing, and leadership skills was clearly documented in Section G. Furthermore, inasmuch as library education is the first point of entry into the profession and therefore involves the early socialization of librarians into the values, intellectual grounding, and activities of librarianship, it is also implied by the findings that the entire community would benefit from the inclusion of the concept of “librarian as manager” into this socialization process. Increased opportunities for library students to participate in practicum and internship programs would also allow future librarians to witness the realities of the “librarian as manager” role firsthand.
This summary of the management and leadership theme uncovered in this study demonstrates the wide-reaching human resource implications of these shifting roles. In addition, the summary documents the broad situation for Canadian libraries, but in doing so, does not capture all the nuances of the study findings; nor does it portray the many differences that have been revealed throughout the report between library sectors and geographical areas, and between professionals and paraprofessionals of varying career lengths and occupational levels. Not all libraries will experience retirements at the same predicted rates, not all libraries have the same expressed past and future increased demand for managers and leaders and not all librarians are disinterested in managing and supervising. For example, we know that CARL and CULC libraries have and will experience the highest rates of retirement and are, for this reason and many others, in greater need for their workforce to engage in management type activities. Nevertheless, individuals and institutional representatives can use this material as a global bench-mark against which they can evaluate their own human resource situation.
Perhaps chief among the findings that can be allocated to the general realm of “problems” are the predicted retirement rates and the long-term future demand-supply mismatch. The predictions of a future librarian and paraprofessional shortage, however, need to be understood as issues that could be managed with careful plan-ning and awareness. Indeed, the generally alarmist sentiments expressed nation-wide over the human resource implications of an aging Canadian workforce in the late 1990s have since been replaced with a more optimistic view that emerged from the realization that there are many ways of restructuring the workplace and related poli-cies to compensate for retirements. For example, a recent Human Resource Development Canada report asserts that potential skill shortages (both quantitatively and quantitatively) may be handled by employers’ rethinking work arrangements and by efforts to recruit and retain older workers (HRDC, 2002). Other research highlights the possibility of ameliorating the effects of retirements by changing the rate of retirement itself by, for example, encouraging later and more gradual retirement through the provision of flexible work arrangements (McMullin and Cooke, 2004). Further, as noted by demographer David K. Foot, “to interpret the relationship between an ageing workforce and workforce shortages as a pending crisis is to misunderstand the ways the labour market seeks equilibrium” (qtd. in Brown, 2003).
SECTION L: Report Summary of Major Findings 197The Future of Human Resources in Canadian Libraries
In conclusion, it is our hope that the many human resource initiatives implied by the results of this study will be actively investigated by the various library community stakeholders. We further encourage the community to continue to build a solid understanding of the nature of its work and its people. Since the sector is a human-re-source-intensive environment, this information is crucial to the future development of effective human resource strategies at the national, provincial, local, and individual library levels.
APPENDIX ADETAILED METHODS
APPENDIX A: Detailed Methods 199The Future of Human Resources in Canadian Libraries
A P P E N D I X A
Detailed Methods
Stage I: Research Design for Focus Group Sessions and In Depth Telephone Interviews
As an early step in this research program, the intent of this stage was to draw upon the knowledge, views and sensibilities among senior administrators within the system about the current state of affairs and practices within libraries and the library profession as well as about possible future concerns. Having a broad perspective on staff-ing, budgets, human resource capabilities and succession planning, these administrators provided an expansive overview of recruitment, retention, repatriation, rejuvenation, retirement, and restructuring issues, and we were able to draw upon this information to structure our two major survey instruments (Stages II and III). This data is also drawn upon to explain some of the institutional and individual survey results. The 8Rs team also conducted a focus group session with members of the Alberta Association of Library Technicians (AALT).
This information was gathered in two formats: in-depth telephone interviews with 17 senior administrators from a representative sample of library sectors and focus groups with members of CARL and CULC. The focus group sessions involved the presentation of data on Canadian library human resources upon which participants were asked to comment. The sessions were tape recorded and notes were taken to document major themes discussed. Details of the methods used in the interviews are presented below.
A. In Depth Interview Design for Canadian Library AdministratorsTelephone interviews were conducted with directors of 7 libraries with memberships in the Canadian Association of Research Libraries (CARL), and with directors of 4 libraries with memberships in the Canadian Urban Librar-ies Council (CULC), directors of 4 special libraries and 2 small academic libraries. Interviews were conducted between May 12th and 26th, 2003. Participants were selected by the 8Rs Steering Committee on the basis of their representation in each library sector.
Interviews were conducted with informed consent from each of the 17 directors and were tape-recorded with permission of 16 interviewees. Notes were made during the interview with one director who did not give permis-sion for tape-recording. The recordings of interviews with two directors were unintelligible and were thus sum-marized based on notes made during the interviews. Interviews lasted between 40 and 90 minutes.
Individual interview transcripts were summarized and coded for themes. Thematic content from individual in-terview transcripts was then grouped according to library type. Themes were compared within library-type cat-egories and across library-type categories.
200 APPENDIX A: Detailed Methods CANADIAN LIBRARY HUMAN RESOURCE STUDY
Stage II: RESEARCH DESIGN FOR Survey of Library Administration (Institutional Survey)
A Questionnaire Design The questionnaire used in the institutional portion of the study was designed to collect information on the hu-man resource experiences and perspectives of libraries (a copy of the survey instrument is provided in Appendix C). Questions were constructed to gather information about management’s views and experiences with the 8Rs specifically, and about succession planning in general. The major focus of the institutional survey was to gather information on professional librarian staff, although a few questions also pertained to paraprofessional and other professional staff members. The survey instrument was developed over several months with from input from library community members to ensure that the questions were understandable and applicable to the many differ-ent types of library environments in Canada. Before entering the field, the instrument was pre-tested on a small sample of library administrators and some minor modifications were made as a result of this testing.
Without question, the final survey instrument was lengthy (17 pages). For several reasons, the 8Rs research team felt that, for this portion of the study, breadth took precedence over depth. A primary rationale stemmed from the simple fact that no large-scale study of library human resources existed thereby implicating all human resource areas as subject matter to investigate.
The survey begins with a handful of general background questions about the organization (e.g., total number of employees and type of institution). Aside from a few open-ended questions, the majority of the remaining ques-tions are in scale format. We provide a representation of the categorized responses for most of the open-ended questions in the main body of the report in Appendix E.
The survey instrument also includes a series of chart questions asking respondents to provide numerical informa-tion on their professional and paraprofessional staff. Although these chart questions ask respondents to provide their answers in full-time equivalent (FTE) format, at least half of the sample provided the number of positions instead. This means that our presentation of the data from these charts is either an under-estimation of the num-ber of employees or an over-estimation of FTE employees.
B Data CollectionBefore distributing the survey instrument to the sample of institutions in the summer of 2003, a sampling frame listing institutions and contact information was developed for each library sector. All attempts were made to ensure that these frames were exhaustive and accurate. Still, sector variability in the completeness of the lists was unavoidable despite that cross references were done with other available lists. Numerous additions, removals of duplicate records, and corrections to the contact information were made to the sampling frames; however, our confidence in the completeness and accuracy of the sampling frames is greatest for CARL, academic, CULC. and government libraries.
Within each library sector, a multistage stratified random sampling technique was used to ensure geographical representation from each of Canada’s provinces and territories. Sampling was carried out at variable rates across provinces/territories depending upon the total number of institutions in that region. A census of CARL and CULC members was conducted (i.e., all CARL and CULC member institutions were sent a survey).
At the end of May and into early June, notification letters were mailed to the randomly-selected sample of in-stitutions informing them that they had been chosen to participate in the study. Surveys were mailed out mid-June and at three points thereafter. Follow-up letters were sent via regular mail or by e-mail (and in some cases telephone calls were made). For correspondence that was returned un-opened, continuous efforts were made to locate the correct mailing and e-mail address and then surveys or follow up letters were resent.
Although the vast majority of surveys were received back within two months of their distribution, surveys con-tinued to be received and further follow ups made throughout the fall and into early winter. Most of the efforts at this time were directed toward getting responses from large institutions that had not yet completed the survey or in obtaining missing information for specific questions that was not provided by responding institutions (about
APPENDIX A: Detailed Methods 201The Future of Human Resources in Canadian Libraries
150 contacts were made to obtain data clarification and to increase response rates for specific questions). During this time, we received hundreds of inquiries from potential respondents asking about the survey. While many contacts simply involved clarification of administrative matters, a good portion were to inform the research team that they were not participating in the study because they did not have professional staff and therefore did not qualify. Although we cannot confirm that non-responding institutions did not complete the survey because they also had no professionals on staff, these communications suggest that at least a portion of non-respondents did not qualify for the study. This likelihood has implications for the response rates which would be higher if non-qualifying institutions were removed from the denominator in the calculations of these rates (we do, however, remove institutions where it is known that they did not qualify).
Once most of the surveys were received, coding schemes were developed and the data were entered and analyzed using SPSS. Translation of French open-ended responses into English also took place at this time.
Stage III: Research Design for Survey of Librarians and Paraprofessional Staff (Individual Survey)
A Questionnaire DesignAs was the case for the institutional survey, the question areas included in the individual survey were based on results from Stage I . Results from the institutional survey itself, however, were also used to inform question con-tent. The survey instrument was designed so that all staff would complete a core set of questions and that each type of staff would be directed to questions on topics relevant to their particular contexts.
The core set of questions was asked of all library staff including:
a. Level of education
b. Current employment status
c. Demographics including gender, age, relationship and dependent status, visible minority, Aboriginal and disability status and location.
d. Career and workplace tenure
e. Job title, work status, and job duties
f. Career, organizational, and sector mobility and interests
g. Perceptions of workplace culture and employee/management relations
h. Job satisfaction
i. Experiences with and views on job training and professional development
Survey questions targeted to professional librarians only included their attraction to library profession and extent to which expectations have been met. Survey questions for paraprofessional library workers focused on under-standing the utilization of a potential pool of professional librarian recruits by examining how they fit into cur-rent and possible future human resource structures. Questions were designed to extract their views about career expectations and whether they see a future that involves movement into professional librarianship. Also included were questions designed to detect the presence of a tension between their status, credentials and job functions.
Recent professional librarians (defined as those who had been in their career for less than 6 years) were also asked a series of questions on their Masters of Library and Information Studies program and their experiences with finding their first librarian position. Recent paraprofessional staff were asked a similar but slightly abbreviated set of questions.
202 APPENDIX A: Detailed Methods CANADIAN LIBRARY HUMAN RESOURCE STUDY
To capture over-time changes in the roles of library staff, those who had been working in their careers for a mini-mum of 6 years were asked a set of questions on how their roles have changed in the past 5 years. Future career and retirement plans were also asked of this group. Again, paraprofessionals were provided with fewer but similar questions.
The survey was pretested in both English and French by members of the library community and revised accord-ing to the suggestions of the pretesters.
B Data CollectionA multi-stage random sampling strategy was conducted to ensure sufficient sub-sample sizes and representation from all library sectors, from geographical regions of Canada, and for professional librarians and paraprofessional staff. Sampling was done at different rates depending on the size of the population in the sector or region. For example, with fewer library staff working in the northern territories, 100% of librarians and paraprofessionals were included in the sampling selection frame. We also sampled at a 100% rate within CARL and CULC libraries to allow more detailed and separate analyses of these libraries in the future.
Of the 12,472 staff members in our sampling frame, 8,626 potential respondents were invited to participate in the web survey, for an overall sampling rate of 69%.
The 8,626 potential respondents were notified via e-mail of their selection to participate in the survey on June 10, 2004. During this period, e-mail addresses that did not go through were checked and revised and the notification and link resent to the new address. These corrections plus those who received the notification (7,569) were sent the link to the website containing the survey between June 21st and 25th. During this same period, the link was provided through CULC members’ list servers because we were unable to develop a comprehensive sampling frame for librarians in the sector (especially for paraprofessionals working in these libraries). Two follow-up email reminders were sent to all respondents who had not yet completed their surveys and a third reminder was sent to select respondents to ensure adequate provincial and library sector samples.
Once the majority of completed questionnaires were received from the random sample a Canada-wide call to participate in the survey was made on August 6th. This was done via the list servers of 56 library associations to provide library staff who were not represented in the sampling frame an opportunity to participate in the survey. This dataset was collected in a separate file than that of the sampled respondents.
In August and September the data were compiled and checked, coding schemes developed and French open-ended responses translated into English.
APPENDIX B
APPENDIX B: Supplementary Tables and Figures 203The Future of Human Resources in Canadian Libraries
Abbotsford, CMAAbbotsford (C)Fraser Valley H (RDA)Matsqui Main 2 (R)Mission (DM)Upper Sumas 6 (R)
Cold Lake, CABonnyville (T)Bonnyville Beach (SV)Bonnyville No. 87 (MD)Cold Lake (C)Cold Lake 149 (R)Cold Lake 149A (R)Cold Lake 149B (R)Glendon (VL)Pelican Narrows (SV)
Collingwood, CACollingwood (T)
Corner Brook, CACorner Brook (C)Humber Arm South (T)Irishtown-Summerside (T)Massey Drive (T)Meadows (T)Mount Moriah (T)Steady Brook (T)
Cornwall, CACornwall (C)South Stormont (TP)
Courtenay, CAComox (T)Comox 1 (R)Comox-Strathcona A (RDA)Comox-Strathcona B (RDA)Comox-Strathcona K (RDA)Courtenay (C)Cumberland (VL)Pentledge 2 (R)
Kamloops, CAKamloops (C)Kamloops 1 (R)Logan Lake (DM)Neskonlith 1 (Neskainlith 1) (R)Sahhaltkum 4 (R)Thompson-Nicola J (RDA)Thompson-Nicola P (RDA)Whispering Pines 4 (R)
Kawartha Lakes, CAKawartha Lakes (C)
Kelowna, CACentral Okanagan G (RDA)Central Okanagan H (RDA)Central Okanagan I (RDA)Duck Lake 7 (R)Kelowna (C)Lake Country (DM)Peachland (DM)Tsinstikeptum 10 (R)Tsinstikeptum 9 (R)
Nanaimo, CANanaimo (C)Nanaimo A (RDA)Nanaimo C (RDA)Nanaimo D (RDA)Nanaimo River 2 (R)Nanaimo River 3 (R)Nanaimo River 4 (R)Nanaimo Town 1 (R)Nanoose (R)
New Glasgow, CAFisher’s Grant 24 (R)Merigomish Harbour 31 (R)New Glasgow (T)
Pictou, Subd. B (SCM)
Pictou, Subd. C (SCM)Stellarton (T)Trenton (T)Westville (T)
Norfolk, CANorfolk (C)
North Battleford, CABattleford (T)North Battleford (C)
North Bay, CABonfield (TP)East Ferris (TP)Nipissing 10 (R)North Bay (C)North Himsworth (TP)
Parksville, CANanaimo G (RDA)Parksville (C)Qualicum Beach (T)
Pembroke, CALaurentian Valley (TP)L’Isle-aux-Allumettes (M)Pembroke (C)
Penticton, CAOkanagan-Similkameen D (RDA)Okanagan-Similkameen E (RDA)Okanagan-Similkameen F (RDA)Penticton (C)Penticton 1 (R)
Petawawa, CAPetawawa (T)
Peterborough, CA Curve Lake First Nation 35 (R)Douro-Dummer (TP)Hiawatha First Nation 36 (R)Otonabee-South Monaghan (TP)Peterborough (C)Smith-Ennismore-Lakefield (TP)
Portage la Prairie, CADakota Plains 6A (R)Dakota Tipi 1 (R)Long Plain (Part) 6 (R)Portage la Prairie (RM)Portage la Prairie (C)
Port Alberni, CAAhahswinis 1 (R)Alberni 2 (R)Alberni-Clayoquot B (RDA)Alberni-Clayoquot D (RDA)Alberni-Clayoquot E (RDA)Alberni-Clayoquot F (RDA)Klehkoot 2 (R)Port Alberni (C)Tsahaheh 1 (R)
Port Hope and Hope, CAPort Hope and Hope (T)
Powell River, CAHarwood Island 2 (R)Powell River (DM)Powell River A (RDA)Powell River B (RDA)Powell River C (RDA)Sechelt (Part) (IGD)Sliammon 1 (R)
206 APPENDIX B: Supplementary Tables and Figures CANADIAN LIBRARY HUMAN RESOURCE STUDY
Prince Albert, CABuckland No. 491 (RM)Opawakoscikan (R)Prince Albert (C)Prince Albert No. 461 (RM)Wahpaton 94A (R)
Prince George, CAFort George (Shelley) 2 (R)Fraser-Fort George A (RDA)Fraser-Fort George C (RDA)Fraser-Fort George D (RDA)Fraser-Fort George F (RDA)Prince George (C)
Prince Rupert, CAPort Edward (DM)Prince Rupert (C)
Alexandria 3 (R)Alexandria 3A (R)Baezaeko River 25 (R)Baezaeko River 26 (R)Cariboo A (RDA)Cariboo B (RDA)Cariboo C (RDA)Cariboo I (RDA)Coglistiko River 29 (R)Euchinico Creek 17 (R)Kluskus 1 (R)Kushya Creek 7 (R)Nazco 20 (R)Quesnel (C)Quesnel 1 (R)Sundayman’s Meadow 3 (R)Tatelkus Lake 28 (R)Trout Lake Alec 16 (R)Wells (DM)
Swift Current, CASwift Current (C)Swift Current No. 137 (RM)
Terrace, CAKitimat-Stikine C (Part 1) (RDA)Kitimat-Stikine E (RDA)Kitsumkaylum 1 (R)Kshish 4 (R)Kulspai 6 (R)Terrace (C)
Thetford Mines, CABlack Lake (V)Pontbriand (M)Robertsonville (VL)Thetford Mines (V)Thetford-Partie-Sud (CT)
Thompson, CAThompson (C)
Thunder Bay, CMAConmee (TP)Fort William 52 (R)Gillies (TP)Neebing (TP)O’Connor (TP)Oliver Paipoonge (TP)Shuniah (TP)Thunder Bay (C)
Tillsonburg, CATillsonburg (T)
Timmins, CATimmins (C)
Toronto, CMAAjax (T)Aurora (T)Bradford West Gwillimbury (T)Brampton (C)Caledon (T)Chippewas of Georgina Island First Nation (R)East Gwillimbury (T)Georgina (T)
Vancouver, CMAAnmore (VL)Barnston Island 3 (R)Belcarra (VL)Bowen Island (IM)Burnaby (C)Burrard Inlet 3 (R)Capilano 5 (R)Coquitlam (C)Coquitlam 1 (R)Coquitlam 2 (R)Delta (DM)Greater Vancouver A (RDA)Katzie 1 (R)Katzie 2 (R)Langley (DM)Langley (C)Langley 5 (R)Lions Bay (VL)Maple Ridge (DM)Matsqui 4 (R)McMillan Island 6 (R)Mission 1 (R)Musqueam 2 (R)Musqueam 4 (R)New Westminster (C)North Vancouver (DM)
North Vancouver (C)Pitt Meadows (DM)Port Coquitlam (C)Port Moody (C)Richmond (C)Semiahmoo (R)Seymour Creek 2 (R)Surrey (C)Tsawwassen (R)Vancouver (C)West Vancouver (DM)White Rock (C)Whonnock 1 (R)
Vernon, CAColdstream (DM)North Okanagan B (RDA)North Okanagan C (RDA)Okanagan (Part) 1 (R)Priest’s Valley 6 (R)Vernon (C)
Victoria, CMABecher Bay 1 (R)Capital H (Part 1) (RDA)Central Saanich (DM)Cole Bay 3 (R)Colwood (C)East Saanich 2 (R)Esquimalt (DM)Esquimalt (R)Highlands (DM)Langford (DM)Metchosin (DM)New Songhees 1A (R)North Saanich (DM)Oak Bay (DM)Saanich (DM)Sidney (T)Sooke (DM)South Saanich 1 (R)T’Sou-ke 1 (Sooke 1) (R)T’Sou-ke 2 (Sooke 2) (R)Union Bay 4 (R)Victoria (C)View Royal (T)
Whitehorse, CAIbex Valley (HAM)Lake Laberge 1 (R)Mt. Lorne (HAM)Whitehorse (C)
Whitehorse, Unorganized (UNO)
Williams Lake, CAAlkali Lake 1 (R)Alkali Lake 4A (R)Cariboo D (RDA)Cariboo E (RDA)Cariboo F (RDA)Deep Creek 2 (R)Dog Creek 1 (R)Dog Creek 2 (R)Johny Sticks 2 (R)
Little Springs 18 (R)Little Springs 8 (R)Sandy Harry 4 (R)Soda Creek 1 (R)Swan Lake 3 (R)Williams Lake (C)Williams Lake 1 (R)
Winnipeg, CMABrokenhead 4 (R)East St. Paul (RM)Headingley (RM)Ritchot (RM)Rosser (RM)Springfield (RM)St. Clements (RM)St. François Xavier (RM)Taché (RM)West St. Paul (RM)Winnipeg (C)
Wood Buffalo, CAAllison Bay 219 (R)Charles Lake 225 (R)Chipewyan 201 (R)Chipewyan 201A (R)Chipewyan 201B (R)Chipewyan 201C (R)Chipewyan 201D (R)Chipewyan 201E (R)Chipewyan 201F (R)Chipewyan 201G (R)Clearwater 175 (R)Collin Lake 223 (R)Cornwall Lake 224 (R)Devil’s Gate 220 (R)Dog Head 218 (R)Fort Mackay (S-E)Fort McKay 174 (R)Gregoire Lake 176 (R)Gregoire Lake 176A (R)Janvier 194 (R)Namur Lake 174B (R)Namur River 174A (R)Old Fort 217 (R)Sandy Point 221 (R)Wood Buffalo (RGM)
208 APPENDIX B: Supplementary Tables and Figures CANADIAN LIBRARY HUMAN RESOURCE STUDY
Appendix Table B.2Rural and Remote, Mid-Sized Urban, and Large Urban Library Representation1 by Sector (Institutional Survey; n=287)
Percent
Library Sector Rural and Remote2
Mid-Sized Urban3
LargeUrban4
TOTAL 18 18 64
TOTAL ACADEMIC 8 20 72
CARL 0 8 92
Other Academic 12 26 62
TOTAL PUBLIC 33 23 44
CULC 4 8 89
Other Public 41 28 31
TOTAL SPECIAL5 6 10 84
Special Government 6 11 83
Special Non-Profit 6 11 83
Source: 8Rs Canadian Library Human Resource Institutional Survey1 Distribution of Rural and Remote / Urban designations for libraries employing professional librarians only and excludes 2 institutions for which geographic location information was not provided.2 Rural and Remote Includes communities with a core population of less than 10,000, plus the northern territories. 3 Mid-Sized Urban corresponds to Statistics Canada’s Census Agglomerate (CA) definition and has a population size between 10,000 and 99,999 including all neighbouring municipalities where 50% or more of the labour force commutes into the urban core . 4 Large Urban corresponds to Statistics Canada’s Census Metropolitan Area (CMA) definition and has a population of at least 100,000 including all neighbouring municipalities where 50% or more of the labour force commutes into the urban core.5 For-Profit library results are not presented separately because of insufficient cases reporting; however, they are included in the Total Special results.
Appendix Table B.3Respondents by Size of Library (Individual Survey)
Library Size Sample Size1 Percent of Total Sample
TOTAL 3,875 100.0
Less than 5 Employees 802 21
5 – 19 Employees 819 21
20 – 50 Employees 570 15
More than 50 Employees 1,684 43
Source: 8Rs Canadian Library Human Resource Individual Survey1 Sample excludes respondents who did not provide information on the size of their library.
Appendix Table B.4Percentage of Respondents Residing in a Rural or Remote Region of Canada1
(Individual Survey; n=3,898)
Library Sector Percent
TOTAL 18
ACADEMIC TOTAL 11
CARL 4
Other Academic 24
PUBLIC TOTAL 24
CULC 6
Other Public 59
SPECIAL TOTAL 13
Government 14
Non-Profit 13
For-Profit 3
SCHOOL 28
Source: 8Rs Canadian Library Human Resource Individual Survey1 Rural designation in the individual sample is based on ‘no’ responses to the question “Is your library located in an urban centre with a municipal population of more than 10,000 people?” Because not all respondents provided an answer to this question, rural designation was also assigned to respondents indicating that they “already work in a rural/remote region of Canada,” plus respondents residing in one of Canada’s northern territories.
Appendix Table B.5Breakdown of Government Response Rates by Type of Government(Individual Survey)
Percent
Type ofGovernment
Librarians(n=248)
Paraprofessionals (n=150)
TOTAL 100 100
Federal 61 52
Provincial 36 45
Municipal 3 3
Source: 8Rs Canadian Library Human Resource Individual Survey
APPENDIX B: Supplementary Tables and Figures 209The Future of Human Resources in Canadian Libraries
Appendix Table C.1 Type of Professional Librarian by Library Sector (Institutional Survey; n=289)
Percent
Library Sector Public Service Librarians
Technical Service Librarians IT Librarians Management Other1
TOTAL SAMPLE 51 11 3 17 18
TOTAL ACADEMIC 46 16 5 18 15
CARL 50 18 5 18 9
Other Academic 22 5 2 11 60
TOTAL PUBLIC 60 5 1 17 17
CULC 68 5 1 18 8
Other Public 21 7 1 16 55
TOTAL SPECIAL2 18 17 3 15 47
Government 25 17 3 18 37
Non-Profit 11 19 2 12 56
Source: 8Rs Canadian Library Human Resource Institutional Survey1 Other includes librarians designated as “other” where further definition not specified.2 For-Profit library results are not presented separately because of insufficient cases reporting; however, they are included in the Total Special results.
Appendix Table C.2Volunteer Labour1 by Library Sector2
(Institutional Survey; n=433)
Library SectorPercent Utilizing
VolunteerLabour
Sector Distribution of Volunteer Hours/Year
TOTAL SAMPLE 43 100
(total hours/year: 442,223)
ACADEMIC TOTAL 12 1
CARL 16 <1
Academic 10 <1
PUBLIC TOTAL 65 93
CULC 71 62
Public 64 31
SPECIAL TOTAL3 25 6
Government 6 <1
Non-Profit 42 6
Source: 8Rs Canadian Library Human Resource Institutional Survey1 Includes organizations that utilize any volunteer labour for any job functions.2 Though we have no equivalent data for school libraries, prior research estimates that 41% of school libraries rely on volunteers (People for Education, 2002).3 For-Profit library results are not presented separately because of insufficient cases reporting; however, they are included in the Total Special results.
Appendix Table C.3Work status of Professional Librarians by Library Sector(Institutional Survey; n=289)
Percent
Library Sector Part-Time1 Temporary2 Union Member
TOTAL SAMPLE 10 5 67
TOTAL ACADEMIC 7 7 74
CARL 6 7 75
Other Academic 10 8 66
TOTAL PUBLIC 11 3 63
CULC 12 3 72
Other Public 8 6 26
TOTAL SPECIAL3 8 5 50
Government 7 2 75
Non-Profit 7 10 24
Source: 8Rs Canadian Library Human Resource Institutional Survey 1 Part-Time status includes individuals who normally working less than 30 hours per week.2 Temporary status includes individuals where there is an indication of when the employment will end.
3 For-Profit library results are not presented separately because of insufficient cases reporting; however, they are included in the Total Special results.
210 APPENDIX B: Supplementary Tables and Figures CANADIAN LIBRARY HUMAN RESOURCE STUDY
Appendix Table C.4Work status of Paraprofessional Staff by Library Sector(Institutional Survey; n=202)
Percent
Library Sector Part-Time1 Temporary2 Union Member
TOTAL SAMPLE 27 6 82
TOTAL ACADEMIC 5 7 89
CARL 4 7 89
Other Academic 8 10 89
TOTAL PUBLIC 45 4 80
CULC 47 3 97
Other Public 40 8 40
TOTAL SPECIAL3 14 9 64
Government 7 12 86
Non-Profit 21 6 50
Source: 8Rs Canadian Library Human Resource Institutional Survey 1 Part-Time status includes individuals who normally working less than 30 hours per week.2 Temporary status includes individuals where there is an indication of when the employment will end.
3 For-Profit library results are not presented separately because of insufficient cases reporting; however, they are included in the Total Special results.
Appendix Table C.5Visible Minority Status1 Among Professional Librarians and Paraprofessional Staff by Library Sector(Institutional Survey; n=263)
Percent
Library Sector All Staff Professional Librarians
Para- professional
Staff
TOTAL SAMPLE 4 5 4
TOTAL ACADEMIC 4 4 3
CARL 3 4 3
Academic 4 5 4
TOTAL PUBLIC 4 5 4
CULC 4 5 5
Public 2 1 2
TOTAL SPECIAL2 5 4 5
Government 5 5 4
Non-Profit 5 4 6
Source: 8Rs Canadian Library Human Resource Institutional Survey 1 Visible Minorities include those who are non-Caucasian in race or non-white in colour (e.g., black, Asian, Middle Eastern, Hispanic). 2 For-Profit library results are not presented separately because of insufficient cases reporting; however, they are included in the Total Special results.
Policy Recognizing Credentials from Policy Recognizing
Library SectorOn-line
Programs
Distance-education Programs
Non-North American Programs
Canadian Applicants
First
EthnicDiversity
TOTAL SAMPLE 22 23 27 29 28
TOTAL ACADEMIC 26 30 40 50 42
CARL 32 36 69 65 77
Academic 24 27 25 43 26
TOTAL PUBLIC 21 23 23 11 8
CULC 17 17 21 8 12
Public 22 24 24 12 7
TOTAL SPECIAL1 19 17 19 34 41
Government 32 29 23 58 62
Non-profit 7 7 19 21 27
Source: 8Rs Canadian Library Human Resource Institutional Survey1 For-Profit library results are not presented separately because of insufficient cases reporting; however, they are included in the Total Special results.
APPENDIX B: Supplementary Tables and Figures 211The Future of Human Resources in Canadian Libraries
Appendix Table D.1Demand Change for Need to Hire Professional Librarians1 by Library Sector(Institutional Survey; n=278)
Percent
Library Sector Demand Increased
Demand Stable
Demand Decreased
TOTAL SAMPLE 35 58 7
TOTAL ACADEMIC 51 39 10
CARL 72 16 12
Other Academic 41 50 9
TOTAL PUBLIC 41 56 3
CULC 86 14 0
Other Public 30 66 5
TOTAL SPECIAL2 27 66 7
Government 17 77 6
Non-profit 36 53 11
Source: 8Rs Canadian Library Human Resource Institutional Survey1 Based on responses to the question “Has your organization’s need to hire new professional librarians increased, decreased, or remained stable compared to 5 years ago?”2 For-Profit library results are not presented separately because of insufficient cases reporting; however, they are included in the Total Special results.
Appendix Table D.2Current Ability to Recruit Compared to 5 Years Ago1 by Library Sector(Institutional Survey; n=262)
Percent
Library Sector Easier The Same More Difficult
TOTAL SAMPLE 13 56 31
TOTAL ACADEMIC 16 57 27
CARL 16 72 12
Other Academic 16 51 33
TOTAL PUBLIC 10 58 32
CULC 29 42 29
Other Public 6 62 32
TOTAL SPECIAL2 15 52 33
Government 17 55 28
Non-Profit 12 46 42
Source: 8Rs Canadian Library Human Resource Institutional Survey1 Based on responses “1” and “2”, and “4” and “5” on a 5-point scale, with “1” meaning “much easier” and ”5” meaning “much more difficult”), to the question: “How would you rate your organization’s ability to recruit qualified professional librarians compared to 5 years ago?” 2 For-Profit library results are not presented separately because of insufficient cases reporting; however, they are included in the Total Special results.
Source: 8Rs Canadian Library Human Resource Institutional Survey1 Based on responses to the question “Has your organization’s need to hire new professional librarians increased, decreased, or remained stable compared to 5 years ago?” and includes new professional librarians hired in the past year (between January 1, 2002 and December 31, 2002).2 For-Profit library results are not presented separately because of insufficient cases reporting; however, they are included in the Total Special results.
212 APPENDIX B: Supplementary Tables and Figures CANADIAN LIBRARY HUMAN RESOURCE STUDY
Appendix Table D.4Applicant Ratings Compared to 5 Years Ago1 by Library Sector(Institutional Survey; n=254)
Percent
Library Sector Less Qualified The Same More
Qualified
TOTAL SAMPLE 6 53 41
TOTAL ACADEMIC 4 47 49
CARL 4 23 73
Other Academic 4 58 38
TOTAL PUBLIC 8 64 28
CULC 15 46 39
Other Public 5 70 25
TOTAL SPECIAL2 7 41 52
Government 3 49 48
Non-profit 13 32 55
Source: 8Rs Canadian Library Human Resource Institutional Survey1 Based on responses “1” and “2”, and “4” and “5” on a 5-point scale, with “1” meaning “much less qualified” and “5” meaning “much more qualified”, to the question: “How would you rate the general qualifications of applicants for professional librarians positions compared to 5 years ago?” 2 For-Profit library results are not presented separately because of insufficient cases reporting; however, they are included in the Total Special results.
Appendix Table D.5Prior Sectors Librarians Worked1 in by Library Sector(Individual Survey; n=2,076)
Percent Previously Working in Sector
CurrentLibrary Sector Academic Public Special School
TOTAL 42 30 41 8
TOTAL ACADEMIC N/A 31 45 7
CARL N/A 24 43 4
Other Academic N/A 43 47 12
TOTAL PUBLIC 42 N/A 30 9
CULC 42 N/A 30 7
Other Public 43 N/A 30 14
TOTAL SPECIAL 42 30 N/A 7
Government 38 29 N/A 9
Non-Profit 47 30 N/A 4
For-Profit 46 32 N/A 4
SCHOOL 38 23 29 N/A
Source: 8Rs Canadian Library Human Resource Individual Survey1 Based on responses to the question: “Which of the following different library sectors have you worked in previously?”
Appendix Table D.6Canadian Location of Library Applied to1 by Library Sector2
(Recent Professional Librarian Entrants Only3, Individual Survey; n=356)
Percent
Library SectorMLIS
UniversityMLISCity
Other Canadian
City
TOTAL SAMPLE 33 57 68
TOTAL ACADEMIC 41 52 69
CARL 42 54 68
Academic 39 48 72
TOTAL PUBLIC 27 65 63
CULC 28 74 54
Public 25 50 77
TOTAL SPECIAL 35 54 75
Government 28 50 88
Non-profit 39 58 58
Source: 8Rs Canadian Library Human Resource Individual Survey1 Based on responses to the question: “Which of the following locations did you apply to when looking for your first professional librarian job?”2 Results for For-Profit and for School librarians are not presented separately because of insufficient cases reporting; however, they are included in the Total Sample results. For-Profit library results are also shown in the Total Special results.3 Recent Professional Librarian Entrants are defined as individuals who have been working as a professional librarians for less than 6 years.
APPENDIX B: Supplementary Tables and Figures 213The Future of Human Resources in Canadian Libraries
Appendix Table F.1 Paraprofessional Inter- and Intra-Organizational Mobility Indicators by Library Sector
(Individual Survey)
Percent
Library SectorSenior Paraprofessionals at Current Organization >
10 years
Interest in Spending Remainder of Career at
Current Organization
Interested in More Responsible
Position
Opportunities for Advancement Provided
(n=765) (n=1,541) (n=1,517) (n=1,672)
TOTAL 87 64 47 27
TOTAL ACADEMIC 90 66 50 23
CARL 95 69 51 25
Other Academic 79 62 49 21
TOTAL PUBLIC 88 61 45 31
CULC 91 62 48 32
Other Public 80 59 41 30
TOTAL SPECIAL 76 63 46 30
Government 85 64 48 30
Non-Profit 72 63 43 30
For-Profit 56 58 44 25
TOTAL SCHOOL 81 64 37 27
Source: 8Rs Canadian Library Human Resource Individual Survey
Appendix Table H.1 Types of Training Provided to Professional Librarians1 by Library Sector
(Institutional Survey; n=1,855)
Percent Organizations Offering Training in Past Year
Library Sector Job SkillsTraining
Technology Skills Training
Customer Service Training
Management Training
LeadershipTraining
TOTAL 59 69 38 43 64
TOTAL ACADEMIC 66 73 39 49 44
CARL 92 96 62 77 69
Other Academic 54 63 29 36 32
TOTAL PUBLIC 63 69 40 46 35
CULC 92 92 73 54 50
Other Public 55 62 30 43 30
TOTAL SPECIAL2 46 64 31 33 26
Government 43 63 29 34 31
Non-Profit 50 68 38 32 24
Source: 8Rs Canadian Library Institutional Survey 1 Based on “yes” responses to the question: “During the past year, did your organization provide any of the following types of job-related training to professional librarians?”2 For-Profit library results are not presented separately because of insufficient cases reporting; however, they are included in the Total Special results.
214 APPENDIX B: Supplementary Tables and Figures CANADIAN LIBRARY HUMAN RESOURCE STUDY
Appendix Figure H.1 Organizations Subsidizing Training Outside of Paid Working Hours by Library Sector
(Individual Survey; n=1,942)
Percent
75
86
86
87
66
62
78
74
72
75
83
61
0 20 40 60 80 100
TOTAL
TOTAL ACADEMIC
CARL
Other Academic
TOTAL PUBLIC
CULC
Other Public
TOTAL SPECIAL
Government
Non-Profit
For-Profit
SCHOOL
Source: 8Rs Canadian Library Human Resource Individual Survey
Appendix Table I.1a Benefits Offered to Temporary Librarians by Library Sector (Institutional Survey; n=270)
Percent Organizations Offering
Library Sector Worker’s Comp. Dental Plan Medical Life / Disability Insurance
Retirement / Pension Plan Group RRSP
TOTAL 77 36 44 48 51 20
TOTAL ACADEMIC 89 47 53 61 55 21
CARL 100 56 72 78 72 28
Other Academic 75 40 35 45 40 15
TOTAL PUBLIC 74 23 28 28 39 13
CULC 75 19 19 19 31 6
Other Public 74 26 35 35 44 17
TOTAL SPECIAL1 61 39 61 67 67 33
Source: 8Rs Canadian Library Human Resource Institutional Survey1 Results for Government, Non-Profit, and For-Profit libraries are not presented separately because of insufficient cases reporting; however, they are included in the Total Special results.
APPENDIX B: Supplementary Tables and Figures 215The Future of Human Resources in Canadian Libraries
Appendix Table I.1b Benefits Offered to Temporary Librarians by Library Sector (Institutional Survey; n=270)
Percent Organizations Offering
Library Sector Employee Assistance Program Education Leave Sabbatical/ Research
Leave Tenure
TOTAL 61 19 6 2
TOTAL ACADEMIC 63 21 0 3
CARL 78 11 0 0
Other Academic 50 30 0 5
TOTAL PUBLIC 59 13 3 0
CULC 75 13 0 0
Other Public 48 13 4 0
TOTAL SPECIAL1 61 28 28 6
Source: 8Rs Canadian Library Human Resource Institutional Survey1 Results for Government, Non-Profit, and For-Profit libraries are not presented separately because of insufficient cases reporting; however, they are included in the Total Special results.
Appendix Table I.2a Benefits Offered to Part-Time Librarians by Library Sector (Institutional Survey; n=270)
Percent Organizations Offering
Library Sector Worker’s Comp. Dental Plan MedicalLife/ Disability
InsuranceRetirement /Pension Plan Group RRSP
TOTAL 82 65 66 69 73 26
TOTAL ACADEMIC 91 66 64 75 71 25
CARL 100 65 75 75 75 25
Other Academic 83 67 54 75 67 25
TOTAL PUBLIC 84 61 64 61 73 23
CULC 82 77 73 59 86 14
Other Public 85 50 59 62 65 29
TOTAL SPECIAL1 63 70 73 73 77 33
Government 69 81 81 88 88 38
Source: 8Rs Canadian Library Human Resource Institutional Survey1 Results for Non-Profit and For-Profit libraries are not presented because of insufficient cases reporting; however, they are included in the Total Special results.
216 APPENDIX B: Supplementary Tables and Figures CANADIAN LIBRARY HUMAN RESOURCE STUDY
Appendix Table I.2b Benefits Offered to Part-Time Librarians by Library Sector (Institutional Survey; n=270)
Percent Organizations Offering
Library Sector Employee Assistance Program Education Leave Sabbatical/ Research
Leave Tenure
TOTAL 70 31 13 8
TOTAL ACADEMIC 71 39 18 21
CARL 75 40 20 25
Other Academic 67 38 17 17
TOTAL PUBLIC 68 23 7 0
CULC 82 23 5 0
Other Public 59 24 9 0
TOTAL SPECIAL1 73 33 17 3
Government 75 38 19 6
Source: 8Rs Canadian Library Human Resource Institutional Survey1 Results for Non-Profit and For-Profit libraries are not presented because of insufficient cases reporting; however, they are included in the Total Special results.
Appendix Table I.3 Percentage of Librarians Satisfied with Benefits1 by Career Stage2 by Library Sector3
(Individual Survey; n=2,006)
Percent “Agreeing” Benefits Adequate
Library Sector Total Recent LibrarianEntrants
Mid-CareerLibrarians Senior
TOTAL 80 73 77 84
TOTAL ACADEMIC 85 82 84 87
CARL 86 85 85 87
Other Academic 84 75 84 88
TOTAL PUBLIC 73 63 66 79
CULC 72 67 63 78
Other Public 74 57 75 82
TOTAL SPECIAL 84 73 83 89
Government 91 88 90 93
Non-Profit 75 67 74 82
For-Profit 82 -- -- 89
SCHOOL 91 -- -- 90
Source: 8Rs Canadian Library Human Resource Individual Survey1 Based on responses “3,” “4,” and “5” on a 5-point scale with “1” meaning “strongly disagree” and “5” meaning “strongly agree” to the statement: “In my job I receive adequate benefits.”2 Recent Professional Librarian Entrants are individuals who have been working as a professional librarian for less than 6 years, Mid-Career Professional Librarians have been working as a librarian for 6 to 15 years, and Senior Librarians have been working as a librarian for more than 15 years.3 Results for For-Profit and for School librarians are not presented separately because of insufficient cases reporting; however, they are included in the Total Sample results. For-Profit library results are also shown in the Total Special results.
APPENDIX B: Supplementary Tables and Figures 217The Future of Human Resources in Canadian Libraries
Appendix Table I.4 Percentage of Librarians Satisfied with Benefits1 by Work Status by Library Sector2
(Individual Survey; n=2,006)
Percent “Agreeing” Benefits Adequate
Library Sector Total Full-Time/ Permanent Part-Time Temporary
TOTAL 80 84 52 55
TOTAL ACADEMIC 85 86 75 75
CARL 86 86 77 77
Other Academic 84 86 -- 68
TOTAL PUBLIC 73 78 46 32
CULC 72 78 48 15
Other Public 74 78 -- 56
TOTAL SPECIAL 84 89 49 50
Government 91 94 -- 65
Non-Profit 75 83 -- --
For-Profit 82 88 -- --
SCHOOL 91 97 -- --
Source: 8Rs Canadian Library Human Resource Individual Survey1 Based on responses “3,” “4,” and “5” on a 5-point scale with “1” meaning “strongly disagree” and “5” meaning “strongly agree” to the statement: “In my job I receive adequate benefits.” 2 Separate sub-sector results are not presented when there are fewer than 15 cases reporting.
Appendix Table I.5 Librarian Involvement in Decision-Making by Library Sector (Institutional Survey; n=280)
Percent “Agreeing”
Library Sector Librarians Involved in Local Decisions1 Librarians Involved in Global Decisions2
TOTAL 74 48
TOTAL ACADEMIC 76 51
CARL 73 54
Other Academic 77 49
TOTAL PUBLIC 80 66
CULC 62 50
Other Public 85 71
TOTAL SPECIAL3 64 22
Government 54 15
Non-Profit 72 28
Source: 8Rs Canadian Library Human Resource Institutional Survey1 Based on responses of ”4” and “5” on a 5-point scale with “1” meaning “strongly disagree” and “5” meaning “strongly agree” to the statement: “The organization involves professional librarians in most decisions that effect them directly.”2 Based on responses of “4” and “5” on a 5-point scale with “1” meaning “strongly disagree” and “5” meaning “strongly agree” to the statement: “The organization involves professional librarians in most high-level organizational decisions.”3 For-Profit library results are not presented separately because of insufficient cases reporting; however, they are included in the Total Special results.
218 APPENDIX B: Supplementary Tables and Figures CANADIAN LIBRARY HUMAN RESOURCE STUDY
Appendix Table K.1 Indicators of Demand for Management and Leadership Skills/Abilities by Library Sector
(Individual Survey; n=2,000)
Percent Agreeing “Job Provides Opportunity to . . . “
Managerial Functions Leadership Roles
Library Sector Manage a Service/ Department Supervise Others Perform a
Leadership RoleSeek out New
Projects Motivate Others
TOTAL 58 58 63 64 24
TOTAL ACADEMIC 63 55 63 68 23
CARL 48 52 58 66 22
Other Academic 65 61 71 72 23
TOTAL PUBLIC 62 64 66 62 23
CULC 58 61 62 58 22
Other Public 72 71 75 73 26
TOTAL SPECIAL 54 52 55 58 27
Government 50 51 51 52 29
Non-Profit 57 53 60 64 27
For-Profit 69 58 61 68 19
SCHOOL 82 55 85 73 18
Source: 8Rs Canadian Library Human Resource Individual Survey
Appendix Table K.2a Indicators of Supply of Management and Leadership Skills/Abilities by Library Sector
(Institutional Survey; n=245)
Percent
Library SectorManagement Skills
Difficult to Fulfill When Recruiting
Leadership Skills Difficult to Fulfill when Recruiting
Difficulty Replacing Leadership Abilities of Departing Senior
Librarians
Current Pool Inadequate to
Replace Leadership Skills Lost from
Departing Senior Librarians
Management Librarians Need
Training
TOTAL 49 46 36 46 50
TOTAL ACADEMIC 51 50 29 41 51
CARL 65 54 31 35 69
Other Academic 44 48 27 44 39
TOTAL PUBLIC 58 50 42 42 57
CULC 54 42 46 35 65
Other Public 59 52 40 44 53
TOTAL SPECIAL1 33 35 38 59 34
Government 48 44 36 57 41
Non-Profit 21 31 47 58 37
Source: 8Rs Canadian Library Human Resource Institutional Survey1 For-Profit library results are not presented separately because of insufficient cases reporting; however, they are included in the Total Special results.
APPENDIX B: Supplementary Tables and Figures 219The Future of Human Resources in Canadian Libraries
Appendix Table K.2b Indicators of Supply of Management and Leadership Skills/Abilities1 by Library Sector
(Institutional and Individual Surveys)
Percent
Institutional Survey Individual Survey
Library Sector
More Emphasis on Business, Leadership, & Management Needed in
MLIS Programs2
Inadequate MLIS Leadership Training Barrier to Replacing Leadership Skills of Departing Senior
Librarians3
MLIS Program Provided Adequate Management
Skills4
MLIS Program Provided Adequate Leadership5
TOTAL 58 21 42 40
TOTAL ACADEMIC 60 22 54 49
CARL 61 27 47 50
Other Academic 59 19 59 49
TOTAL PUBLIC 68 17 35 34
CULC 74 23 42 37
Other Public 67 15 -- --
TOTAL SPECIAL6 40 26 31 33
Government 41 29 29 29
Non-Profit 11 25 -- --
SCHOOL N/A N/A 54 46
Sources: 8Rs Canadian Library Human Resource Institutional and Individual Surveys 1 Separate sub-sector results are not presented when there are fewer than 15 cases reporting.2 Based on categorized open-ended responses to the question: “How could the curriculum content of MLIS programs be improved?”3 Based on responses “4” and “5” on a 5-point scale, with “1” meaning “not at all” and “5” meaning “to a great extent,” to the question asking to what extent does “inadequate leadership training provided by MLIS programs” prevent the organization from replacing the competencies lost by departing senior librarians?4 Based on responses “3,” “4,” and “5” on a 5-point scale, with “1” meaning “strongly disagree” and “5” meaning “strongly agree,” to the statement: “The MLIS program provided me with the adequate management skills to effectively perform my job.”5 Based on responses “3,” “4,” and “5” on a 5-point scale, with “1” meaning “strongly disagree” and “5” meaning “strongly agree,” to the statement: “The MLIS program provided me with the adequate leadership skills to effectively perform my job.”6 For-Profit library results are not presented separately because of insufficient cases reporting; however, they are included in the Total Special results.
220 APPENDIX B: Supplementary Tables and Figures CANADIAN LIBRARY HUMAN RESOURCE STUDY
Appendix Table K.2c Indicators of Supply of Management and Leadership Skills/Abilities by Library Sector
(Institutional Survey; n=274)
Percent
Library Sector Management Training Provided Leadership Training Provided Adequate Leadership Role Opportunities
TOTAL 43 35 68
TOTAL ACADEMIC 49 44 75
CARL 77 69 92
Other Academic 36 32 67
TOTAL PUBLIC 46 35 78
CULC 54 50 73
Other Public 43 30 80
TOTAL SPECIAL1 33 26 47
Government 34 31 39
Non-Profit 32 24 61
Source: 8Rs Canadian Library Human Resource Institutional Survey1 For-Profit library results are not presented separately because of insufficient cases reporting; however, they are included in the Total Special results.
Appendix Table K.2d Indicators of Supply of Management and Leadership Skills/Abilities by Library Sector1
(Individual Survey; n=1,815)
Percent
Management Training Leadership Training
Library SectorParticipated in management
training
Management training
improved ability to perform job
Participated in Leadership
training
Leadership training
improved ability to perform job
Participated in Northern Exposure to Leadership
(NEL)
NEL Improved Ability to
Perform Job
TOTAL 51 55 28 59 4 82
TOTAL ACADEMIC 53 52 31 59 6 76
CARL 58 51 34 60 6 71
Other Academic 43 54 26 54 5 --
TOTAL PUBLIC 52 58 26 62 5 86
CULC 49 58 27 58 5 --
Other Public 57 57 23 73 5 --
TOTAL SPECIAL 45 56 27 57 2 --
Government 51 53 31 58 2 --
Non-Profit 35 61 20 39 1 --
For-Profit 41 73 25 -- 3 --
SCHOOL 31 -- 29 -- 0 N/A
Source: 8Rs Canadian Library Human Resource Individual Survey1 Separate sub-sector results are not presented when there are fewer than 15 cases reporting.
APPENDIX B: Supplementary Tables and Figures 221The Future of Human Resources in Canadian Libraries
Appendix Table K.3a Indicators of Demand for Information Technology Skills by Library Sector1
(Institutional Survey; n=256)
Percent
Library SectorKeeping Up with IT Most Pressing Future HR Issue
Increased Use of IT in Past 5 Years
IT Most Important Determinant of Librarian Role
Change
IT Skills Important Competency when
Recruiting
Significant Training Required of IT
Librarians
TOTAL 26 95 84 94 64
TOTAL ACADEMIC 26 99 85 94 76
CARL 22 100 88 92 80
Other Academic 28 98 83 94 72
TOTAL PUBLIC 21 92 84 92 63
CULC 14 100 72 96 74
Other Public 22 91 86 91 59
TOTAL SPECIAL 28 96 85 96 46
Government 40 96 79 96 53
Non-Profit 28 94 93 94 44
Source: 8Rs Canadian Library Human Resource Institutional Survey1 For-Profit library results are not presented separately because of insufficient cases reporting; however, they are included in the Total Special results.
Appendix Table K.3bIndicators of Demand for Information Technology Skills by Library Sector(Individual Survey; n=2,008)
Percent
Library Sector Librarians Using IT on Job1
Perform Significantly More High Tech Tasks
Than in Past2
TOTAL 72 55
TOTAL ACADEMIC 78 52
CARL 77 50
Other Academic 79 55
TOTAL PUBLIC 67 59
CULC 68 57
Other Public 66 64
TOTAL SPECIAL 71 53
Government 68 50
Non-Profit 75 49
For-Profit 71 71
SCHOOL 73 74
Source: 8Rs Canadian Library Human Resource Individual Survey1 Based on responses “3,” “4,” and “5” on a 5-point scale with “1” meaning “strongly disagree” and “5” meaning “strongly agree” to the statement: “My job provides the opportunity to use information technology skills.”2 Based on responses “3,” “4,” and “5” on a 5-point scale with “1” meaning “strongly disagree” and “5” meaning “strongly agree” to the statement: “Compared to 5 years ago, I am currently required to perform more high tech tasks.”
222 APPENDIX B: Supplementary Tables and Figures CANADIAN LIBRARY HUMAN RESOURCE STUDY
Appendix Table K.4 Major Contributors to Job Stress1 by Library Sector (Mid-career and Senior Librarians only: Individual Survey; n=1,488)
Percent “Agreeing” “Compared to 5 Years ago My Job Currently Requires Me to…”
Library Sector Work Harder Perform More Difficult Tasks
Perform a Wider Variety of Tasks
Perform More Managerial Functions
TOTAL 55 56 69 56
TOTAL ACADEMIC 52 55 69 53
CARL 53 53 68 51
Other Academic 50 57 71 57
TOTAL PUBLIC 58 58 70 59
CULC 60 58 69 58
Other Public 54 57 72 61
TOTAL SPECIAL 55 55 66 58
Government 58 55 64 56
Non-Profit 53 51 65 60
For-Profit 38 57 78 58
SCHOOL 85 39 85 58
Source: 8Rs Canadian Library Human Resource Individual Survey1 Based on responses “3,” “4,” and “5” on a 5-point scale with “1” meaning “strongly disagree” and “5” meaning “strongly agree” to statements pertaining to current job requirements.
Appendix Table K.5 Percentage of Librarians Reporting Job More Enjoyable, Rewarding, Interesting, and Challenging Compared to 5 Years Ago1
(Mid-Career and Senior Librarians2 only: Individual Survey; n=1,460)
Percent “Agreeing” “Compared to 5 Years ago My Job is Currently More . . .”
Source: 8Rs Canadian Library Human Resource Individual Survey1 Based on responses “3,” “4,” and “5” on a 5-point scale with “1” meaning “strongly disagree” and “5” meaning “strongly agree” to the statements on job satisfaction. 2 Mid-Career Professional Librarians are defined as individuals who have been working as a librarian for 6 to 15 years, and Senior Librarians have been working as a librarian for more than 15 years.
APPENDIX C: Institutional Survey Instrument 223The Future of Human Resources in Canadian Libraries
A p p e n d i x C
Institutional Survey Instrument
INTRODUCTION
Study Purpose: The purpose of this research project is to examine the human resource environment in the Ca-nadian heritage community (including archives, libraries, and museums). This phase of the study will establish some basic statistical data on staffing and assist in our attempts to gain a better understanding of some of the most pressing human resource issues facing the heritage sector.
Your participation in the survey: Your contribution to this research initiative is vital to the sector’s goal of de-veloping a meaningful human resource strategy. Since this is the first time such a large-scale study has been con-ducted in the heritage sector, the survey covers a wide range of human resource-related areas and the questions often require a high level of detailed response. Gathering this amount and depth of information is crucial to the sector’s goals of establishing baseline data and of developing an accurate picture of human resources in Canadian heritage institutions. Please understand that your participation in this study is entirely voluntary and you do not have to answer any questions if you do not wish to do so.
Confidentiality: Please be assured that the information you provide in this survey will be kept strictly confiden-tial. Results from this survey will be presented at an aggregate level only (e.g. by geographical region or by type of organization). Individual organizations will not be identified. Once the data are compiled, all identifiers will be stripped and completed questionnaires will be stored in a secure area accessible only by the research team.
SURVEY DETAILS
a. Instructions on how to complete surveyThis questionnaire will take between 30 and 60 minutes to complete, depending on the size of your organization. Please read each question carefully and answer them as accurately as possible. The success of the study depends on this.
There are three formats of questions as follows:
1. Chart questions require numerical information on staff. Detailed instructions on how to complete the charts are provided on page 2, just before Sections B, C, and D where the charts are located.
224 APPENDIX C: Institutional Survey Instrument CANADIAN LIBRARY HUMAN RESOURCE STUDY
2. Close-ended questions with a response category provided. Please circle the number that indicates your response.
3. Open-ended questions with space provided for your written response. If there is not enough space to write your answer, please continue on the back of the page.
Please return the completed survey in the enclosed stamped envelope by July 2, 2003 to:8Rs Canadian Library Human Resource Study / Étude sur les ressources humaines dans les bibliothèques canadiennes5-07 Cameron LibraryUniversity of AlbertaEdmonton, Alberta T6G 2J8
If you have any questions about how to complete the survey or about the study, please contact:Marianne Sorensen, Project [email protected](780) 430-1179
b. Survey ContentThe survey begins with background questions about your organization (Section A) and proceeds to three chart questions on General Staff Information (Section B), Retirement and Age Information (Section C), and Retention and Recruitment Information (Section D). Subsequent question topics include:
Section E: Succession Planning InformationSection F: Training and Development InformationSection G: Human Resource Policies and StrategiesSection H: Changing Librarian Roles and Organizational RestructuringSection I: Concluding Questions
c. Staff Classification TermsMost questions refer to professional librarians; however, there are a few questions that ask specifically about other professionals or paraprofessionals. The survey does not include any questions about clerical/office workers.
Please ensure that you are providing a response for the appropriate staff classification according to the following definitions:
PROFESSIONAL LIBRARIANS: The usual educational requirement is a Master’s degree (or historical equivalent) from a library education program accredited by the American Library Association or its equivalent.
OTHER PROFESSIONALS: Professionals without an MLIS degree who work in such areas as personnel, finance, conservation, etc., and who perform work requiring knowledge of an advanced type, customarily obtained by a prolonged course of specialized instruction leading to a professional qualification.
PARAPROFESSIONALS: Paraprofessionals usually possess a technical certificate and/or diploma from an ac-credited library technician program (e.g. library technicians), but they might also work in paraprofessional roles with an undergraduate degree and/or relevant experience (e.g. library assistants).
CLERICAL/OFFICE WORKERS: Clerical/office workers perform library work for which a high school diploma (or equivalent) is the qualification. This survey does not include any questions on clerical/office workers.
THANK YOU FOR PARTICIPATING IN THIS SURVEY
APPENDIX C: Institutional Survey Instrument 225The Future of Human Resources in Canadian Libraries
SECTION A: BACKGROUND INFORMATION
1. Name, job title, and contact information of person completing survey:
a. Name:
b. Job title:
c. Phone number (including area code):
d. Fax number (including area code):
e. E-mail address:
2. Name of Institution:
3. As of January 1, 2003: Total number of FTE employees ___________ (including permanent, temporary, contract, and part-time employees)
4. As of January 1, 2003: Total number of volunteer hours ____________ (reported in hours per year)
5. Is your institution a member of the Canadian Library Association (CLA)?
1. Yes
2. No
6. Please circle the type of library that best describes your institution:
i. Academic library
If circled, is your institution a member of CARL?
1. Yes (Skip to Section B)
2. No (Skip to Section B)
ii Public library
If circled, is your institution a member of CULC?
1. Yes (Skip to Section B)
2. No (Skip to Section B)
iii Special library (Continue to question 7)
7. Please circle the type of special library that best describes your organization:
1. Federal government
2. Provincial government
3. Local government
4. Private for-profit library (e.g. business, law firms, corporations, banks including libraries of crown corporations)
5. Private not-for-profit library (e.g. libraries in hospitals, museums, special academic libraries)
226 APPENDIX C: Institutional Survey Instrument CANADIAN LIBRARY HUMAN RESOURCE STUDY
INSTRUCTIONS ON HOW TO COMPLETE CHARTS IN SECTION B, C, AND DPlease complete the charts on the next three pages using the following category definitions and instructions:
Staff Categories:
Professional Librarians: The usual educational requirement is a Master’s degree (or historical equivalent) from a library education program accredited by the American Library Association or its equivalent.
Institutions with 10 or more professional librarians: There are 5 categories of professional librarians for which you are asked to provide information about on the charts. Not all of the following classifications may be applicable to your library. For the three chart questions, please complete only the columns of types of professional librarians that are employed at your institution.
1. Public Services librarians
2. Technical Services librarians
3. IT librarians (including digital and web services)
4. Management librarians (e.g. responsible for budgets and personnel, overseeing operations, and instituting policies and accountability measures)
5. Other librarians (complete only if you have professional librarian staff who do not fit into any of the four categories provided above)
Institutions with fewer than 10 professional librarians: complete only the “TOTAL” column under the “Profes-sional Librarians” category.
Other Professionals: Professionals without an MLIS degree who work in such areas as personnel, finance, con-servation, etc., and who perform work requiring knowledge of an advanced type, customarily obtained by a prolonged course of specialized instruction leading to a professional qualification.
Paraprofessionals: Paraprofessionals usually possess a technical certificate and/or diploma from an accredited library technician program (e.g. library technicians), but they might also work in paraprofessional roles with an undergraduate degree and/or relevant experience (e.g. library assistants).
Other Definitions:
Full-time Equivalent (FTE): Use full-time equivalent figures for each box that you are completing. FTE is cal-culated by the number of hours worked by an employee divided by the standard number of hours for a full-time employee.
Permanent status means there is no indication of when employment will end.
Part-Time status includes those normally working less than 30 hours per week.
Visible Minorities are employees who are non-Caucasian in race or non-white in colour (e.g. Black, Asian, Middle Eastern, Hispanic).
Aboriginal Canadians includes Status Indian, Non-Status Indian, Métis or Inuit.
Disabled includes employees who have a long term or recurring physical, mental, sensory, psychiatric or learning impairment (e.g., loss of hearing or sight, reduced mobility, learning disability) and who are considered disadvan-taged in employment by reason of that disability.
APPENDIX C: Institutional Survey Instrument 227The Future of Human Resources in Canadian Libraries
SECTION B: GENERAL STAFF INFORMATION
As o
f Jan
uary
1, 2
003,
Rep
orte
d in
FTE
Prof
essi
onal
Lib
rari
ans
Oth
erPr
ofes
sion
als
Para
prof
essi
onal
sPu
blic
Serv
ices
Tech
nica
l Se
rvic
es
ITM
anag
e-m
ent
Oth
erTO
TAL
Tota
l Num
ber
# in
full-t
ime
perm
anen
t po
sitio
ns
# in
par
t-tim
e pe
rman
ent
posi
tions
# in
full-t
ime
tem
pora
ry /
co
ntra
ct p
ositi
ons
# in
par
t-tim
e te
mpo
rary
/ co
ntra
ct p
ositi
ons
# fe
mal
e
# v
isib
le m
inor
ity
# a
borig
inal
# d
isab
led
# co
vere
d by
col
lect
ive
agre
emen
t(s)
228 APPENDIX C: Institutional Survey Instrument CANADIAN LIBRARY HUMAN RESOURCE STUDY
SECTION C: RETIREMENT AND AGE INFORMATION Al
l Num
bers
, R
epor
ted
in F
TE
Prof
essi
onal
Lib
rari
ans
Oth
er
Prof
essi
onal
sPa
rapr
ofes
sion
als
Publ
ic
Serv
ices
Tech
nica
l Se
rvic
es
ITM
anag
e-m
ent
Oth
erTO
TAL
Ret
irem
ent:
Tota
l # re
tirem
ents
in p
ast
5 ye
ars
# re
tirem
ents
in p
ast 5
yea
rs
befo
re th
e ag
e of
65
# re
tirem
ents
in p
ast 5
yea
rs
afte
r th
e ag
e of
65
# po
sitio
ns c
urre
ntly
ope
n be
caus
e of
retir
emen
t
Age
of C
urre
nt S
taff
:
# <
45
year
s of
age
# 4
5 to
55
year
s of
age
# >
55
year
s of
age
1.
Does
you
r or
gani
zatio
n ha
ve a
pol
icy
that
spe
cifie
s th
e ag
e of
retir
emen
t for
pro
fess
iona
l lib
raria
ns?
1.
Yes
– Pl
ease
indi
cate
:
Min
imum
age
requ
irem
ent f
or re
tirem
ent
___
____
__
Max
imum
age
requ
irem
ent f
or re
tirem
ent
___
____
__
2.
No
2.
Does
you
r or
gani
zatio
n of
fer
prof
essi
onal
libr
aria
ns a
n ea
rly re
tirem
ent p
acka
ge?
1.
Yes
APPENDIX C: Institutional Survey Instrument 229The Future of Human Resources in Canadian Libraries
SECTION D: RETENTION AND RECRUITMENT INFORMATION
All N
umbe
rs,
Rep
orte
d in
FTE
Prof
essi
onal
Lib
rari
ans
Oth
er
Prof
essi
onal
sPa
rapr
ofes
sion
als
Publ
ic
Serv
ices
Tech
nica
l Se
rvic
es
ITM
anag
e-m
ent
Oth
erTO
TAL
Ret
entio
n:
# le
avin
g lib
rary
in p
ast y
ear
(bet
wee
n Ja
nuar
y 1,
200
2 an
d De
cem
ber
31, 2
002)
, ex
clud
ing
retir
emen
ts
# vo
lunt
arily
leav
ing
(not
due
to
cut
back
s, d
ism
issa
l or
retir
emen
t)
Rec
ruitm
ent:
# ne
w h
ires
in p
ast y
ear
(bet
wee
n Ja
nuar
y 1,
200
2 an
d De
cem
ber
31, 2
002)
# ne
w h
ires
in p
ast 5
yea
rs
who
wer
e re
cent
MLI
S gr
adua
tes
Aver
age
age
of n
ew h
ires
in
past
yea
r
# of
pos
ition
s cu
rren
tly tr
ying
to
fill
# of
cur
rent
pos
ition
s op
en
for
long
er th
an 4
mon
ths
230 APPENDIX C: Institutional Survey Instrument CANADIAN LIBRARY HUMAN RESOURCE STUDY
Section D1: Retention Cont’d
1. How long, on average, do you expect newly-hired, entry-level professional librarians to stay in your organization?
1. Less than 2 years
2. Between 2 and 4 years
3. Between 5 and 10 years
4. More than 10 years
2. Compared to five years ago, are turnover rates (other than from retirements) lower, higher, or about the same among professional librarians?
1. Much lower
2. Lower
3. About the same
4. Higher
5. Much higher
3. What are the three major factors which cause professional librarians to leave your organization (other than to retire)?
1.
2.
3.
4. When professional librarians leave your organization (other than to retire), where are they most likely to work? (Please circle one response)
1. Canadian academic library
2. Canadian public library
3. Canadian special library
4. American library (public, academic, or special)
5. Left library for non-traditional library-related work
5. What are the three major reasons why professional librarians stay at your organization?
1.
2.
3.
6. On a scale of 1 to 5, how would you rate the promotional opportunities for professional librarians compared to five years ago?
1 2 3 4 5
Much worse About the same Much better
APPENDIX C: Institutional Survey Instrument 231The Future of Human Resources in Canadian Libraries
7. On a scale of 1 to 5, how would you rate the current promotional opportunities for professional librarians?
1 2 3 4 5
Poor Neutral Excellent
8. On a scale of 1 to 5, to what extent do the following items contribute to a lack of promotional opportunities for professional librarians in your organization?
Not at All NeutralTo a Great
Extent
a. Delayering/flattening of organizational structure 1 2 3 4 5
b. Budgetary restrictions 1 2 3 4 5
c. Organizational hiring freeze or limited hiring policy 1 2 3 4 5
d. Limited librarian turnover 1 2 3 4 5
e. Other, please specify: 1 2 3 4 5
9. On a scale of 1 to 5, how would you rate your organization’s ability to provide professional librarians with opportunities to experience leadership roles in your organization?
1 2 3 4 5
Poor Neutral Excellent
10. Has your organization’s need to hire new professional librarians increased, decreased, or remained stable compared to 5 years ago?
1. Increased
2. Decreased
3. Remained stable
11. On a scale of 1 to 5, how would you rate the general qualifications of applicants for professional librarian positions compared to 5 years ago?
1 2 3 4 5
Much less qualified About the same Much more qualified
12. On a scale of 1 to 5, how would you rate your organization’s ability to recruit qualified professional librarians compared to five years ago?
1 2 3 4 5
Much easier About the same Much more difficult
13. On a scale of 1 to 5, how would you rate your current ability to recruit qualified professional librarians?
1 2 3 4 5
Poor Neutral Excellent
232 APPENDIX C: Institutional Survey Instrument CANADIAN LIBRARY HUMAN RESOURCE STUDY
14. On a scale of 1 to 5, to what extent do the following issues prevent you from hiring qualified professional librarians?
Not at All NeutralTo a Great
Extent
a. Inadequate pool of qualified candidates 1 2 3 4 5
b. Inadequate pool of interested candidates 1 2 3 4 5
c. Applicants declining job offers 1 2 3 4 5
d. Budget restraints 1 2 3 4 5
e. Organizational hiring freeze or limited hiring policy 1 2 3 4 5
f. Inadequate education provided by MLIS programs 1 2 3 4 5
g. Inadequate remuneration offered to librarians 1 2 3 4 5
h. Competition from other sectors for librarians (excluding U.S.) 1 2 3 4 5
i. Competition from U.S. for librarians 1 2 3 4 5
j. Lack of a dedicated HR unit at the library 1 2 3 4 5
k. The need to hire bilingual staff 1 2 3 4 5
l. Geographical location 1 2 3 4 5
m. Small size of library 1 2 3 4 5
n. Policy (including collective agreements) restrictions on hiring non-Canadian applicants
1 2 3 4 5
o. Other, please specify: 1 2 3 4 5
15. In the past year, have you changed your recruitment strategies because your usual methods were not attracting a sufficient pool of qualified professional librarian candidates?
1. No
2. Yes: Please describe what new strategies you adopted
16. For the following list, first rate how important the competency is when you are making recruiting decisions about professional librarians and second, the level of ease or difficulty you have experienced in trying to fulfill these competencies.
Importance of Competency Ability to Fulfill Competency
Not at All Important
Very Important
Very Easy to Fulfill
Very Difficult to Fulfill
a. MLIS degree, specifically 1 2 3 4 5 1 2 3 4 5
b. Other education 1 2 3 4 5 1 2 3 4 5
c. Number of years of experience 1 2 3 4 5 1 2 3 4 5
d. Specialist skills: Please specify the type of specialist skills you look for when recruiting:
1 2 3 4 5 1 2 3 4 5
e. Generalist skills (i.e. can work in a number of different areas)
1 2 3 4 5 1 2 3 4 5
f. Interpersonal or ‘people’ skills 1 2 3 4 5 1 2 3 4 5
g. Communication skills 1 2 3 4 5 1 2 3 4 5
h. Entrepreneurial skills 1 2 3 4 5 1 2 3 4 5
i. Technology skills 1 2 3 4 5 1 2 3 4 5
j. Managerial skills 1 2 3 4 5 1 2 3 4 5
k. Leadership potential 1 2 3 4 5 1 2 3 4 5
l. Ability to handle high volume workload 1 2 3 4 5 1 2 3 4 5
APPENDIX C: Institutional Survey Instrument 233The Future of Human Resources in Canadian Libraries
Importance of Competency Ability to Fulfill Competency
Not at All Important
Very Important
Very Easy to Fulfill
Very Difficult to Fulfill
m. Ability to respond flexibly to change 1 2 3 4 5 1 2 3 4 5
n. Ability to deal with a range of users 1 2 3 4 5 1 2 3 4 5
o. Ability to learn new skills 1 2 3 4 5 1 2 3 4 5
p. Dedication to the profession 1 2 3 4 5 1 2 3 4 5
v. Interest in professional development/continuing education
1 2 3 4 5 1 2 3 4 5
w. Interest in contributing to the profession 1 2 3 4 5 1 2 3 4 5
x. Other, please specify: 1 2 3 4 5 1 2 3 4 5
17. Do you think the education provided in MLIS programs equips graduates with the competencies required to be professional librarians at your organization?
1. Yes
2. No
18. How could the curriculum content of MLIS programs be improved? (e.g., what should the content focus more on or less on?)
19. On a scale of 1 to 5, what level of input does your organization have into curriculum content at any of Canada’s 7 MLIS programs?
1 2 3 4 5
No input at all Some input Very much input
20. Do you require MLIS degrees from ALA-accredited programs as a qualification in hiring professional librarians?
1. Yes – Continue to question 21
2. No – Skip to question 22
21. Is there any reason why you would not adhere to ALA accreditation standards in the future?
1. No
2. Yes: Please provide the major reason why you would not adhere to ALA accreditation in the future
234 APPENDIX C: Institutional Survey Instrument CANADIAN LIBRARY HUMAN RESOURCE STUDY
22. Does your organization have a hiring policy that recognizes the credentials of professional librarians from the following programs and sources:
Yes No
a. On-line programs 1 2
b. Distance-education programs 1 2
c. Non-North American credentials 1 2
23. Does your organization have a policy requiring you to hire Canadian professional librarian applicants first?
1. Yes
2. No
24. Does your organization have a hiring policy designed to recruit professional librarians from diverse ethnic and racial backgrounds?
1. Yes
2. No
SECTION E: SUCCESSION PLANNING INFORMATION
1. How adequate is your current pool of internal suitable candidates that could replace the skills and knowledge OR the leadership qualities lost by departing senior professional librarians?
Not at All NeutralVery
Adequate
a. Adequacy of Skills and Knowledge 1 2 3 4 5
b. Adequacy of Leadership Qualities 1 2 3 4 5
2. Have you had any difficulties replacing the skills and knowledge OR the leadership qualities lost by departing senior professional librarians?
Yes No
a. Difficulty Replacing Skills and Knowledge 1 2
b. Difficulty Replacing Leadership Qualities 1 2
3. On a scale of 1 to 5, to what extent do the following items prevent your organization from replacing the competencies lost by departing senior professional librarians?
Not at All NeutralTo a Great
Extent
a. Inadequate pool of qualified candidates 1 2 3 4 5
b. Inadequate pool of interested candidates 1 2 3 4 5
c. Inadequate recruitment strategies 1 2 3 4 5
d. Applicants declining job offer 1 2 3 4 5
e. Budget restraints 1 2 3 4 5
f. Organizational hiring freeze or limited hiring policy 1 2 3 4 5
g. Inadequate leadership training provided by MLIS programs 1 2 3 4 5
h. Inadequate skills & knowledge training provided by MLIS programs 1 2 3 4 5
i. Inadequate remuneration offered to librarians 1 2 3 4 5
j. Competition from other sectors for librarians (excluding U.S.) 1 2 3 4 5
k. Competition from U.S. for librarians 1 2 3 4 5
APPENDIX C: Institutional Survey Instrument 235The Future of Human Resources in Canadian Libraries
l. Lack of a dedicated HR unit at the library 1 2 3 4 5
m. The need for bilingual staff 1 2 3 4 5
n. Geographical location 1 2 3 4 5
o. Small size of library 1 2 3 4 5
p. Policy (including collective agreements) restrictions on hiring externally
1 2 3 4 5
q. Policy (including collective agreements) restrictions on hiring non-Canadian applicants
1 2 3 4 5
r. Inadequate leadership/management training 1 2 3 4 5
s. Inadequate skills and knowledge training 1 2 3 4 5
t Inability to fast track strong candidates 1 2 3 4 5
u. Recruitment strategies that do not identify leadership
potential when assessing candidates 1 2 3 4 5
v. Absence of succession planning strategy 1 2 3 4 5
w. Elimination of middle-level positions that serve as training ground for upper-level postings
1 2 3 4 5
x. Other: Please specify 1 2 3 4 5
Definition:
Succession planning is a proactive effort that makes provision for the development and replacement of profes-sional librarians over a period of time and ensuring leadership continuity.
4. Does your organization have a succession planning strategy for professional librarians?
1. Yes - Continue to question 5
2. No - Skip to Section F
5. On a scale of 1 to 5, how adequate do you feel this succession planning strategy is in replacing the competencies lost by retiring senior librarians?
1 2 3 4 5
Not at all adequate Neutral Very adequate
6. Is this succession planning strategy long-term (i.e. at least 5 years)?
1. Yes
2. No
236 APPENDIX C: Institutional Survey Instrument CANADIAN LIBRARY HUMAN RESOURCE STUDY
SECTION F: TRAINING AND DEVELOPMENT INFORMATION1. During the past year did your organization provide any of the following formats or types of job-related training to professional
librarians or paraprofessional staff? Please circle all that apply.
Provided to
Professional Librarians Paraprofessionals
Training Formats:
a. Internal classroom training 1 2
b. Internal on-the-job training 1 2
c. External private training/consultancy 1 2
d. Professional development training provided by library associations 1 2
Types of Training
e. Job-oriented skills training (excluding technology) 1 2
f. Technology skills training 1 2
g. Customer-service related training 1 2
h. Management training 1 2
i. Leadership training 1 2
j. Other: Please specify1 2
2. Does your organization subsidize, assist, or reimburse professional librarians for attendance at library association meetings?
1. No - Continue to Question 3
2. Yes - Skip to Question 4
3. Did your organization do this at any time in the past?
1. Yes
2. No
4. On a scale of 1 to 5, to what extent do the following groups of staff require ongoing training to meet the needs of your organization?
No Training Some TrainingA Great Amount
of Training
a. All professional librarians 1 2 3 4 5
b. New professional librarian recruits 1 2 3 4 5
c. Middle level professional librarians 1 2 3 4 5
d. Upper level professional librarians 1 2 3 4 5
e. Public services librarians 1 2 3 4 5
f. Technical services librarians 1 2 3 4 5
g. IT librarians 1 2 3 4 5
h. Management librarians 1 2 3 4 5
i. Other Professional librarians 1 2 3 4 5
j. Paraprofessional staff 1 2 3 4 5
5. On a scale of 1 to 5, to what extent do budgets prevent your organization from offering needed training to professional librarians?
1 2 3 4 5
To no extent Neutral To a great extent
APPENDIX C: Institutional Survey Instrument 237The Future of Human Resources in Canadian Libraries
6. Do you have a routine method for determining the training needs among professional librarians?
1. No
2. Yes: Please specify the method
7. Do you have a routine method for evaluating the outcomes of training targeted to professional librarians?
1. No
2. Yes: Please specify the method
8. Do you think that professional library associations should assist in training professional librarians?
1. No
2. Yes: Please specify what role you feel professional associations should play in training
SECTION G: HUMAN RESOURCE POLICIES AND STRATEGIES
1. Please provide the current annual salary range for each category of professional librarian by using your own classification system that determines salaries for each librarian. First, list the classification label you use and then the salary range. For example, if you have three categories of professional librarians that include ‘librarian 1’, ‘librarian 2’, and ‘librarian 3’, list each of these on a line with the corresponding salary range on the same line.
Category of Professional Librarian Salary Range
1. From: $ To: $
2. From: $ To: $
3. From: $ To: $
4. From: $ To: $
5. From: $ To: $
6. From: $ To: $
7. From: $ To: $
2. On a scale of 1 to 5, how would you rate the competitiveness of these professional librarian salaries?
1 2 3 4 5
Not at all competitive Very competitive
238 APPENDIX C: Institutional Survey Instrument CANADIAN LIBRARY HUMAN RESOURCE STUDY
3. Do you have strategies other than salary to attract candidates for professional librarian positions?
1. No
2. Yes: Please specify
4. What proportion of your organization’s total budget is allocated to professional librarian salaries?
1. Less than 30%
2. 31% to 40%
3. 41% to 50%
4. More than 50%
5. Which of the following benefits are at least partially funded by your organization for permanent, temporary, and part-time professional librarians? Circle all that apply.
Permanent Temporary Part-Time
a. Retirement/pension plan 1. 2. 3.
b. Life and/or disability insurance 1. 2. 3.
c. Supplemental medical 1. 2. 3.
d. Dental plan 1. 2. 3.
e. Group RRSP 1. 2. 3.
f. Worker’s Compensation 1. 2. 3.
g. Maternity/paternity leave (beyond Employment Insurance) 1. 2. 3.
h. Employee Assistance Program 1. 2. 3.
i. Childcare services 1. 2. 3.
j. Childcare subsidies/reimbursements 1. 2. 3.
k. Elder care leaves 1. 2. 3.
l. Educational leaves 1. 2. 3.
m. Sabbaticals 1. 2. 3.
n. Research leaves 1. 2. 3.
o. Tenure 1. 2. 3.
APPENDIX C: Institutional Survey Instrument 239The Future of Human Resources in Canadian Libraries
6. Which of the following job strategies are practiced at your organization for professional librarians? Circle all that apply:
Yes No
a. Employee’s suggestion program 1. 2.
b. Job rotation 1. 2.
c. Job enrichment 1. 2.
d. Job sharing 1. 2.
e. Job mentoring 1. 2.
f. Information sharing with employees 1. 2.
g. Problem-solving teams 1. 2.
h. Self-directed work groups (e.g. work teams that have a high level of responsibility for decisions) 1. 2.
i. Performance evaluations 1. 2.
j. Flextimes 1. 2.
k. Compressed work weeks 1. 2.
l. Fixed shifts 1. 2.
m. Rotating shiftss 1. 2.
n. Paid overtime 1. 2.
7. On a scale of 1 to 5, to what extent do you agree with the following statements about your organization?
Strongly Disagree Neutral
Strongly Agree
a. The organization promotes a culture of lifelong learning.
1 2 3 4 5
b. The organization promotes a culture of trust and cooperation between employees and employers.
1 2 3 4 5
c. The organization practices family-friendly procedures. 1 2 3 4 5
d. Turnover rates are not of great concern in our organization.
1 2 3 4 5
e. Absenteeism rates are not of great concern in our organization.
1 2 3 4 5
f. The organization involves professional librarians in most decisions that affect them directly.
1 2 3 4 5
g. The organization involves professional librarians in most high-level organizational decisions.
1 2 3 4 5
h. Empowering professional librarians is important to the organization.
1 2 3 4 5
i. Female and male professional librarians are treated equally.
1 2 3 4 5
j. Most professional librarians perform quality work. 1 2 3 4 5
k. Most professional librarians are highly motivated. 1 2 3 4 5
l. Most professional librarians appear to be satisfied with their jobs.
1 2 3 4 5
240 APPENDIX C: Institutional Survey Instrument CANADIAN LIBRARY HUMAN RESOURCE STUDY
SECTION H: CHANGING LIBRARIAN ROLES AND ORGANIZATIONAL RESTRUCTURING
1. On a scale of 1 to 5, to what extent have the following changes in the staffing needs of your organization occurred in the past 5 years?
In the past five years . . . Not at All NeutralTo a Great
Extent
a. The need for more professional librarians has increased. 1 2 3 4 5
b. The need for more paraprofessionals has increased. 1 2 3 4 5
c. The need for professional librarians to perform managerial functions has increased.
1 2 3 4 5
d. The need for professional librarians to assume leadership roles has increased.
1 2 3 4 5
e. The need for professional librarians to perform a wider variety of tasks has increased.
1 2 3 4 5
f. The need for professional librarians to perform more specialized functions has increased.
1 2 3 4 5
g. The need for paraprofessionals to perform tasks once done by professional librarians has increased.
1 2 3 4 5
h. The need for other professionals to perform tasks once done by professional librarians has increased.
1 2 3 4 5
2. Thinking about the future needs of your organization, and using the same scale of 1 to 5, to what extent do you think the following changes in needs will occur at your organization over the next 5 years?
Over the next 5 years . . . Not at All NeutralTo a Great
Extent
a. The need for more professional librarians will increase. 1 2 3 4 5
b. The need for more paraprofessionals will increase. 1 2 3 4 5
c. The need for professional librarians to perform managerial functions will increase.
1 2 3 4 5
d. The need for professional librarians to assume leadership roles will increase.
1 2 3 4 5
e. The need for professional librarians to perform a wider variety of tasks will increase.
1 2 3 4 5
f. The need for professional librarians to perform more specialized functions will increase.
1 2 3 4 5
g. The need for paraprofessionals to perform tasks once done by professional librarians will increase.
1 2 3 4 5
h. The need for other professionals to perform tasks once done by professional librarians will increase.
1 2 3 4 5
3. Has your organization experienced any of the following organizational changes in the past 5 years?
In the past 5 years, our organization has experienced . . . Yes No
a. Greater integration among different functional areas 1 2
b. An increase in the degree of centralization 1 2
c. Downsizing (a reduction in the number of employees to reduce expenses) 1 2
d. Re-engineering (redesigning processes to improve performance and cost) 1 2
e. A reduction in the number of managerial levels (i.e. delayering) 1 2
f. Implementation of total quality management 1 2
g. Greater reliance on part-time workers 1 2
APPENDIX C: Institutional Survey Instrument 241The Future of Human Resources in Canadian Libraries
h. Greater reliance on temporary workers 1 2
i. Greater reliance on volunteer workers 1 2
j. Greater reliance on outsourcing 1 2
k. Increased use of information technologies 1 2
4. Of all the items listed in question 3 above (a through k), which three organizational changes do you think have contributed to the greatest amount of change in the roles of professional librarians at your organization? (Please indicate your response by writing the letter that accompanies the item listed in question 3)
1. ______ 2. ______ 3. ______
SECTION I: CONCLUDING QUESTIONS1. What, in your opinion, are the most pressing human resource challenges the library sector will face over the next 5 years and
why?
2. Do you have any other comments, questions, or concerns that relate to this study or questionnaire?
THANK YOU FOR TAKING THE TIME TO COMPLETE THIS QUESTIONNAIRE
PLEASE return the survey in the enclosed stamped,
SELF-ADDRESSED envelope BY JULY 2, 2003
APPENDIX D: Individual Survey Instrument 243The Future of Human Resources in Canadian Libraries
A p p e n d i x D
Individual Survey Instrument (Professional Librarians and
Paraprofessionals)
This questionnaire will take between 10 and 30 minutes to complete. Please read each question carefully and answer them as accurately as possible. The success of the study depends on this.
As a reminder, your participation is entirely voluntary and your responses will be held in the strictest confi-dence.
Survey Instructions
Please adhere to the following guidelines when completing the survey:
1. When navigating through the survey, please DO NOT USE THE “ENTER” button on your keyboard. In-stead, please use the ‘tab’ or your ‘arrow’ keys or your mouse to navigate through the survey.
2. If you cannot complete the survey in one sitting, you can save your responses and return to the survey by logging in with your password at a later date. You may also complete the survey at any com-puter that has internet access. If you have received this e-mail through your work address, for example, you can complete the survey using your home computer or a public computer. The two requirements for participation in the survey are that you have the URL address and your password.
3. We are only interested in your responses that pertain to your library job. If you have another job, do not draw upon this other job in your responses.
4. If you work at more than one library, please provide responses for the job where you spend the most amount of your time.
5. Complete the survey even if you work in a non-traditional library-type workplace. The term “library” is used throughout the survey in its broadest sense and connotes all types of organizations that perform library work.
6. Complete the survey even if you are currently working outside of Canada.
If you have any questions about how to complete the survey or experience any difficulties while completing the survey, please contact:
9. How many hours do you usually work per week in your library position? __________hours
10. Is your position permanent or temporary?
� Permanent (Permanent means there is no indication of when the job will end)
� Temporary (Temporary means the job will terminate at some specified time)
11. Are you working on a volunteer basis in your current position (i.e., you are not paid for your labour)?
� Yes
� No
12. What was your gross annual salary in your library position in 2003 (before taxes and deductions)?
$____________________/year
248 APPENDIX D: Individual Survey Instrument CANADIAN LIBRARY HUMAN RESOURCE STUDY
13. Are you currently represented by a union or staff association (e.g. are you covered by a collective agreement or a union contract)?
� Yes
� No
14. Please indicate how often you perform each of the following job functions:
Frequency Perform Job Function
Never Sometimes Frequently
I Collections
a. Collection development, evaluation and management 1 2 3 4 5
b. Copyright clearance 1 2 3 4 5
c. Electronic licensing 1 2 3 4
d. Digitization of collections 1 2 3 4 5
II Public Service and Outreach
a. Reference, information service and research support 1 2 3 4 5
b. Programming, reference, readers advisory, information and research support to adults
1 2 3 4 5
c. Programming, reference readers, advisory, information and research/homework support to teens1
1 2 3 4 5
d. Programming, reference readers, advisory, information and homework support to children
1 2 3 4 5
e. Instruction in library use, resources and research 1 2 3 4 5
f. Programming and services to special populations (e.g., workplace employees, people with disabilities)
1 2 3 4 5
g. Liaison activities (e.g. with individual faculty, assigned departments, community groups or agencies
1 2 3 4 5
III Technical and Bibliographic Services
a. Cataloguing, database management and organization of information resources (including metadata schemes and Online Public Access Catalogues (OPACs)
1 2 3 4 5
b. Creation and maintenance of bibliographic records 1 2 3 4 5
c. Processing interlibrary loan requests – borrowing and lending
1 2 3 4 5
d. Acquisition, receipt and payment of library materials 1 2 3 4 5
e. Circulation and discharge of library materials 1 2 3 4 5
f. Sorting, shelving and filing of library materials 1 2 3 4 5
g. Bindery and materials processing 1 2 3 4 5
h. Repair and conservation of library materials 1 2 3 4 5
IV Information Technology
a. Library systems, hardware, and software support 1 2 3 4 5
b. Network management and technical support 1 2 3 4 5
c. Web development and applications 1 2 3 4 5
d. Database creation and maintenance (e.g. OPACs) 1 2 3 4 5
V Professional Development / Participation
a. Participation in professional organizations 1 2 3 4 5
b. Attendance at conferences and workshops 1 2 3 4 5
c. Research and publishing in the field of librarianship 1 2 3 4 5
VI Administration and Management
a. Training and development 1 2 3 4 5
b. Managing library units/activities 1 2 3 4 5
APPENDIX D: Individual Survey Instrument 249The Future of Human Resources in Canadian Libraries
c. Supervision and evaluation of personnel 1 2 3 4 5
d. Organizational planning and decision-making 1 2 3 4 5
e. Policy development 1 2 3 4 5
f. Human resources planning and management 1 2 3 4 5
g. Budgeting and financial management 1 2 3 4 5
h. Managing space, facilities and building operations 1 2 3 4 5
i. Fund-raising and donor support 1 2 3 4 5
j. Marketing and public relations 1 2 3 4 5
VII: Other
a. Please specify other important job functions you perform frequently that have not been covered above:
SECTION B: JOB MOBILITY
1. How long have you worked at your current organization? (please add up the total number of years spent in all positions and at all branches, if worked in more than one position or branch within the same organization)
� Less than 1 year
� 2 to 3 years
� 4 to 5 years
� 6 to 10 years
� 11 to 15 years
� More than 15 years
2. Have you ever worked at a different library than the one where you currently work? (do not include different branches within the same library system)
� No
� Yes
2a. Please indicate the total number of different library organizations you have worked in throughout your career. (do not include different branches within the same library system)
_________ Total number of different organizations
2b. Which of the following explain why you left your last place of employment? (please indicate all that apply)
� Moved to another geographical region for personal reasons
� Moved to more desirable geographical location
� Insufficient pay/benefits
� Insufficient opportunity for promotion
� Excess stress from job
� Inability to balance work with my family or personal life
� Dissatisfaction with relationship with superiors
� Dissatisfaction with relationship with library board members (if applicable)
� Dissatisfaction with relationship with peers
250 APPENDIX D: Individual Survey Instrument CANADIAN LIBRARY HUMAN RESOURCE STUDY
� Poor treatment by employer
� Dissatisfaction with job duties
� Dissatisfaction with all aspects of job
� Found a higher level position elsewhere
� Found a better paying job elsewhere
� Found an overall better job elsewhere
� Decided to make a career change
� Went back to school
� Other reason for leaving last place of employment: Please specify _____________________________________
3. To what extent do you agree/disagree with the following statements about why you remain at your current organization:
Extent to Which Agree/Disagree
Strongly Disagree
Strongly Agree
N/A
I remain at my current library because . . .
a. I like my current job 1 2 3 4 5
b. I like my current workplace 1 2 3 4 5
c. I like the people I work with 1 2 3 4 5
d. I feel loyal to my employer 1 2 3 4 5
e. I feel loyal to my library patrons 1 2 3 4 5
f. There are no other jobs available 1 2 3 4 5
g. I could not easily get another job at my current salary/benefits 1 2 3 4 5
h. I have not been successful in finding another job 1 2 3 4 5
i. I do not have the time to look for another job 1 2 3 4 5
j. I am trying to gain experience so I can apply for other positions 1 2 3 4 5
k. My spouse/significant other works in the same geographic area 1 2 3 4 5 8
l. I don’t want to move and disrupt my children’s education or friendships
1 2 3 4 5 8
m. I don’t want to move away from the community in which I live 1 2 3 4 5
n. I have family members or friends in this area who need my attention
1 2 3 4 5
o. Other reason for remaining in current library. Please specify: 1 2 3 4 5
4. Which one of the following library sectors/locations best describes the type of library you are currently working in?
� Canadian university library
� Canadian college/technical institute library (including university colleges)
� Canadian public library
� Canadian consortium or regional library
� Canadian special library: Federal government
� Canadian special library: Provincial government
� Canadian special library: Local government
� Canadian special library: Non-profit library (e.g. hospital, religious institution, charity organization)
APPENDIX D: Individual Survey Instrument 251The Future of Human Resources in Canadian Libraries
� Canadian special library: For-profit library (e.g. business, law firm, bank, crown corporation)
� Canadian school library
� Canadian Non-traditional library workplace (e.g. library consulting firm, vendor, research project)
� U.S. library
� Non-North American library
4a. Is your library currently a member of CARL (Canadian Association of Research Libraries)
� Yes
� No
� Don’t know
CARL Institutions
Carleton UniversityCISTI / ICISTConcordia University LibrariesDalhousie University LibrariesMcGill UniversityMcMaster UniversityMemorial University of Nfld.Library and Archives of CanadaQueen’s UniversitySimon Fraser UniversityUniversité de MontréalUniversité LavalUniversité d’OttawaUniversité du Quebec a MontréalUniversité de SherbrookeUniversity of AlbertaUniversity of British ColumbiaUniversity of CalgaryUniversity of GuelphUniversity of Manitoba LibrariesUniversity of New BrunswickUniversity of Regina LibrariesUniversity of SaskatchewanUniversity of TorontoUniversity of VictoriaUniversity of WaterlooUniversity of Western OntarioUniversity of WindsorYork University Libraries
4b. Is your library currently a member of CULC (Council of Administrators of Large Urban Public Libraries
� Yes
� No
� Don’t know
CULC Institutions
Barrie Public LibraryBibliothèque de GatineauReseau des bibliothèque de LavalBibliothèque Pierre-Georges-RoyBibliothèque municipale de MontréalBibliothèque municipale de LongueuilBrampton Public Library
252 APPENDIX D: Individual Survey Instrument CANADIAN LIBRARY HUMAN RESOURCE STUDY
Burnaby Public LibraryBurlington Public LibraryCalgary Public LibraryCambridge Libraries/GalleriesCoquitlam Public LibraryEdmonton Public LibraryFraser Valley Regional LibraryGreater Victoria Public LibraryHalifax Regional LibraryHamilton Public LibraryKitchener Public LibraryLondon Public LibraryMarkham Public LibraryMississauga Library SystemOakville Public LibraryOshawa Public LibraryOttawa Public LibraryProvincial Information & Library Resources Board (includes all Newfoundland Public Libraries)Regina Public LibraryRichmond Hill Public LibraryRichmond Public LibrarySaskatoon Public LibrarySt. Catharines Public LibrarySurrey Public LibraryThunder Bay Public LibraryToronto Public LibraryVancouver Island Public LibraryVancouver Public LibraryVaughan Public LibraryWindsor Public LibraryWinnipeg Public Library
5. Which of the following different library sectors/locations have you worked in previously (indicate all that apply):
� Canadian university library
� Canadian college/technical institute library (including university colleges)
� Canadian public library
� Canadian consortium or regional library
� Canadian special library: Federal government
� Canadian special library: Provincial government
� Canadian special library: Local government
� Canadian special library: Non-profit library (e.g. hospital, religious institution, charity organization)
� Canadian special library: For-profit library (e.g. business, law firm, bank, crown corporation)
� Canadian school library
� Canadian Non-traditional library workplace (e.g. library consulting firm, vendor, research project)
� U.S. library
� Non-North American library
� None
� Other: Please specify:
APPENDIX D: Individual Survey Instrument 253The Future of Human Resources in Canadian Libraries
5a. What is the major reason why you currently or previously work(ed) in a non-Canadian library?
5b. What is the major reason why you returned to work in Canada?
6. Would you consider working in a U.S. library at some point in the future?
� No
� Yes: Please explain what would attract you to working in a U.S. library
7. Would you consider working in a rural or remote region of Canada?
� No
� Yes: already work in a rural/remote region of Canada
� Yes: I would consider working in a rural/remote region of Canada
Please explain what attracts you to working in a rural or remote region of Canada:
SECTION C: JOB ATTITUDES / JOB SATISFACTION
1. To what extent do you agree/disagree with the following sets of statements about what is important to you in a job and whether that element is part of your library job?
Extent to Which Agree/Disagree
Strongly Disagree
Strongly Agree N/A
a. It is important to me to have a job that is challenging 1 2 3 4 5
b. My job is challenging 1 2 3 4 5
a. It is important to me to have a job that allows me to use information technology skills
1 2 3 4 5
b. My job provides the opportunity to use information technology skills
1 2 3 4 5
a. It is important to me to have a job that allows me to perform a variety of tasks
1 2 3 4 5.
b. My job provides the opportunity to perform a variety of tasks 2 3 4 5
a. It is important to me to have a job that allows me to grow and learn new skills
1 2 3 4 5
b. My job provides the opportunity to grow and learn new skills 1 2 3 4 5
a. It is important to me to have a job that allows me to supervise others
1 2 3 4 5
b. My job provides the opportunity to supervise others 1 2 3 4 5
a. It is important to me to have a job that allows me to motivate others
1 2 3 4 5
b. My job provides the opportunity to motivate others 1 2 3 4 5
a. It is important to me to have a job that allows me to manage a service/department
1 2 3 4 5
254 APPENDIX D: Individual Survey Instrument CANADIAN LIBRARY HUMAN RESOURCE STUDY
b. My job provides the opportunity to manage a service/department
1 2 3 4 5
a. It is important to me to have a job that allows me to perform a leadership role
1 2 3 4 5
b. My job provides the opportunity to perform a leadership role 1 2 3 4 5
Leadership involves taking initiative and making things happen through the effective action of others. Skills important for leadership include negotiating, networking, motivating, fundraising, having a future vision, and a strong community involvement.
a. It is important to me to have a job that allows me to seek out new project opportunities
1 2 3 4 5
b. My job provides the opportunity to seek out new project opportunities
1 2 3 4 5
a. It is important to me to have a job that allows me to participate in decisions about the overall library strategy
1 2 3 4 5
b. My job provides the opportunity to participate in decisions about the overall library strategy
1 2 3 4 5
a. It is important to me to have a job that allows me to participate in decisions about my area
1 2 3 4 5
b. My job provides the opportunity to participate in decisions about my area
1 2 3 4 5
a. It is important to me to have a job in a dynamic and changing environment
1 2 3 4 5
b. My job environment is dynamic and changing 1 2 3 4 5
a. It is important to me to have a job with little work-related stress 1 2 3 4 5
b. In my job I have little work-related stress 1 2 3 4 5
a. It is important to me to have a job with a manageable workload 1 2 3 4 5
b. In my job I have a manageable workload 1 2 3 4 5
a. It is important to me to have a job that allows me to balance my work and family or personal life
1 2 3 4 5
b. In my job I am provided with the opportunity to balance work and family or personal life
1 2 3 4 5
a. It is important to me to have a job that earns a fair salary 1 2 3 4 5
b. In my job I earn a fair salary 1 2 3 4 5
a. It is important to me to have a job that receives adequate benefits (e.g. dental, health, pension plan)
1 2 3 4 5
b. In my job I receive adequate benefits 1 2 3 4 5
a. It is important to me have a job that I feel certain will continue 1 2 3 4 5
b. I feel certain that my job will continue 1 2 3 4 5
a. It is important to me to have a job that allows me to advance my career
1 2 3 4 5
b. In my job I am provided with opportunities to advance my career 1 2 3 4 5
a. It is important to have a job in which I am treated fairly, despite my gender, race, or ethnicity
1 2 3 4 5
b. In my job I am treated fairly, despite my gender, race, or ethnicity
1 2 3 4 5
a. It is important to me to have a job in which I am treated with respect by my superiors
1 2 3 4 5 8
b. In my job I am treated with respect by my superiors 1 2 3 4 5 8
a. It is important to have a job in which I have a good relationship with my supervisor(s)
1 2 3 4 5 8
APPENDIX D: Individual Survey Instrument 255The Future of Human Resources in Canadian Libraries
b. In my job I have a good relationship with my supervisor(s) 1 2 3 4 5 8
a. It is important to me have a job in which I have a good relationship with administration
1 2 3 4 5 8
b. In my job I have a good relationship with administration 1 2 3 4 5 8
a. It is important to me to have a job in which I have a good relationship with library board members
1 2 3 4 5 8
b. In my job I have a good relationship with library board members 1 2 3 4 5 8
a. It is important to me to have a job in which I have a good relationship with professional librarian staff
1 2 3 4 5 8
b. In my job I have a good relationship with professional librarian staff
1 2 3 4 5 8
a. It is important to me to have a job in which I am treated with the same amount of respect as professional librarians1
2 3 4 5 8
b. In my job I am treated with the same amount of respect as professional librarians
1 2 3 4 5 8
a. It is important to me to have a job in which I have a good relationship with paraprofessional staff
1 2 3 4 5 8
b. In my job I have a good relationship with paraprofessional staff 1 2 3 4 5 8
a. It is important to me to have a job that allows me to teach 1 2 3 4 5
b. In my job I am allowed me to teach 1 2 3 4 5
a. It is important to me to have a job in which I am eligible for tenure.
1 2 3 4 5
b. In my job I am eligible for tenure 1 2 3 4 5
a. It is important to me have a job in which I am eligible for a continuing appointment
1 2 3 4 5
b. In my job I am eligible for a continuing appointment 1 2 3 4 5
a. It is important to me to have a job in which I am eligible for research leaves (e.g., sabbaticals)
1 2 3 4 5
b. In my job I am eligible for research leaves 1 2 3 4 5
a. It is important to me have a job that allows me to conduct research and publish
1 2 3 4 5
b. In my job I am allowed to conduct research and publish 1 2 3 4 5
2. Overall, how satisfied are you with your current job?
� Very satisfied
� Satisfied
� Somewhat satisfied
� Dissatisfied
� Very dissatisfied
SECTION D: CAREER DEVELOPMENT/training/education
1. Does your organization subsidize (or reimburse) any portion of the costs associated with your attendance at library association meetings?
� Yes
� No
� Have never attended a library association meeting
� Don’t know
256 APPENDIX D: Individual Survey Instrument CANADIAN LIBRARY HUMAN RESOURCE STUDY
2. Does your organization subsidize, assist, or reimburse your participation in training courses taken outside of your
paid working hours?
� Yes
� No
� Have never participated in this type of training
� Don’t know
3. For the following list, first indicate if you have ever participated in the type / format of training through your current workplace, and if so, the extent to which the training improved your ability to perform your job:
Participated in Extent to Which Improved to Perform Job
Ability Yes NoTo no Extent
To a Great Extent N/A
a. Job-oriented skills training (excluding technology)
1 2 1 2 3 4 5 8
b. Technology skills training 1 2 1 2 3 4 5 8
c. Customer-service related training 1 2 1 2 3 4 5 8
d. Management training 1 2 1 2 3 4 5 8
e. Northern Exposure to Leadership (NEL) 1 2 1 2 3 4 5 8
f. Other leadership training (not including NEL)
1 2 1 2 3 4 5 8
g. Other professional development (e.g. subject specialty, library issues)
1 2 1 2 3 4 5 8
h. Mentorship training 1 2 1 2 3 4 5 8
i. Job rotation 1 2 1 2 3 4 5 8
j. Job sharing 1 2 1 2 3 4 5 8
Please indicate any other types of training that improved your ability to perform your job that we not have covered above.:
4. Please indicate the extent to which you agree/disagree with the following statements about training, career development, and organizational commitment:
Extent to Which Agree/Disagree
Strongly Disagree
Strongly Agree N/A
a. I currently have sufficient education, training, and experience to allow me to perform my job effectively
1 2 3 4 5
b. Given my education, training and experience, I am overqualified for my current position
1 2 3 4 5
c. Given my education, training and experience, I am qualified to move into a higher level position
1 2 3 4 5 8
d. I am interested in participating in technology skills training 1 2 3 4 5
e. I am interested in participating in management skills training 1 2 3 4 5
f. I am interested in participating in business skills training 1 2 3 4 5
g. I am interested in moving into a position with more responsibility 1 2 3 4 5 8
APPENDIX D: Individual Survey Instrument 257The Future of Human Resources in Canadian Libraries
h. My organization provides me with sufficient opportunities to participate in training
1 2 3 4 5
i. I am committed to the goals of this organization 1 2 3 4 5
j. I really feel that this organization’s problems are my own 1 2 3 4 5
k. I would be very happy to spend the rest of my career at this organization
1 2 3 4 5
l. I would be very happy to spend the rest of my career in my current position
1 2 3 4 5
5. In thinking about your future career, what kind of training do you feel would provide you with the most important skills required for you to move into a higher level position? (please be as specific as you can: e.g., training in conflict management, in negotiation, in specific computer programming applications)
6. Are you currently enrolled in a post-secondary program for credit (i.e., leading toward a diploma, certificate, or degree)?
� Yes: Please specify the program you are enrolled in (e.g., Library Technician Diploma/Certificate, B.Ed., B.A., MLIS, LLB, MBA, PhD):
� No
7. Are you interested in obtaining an MLIS degree?
� Yes: What, if anything, has prevented you from obtaining an MLIS degree to date?
� No: Please explain why you are not interested in obtaining an MLIS degree
7a. Thinking back to when you first decided you wanted to be a librarian, what were your three main reasons for choosing the librarian profession?
First Reason:
Second Reason:
Third Reason:
258 APPENDIX D: Individual Survey Instrument CANADIAN LIBRARY HUMAN RESOURCE STUDY
7b. If you knew what you know now about the librarian profession, would you have made the same choice to become a professional librarian?
� Yes, Please explain why you would make the same career choice.
� No, Please explain why you would not make the same choice.
SECTION E1: NEW PROFESSIONAL LIBRARIAN ENTRANTS:
1. To what extent do you agree or disagree with the following statements about the education you received in your Master’s of Library and Information Studies program?
Extent to Which Agree/Disagree
Strongly Disagree
Strongly Agree N/A
a. The program provided me with the general skills and abilities required to effectively perform my current job.
1 2 3 4 5
b. The program provided me with the information technology skills required to effectively perform my current job.
1 2 3 4 5 8
c. The program provided me with the management skills required to effectively perform my current job.
1 2 3 4 5 8
d. The program provided me with the leadership skills required to effectively perform my current job.
1 2 3 4 5 8
e. The program provided me with the business skills required to effectively perform my current job.
1 2 3 4 5 8
f. The program provided me with the problem-solving skills required to effectively perform my current job.
1 2 3 4 5 8
g. The program provided me with a realistic depiction about what it is like to work as a librarian.
1 2 3 4 5
h. The program provided me with a realistic depiction about what it is like to work as a librarian in my library sector
1 2 3 4 5
i. I can apply what I learned in the program to what I do in my librarian job
1 2 3 4 5
2. Overall, how satisfied are you with the quality of education you received in your MLIS program?
� Very dissatisfied
� Dissatisfied
� Neither satisfied nor dissatisfied
� Satisfied
� Very satisfied
APPENDIX D: Individual Survey Instrument 259The Future of Human Resources in Canadian Libraries
3. What, if anything, do you think could be done to improve the quality of education offered in MLIS programs?
4. Which of the following types of libraries and organizations did you apply to when looking for your first professional librarian job? (check all that apply)
� Academic library
� Public library
� Special government library (federal, provincial, or local)
� Special non-profit library (e.g. hospital, religious institution, charity organization)
� Special for-profit library (e.g. business, law firm, bank, crown corporation)
5. Which of the following locations did you apply to when looking for your first professional librarian job? (check all that apply):
� Within the same university where I received my MLIS degree
� Within the same city as the university where I received my MLIS degree
� Within a library located in a different Canadian city than where I received my MLIS degree
� Within a library located in a small town (under 10 000 people) or remote region of Canada
� Within a library located in the United States
� Within a library located outside of North America
� Within another business (not a library)
6a. What is the major reason you applied for a job in a library outside of Canada?
6b. What is the major reason you applied for a job in a non-library organization?
6. After completing your library studies program, how long did it take you to find your first professional librarian position?
� I already had a job lined up before graduating
� 0 to 2 months after graduating
� 3 to 6 months after graduating
� 7 to 12 months after graduating
� More than one year after graduating
8. Was your first professional librarian position full-time or part-time?
� Full-time (typically, more than 29 hours per week)
� Part-Time (typically less than 30 hours per week)
260 APPENDIX D: Individual Survey Instrument CANADIAN LIBRARY HUMAN RESOURCE STUDY
9. Was your first professional librarian position permanent or temporary?
� Permanent (permanent means there is no indication of when the job will end)
� Temporary (temporary means the job will terminate at some specified time)
10. Did you have any experience working in a library before graduating from your library studies program?
� Yes
� No
11. Did you participate in a co-op or practicum (or other type of program that involved alternating periods of work at a library with periods of in-class study) while still enrolled in your library studies program?
� Yes
� No
� Don’t know
12. How long do you expect to continue working at your current work place?
� Less than one year
� 1 to 5 years
� 6 - 10 years
� For remainder of career
� Don’t know
13. What kind of work would you like to be doing 10 years from now?
� The same work I am doing now
� Administrative librarian (e.g., Head Librarian, Director, CEO)
� Management librarian (e.g., Branch or Department head)
� Supervisory librarian
� Non-management librarian
� Non-librarian work
� Other: Please specify:
� Don’t know
APPENDIX D: Individual Survey Instrument 261The Future of Human Resources in Canadian Libraries
SECTION E2: NEW ENTRANTS TO LIBRARY
1. To what extent do you agree or disagree with the following statements about the education you received in your library technician program?
Extent to Which Agree/Disagree
Strongly Disagree
Strongly Agree N/A
a. The program provided me with the general skills and abilities required to effectively perform my current job.
1 2 3 4 5
b. The program provided me with the information technology skills required to effectively perform my current job.
1 2 3 4 5 8
c. The program provided me with the management skills required to effectively perform my current job.
1 2 3 4 5 8
d. The program provided me with the leadership skills required to effectively perform my current job.
1 2 3 4 5 8
e. The program provided me with the business skills required to effectively perform my current job.
1 2 3 4 5 8
f. The program provided me with the problem-solving skills required to effectively perform my current job.
1 2 3 4 5 8
g. The program provided me with a realistic depiction about what it is like to work in a library.
1 2 3 4 5
h. The program provided me with a realistic depiction about what it is like to work in my library sector
1 2 3 4 5
i. I can apply what I learned in the program to what I do in my library job
1 2 3 4 5
2. Overall, how satisfied are you with the quality of education provided in your library technician program?
� Very dissatisfied
� Dissatisfied
� Neither satisfied nor dissatisfied
� Satisfied
� Very satisfied.
3. What, if anything, do you think could be done to improve the quality of education offered in library technician programs?
4. After completing your library technician program, how long did it take you to find your first library technician position?
� I already had a job lined up before graduating
� 0 to 2 months after graduating
� 3 to 6 months after graduating
� 7 to 12 months after graduating
� More than one year after graduating
5. Did you have any experience working in a library before graduating from your library technician program?
� Yes
� No
262 APPENDIX D: Individual Survey Instrument CANADIAN LIBRARY HUMAN RESOURCE STUDY
6. How long do you expect to continue working at your current work place?
� Less than one year
� 1 to 5 years
� 6 - 10 years
� For remainder of career
� Don’t know
SECTION E3: MID-CAREER AND SENIOR LIBRARIANS
1. To what extent do you agree or disagree with the following statements about how your job has changed in the past 5 years:
Extent to Which Agree/Disagree
Strongly Disagree
Strongly Agree
Compared to 5 years ago…
a. My job is currently more interesting 1 2 3 4 5
b. My job is currently more challenging 1 2 3 4 5
c. My job is currently more enjoyable 1 2 3 4 5
d. My job is currently more rewarding 1 2 3 4 5
e. My job is currently more stressful 1 2 3 4 5
g. My job currently requires more skill 1 2 3 4 5
f. I am currently more concerned about my job security 1 2 3 4 5
h. I am currently required to learn more new tasks 1 2 3 4 5
i. I am currently required to perform more difficult tasks 1 2 3 4 5
j. I am currently required to perform more high tech tasks 1 2 3 4 5
k. I am currently required to perform a wider variety of tasks 1 2 3 4 5
l. I am currently required to perform more routine tasks 1 2 3 4 5
m. I am currently required to work harder 1 2 3 4 5
n. I am currently required to perform more managerial functions 1 2 3 4 5
o. I am currently required to assume more of a leadership role 1 2 3 4 5
p. I am currently required to perform more business functions 1 2 3 4 5
q. I am currently required to perform more tasks once done by paraprofessional staff
1 2 3 4 5
r. I am currently less motivated to do my work 1 2 3 4 5
2. What, if anything, would increase your motivation to perform your work?
APPENDIX D: Individual Survey Instrument 263The Future of Human Resources in Canadian Libraries
3. What kind of work do you see yourself performing in your final working years?
� The same work I am doing now
� Administrative librarian (e.g. head librarian, director, CEO)
4. At what age do you realistically think you will retire from your professional librarian career?
� Earlier than 55
� Between 55 and 60
� Between 61 and 64
� At 65
� After 65
� Don’t know
5. Would you accept an early retirement package if it were offered?
� Yes
� No
� Don’t know
Please explain why you would or would not accept an early retirement package.
6. Are there any conditions that would make you consider delaying your retirement?
� Yes
� No
� Don’t know
� Please specify what conditions would make you consider delaying your retirement:
7. To what extent are you looking forward to retiring from your job as a professional librarian?
� To a great extent
� To some extent
� To no extent
264 APPENDIX D: Individual Survey Instrument CANADIAN LIBRARY HUMAN RESOURCE STUDY
SECTION E4: MID-CAREER AND SENIOR STAFF
1. To what extent do you agree or disagree with the following statements about how your job has changed in the past 5 years:
Extent to Which Agree/Disagree
Strongly Disagree
Strongly Agree N/A
Compared to 5 years ago,
a. My job is currently more interesting 1 2 3 4 5
b. My job is currently more challenging 1 2 3 4 5
c. My job is currently more enjoyable 1 2 3 4 5
d. My job is currently more rewarding 1 2 3 4 5
e. My job is currently more stressful 1 2 3 4 5
f. My job currently requires more skill 1 2 3 4 5
g. I am currently more concerned about my job security 1 2 3 4 5
h. I am currently required to learn more new tasks 1 2 3 4 5
i. I am currently required to perform more difficult tasks 1 2 3 4 5
j. I am currently required to perform more high tech tasks 1 2 3 4 5
k. I am currently required to perform a wider variety of tasks 1 2 3 4 5
l. I am currently required to perform more routine tasks 1 2 3 4 5
m. I am currently required to work harder 1 2 3 4 5
n. I am currently required to perform more managerial functions 1 2 3 4 5
o. I am currently required to assume more of a leadership role 1 2 3 4 5
p. I am currently required to perform more business functions 1 2 3 4 5
q. I am currently required to perform tasks once done by professional librarians
1 2 3 4 5 8
r. I am currently less motivated to do my work 1 2 3 4 5
2. At what age do you realistically think you will retire from working in your library job?
� Earlier than 55
� Between 55 and 60
� Between 61 and 64
� 65
� After 65
� Don’t know
Reformatted 3 and 4
5. Would you accept an early retirement package if it were offered?
� Yes
� No
� Don’t know
Please explain why you would or would not accept an early retirement package.
APPENDIX D: Individual Survey Instrument 265The Future of Human Resources in Canadian Libraries
6. Are there any conditions that would make you consider delaying your retirement?
� Yes
� No
� Don’t know
� Please specify what conditions would make you consider delaying your retirement:
5. To what extent are you looking forward to retiring from your library job?
� To a great extent
� To some extent
� To no extent
SECTION F: DEMOGRAPHIC AND WORKPLACE INFORMATION
1. What is your gender?
� female
� male
2. In what year were you born? 19 _____
3. What is your current relationship status?
� Single (never married)
� Married or living with partner
� Divorced/separated
� Widowed
4. Do you currently have dependent children or dependent adults living with you?
� Yes, dependent children
� Yes, dependent adults
� Yes, both dependent children and adults
� No
5. Do you consider yourself to be a member of a visible minority group? Members of visible minorities are persons of colour or are non-Caucasian in race (excluding Aboriginal peoples). Examples include Chinese, South Asian, East Asian, Middle Eastern, Latin American
� yes
� no
6. Do you consider yourself to be an Aboriginal person (includes status Indian, non-status Indian, Inuit or Métis)
� Yes
� No
266 APPENDIX D: Individual Survey Instrument CANADIAN LIBRARY HUMAN RESOURCE STUDY
7. Do you consider yourself to have a disability that may disadvantage you in employment?
� Yes
� No
8. Is your library located in an urban centre with a municipal population of more than 10,000 people?
� Yes
� No
9. In what province/territory is your library located?
� Alberta� British Columbia� Saskatchewan� Manitoba� Ontario� Quebec� New Brunswick� Nova Scotia� Newfoundland/Labrador� PEI� Yukon� NWT � Nunavut
10. What are the first three digits of your workplace postal code? _____
11. In total, approximately how many paid staff are employed in your library? (include all staff except volunteer workers)
� Less than 5� 5 - 10� 11 - 19� 20 - 50� More than 50
SECTION G: CONCLUDING QUESTIONS
1. What, in your opinion, are the most pressing human resource challenges the library sector will face over the next 5 years and why?
2. Do you have any other comments, questions, or concerns that relate to this study or questionnaire?
CLICK HERE TO FINISH SURVEY-THANKS!
THANK YOU VERY MUCH FOR COMPLETING THIS SURVEY
If you have any questions or comments about this survey or about the 8Rs Canadian Library Human Resource Study, please contact:
APPENDIX E: Director Telephone Interview Guide 267The Future of Human Resources in Canadian Libraries
A p p e n d i x E
Director Telephone Interview Guide
APPENDIX EDIRECTOR TELEHONE INTERVIEW GUIDE
LIBRARY DIRECTOR TELEPHONE INTERVIEW GUIDE
INTERVIEW QUESTIONS
1. (RECRUITMENT) Over the past 5 years has your library experienced any difficulties finding suitable candidates when recruiting new librarians?
NO: Is this because you have not had to hire new librarians or is it because you have not had problems finding qualified librarians?
If the later: have these new librarians been recent graduates or were they positions filled with experienced librarians?
(GO TO QUESTION 2)
YES: What are some of the reasons why you have had problems finding suitable candidates?
PROMPT IF NECESSARY
• Inadequate pool of qualified applicants
• Inadequate education provided to MLIS grads
- Insufficient numbers of MLIS grads- Collective agreement hiring restrictions- Increased competition for librarians in other sectors- Applicants declining job offer because of:
• Geographical location/local cost of living• Insufficient salaries• Unable to offer full-time permanent work
268 APPENDIX E: Director Telephone Interview Guide CANADIAN LIBRARY HUMAN RESOURCE STUDY
In your opinion, are these recruitment challenges also apparent in the broader library sector? In other words are you aware of other libraries experiencing problems in finding qualified librarians?
How do you think these recruitment challenges could be rectified? In other words, how could the problems you’ve mentioned be resolved?
Is your library currently developing any strategies to resolve recruitment problems?
YES: What are these strategies? What resources are you dedicating to these strategies?
2. (RETENTION) Apart from librarians who retire, has your library experienced any problems retaining librarians over the past 5 years?
NO: What would you say are the major reasons librarians stay with your library? (GO TO QUESTION 3)
YES: What, in your opinion, are some of the major reasons these librarians have left your library?
Would you say these challenges are also apparent in the broader library sector?
What do you think could be done to prevent librarians from leaving in the future?
Is your library currently developing strategies to resolve problems with retaining librarians?
YES: What do these strategies involve?
3. (RETIREMENT) Do you foresee the retirement of librarians over the next 2-5 years? Are you concerned about having to replace senior skilled librarians
NO: Is this because you have a plan in place to address the loss of skills, knowledge and experience held by retiring librarians?
YES: What are some of the major components of this plan? (GO TO QUESTION 4)
YES: To what extent, if any, do you foresee a skills, knowledge or experience gap developing as these librarians retire?
Do you have a succession plan for how you are going to replace soon-to-retire librarians?
NO: Are you considering such a plan in the near future? (GO TO QUESTION 4)
YES: What are the major components of this plan?
How confident are you that the plan will successfully address the skills and knowledge gap produced by retiring librarians?
4. (EDUCATION) Do you feel that current LIS programs adequately equip graduates with the necessary librarian competencies?
YES: GO TO QUESTION 5
NO: What are the major gaps? What should LIS programs focus more on? Less on?
APPENDIX E: Director Telephone Interview Guide 269The Future of Human Resources in Canadian Libraries
5A. (LIBRARIAN ROLE/FUNCTION CHANGE) In the past decade or so, many libraries have experienced a variety of changes. I would like to ask you about the kinds of changes that have taken place within your library, particularly with regard to what librarians do, and then some questions dealing with what you think are the major causal forces behind these changes, and finally a few questions on what you expect holds for the future.
First, have you eliminated any librarian positions within the past year?
Have you hired fewer librarians than you would have liked to in the past year?
Have the roles and functions of librarians at your library changed much in the past 5 years?
NO: GO TO QUESTION 5B
YES: What are librarians no longer doing? What are they doing that is new?
In your mind have these new duties and roles made the job of the librarian more or less interesting? More or less challenging? Why?
In your mind, have these duties and role changes elevated or deflated the professional status of librarians? Why?
How adequately do you feel librarians have been able to adapt to these changing role re-quirements? What in your mind hinders adaptation? What helps librarians adapt better?
5B. Has the ratio of professional and paraprofessional staff required by the library changed in the past 5 years? For example, do you require more or fewer professional librarians? More or fewer paraprofessional staff?
Are paraprofessionals performing any roles or duties that were once carried out by professional librarians?
IF NO TO 5A AND 5B SKIP TO 5D
5C. (SOURCES OF CHANGE) I’m now going to read you a list of possible sources of change and ask you to comment on whether or not you think they significantly contribute to the changing roles of librarians you have just mentioned.
1. Have declining financial resources been a significant source of change with respect to librarian roles?
Yes: Does your library have a long-range plan to address funding shortages? Are you, for ex-ample, seeking alternative or non-government sources of funding? Are you working with any other libraries or library associations to develop a plan for how the library sector might acquire additional funding?
Overall, do you feel that your library budget enables you to provide a quality work environment for librarians? For example, are you able to provide the salaries, benefits and working conditions that you believe are necessary to meet the needs and interests of current librarians as well as to attract potential new recruits?
2. Has the implementation of new technology been a significant source of change with respect to librarian roles?
YES: What, in your mind, has driven this implementation of new technology?
270 APPENDIX E: Director Telephone Interview Guide CANADIAN LIBRARY HUMAN RESOURCE STUDY
PROMPT IF NECESSARY: Financial considerations, efficiency considerations, competition with other libraries, demand by library patrons
How, if at all, do you foresee future technologies affecting the roles of librarians? What new technologies are you considering or are you aware of that would affect the roles of librarians?
3. Has the implementation of new services or elimination of other services been a significant source of change with respect to changing librarian roles?
4. Has organizational restructuring (for example, organizational flattening, eliminating middle-man-agement positions, consolidating departments) been a significant source of change with respect to librarian roles?
YES: What did this restructuring involve?
To what extent has this restructuring affected the opportunities for librarians to advance their careers? For example, are there fewer or more upward mobility opportunities for librarians?
5. Other than what we have discussed, can you think of anything else that has driven a change in the roles and functions of librarians in the past 5 years?
5D. (FUTURE CHANGE) We have talked about the changing role requirements of librarians in the past, now I would like to ask you about what you think your future staffing requirements will look like.
Within the next five years, do you foresee a decreasing, increasing, or stable demand for professional librarians at your library?
Within the next five years, what kinds of changes do you foresee occurring in the roles and duties de-manded by librarians? What will they be doing that is different and what will remain the same?
Within the next five years, how do you think the ratio of professional and para-professional staff required by the library will change, if at all?
Lastly, just a last few broad questions:
6. What, in your opinion, are the most pressing human resource challenges faced by the library sector today?
7. What role, if any, should the local, provincial or federal government plan in assisting the library sector with these changes?
8. What role, if any, should professional library associations play in assisting the library sector with these challenges?
This concludes our interview. Thank you very much for your time and effort in responding to these questions. Do you have any further comments you would like to add or any questions you would like to ask? We will send you an email with contact information should you have any further comments or questions.
The Future of Human Resources in Canadian Libraries 271
WORKS CITED
8Rs Research Team (2004). The Future of Heritage Work in Canada. <http://www.ls.ualberta.ca/8rs/FutureofHeritageFinalReport.pdf>
Acree, E. K., Epps, S. K., Gilmore, Y., & Henriques, C. (2001). Using professional development as a retention tool for under-represented academic librarians. Journal of Library Administration, 33.1/2 (2001): 45-62.
Alliance of Libraries, Archives and Records Management. (1996). Issues and Responses to Common Training Needs Of People Working In Libraries Archives and Records Management: Results of Interviews carried out by The Alliance of Libraries, Archives and Records Management, Summer, 1996. <http://www.fis.utoronto.ca/people/ affiliated/alarm/inter.htm>.
Association for Library and Information Science Education. (2003). Statistical report. Evelyn Daniel and Jerry Saye, eds. Oak Ridge, Tenn.: ALISE, 2004.
Association of College and Research Libraries: Ad Hoc Task Force on Recruitment and Retention Issues. (2002). Recruitment, retention, and restructuring: human resources in academic libraries. Chicago : ARL.
Bergeron, P., Deschatelets, G.H. & Nauche, B. (1998). Les employés des bibliothèques francophones au Canada et leurs habitudes et pratiques de formation continue. Documentation et Bibliothèques, 44, 16-28.
Blixrud, J.C. (2000). The M.L.S. hiring requirement. Washington, D.C.: Association of Research Libraries, Office of Leadership and Management Services.
Brown, D. (2003) Reports of our labour shortage greatly exaggerated. Canadian HR Reporter, October 2003, 1-4.
Canadian Association of Research Libraries (1982). Libraries and library schools : proceedings of a meeting of the Canadian Association of Research Libraries and the Canadian Council of Library Schools, June 9, 1982, Bessborough Hotel, Saskatoon, Saskatchewan, Canada. Toronto : Canadian Association of Research Libraries.
Canadian Labour Congress. Backgrounder. 2004. http://www.clc-ctc.ca/web/pdf/ BACKGROUNDER.pdf. Accessed 2 Oct. 2004.
272 CANADIAN LIBRARY HUMAN RESOURCE STUDY
Chmielewski, V. (2002) Library Workforce Planning: The Northern Territory Approach Australasian Public Libraries and Information Services, 15(4), 166-9.
Cultural Human Resource Council. (2002). Face of the Future: A Study of Human Resource Issues in Canada’s Cultural Sector. Ottawa: CHRC.
Curran, W. M. (2003). Succession: The Next Ones at Bat. College and Research Libraries, 64, 134-40.
Curry, A. (2000). Canadian LIS education: trends and issues. Education for Information, 18(4), 325-327.
Davidson-Arnott, F. (2003). Library technician education at Seneca College. Library Mosaics, 14(3), 10-11.
Durand, M. (2004). Average Annual Growth Rate of 5% for culture occupations in the culture sector, 1991 to 2002. Focus on Culture, 14, 1-8.
Durand, M. and Daschko, M.W. (2001). Elementary and Secondary Schools: The Role, Challenges and Financial Conditions of School and School Library Resources in Canada. Report. Ottawa, On: Culture, Tourism and the Centre for Education Statistics, Statististics Canada. <http://www.collectionscanada.ca/9/14/index-e.html#b4>.
Finnie, R. (2002) Early labour market outcomes of recent Canadian university graduates by discipline: a longitudinal, cross-cohort analysis. Ottawa: Statistics Canada, Research Paper No 164
Goulding, A., Bromham, B., Hannabuss, S., and D. Cramer. (1999). Supply and demand: the workforce needs of library and information services and personal qualities of new professionals. Journal of Librarianship and Information Science. 31.4, 212-223.
Gower, D. (1997). Measuring the age of retirement. Perspectives on Labour and Income, 11-17.
Handy, F. & Katz, E. (1998). “The Wage Differential between Nonprofit Institutions and Corporates: Getting More by Paying Less.” Journal of Comparative Economics. 26, 246-261.
Harris, R. M. & Marshall, V. (1998). Reorganizing Canadian libraries: a giant step back from the front. Library Trends, 46, 564-81.
Harris, R. and Wilkinson, M.A. (2001). (Re)positioning librarians: how young people view the information sector. Journal of Education for Library and Information Science 42.4, 289-307.
Haycock, K. (2003). The crisis in Canada’s school libraries : the case for reform and re-investment: a report for the Association of Canadian Publishers. Toronto, ON : Association of Canadian Publishers. <http://www.peopleforeducation.com/ librarycoalitio/report03.pdf>
Haycock, K. & Oh, M. (1999). Trends and issues in library and information services in Canada, 1998. The Bowker Annual of Library and Book Trade Almanac, 1999. 44th ed. New York: Bowker.
Higgins, C. and Duxbury, L. (2002) The 2001 National Work–Life Conflict Study: Report One, Ottawa: Health Canada.
Hoffert, P. (1998). The bagel effect : a compass to navigate our wired world. Toronto; New York: McGraw-Hill Ryerson.
The Future of Human Resources in Canadian Libraries 273
Howarth, L. (1998). The role of the paraprofessional in technical services in libraries. Library Trends, 46, 526-539.
Howland, J. (1999). Beyond recruitment: retention and promotion strategies to ensure diversity and success. Library Administration and Management, 13.1, 4-14.
Hughes, K. (2000) Women and corporate directorships in Canada: trends and issues, Canadian Policy Research Network, discussion paper, No. CPRN/01, Ottawa : CPRN.
Human Resources Development Canada. (2002) Knowledge matters: skills and learning for Canadians. <http://www.hrdc-drhc.gc.ca/sp-ps/sl-ca/doc/knowledge.pdf>
Human Resources Development Canada. (2002) Challenges of an ageing workforce: an overview of the issue. Ottawa: Human Resources Development Canada. <http://labour.hrdc-drhc.gc.ca/worklife/pdf/overview-aging-workforce-challenges-en.pdf>
Johnson, P. (1996). Managing changing roles: professional and paraprofessional staff in libraries. Journal of Library Administration, 22.2/3, 79-99.
Kalin, S.W. (2003). The future is not just for librarians, it’s for staff too: who will they be, and where will we find them? <http://www.ala.org/Content/NavigationMenu/ACRL/ Events_and_Conferences/kalin.pdf>.
Lamontagne, F. (2001) Demographic profile of the natural resources sector, Making Skills A National Priority. Ottawa: Canadian Labour and Business Centre.
Leckie, G. & Brett, J. (1997). Job satisfaction of Canadian university librarians: a national survey. College and Research Libraries, 58, 31-47.
Lowe, G. (2000) The quality of work: a people-centred agenda, Don Mills: Oxford University Press.
Martin, Stana (1998) Information technology, employment and the information sector: trends in information employment 1970 – 1995. Journal of the American Society for Information Science, 49: 1053-69.
Maxwell, J and Saunders, R. (2003). Women’s and men’s quality of work in the new Canadian economy. Presentation, Canadian Policy Research Network. <http://www.cprn.org/documents/23472_en.pdf>.
McMullen, K. & Schellenberg, G. (2003). Job Quality in non-profit organizations. Ottawa: Canadian Policy Research Networks.
McMullin, J. A. and Martin Cooke (August 2004) Labour force ageing and skill shortages in Canada and Ontario, CPRN, Research Report W/24.
Millard, D. (2003). Why do we stay? survey of long-term academic librarians in Canada.” Portal: Libraries & the Academy, 3, 99-112.
Montgomery, D.L. (2002). “Happily Ever After: Plateauing as a Means for Long-Term Career Satisfaction.” Library Trends, 50, 702-17.
274 CANADIAN LIBRARY HUMAN RESOURCE STUDY
Morissette, R. and Miguel Rosa, J. (2003). New practices of work and rate of resignations: methodological problems and empirical data for Canada. Ottawa: Canada Statistics, Division of the Analysis of the Companies and the Labour Market.
Nault, F. (2004). Summary public school indicators for the provinces and territories,
1996-1997 to 2002-2003. Statistics Canada, Culture, Tourism and the Centre for Education Statistics Division. Ottawa: Statistics Canada.
Nilsen, K. and McKechnie, L.E.F. (2002). Behind closed doors: an exploratory study of the perceptions of librarians and the hidden intellectual work of collection development in Canadian public libraries, The Library Quarterly, 72(3), 294-325.
Oberg, L., Mentges, M.E., and McDermott, P.N. (1992). The role, status, and working conditions of paraprofessionals: a national survey of academic libraries. College and Research Libraries, 53, 215-238.
People for Education (2002) Fifth Annual Report on Ontario Elementary School Libraries. <http://www.peopleforeducation.com/librarycoalition/Report03.pdf>
Picot, G., Heisz, A. and Nakamura, A. (2001). Job tenure, worker mobility, and the youth labour market during the 1990s. Ottawa: Statistics Canada, Business and Labour Market Analysis Division.
Prins, H. and Gier, W. de. (1992). Image, status and reputation of librarianship and information work: survey conducted by the IFLA Round Table for the Management of Library Associations; prepared for the 1991 IFLA Conference. IFLA Journal, 18(2), 108-118.
Ramangalahy, C., Villalonga, L. & Durocher, F. (2003, November). Le Besoin de relève: résultats d’un projet pilote mené dans des bibliothèques universitaires et publiques. Presented at the 30th Annual ASTED Conference, Gatineau, Quebec.
Robertson, G. (2000). Just what is a library technician? A look at current library technician training in Canada. Feliciter 46(6), 298-301.
Rogers, M. (2003). Tackling recruitment. Library Journal, 128(2), 40-43.
Rose-Ackerman, S. (1996). Altruism, Nonprofits, and Economic Theory. Journal of Economic Literature, 34, 701-28.
Saunders, R. (2004). Passion and commitment under stress: human resource issues in Canada’s non-profit sector: a synthesis report. Ottawa: Canadian Policy Research.
Savard, R. & Laplante, A. (2001). Étude sur les perspectives d’emploi à court terme en biblioéconomie: risqué de penurie de bibliothécaires au Québec. Argus, 30, 25-33.
Schrader, A.M. University of Alberta School of Library and Information Studies Employment Survey, 2000. Jan. 2002. <http://www.slis.ualberta.ca/report00.htm>
Schellenberg, G., and Cynthia Silver (2004) You can’t always get what you want: retirement preferences and experiences. Canadian Social Trends.
The Future of Human Resources in Canadian Libraries 275
Schrader, A.M. and Brundin, M.R. (2002). National core library statistics program: statistical report 1999: cultural and economic impact of libraries on Canada. Ottawa, Ontario: National Library of Canada. <http://www.collectionscanada.ca /obj/r3/f2/02-e.pdf>.
Schwartz, C. ed. (1997). Restructuring academic libraries: organizational development in the wake of technological change. Chicago: Association of Research Libraries.
Statistics Canada. (2000). Canadian Culture in Perspective: A Statistical Overview. Ottawa: Statistics Canada.
Statistics Canada (1999a) 1996 Census Dictionary, Final Edition. Ottawa: Statistics Canada.
Statistics Canada. (2002). Fact sheet on retirement. Perspectives On Labour And Income 14, 2.
Sorensen, M. (2002) The ‘Class of 2000’ two years after graduating: results from the 2002 Alberta universities and university colleges’ graduate employment survey. Edmonton: Alberta Learning. <http://www.advancededucation.gov.ab.ca/college /StudyHighlights.pdf>.
Statistics Canada. (2003). Key labour and income facts: selected charts and analysis. Perspectives on Labour and Income. 15, 4.
Summerfield, M. (2002). CLA’s human resources and succession planning survey: analysis and recommendations” Feliciter, 48.4, 188-89.
Usherwood, B., Proctor, R., Bower, G., Stevens, T. & Coe, C. (2001). Recruit, retain and lead : the public library workforce study. Great Britain ReSource: The Council for Museums, Archives and Libraries. 2001.
Weiler, D. (2000). Libraries face ‘skills gap’: 48% of librarians could retire by 2005. Quill & Quire, 66, 10-11.
Wilder, S.A. (2003). Demographic change in academic librarianship. Washington, D.C.: Association of Research Libraries.
Wilder, S.A. (1999). The age demographics of academic librarians: a profession apart. New York: Haworth Press.
Wu, Shau-chun (2003). Discussing the librarian and libraries’ image problem by analyzing the content of mass media. Journal of Educational Media and Library Sciences, 40(4), 549-65.
Young, P., Powell, R. R., & Young, A.P. (2002). University library directors in the Association of Research Libraries: the next generation, part two. College and Research Libraries, 63, 73-90.