24
The Future of Pensions October 2010 Prepared for CUPE and PSAC
| Date post: | 19-Dec-2015 |
| Category: |
Documents |
| View: | 217 times |
| Download: | 2 times |

The Future of Pensions
October 2010
Prepared forCUPE and PSAC

2ENVIRONICS
Future of Pensions
• National Public Opinion Survey
– Commissioned by CUPE and PSAC
– 2,020 adult Canadians surveyed by telephone, August 6 to 28
– Margin of error +/- 2.2 percentage points at the 95% confidence level– Margin of error for Atlantic Canada +/-6.1 percentage points at the 95% confidence level
– Margin of error for the Prairies +/-4.4 percentage points at the 95% confidence level
– Margin of error for British Colombia +/-6.2 percentage points at the 95% confidence level

3ENVIRONICS
Support for increasing CPP benefits is widespread
Support for increasing CPP benefitsBy income 2010
100K plus
80 to 100K
60 to 80K
30 to 60K
<30K
Total 37 41 10 7 6
38 40 8 5 9
41 41 8 5 5
38 42 9 7 3
36 45 9 8 2
35 36 15 10 4
Strongly support
Support
Oppose
Strongly oppose
dk/na
Q. Recently there has been talk about expanding the CPP to help people save more for retirement. The CPP covers almost all workers. The amount that individual workers and employers pay into the plan would increase slowly over the next several years to provide higher retirement benefits from the CPP. Generally speaking do you support or oppose increasing Canada Pension Plan benefits? Is that strongly or somewhat?
Atlantic: 41% strongly support, 43% support
Prairies: 35% stronglysupport, 43% support
BC: 40% strongly support,36% support

4ENVIRONICS
Rate of changes to Canada’s pension system felt to be too slow
Q. As far as you know, are policy-makers moving too fast, too slow, or at the right pace in their efforts to deal with changes to Canada’s pension system?
Rate of changes to Canada’s pension systemBy age 2010
60 plus
50 to 59
40 to 49
30 to 39
18 to 29
Total 6 20 50 2 22
9 25 40 1 25
7 19 46 3 26
4 18 52 3 23
5 18 55 2 20
4 20 56 2 17
Too fast
Just right
Too slow
Not aware of changes
dk/na
Atlantic: 3% too fast, 50% too slow, 21% just right
Prairies: 4% too fast, 46% too slow, 20% just right
BC: 6% too fast, 40% too slow, 26% just right
5ENVIRONICS
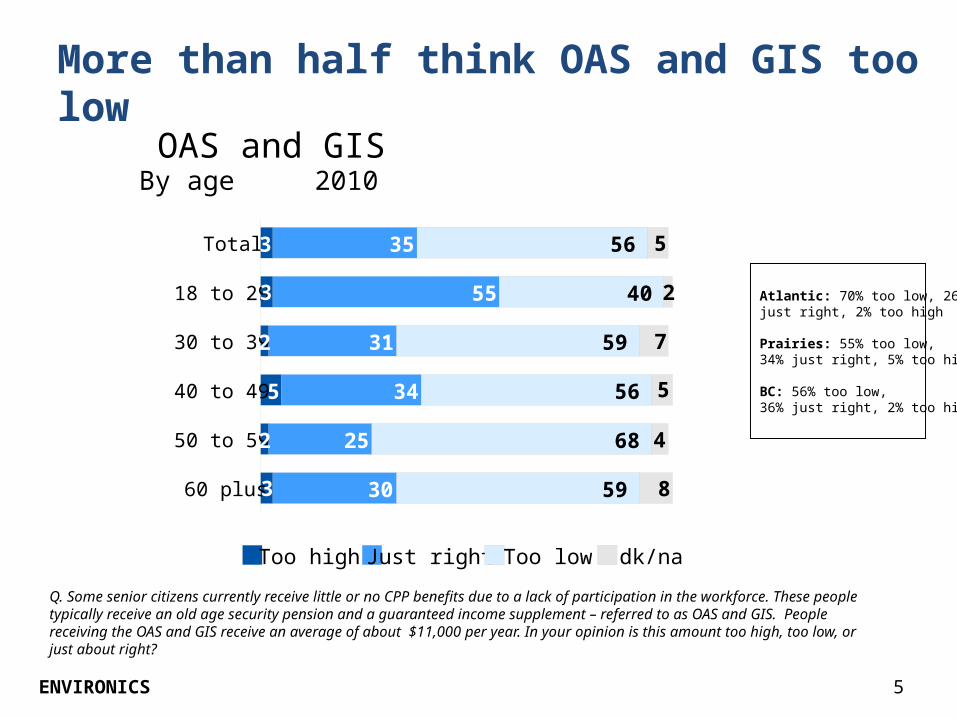
More than half think OAS and GIS too low
OAS and GISBy age 2010
60 plus
50 to 59
40 to 49
30 to 39
18 to 29
Total 3 35 56 5
3 55 40 2
2 31 59 7
5 34 56 5
2 25 68 4
3 30 59 8
Too high Just right Too low dk/na
Q. Some senior citizens currently receive little or no CPP benefits due to a lack of participation in the workforce. These people typically receive an old age security pension and a guaranteed income supplement – referred to as OAS and GIS. People receiving the OAS and GIS receive an average of about $11,000 per year. In your opinion is this amount too high, too low, or just about right?
Atlantic: 70% too low, 26%just right, 2% too high
Prairies: 55% too low,34% just right, 5% too high
BC: 56% too low,36% just right, 2% too high

6ENVIRONICS
Large majority support increasing OAS and GIS
Increase to OAS and GIS for those livingbelow poverty lineBy age 2010
60 plus
50 to 59
40 to 49
30 to 39
18 to 29
Total 61 20 7 6 5
53 26 10 8 2
60 23 10 4 3
58 23 7 6 6
65 18 6 5 5
69 13 2 7 9
Support – feels strongly
Support – does not feel strongly
Oppose – does not feel strongly
Oppose – feels strongly
dk/na
Q. It is estimated that approximately 200,000 Canadians live only on the OAS and GIS and are below the poverty line. Knowing this, would you support or oppose increasing the payments to these senior citizens? Do you feel strongly or not?
Atlantic: 74% strongly support, 14% support somewhat = 88% support
Prairies: 60% strongly support, 17% support somewhat = 77% support
BC: 58% support strongly, 22% support somewhat = 80% support
7ENVIRONICS
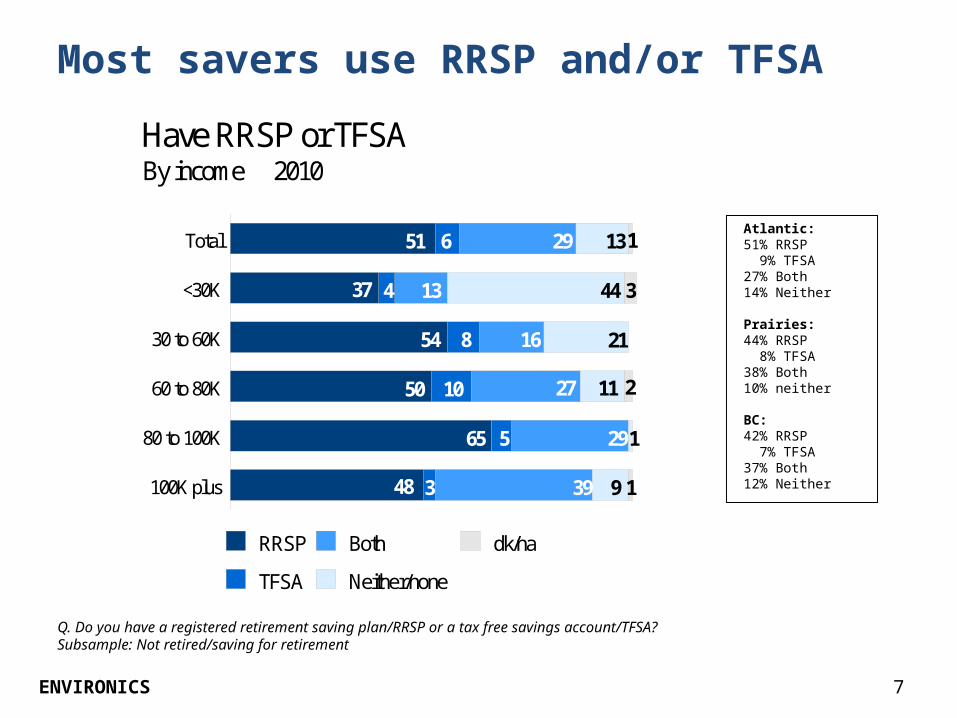
Most savers use RRSP and/or TFSA
Q. Do you have a registered retirement saving plan/RRSP or a tax free savings account/TFSA?Subsample: Not retired/saving for retirement
Have RRSP or TFSABy income 2010
100K plus
80 to 100K
60 to 80K
30 to 60K
<30K
Total 51 6 29 13 1
37 4 13 44 3
54 8 16 21
50 10 27 11 2
65 5 291
48 3 39 9 1
RRSP
TFSA
Both
Neither/none
dk/na
Atlantic:51% RRSP 9% TFSA27% Both14% Neither
Prairies:44% RRSP 8% TFSA38% Both10% neither
BC:42% RRSP 7% TFSA37% Both12% Neither
8ENVIRONICS
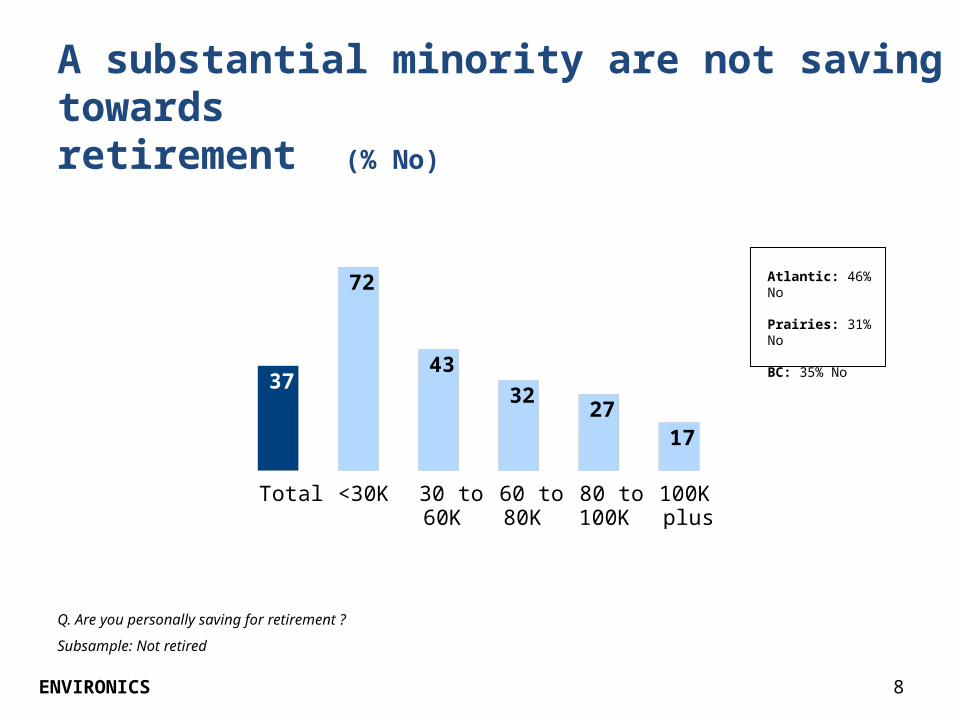
A substantial minority are not saving towardsretirement (% No)
Q. Are you personally saving for retirement ?
Subsample: Not retired
Total <30K 30 to60K
60 to80K
80 to100K
100Kplus
37
72
43
3227
17
Atlantic: 46% No
Prairies: 31% No
BC: 35% No

9ENVIRONICS
…primarily because they cannot afford it
Q. What are some of the reasons why you are not currently saving for retirement [IF HAVE PENSION: outside of your pension]?
Subsample: Not retired and not saving for retirement
dk/na
Other
Need information
Already old/retired/semi-retired
Don’t need to save/have pension at work
Not thinking about retirement/still young/other priorities
Not worried about retirement
Can’t afford/don’t have money 74
9
6
4
1
1
6
3
Atlantic: 70% can’t afford/don’t have money
Prairies: 68% can’t afford/don’t have money
BC: 81% can’t afford/don’t have money

10ENVIRONICS
More than half of Canadians say their income is not always sufficient to cover essentials
Q. Thinking about your household expenditures on essentials (rent or mortgage payments, utilities, or food and clothing), would you say your current household income is always sufficient, is often sufficient or is rarely sufficient to meet these essential expenditures?
Always Often Rarely Never dk/na
44 4132
41
2115
2 1 3
2001 2010
n/a
Atlantic:40% Always41% Often16% Rarely
Prairies:45% Always38% Often13% Rarely
BC:49% Always30% Often16% Rarely

11ENVIRONICS
Canadians tentative about ability to save for retirement
Q. Thinking about your financial future, how confident are you that you will be able to save enough to support yourself in retirement? Are you very confident, somewhat confident, not very confident or not at all confident?
Subsample: Not retired
Confidence in retirement savingBy age 2010
60 plus
50 to 59
40 to 49
30 to 39
18 to 29
Total 25 42 20 12 1
33 44 14 7 1
25 39 24 10 1
17 42 23 16 1
23 41 23 13 0.5
24 40 16 16 4
Very confident
Somewhat confident
Not very confident
Not at all confident
dk/na
Atlantic:27% Very confident42% Somewhat confident17% Not very confident12% Not at all confident
Prairies:29% Very confident45% Somewhat confident13% Not very confident12% Not at all confident
BC:25% Very Confident36% Somewhat confident22% Not very confident13% Not at all confident
12ENVIRONICS
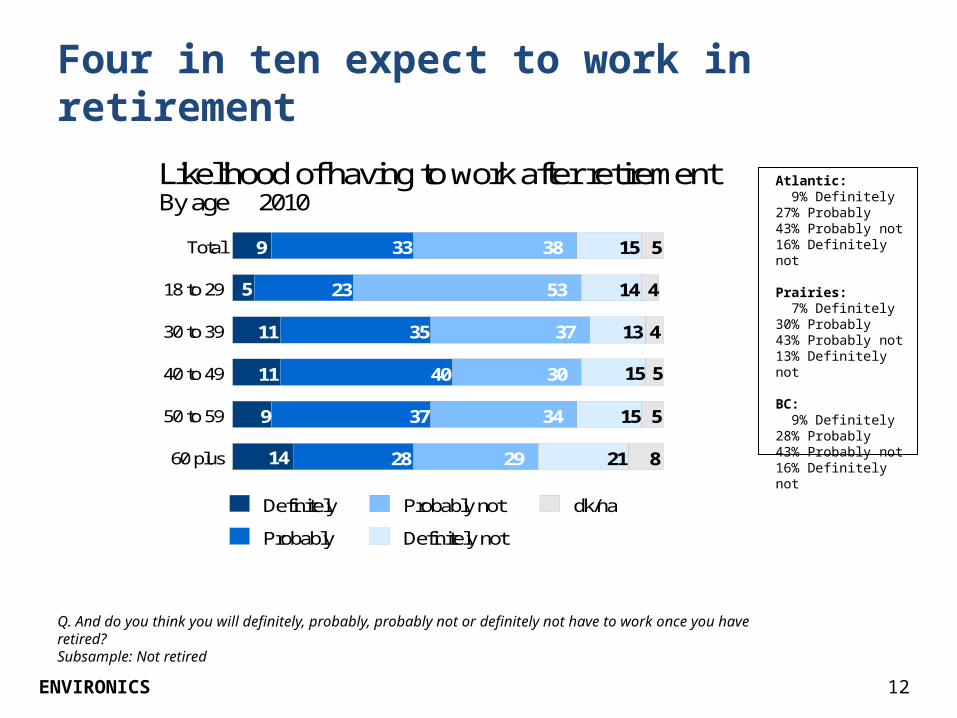
Four in ten expect to work in retirement
Likelihood of having to work after retirementBy age 2010
60 plus
50 to 59
40 to 49
30 to 39
18 to 29
Total 9 33 38 15 5
5 23 53 14 4
11 35 37 13 4
11 40 30 15 5
9 37 34 15 5
14 28 29 21 8
Definitely
Probably
Probably not
Definitely not
dk/na
Q. And do you think you will definitely, probably, probably not or definitely not have to work once you have retired?Subsample: Not retired
Atlantic: 9% Definitely27% Probably43% Probably not16% Definitely not
Prairies: 7% Definitely30% Probably43% Probably not13% Definitely not
BC: 9% Definitely28% Probably43% Probably not16% Definitely not
13ENVIRONICS
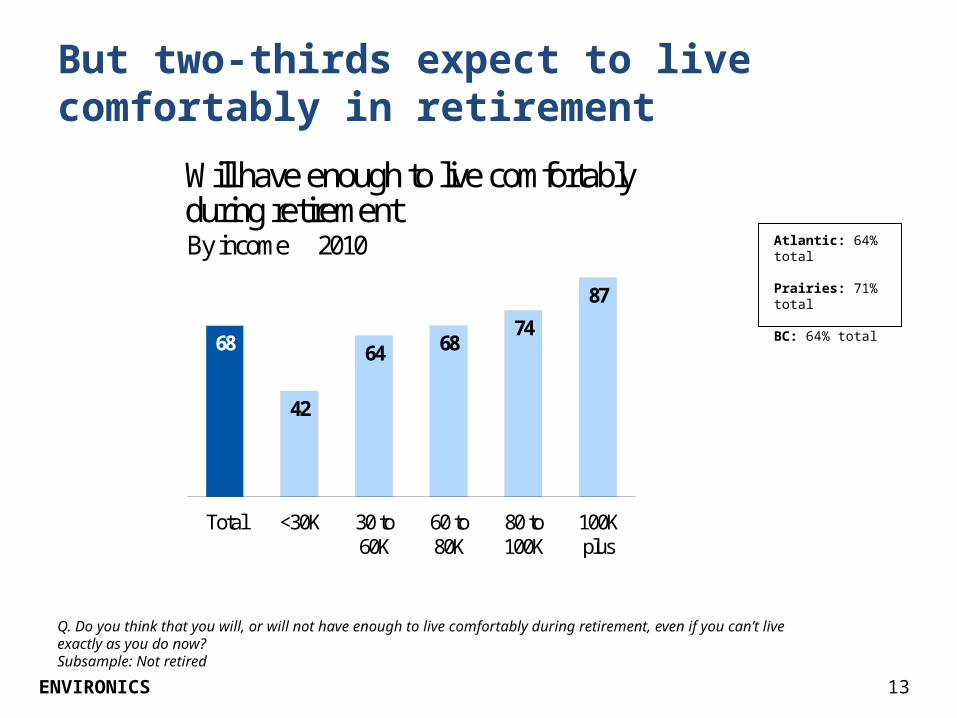
But two-thirds expect to live comfortably in retirement
Q. Do you think that you will, or will not have enough to live comfortably during retirement, even if you can’t live exactly as you do now?Subsample: Not retired
Will have enough to live comfortablyduring retirementBy income 2010
Total <30K 30 to 60K
60 to 80K
80 to 100K
100K plus
68
42
64 6874
87
Atlantic: 64% total
Prairies: 71% total
BC: 64% total
14ENVIRONICS
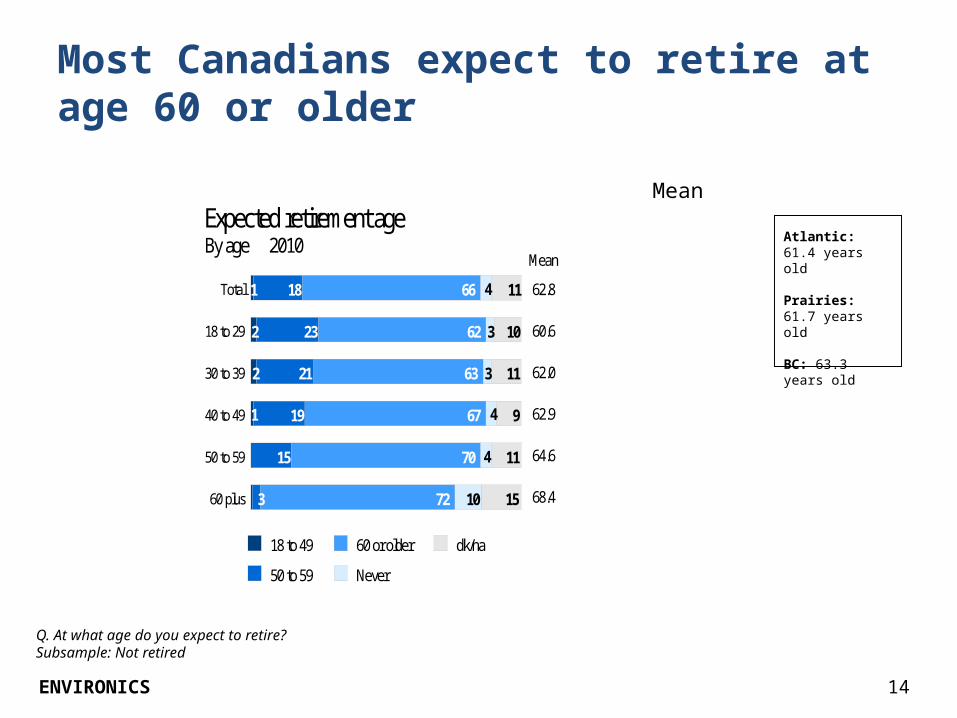
Most Canadians expect to retire at age 60 or older
Expected retirement ageBy age 2010
60 plus
50 to 59
40 to 49
30 to 39
18 to 29
Total 1 18 66 4 11
2 23 62 3 10
2 21 63 3 11
1 19 67 4 9
15 70 4 11
0.53 72 10 15
18 to 49
50 to 59
60 or older
Never
dk/na
62.8
60.6
62.0
62.9
64.6
68.4
Mean
Mean
Q. At what age do you expect to retire? Subsample: Not retired
Atlantic: 61.4 years old
Prairies: 61.7 years old
BC: 63.3 years old
15ENVIRONICS
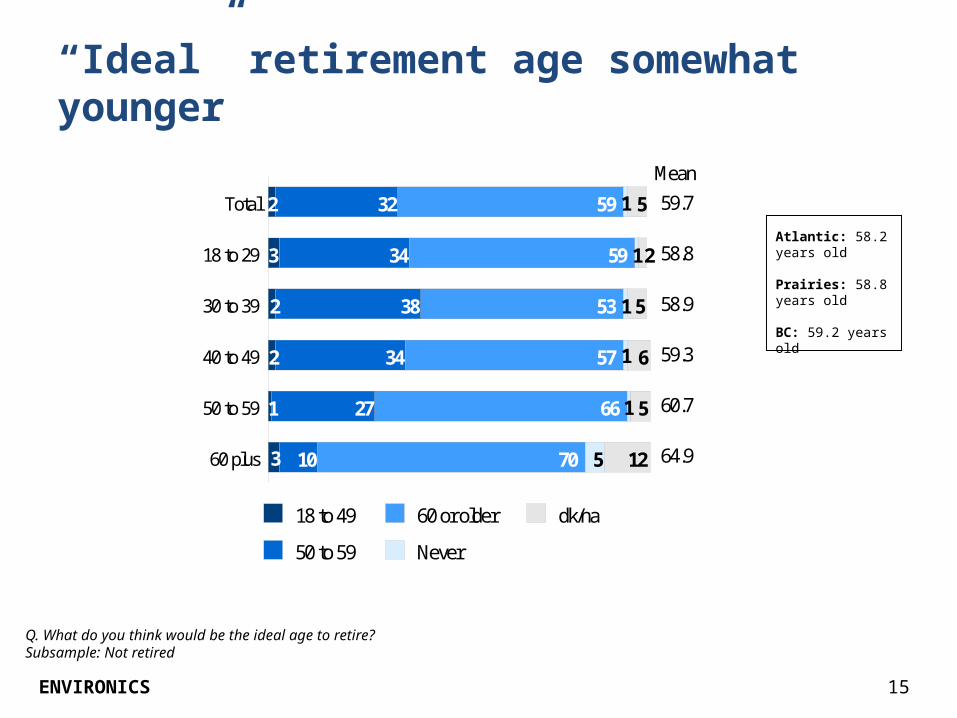
“Ideal” retirement age somewhat younger
Q. What do you think would be the ideal age to retire? Subsample: Not retired
60 plus
50 to 59
40 to 49
30 to 39
18 to 29
Total 2 32 59 1 5
3 34 59 1 2
2 38 53 1 5
2 34 57 1 6
1 27 66 1 5
3 10 70 5 12
18 to 49
50 to 59
60 or older
Never
dk/na
59.7
58.8
58.9
59.3
60.7
64.9
Mean
Atlantic: 58.2 years old
Prairies: 58.8 years old
BC: 59.2 years old
16ENVIRONICS
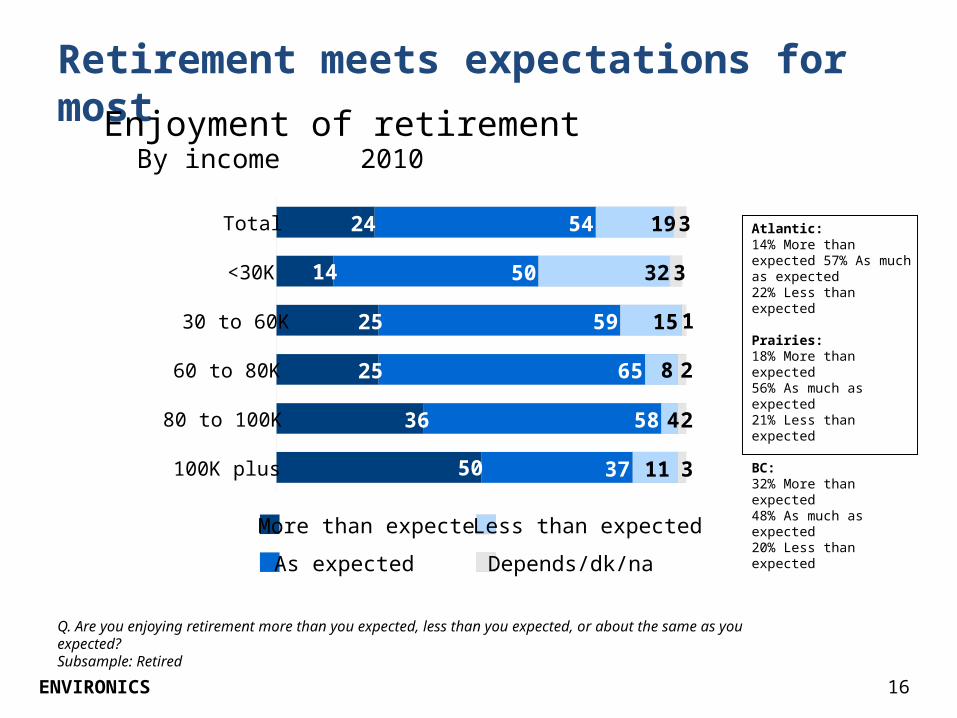
Retirement meets expectations for most
Q. Are you enjoying retirement more than you expected, less than you expected, or about the same as you expected?Subsample: Retired
Enjoyment of retirementBy income 2010
100K plus
80 to 100K
60 to 80K
30 to 60K
<30K
Total 24 54 19 3
14 50 32 3
25 59 15 1
25 65 8 2
36 58 4 2
50 37 11 3
More than expected
As expected
Less than expected
Depends/dk/na
Atlantic:14% More than expected 57% As much as expected22% Less than expected
Prairies:18% More than expected56% As much as expected21% Less than expected
BC:32% More than expected48% As much as expected20% Less than expected
17ENVIRONICS
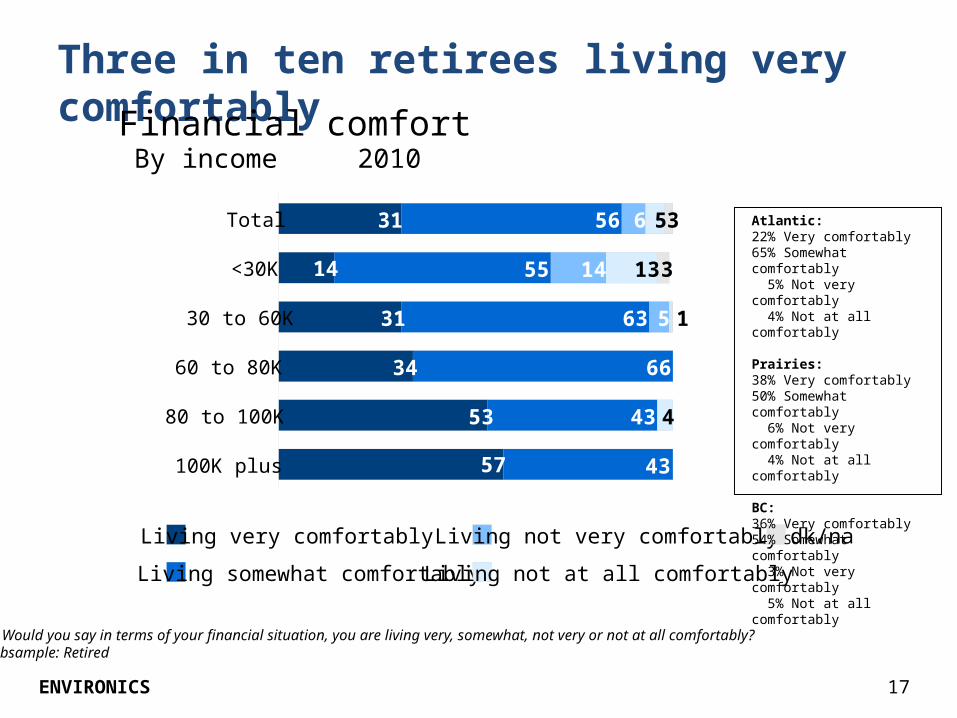
Three in ten retirees living very comfortably
Q. Would you say in terms of your financial situation, you are living very, somewhat, not very or not at all comfortably?Subsample: Retired
Financial comfortBy income 2010
100K plus
80 to 100K
60 to 80K
30 to 60K
<30K
Total 31 56 6 5 3
14 55 14 13 3
31 63 5 1
34 66
53 43 4
57 43
Living very comfortably
Living somewhat comfortably
Living not very comfortably
Living not at all comfortably
dk/na
Atlantic:22% Very comfortably65% Somewhat comfortably 5% Not very comfortably 4% Not at all comfortably
Prairies:38% Very comfortably50% Somewhat comfortably 6% Not very comfortably 4% Not at all comfortably
BC:36% Very comfortably54% Somewhat comfortably 3% Not very comfortably 5% Not at all comfortably

18ENVIRONICS
Most rely on a mix of retirement income sourcesSources of retirement income2010
dk/na
Other
Company/privatepension plan
Other savings/investments
RRSP/TFSA
Canada Pension Plan/other government pension
55
72
54
30
38
34
36
42
2
5
5
3
Anticipated – not yet retired
Current – already retired
Q. Retired: What are your current sources of retirement income?Q. Not retired: When you retire, on what sources of retirement income do you plan on relying?
Atlantic Prairies BC
67% 60% 60%
74% 77% 74%
46% 64% 46%
25% 32% 37%
34% 48% 44%
23% 37% 39%
53% 46% 34%
42% 49% 53%
19ENVIRONICS
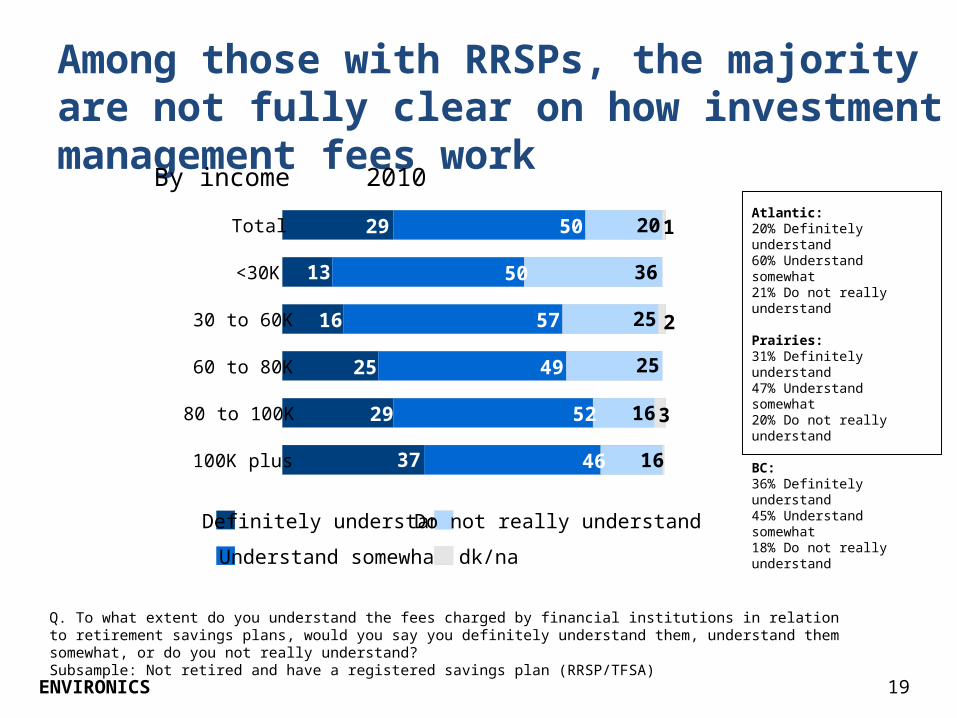
Among those with RRSPs, the majority are not fully clear on how investment management fees work
Q. To what extent do you understand the fees charged by financial institutions in relation to retirement savings plans, would you say you definitely understand them, understand them somewhat, or do you not really understand?Subsample: Not retired and have a registered savings plan (RRSP/TFSA)
By income 2010
100K plus
80 to 100K
60 to 80K
30 to 60K
<30K
Total 29 50 20 1
13 50 36
16 57 25 2
25 49 25
29 52 16 3
37 46 16 0.5
Definitely understand
Understand somewhat
Do not really understand
dk/na
Atlantic:20% Definitely understand60% Understand somewhat21% Do not really understand
Prairies:31% Definitely understand47% Understand somewhat20% Do not really understand
BC:36% Definitely understand45% Understand somewhat18% Do not really understand

20ENVIRONICS
Type of pension held is at odds with preferences
Q. Is your company pension the type that guarantees you a fixed amount of benefits when you retire, known as a defined benefit pension? Or is it one where the amount of benefits you will receive will vary depending on how well the pension fund investments perform, known as a defined contribution pension?Q. In your view, which of these two types of pensions is preferable, defined benefit, which pays a fixed amount when you retire, or defined contribution, where the amount of benefits received varies depending on the performance of the fund?
Subsample: Not retired, has a company or private pension plan
Fixed amount/defined benefit
Benefits vary/defined contribution
dk/na
42
68
39
22 20
10
Actual
Preferred
Atlantic 44% 61% 32% 27% 24% 12%
Prairies 43% 66% 37% 25% 20% 9%
BC 49% 77% 28% 11% 23% 12%
21ENVIRONICS
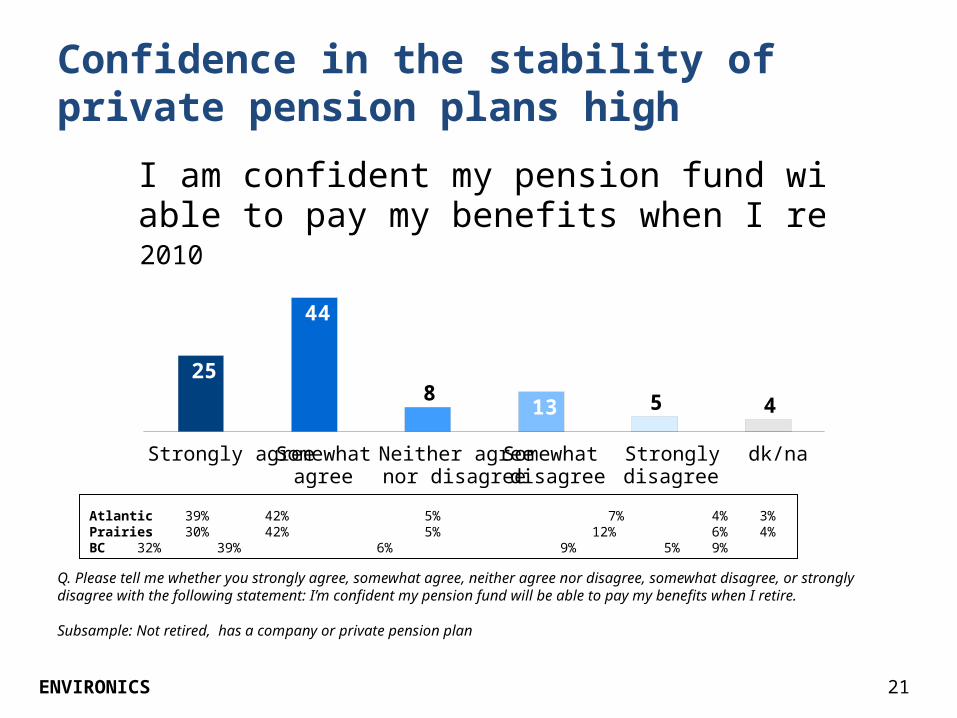
Confidence in the stability of private pension plans high
Q. Please tell me whether you strongly agree, somewhat agree, neither agree nor disagree, somewhat disagree, or strongly disagree with the following statement: I’m confident my pension fund will be able to pay my benefits when I retire.
Subsample: Not retired, has a company or private pension plan
Strongly agree Somewhat agree
Neither agree nor disagree
Somewhat disagree
Strongly disagree
dk/na
25
44
813 5 4
I am confident my pension fund will beable to pay my benefits when I retire2010
Atlantic 39% 42% 5% 7% 4% 3%Prairies 30% 42% 5% 12% 6% 4%BC 32% 39% 6% 9% 5% 9%
22ENVIRONICS
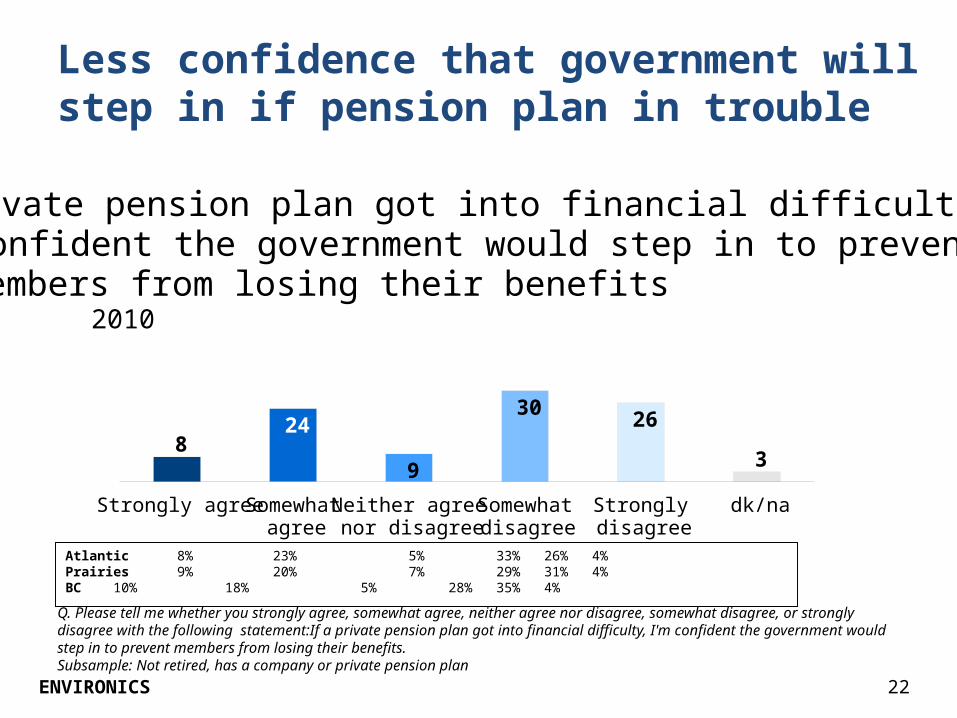
Less confidence that government will step in if pension plan in trouble
Q. Please tell me whether you strongly agree, somewhat agree, neither agree nor disagree, somewhat disagree, or strongly disagree with the following statement:If a private pension plan got into financial difficulty, I'm confident the government would step in to prevent members from losing their benefits. Subsample: Not retired, has a company or private pension plan
Strongly agree Somewhat agree
Neither agree nor disagree
Somewhat disagree
Strongly disagree
dk/na
824
9
30 26
3
If a private pension plan got into financial difficulty,I'm confident the government would step in to preventmembers from losing their benefits2010
Atlantic 8% 23% 5% 33% 26% 4%Prairies 9% 20% 7% 29% 31% 4%BC 10% 18% 5% 28% 35% 4%
23ENVIRONICS
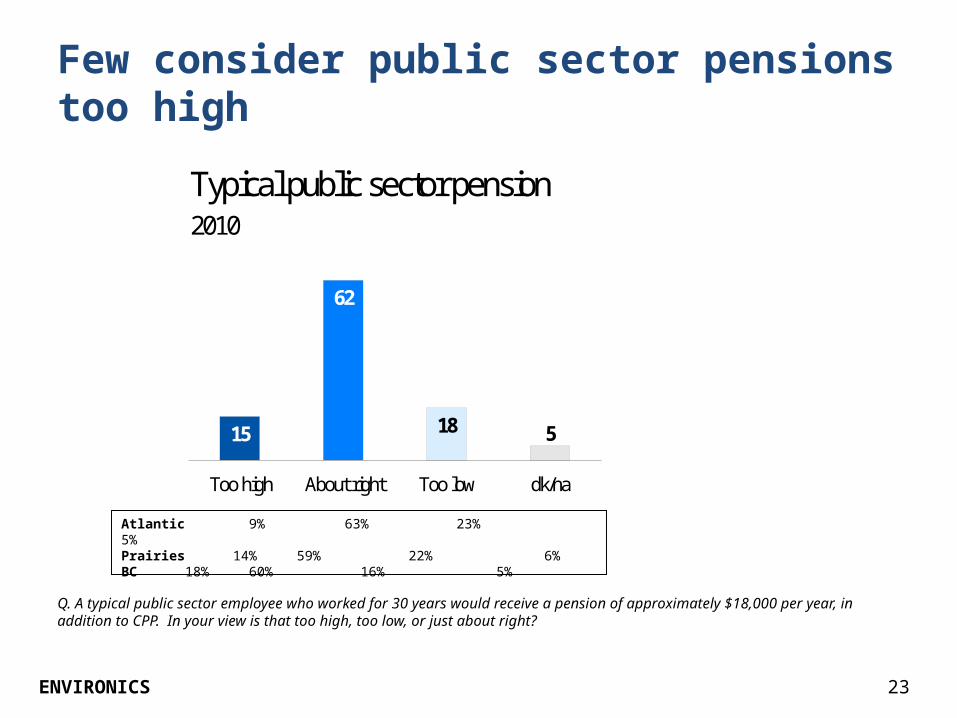
Few consider public sector pensions too high
Typical public sector pension2010
Too high About right Too low dk/na
15
62
18 5
Q. A typical public sector employee who worked for 30 years would receive a pension of approximately $18,000 per year, in addition to CPP. In your view is that too high, too low, or just about right?
Atlantic 9% 63% 23% 5%Prairies 14% 59% 22% 6%BC 18% 60% 16% 5%

www.EnvironicsResearch.ca
Tony CoulsonVice President
Environics Research Group [email protected]
613-230-5089


