28
The future of productivity A wake-up call for Canadian companies Part of Deloitte’s Future of Canada series

The future of productivity A wake-up call for Canadian companies
Part of Deloitte’s Future of Canada series

ContentsExecutive summary ..............................................................................1
What we know about Canada’s productivity .......................................6
What we didn’t know was that they didn’t know .............................10
Overconfident firms ...........................................................................11
Static firms ........................................................................................12
Dynamic firms ...................................................................................13
To help close the productivity gap, close the perception gap .............15
Parting thoughts................................................................................16
Appendix A – Productivity primer ......................................................18
Appendix B – Revisiting earlier recommendations .............................20
About the authors .............................................................................22
Contributors ......................................................................................23
Acknowledgements ...........................................................................23
Endnotes ...........................................................................................24

The future of productivity 1
Executive summary
A new study by Deloitte has yielded some
thought-provoking insights into the source
of Canada’s productivity challenge. Previous
studies have shown that despite a strong dollar, low
interest rates and a stable investment environment, many
of our businesses invest materially less in the research and
development (R&D) and machinery and equipment (M&E)
(including information and communication technology
(ICT)) that are vital to improving productivity. Our new
research suggests that a significant portion of Canadian
firms mistakenly believe they are making competitive levels
of investment when they are not – causing them to slip
behind their peers. This study establishes that attitudes
and behaviours in Canadian firms about their investments
contribute significantly to the persistent and growing
productivity gap between Canada and other countries.

2 The future of productivity
One in three companies don’t know they are underinvesting.What we knew about Canada’s productivityCanada’s productivity challenge has long been a concern of federal and provincial governments. During the past several decades, these governments have made many efforts to modernize policies and provide growth and investment incentives to Canadian firms. As a result, we’ve stabilized inflation, opened the country to trade and foreign investment flows, reformed taxation of capital and introduced some of the most generous R&D incentives in the developed world.
Over the same period, however, our relative productivity performance as a nation has been worsening. In the mid-1980s, the Canadian productivity rate was 91% of the U.S. rate. That figure has since fallen to 80%. Today, the average Canadian worker contributes $47.66 U.S. in GDP per hour compared to $60.77 U.S. per hour in the United States, placing us in the bottom quartile of the OECD.
Deloitte’s first report, published in 2011, identified that Canadian business leaders are more risk averse than those in the United States. Our next study demonstrated that neither company size nor sector composition have a meaningful impact on the country’s overall productivity. The same study did affirm that rapidly growing companies
of all kinds are the greatest contributors to productivity growth. However, the growth track records of Canadian firms revealed yet another inconsistency. While Canada provides an excellent breeding ground for new ideas, alarmingly few Canadian companies are able to maintain high levels of growth. Compared to other countries, more of our start-ups slow down or simply disappear, in part because many of our business leaders are not investing in the activities required to sustain growth.
What we discovered: One in three companies don’t know they are underinvestingIn early 2013, we turned our attention to determining why this chronic underinvestment persists. Deloitte conducted new research with chief decision makers – owners, presidents, vice presidents, directors, general managers, chairpersons, partners or CEOs – at 884 firms from across Canada. The data we collected provided statistically significant samples across firm size, age, sector and geography.
We asked firm leaders about investments in R&D, M&E and ICT as well as the barriers that prevented them from increasing their levels of spending. To help us better understand the factors driving their decisions, we also asked about their attitudes and risk perceptions.
The data revealed considerable variations in spending levels, but the most telling were not based on demographic features. Firms investing above the median for their size and sector contributed 84% of the total national R&D, M&E and ICT spend, with those investing below the median for their size and sector contributing only 16%.
Compared to other countries, more of our start-ups slow down or simply disappear in part because many of our business leaders are not investing in the activities required to sustain growth.

Three types of firms
Interestingly, we learned that most underinvesting firms don’t know they are underinvesting. Over one-third of Canadian businesses believe they are spending at levels equal to or above their peers when, in fact, the investments they are making in themselves fall below this level. We labeled these firms “overconfident,” while the behaviour of two other groups established them as “static” and “dynamic” firms:
• Overconfident firms are Canadian companies investing below the median for their size and sector – but who are unaware of doing so. These firms account for the majority of underinvesting companies, which translates to more than one-third of all Canadian businesses.
• Static firms also underinvest in their businesses compared to their peers. But unlike overconfident firms, static firms are fully aware they are doing so. Static firms are stubborn in their attitudes: while they don’t face any higher barriers than others, they are simply content to invest less.
• Dynamic firms are the firms who knowingly invest above the median for their size and sector, and are well aware of their competitive position. These firms make up a large portion of Canadian companies – and they’re not the source of our productivity problem.
The future of productivity 3
Overconfident Static Dynamic
4 The future of productivity
The Canada-U.S. investment divide could shrink by 29% Our findings suggest that attitudes and perceptions are important for understanding why so many Canadian companies continue to underinvest in improving productivity. To achieve the greatest impact, we must focus, among other things, on changing the self-perceptions of Canada’s overconfident firms. Encouragingly, these organizations share strikingly similar attitudes to dynamic companies: both aggressively pursue innovation and exhibit risk-seeking behaviour. With better information, they could be motivated to increase their investment levels – a decision that could decrease our spending disparity with the United States by 29%.
Static firms, by contrast, are more risk averse, typically less innovative, less likely to operate in broadly competitive marketplaces, and unmoved by incremental cost reductions, government grants and tax breaks. Changing the attitudes of static firms, however difficult, could potentially decrease the investment divide between Canadian and U.S. businesses by approximately 14%.
To help close the productivity gap, close the perception gapWe hold that the combined productivity investments of Canadian businesses serve to drive national productivity growth. Therefore, correcting the perceptions of overconfident firms represents our best opportunity for significantly impacting the productivity problem. The challenge is convincing 36% of our companies to solve a problem they don’t know exists.
The solution is competitive intelligence. All firms – and especially those not aware that their productivity investments fall short – must pay greater attention to competitive data. Statistics Canada can offer support through access to information on Canadian business practices, including investment, innovation, profitability, employment and trade. To share the insights of our survey data, Deloitte is developing a diagnostic tool that will allow companies to understand how their investment levels compare to their peers.
The prevalence of overconfident thinking indicates that the productivity improvement policies and incentives developed in recent decades have fallen short of achieving the desired results. We suggest this was not a question of design, but because these initiatives were not understood as relevant and necessary by overconfident firms. If our hypothesis proves true, changing the behaviour of the more than one in three Canadian companies who fit our overconfident profile will result in significant investment increases and a substantial reduction of our productivity gap. Combined with the earlier recommendations put forward for government, business and academia (see Appendix B), closing the perception gap could have a profound, positive impact on our economy and our future prosperity.

The future of productivity 5
The challenge: Convincing 36% of Canadian businesses to solve a problem they don’t know exists.

6 The future of productivity
What we know about Canada’s productivity
In 2010, Deloitte established a permanent research team dedicated to studying Canadian productivity. Since then, this group has carried out extensive research to better understand the factors behind Canada’s weak productivity performance. Our previous reports – The future of productivity: An eight step game plan for Canada and The future of productivity: Clear choices for a competitive Canada – explored Canada’s productivity problem, challenging assumptions and setting the groundwork for this year’s study. Some of our key findings from these reports follow:
We know we have a problemCanada’s productivity challenge is widely publicized, but many Canadians misunderstand what it means to improve productivity. Improving productivity isn’t about working more hours for less pay. It’s about helping Canadians generate more value per work hour – and typically getting paid more as a result.
For almost 30 years, Canada’s productivity (measured by the GDP generated in an hour by the average worker) has been growing much more slowly that it has in the United States and most other OECD countries. Over this same period, governments have introduced many reasonable policies and incentives – stabilizing inflation, opening the country to trade and foreign investment flows, reforming taxation of capital and introducing some of the developed world’s most generous R&D incentives.
Yet these measures have failed to produce the desired results. In fact, Canada’s relative productivity performance as a nation is worsening. In the mid-1980s, the Canadian productivity rate was 91% of the U.S. rate. That figure has since fallen to 80%. Today, the average Canadian worker contributes $47.66 U.S. in GDP per hour compared to $60.77 U.S. per hour in the United States, placing us in the bottom quartile of the OECD.1
The future of productivity 7
Demographic changes in the years ahead threaten to make the situation even more challenging. Canada’s population is aging and its workforce will soon begin to shrink. If we fail to turn around our performance and achieve rapid and significant improvements in productivity, ours will be the first generation in memory to leave its children less well off. (To learn more about how Canada’s productivity gap threatens our standard of living, see Appendix A).
Canadian managers respond differently to riskCanadian managers tell us that they’re just as likely to take innovation risks as their U.S. counterparts – but many of them fail to follow through with actual investment in their companies. In Deloitte’s first report on productivity, we also showed that Canadian firms with a low tolerance for risk are much more likely than their U.S. counterparts to avoid R&D investment and rely on government support to pursue innovation.
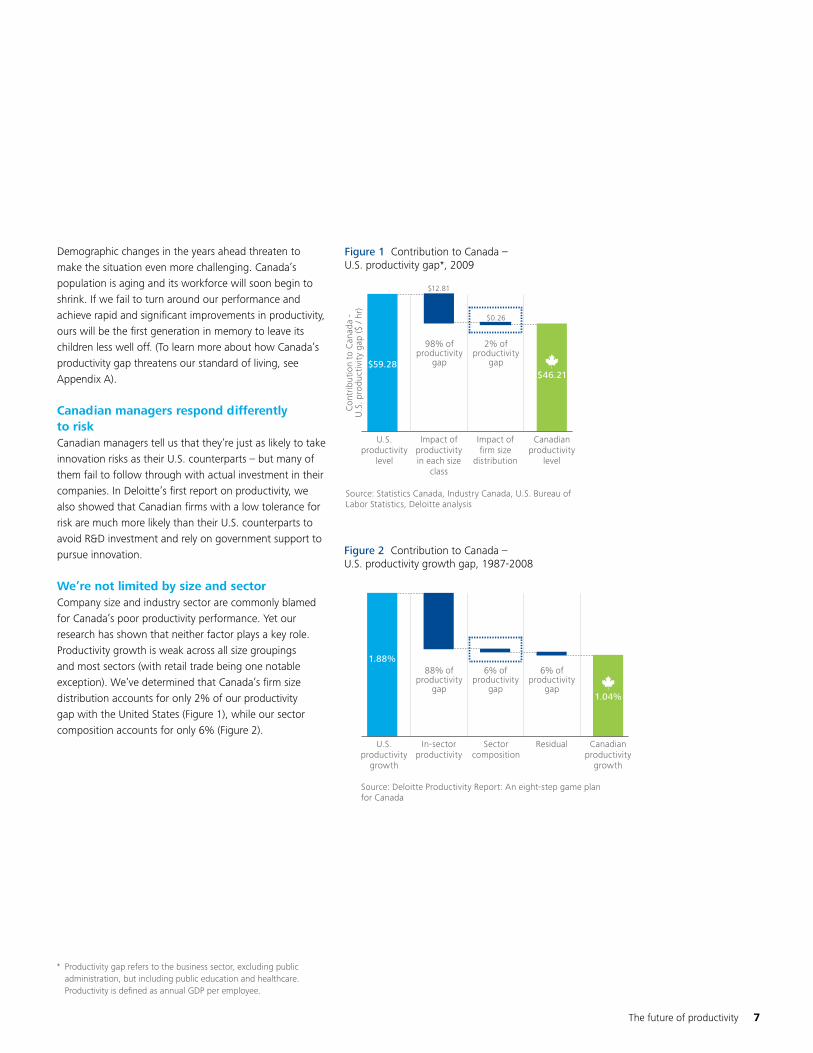
We’re not limited by size and sectorCompany size and industry sector are commonly blamed for Canada’s poor productivity performance. Yet our research has shown that neither factor plays a key role. Productivity growth is weak across all size groupings and most sectors (with retail trade being one notable exception). We’ve determined that Canada’s firm size distribution accounts for only 2% of our productivity gap with the United States (Figure 1), while our sector composition accounts for only 6% (Figure 2).
Figure 1 Contribution to Canada – U.S. productivity gap*, 2009
Source: Statistics Canada, Industry Canada, U.S. Bureau of Labor Statistics, Deloitte analysis
Figure 2 Contribution to Canada – U.S. productivity growth gap, 1987-2008
Source: Deloitte Productivity Report: An eight-step game planfor Canada
* Productivity gap refers to the business sector, excluding public administration, but including public education and healthcare. Productivity is defined as annual GDP per employee.
U.S.productivity
growth
In-sector productivity
Sector composition
Residual Canadian productivity
growth
1.04%
1.88%6% of
productivitygap
88% of productivity
gap
6% of productivity
gap
Con
trib
utio
n to
Can
ada
- U
.S. p
rodu
ctiv
ity
gap
($ /
hr)
$12.81
$0.26
98% of productivity
gap$59.28$46.21
2% of productivity
gap
U.S.productivity
level
Impact of productivity in each size
class
Impact of firm size
distribution
Canadian productivity
level

8 The future of productivity
Canada’s entrepreneurs are among the very best at launching fast-growing companies. Sustaining that growth is another matter.
Firm-level growth is essential to improving productivityCanadian firms that grow rapidly in terms of employment and revenue make disproportionately higher contributions to national productivity. These growing companies are broadly distributed across small, medium and large firms in every sector. And while this may not be a surprising finding, it is an important factor in understanding how to close our productivity gap.
High-growth Canadian firms struggle to sustain that growthRegardless of size or sector, few Canadian firms are able to sustain high levels of growth. Ironically, Canada has one of the OECD’s highest rates of new business entry and produces a greater proportion of young (five years or less) high-growth firms than the United States, Sweden or even startup hotbed, Israel. But as our high-growth firms age, their performance slows and they fail to thrive. Canada’s entrepreneurs may have mastered the art of creating fast-growing businesses with great potential, but they fall short when it comes to sustaining them.
The future of productivity 9
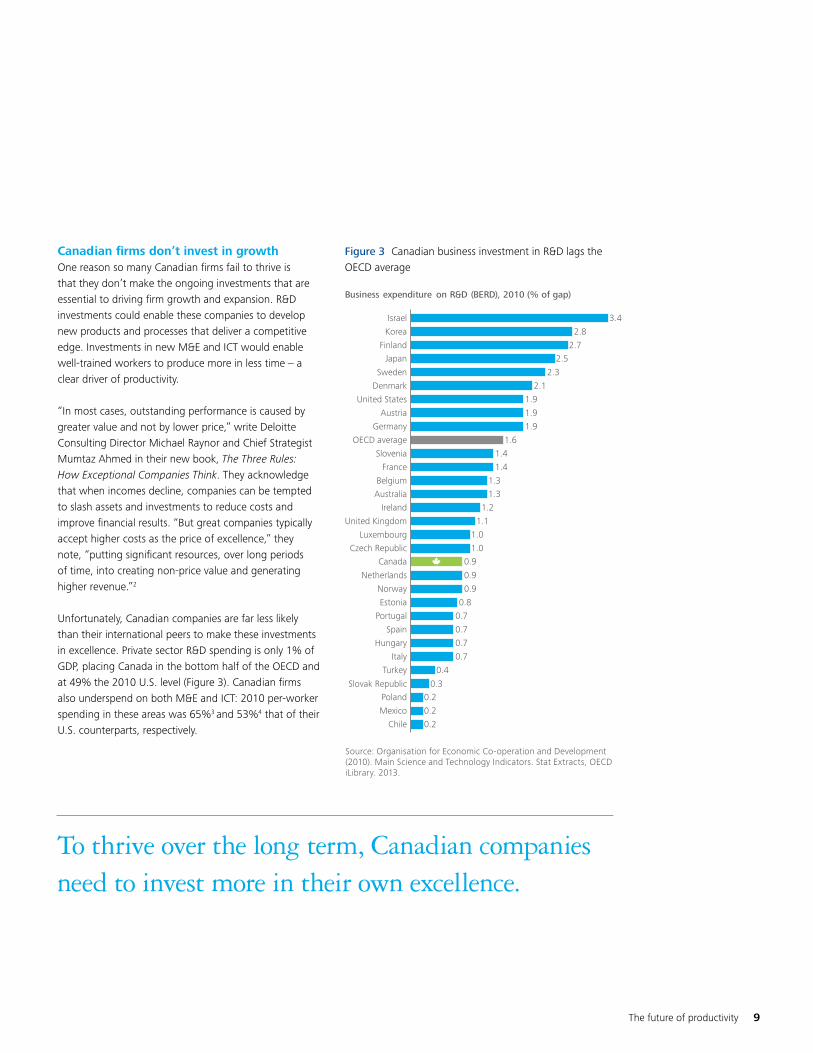
Canadian firms don’t invest in growthOne reason so many Canadian firms fail to thrive is that they don’t make the ongoing investments that are essential to driving firm growth and expansion. R&D investments could enable these companies to develop new products and processes that deliver a competitive edge. Investments in new M&E and ICT would enable well-trained workers to produce more in less time – a clear driver of productivity.
“In most cases, outstanding performance is caused by greater value and not by lower price,” write Deloitte Consulting Director Michael Raynor and Chief Strategist Mumtaz Ahmed in their new book, The Three Rules: How Exceptional Companies Think. They acknowledge that when incomes decline, companies can be tempted to slash assets and investments to reduce costs and improve financial results. “But great companies typically accept higher costs as the price of excellence,” they note, “putting significant resources, over long periods of time, into creating non-price value and generating higher revenue.”2
Unfortunately, Canadian companies are far less likely than their international peers to make these investments in excellence. Private sector R&D spending is only 1% of GDP, placing Canada in the bottom half of the OECD and at 49% the 2010 U.S. level (Figure 3). Canadian firms also underspend on both M&E and ICT: 2010 per-worker spending in these areas was 65%3 and 53%4 that of their U.S. counterparts, respectively.
Figure 3 Canadian business investment in R&D lags the OECD average
Source: Organisation for Economic Co-operation and Development (2010). Main Science and Technology Indicators. Stat Extracts, OECD iLibrary. 2013.
To thrive over the long term, Canadian companies need to invest more in their own excellence.
Business expenditure on R&D (BERD), 2010 (% of gap)
Chile 0.2
0.2
0.20.3
0.4
0.7
0.7
0.7
0.7
0.8
0.9
0.9
1.0
1.0
1.1
1.2
1.3
1.3
1.4
1.4
1.6
1.9
1.9
1.9
3.4
2.8
2.7
2.5
2.3
2.1
0.9
Mexico
PolandSlovak Republic
Turkey
Portugal
Spain
Hungary
Italy
Estonia
Norway
Netherlands
Czech Republic
Luxembourg
United Kingdom
Ireland
Australia
Belgium
France
Slovenia
OECD average
United States
Austria
Germany
Israel
Korea
Finland
Japan
Sweden
Denmark
Canada

What we didn’t know was that they didn’t know
Figure 4 Underinvesting firms
Why do so many Canadian firms show so little interest in investing in their own growth, despite decades of declining productivity and government policies and incentives aimed at addressing the problem? Discovering answers to this question was the aim of our most recent research.
In early 2013, Deloitte surveyed chief decision makers (owners, presidents, vice presidents, directors, general managers, chairs, partners or CEOs) at 884 firms across Canada. Our survey was designed to provide statistically significant samples across company size, age, sector and geography.
We focused our analysis on underinvesting firms to better understand the attitudes and perceptions behind Canada’s lower spending. We defined these firms as those whose investment in R&D, M&E and ICT as a percentage of revenue was less than the median for their size and sector. The bottom half of firms by investment only account for 16% of the total dollar investment reported by our sample (Figure 4).
We also asked respondents about their attitudes and risk perceptions, which led to some compelling findings. We identified two distinct groups of underinvesting firms. The first group, which we called “overconfident” firms, are actually unaware that they’re spending less than their peers. Firms in the second, smaller group are aware they’re underinvesting but untroubled by this fact (Figure 4) – we termed these “static” firms.
Our research showed that these groups’ attitudes and perceptions greatly influenced their decisions to invest in growth. This was particularly clear when they were compared to a third group we labeled “dynamic firms” who are aware they are investing more than the median for their size and sector. More importantly, our analysis suggests a way to substantially improve national productivity growth and the competitiveness of Canadian companies – without radical cultural change or significant new outlays of taxpayer money. How? By encouraging overconfident firms to take a closer look at where they stand relative to their peers.
Overconfident firms think they’re investing more than their peers. They don’t realize they’re actually underinvesting.
10 The future of productivity
Contribution tototal investment
84%
16%
28%StaticAware theyare under-investing
72%OverconfidentUnaware they are underinvesting
Top 50% of firms
Bottom 50%of firms
Total Investment
Firms in the bottom 50%of total investment
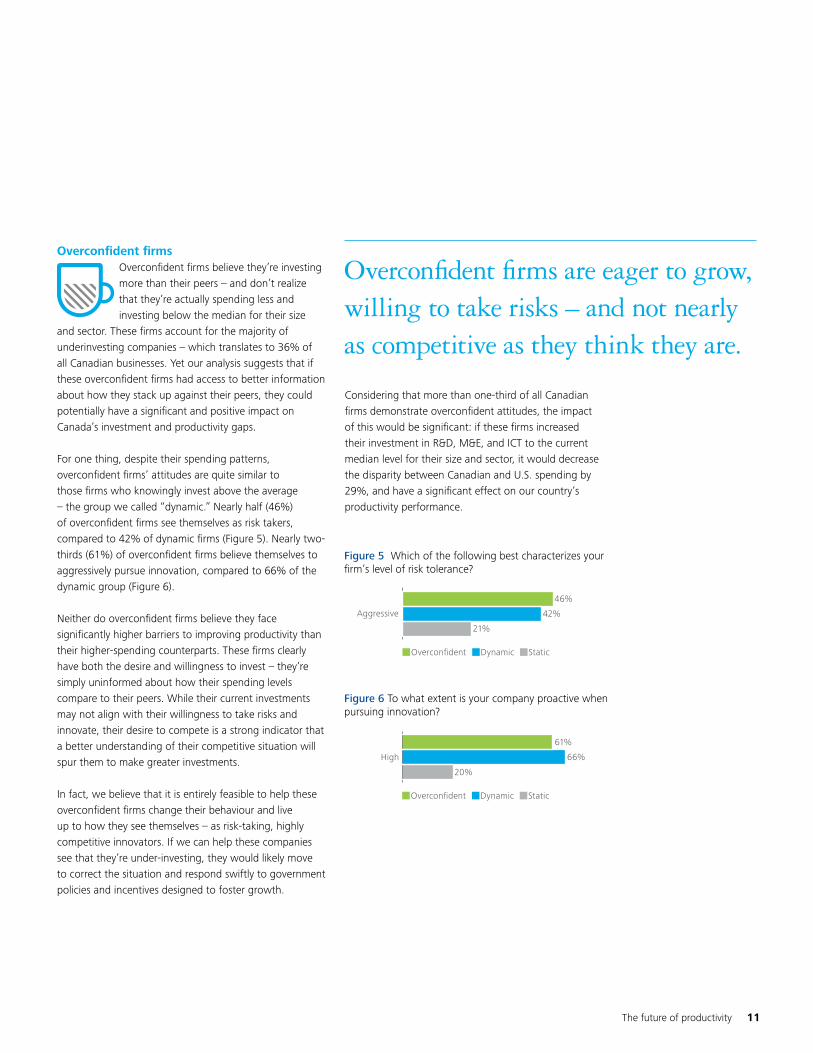
Overconfident firmsOverconfident firms believe they’re investing more than their peers – and don’t realize that they’re actually spending less and investing below the median for their size
and sector. These firms account for the majority of underinvesting companies – which translates to 36% of all Canadian businesses. Yet our analysis suggests that if these overconfident firms had access to better information about how they stack up against their peers, they could potentially have a significant and positive impact on Canada’s investment and productivity gaps.
For one thing, despite their spending patterns, overconfident firms’ attitudes are quite similar to those firms who knowingly invest above the average – the group we called “dynamic.” Nearly half (46%) of overconfident firms see themselves as risk takers, compared to 42% of dynamic firms (Figure 5). Nearly two-thirds (61%) of overconfident firms believe themselves to aggressively pursue innovation, compared to 66% of the dynamic group (Figure 6).
Neither do overconfident firms believe they face significantly higher barriers to improving productivity than their higher-spending counterparts. These firms clearly have both the desire and willingness to invest – they’re simply uninformed about how their spending levels compare to their peers. While their current investments may not align with their willingness to take risks and innovate, their desire to compete is a strong indicator that a better understanding of their competitive situation will spur them to make greater investments.
In fact, we believe that it is entirely feasible to help these overconfident firms change their behaviour and live up to how they see themselves – as risk-taking, highly competitive innovators. If we can help these companies see that they’re under-investing, they would likely move to correct the situation and respond swiftly to government policies and incentives designed to foster growth.
Overconfident firms are eager to grow, willing to take risks – and not nearly as competitive as they think they are.
Considering that more than one-third of all Canadian firms demonstrate overconfident attitudes, the impact of this would be significant: if these firms increased their investment in R&D, M&E, and ICT to the current median level for their size and sector, it would decrease the disparity between Canadian and U.S. spending by 29%, and have a significant effect on our country’s productivity performance.
Figure 5 Which of the following best characterizes your firm’s level of risk tolerance?
Figure 6 To what extent is your company proactive when pursuing innovation?
The future of productivity 11
61%
66%
20%
High
StaticDynamicOverconfident
StaticDynamicOverconfident
46%
42%
21%
Aggressive

12 The future of productivity
Static firmsWe termed another, smaller group of underinvesting firms “static” firms. These organizations are fully aware that they’re
investing less than their peers and they’re comfortable with this choice. We found it interesting that there were relatively few of these static firms – only 14% of our total sample – a counterintuitive result given how frequently the idea of fat and happy “lifestyle” Canadian companies is referenced.
Figure 7 To what extent do each of the following act as barriers to investments to make your company more productive?
Why are these static firms not investing in making them-selves more productive? It’s not because they believe there are significant barriers to doing so. As shown in Figure 7, static firms consider most factors – with the exception of government compliance – to be a less significant barrier to improving productivity than other firms. They are more risk-averse than other companies and less driven to innovate.
Clearly, these firms are making a conscious decision not to invest, and it is very difficult to change this deeply ingrained attitude. Cost reductions, government grants and tax breaks would do little to convince static firms to invest in R&D, M&E, ICT or new skilled labour (Figure 8).
Static firms know they’re underinvesting – and they’re okay with that.
This isn’t to say that static firms are making an inappro-priate business decision. These firms may exist in a niche that allows them to continue to grow in spite of low investment and limited innovation; alternatively, company owners may be choosing not to pursue the company’s full growth potential. Significant support exists for the “niche” rationale: in addition to exhibiting lower risk tolerance and a much weaker focus on innovation, static firms operate in localized, less competitive environments. Only 16% of static firms report high competitor pressure to make improvements, compared to 46% of all other firms (Figure 9), and 50% report that their primary market is local, compared to 36% of all other firms (Figure 10). Knowing that competitive intensity drives productivity, it is not entirely surprising that these firms remain static in their outlook.
Downtime2.90
3.18
3.183.33
3.403.61
4.284.45
4.524.11
3.022.44
3.043.55
3.943.70
Access tofinancing
Employeebuy-in
Access toskilled labour
Governmentcompliance
Internalapproval
Competinginternal priorities
Budgetconstraints
All other firmsStatic
Scale: 1 – not at all, 7 – great extent

The future of productivity 13
Given their entrenched attitudes about self-investing, we believe static firms are unlikely to change their behaviour enough to significantly impact Canada’s productivity. However, if they were to do so, it could decrease the investment divide between Canada and the United States by 14%, and contribute to narrowing the productivity gap.
Dynamic firmsWhile both overconfident and static firms require attention and further investigation, there are many Canadian companies who are knowingly investing above the median
for their size and sector. These dynamic firms may share many attitudes and beliefs with overconfident companies – but their competitive awareness and high levels ofinvestment set them utterly apart.
Dynamic firms are highly innovative and willing to take risks. Indeed, 66% feel they are very aggressive in the pursuit of innovation and 42% describe them-selves as having a high risk tolerance. They are also optimistic – 71% believe that the current state of the Canadian economy is positive or very positive. These firms deserve recognition for their commitment to driving growth through productivity-enhancing investments.
Figure 8 What impact would each of the following have on your firm making positive decisions to invest in areas such as R&D, ICT, M&E, or new skilled labour?
Figure 9 To what extent do your competitors pressure your company to make improvements?
Figure 10 Would you say that your company’s primary market is local, regional, national or international?
Loca50%
36%l
All other firmsStatic
16%
46%High
All other firmsStatic
Decreased price or cost by 25%
Governm
Tax ince
Low
Low
Low
ent funding for 25% of cost
ntives of 25%
20%
29%
4
26%
All other firmsStatic
37%
47%
3%

14 The future of productivity
How do we convince Canadian businesses to solve a problem they don’t know exists? Make sure they have timely, accurate information about their competitive environment – and how they really compare.

The future of productivity 15
To help close the productivity gap, close the perception gap
Our research indicates that more than one in three Canadian companies is what we’ve termed “overconfident.” They’re eager to grow, willing to take risks – and utterly unaware that they’re not nearly as competitive as they think. As a result, well-crafted government policies may fall on deaf ears and fail to reach firms at the root of the productivity challenge. The question therefore becomes, “How do we convince 36% of Canadian businesses to solve a problem they don’t know exists?”
The answer is surprisingly straightforward: ensure these companies have access to timely, accurate information about their competitive environment and how they compare. Currently, the scale and impact of the information shortage among Canadian businesses is alarming. But benchmarking is a readily available solution to this problem – and a critical activity that all businesses must undertake to ensure they’re investing competitively.
In their book, Raynor and Ahmed write about how vital it is for leaders to have a clear picture of their company’s competitive position and profitability. Yet, they write, “our experience shows that many senior leaders lack that clarity, primarily because companies tend to put too much emphasis on comparing their present selves with their past selves and too often declare victory if they’ve improved. What they forget is that you compete only with your current rivals.”
All firms, particularly those who don’t realize where they really stand, need to get back to basics and pay more attention to competitive data. To make smart decisions, grow and thrive, companies have to be able to understand how their investments in new technology and innovation stack up against those made by comparable firms. It requires a certain amount of courage for a firm to look honestly in the mirror, but to define, execute and maintain a winning strategy, a “no pain, no gain” philosophy must prevail.
Most businesses already gather metrics about their past performance – the focus should be on putting this data in a wider context to gain insight into future requirements. We don’t want Canadian firms to focus on catching up; we want them be active in their thinking with the goal of overtaking their rivals.
Companies can find out what the competition is doing by gathering competitive intelligence and participating in benchmarking studies. Statistics Canada collects a considerable amount of information on Canadian business practices – including investment, innovation, profitability, employment and trade. Last year, the agency took a major step toward making this information more accessible to the Canadian public by introducing free standard downloads from their CANSIM service. Yet many Canadian businesses may be unaware of how this information could help benchmark their investment and strategic decisions against firms of a similar size or in the same industry. We recommend that this information be made more user-friendly by developing access tools that help Canadian businesses assess their current and prospective strategic position.
To further assist Canadian companies in creating an accurate picture of their investment competitiveness, we are developing a diagnostic tool that will draw upon our survey data to help companies understand how their investment levels compare to their peers.

16 The future of productivity
Parting thoughts
After three years of research, we’re convinced that
Canadian businesses aren’t investing sufficiently in
the firm-level improvements that are so essential
to closing the productivity gap. Our latest study suggests that
attitudes and perceptions are effective tools for understanding
why so many Canadian companies are underinvesting in key
areas of their business.
The prevalence of “overconfident” thinking indicates that the
productivity improvement policies and incentives developed in
recent decades have fallen short of achieving the desired results.
We suggest this was not a question of design, but because these
initiatives were not understood as relevant and necessary by
overconfident firms. If our hypothesis proves true, changing the
behaviour of the more than one in three Canadian companies
who fit our overconfident profile will result in significant
investment increases and a substantial reduction of Canada’s
productivity gap. Combined with the earlier recommendations
put forward for government, business and academia (see
Appendix B), closing the perception gap could have a profound,
positive impact on our economy and our future prosperity.

The future of productivity 17
This page has been intentionally left blank.

18 The future of productivity
Appendix A –Productivity primer
In an economic sense, productivity is the amount of value (as measured in contribution to
GDP) created by the average worker in an hour of their time. When we discuss improving
productivity, we’re not talking about working longer hours for lower pay – but about
finding ways to produce greater value in the same amount of time.
Achieving high levels of productivity means thriving firms whose employees produce non-commoditized products that can command a premium in global markets. As a result, highly productive modern economies tend to be characterized by skilled employees who are paid higher wages and enjoy superior working conditions to those of the average worker in less productive economies.
The gap opensIn the early 1980s, Canadian and U.S. productivity levels were comparable. Over the ensuing decade, the rate of growth in Canadian productivity consistently lagged that of the United States, opening a gap between the two countries (Figure 11). This gap was sustained throughout the 1990s and grew rapidly over the next decade. From 2009-2011, U.S. productivity continued to grow at a healthy 2.1% per year, while Canadian productivity grew an average of 1.1% per year. By 2011, Canada’s output per worker was only 78.3% that of the United States.
Canada’s productivity performance is also poor compared to other countries. From 2001–2009, Canada’s annualized labour productivity growth of 0.7% was in the bottom quartile of the OECD, far below traditional comparators like Australia and other small economies like Austria and Israel (Figure 12).
Higher U.S. productivity means the average U.S. worker needs to work fewer hours than the average Canadian to create the same value, as measured by GDP. To put the gap into dollar terms, the average Australian worker generates $2 more per hour than the average Canadian; an American worker, $13 more; and a Norwegian worker, $29 more.
Standard of livingMost economists believe GDP per capita is the single most important factor in determining a country’s overall standard of living. This measure comprises three factors (Figure 13):• The employment rate of the country• The number of hours worked by the average employed
resident of the country• The productivity of the work done by those employed
citizens
Productivity is by far the most important of these three factors. The growth in GDP per worker was responsible for 78% of the total growth in Canada’s GDP per capita between 1976 and 2009.
Canadian employment rates and hours worked have both performed well relative to OECD comparators over the past decade. The obvious conclusion is that productivity growth is our most effective means of improving Canada’s standard of living.
Moreover, changes in Canadian demographics will force us to become more productive if we are to maintain our standard of living, much less improve it. Canada’s population, like that in most advanced economies, is aging. Today the proportion of our population over 65 relative to those 20–64 is 23%. By 2021 it will be 31%; by 2050, it will be 47%. As baby boomers exit the workplace over the next decade, Canada’s employment rate and hours worked will come under intense downward pressure. While some older individuals will defer retirement, they’re expected to work fewer hours, which will drive down the average hours worked per employee. Faced with the unavoidable prospect of a falling employment ratio and a decline in hours worked, we simply must find ways to drive higher productivity growth in Canada. If we don’t, our standard of living will surely drop.

The future of productivity 19
Figure 11 Canada and U.S. GDP per worker, indexed to 1981
Figure 12 Labour productivity growth, 2001-2009
Figure 13 Factors influencing standard of living
Employment rate Work effort Productivity Standard of living% of total population x Hours x Output = GDP
that is employed Worker Hour Population
Canada U.S.
90
100
110
120
130
140
150
160
1986 1991 1996 2001 2006
0% 1% 2% 3% 4% 5%
1.9%
0.7%
KoreaRussian Federation
Czech RepublicHungary
U.S.Sweden
JapanAustriaFinland
IsraelUnited Kingdom
AustraliaSpain
PortugalFrance
BelgiumGermany
CanadaNetherlands
NorwaySwitzerland
Denmark

20 The future of productivity
Appendix B – Revisiting earlier recommendations
We have selected the most promising policy ideas put forward in recent years by individuals
and groups from academia, business and government, including the Conference Board
of Canada, Industry Canada, and The Centre for the Study of Living Standards, as well as
public figures like Kevin Lynch and Don Drummond, and earlier reports by Deloitte. Our
goal is to summarize the options we believe would most effectively solve the productivity
problem based on our most recent research findings.
Improving collaboration• Create a cluster strategy: Deloitte believes that a
national clustering strategy is necessary to captureproductivity gains driven by clustering. This strategyis best directed at a regional level, not as a top-down initiative driven by the federal or provincialgovernments. Local businesses, municipal governmentsand nearby universities have the strongest grasp oflocal strengths that can provide the foundation of anew cluster. The federal and provincial governmentsshould collaborate with regional cluster managementassociations to reinforce the region’s advantagesand help create conditions that will support theimplementation of a national strategy.
• Increase collaboration with colleges anduniversities: Canada’s science and engineeringacademics perform admirably in international publi-cation rankings, but our performance in the globalintellectual property statistics suggests that manyof our great ideas are failing to make their way outof the lab. Universities and businesses should seethemselves as part of a larger system that fosters thecommercialization of new ideas.
• Benchmarking: Our new findings suggest thatover one in three Canadian businesses have aninaccurate assessment of their current investmentlevels. For these firms – and even those who areaccurate in their self-assessment – the best practiceof periodically benchmarking against key competitorswill provide important data points for businesses toidentify whether they need to increase investment toimprove productivity.
Fostering an open economy• Liberalize protected industries: Sector specific
protections should be reviewed across all industriesat both the federal and provincial level to ensurethat these protections remain to the benefit ofCanadians. Without a clear public interest argumentfor protections, the goal of government should be toexpose industries to competitive pressure, a move thatwill encourage productivity improvements.
• Reform the Investment Canada Act: The currentreview process of large foreign direct investmentslacks transparency and likely has a chilling effect onforeign investment in Canadian opportunities. Deloittesupports the position of the Conference Board ofCanada that evaluation criteria of the InvestmentCanada Act’s net benefit test be made moretransparent and that the onus of the test be reversed.This would require Industry Canada to provideevidence of a net harm in the case of rejection insteadof the current system, which requires the potentialinvestor to provide proof of a net benefit. These stepswould increase interest among foreign investors,intensify competition, and ultimately strengthenour economy.5
• Conclude priority Free Trade Agreements (FTA): Thegovernment should prioritize finalizing high-potentialFTAs with emerging markets as well as large-scaleFTAs with the European Union, the Trans-PacificPartnership, Japan, Korea and India. These FTAs wouldencourage trade with major emerging economiesthat could potentially serve as new markets for manyCanadian firms.

The future of productivity 21
• Build national and international businesses: Businesses should increase their efforts to enter new markets. Our previous studies have shown that firms who expose themselves to the competitive intensity of a global market are more likely to enjoy higher growth, more innovation and better prospects than those businesses limiting themselves to Canadian markets.
Enabling growth• Reform tax supports for R&D: Currently, the Scientific
Research and Experimental Development (SR&ED) program limits the refundability of R&D tax credits to small, Canadian-controlled private corporations. This criteria creates a disincentive for investment in R&D by large firms at risk of experiencing losses in a given tax year due to competitive pressure or because they are in a cyclical industry. Given current U.S. foreign tax credit rules, the policy also limits the ability of U.S. firms to fully realize the tax benefits from their R&D activities in Canada. Expanding refundability to large and foreign-owned firms would stimulate higher levels of private sector investment in R&D.
• Support venture capital investments and angel tax credits: Provincial governments and the federal government should strongly consider emulating the successful angel tax credit deployed by British Columbia in 2003, which has since served as a driver of early stage fundings, job creation and tax revenue. Federal and provincial governments should also consider how funds earmarked to support venture capital, such as the $400 million allocation announced in the 2012 Federal Budget, can be used to encourage increased private investment and the development of skilled human capital in this space.
• Focus on growth, not size: One of the key recommendations in Deloitte’s last report was to provide incentives for growing companies regardless of size, sector or age. Traditionally, Canadian policies have been designed to focus support on small businesses. Our analysis shows this strategy is unbalanced, as small firms are no more likely than their larger peers to grow rapidly and drive productivity improvements. The result is public policy that potentially focuses on one type of business at the expense of others, while inhibiting productivity.
• Increase investment in R&D, M&E and ICT: Empirical research proves that investment in new capital assets is closely tied to productivity improvements and innovation. Currently, many Canadian firms exhibit very low spending on machinery and equipment, particularly in the realm of ICT; this appears to be a key reason behind Canada’s productivity problem. Increasing investment in key foundational assets will improve productivity for many Canadian firms.
Optimizing Canada’s talent pool• Increase inter-disciplinary learning and foster
entrepreneurship: The Canadian government should encourage universities and other post-secondary institutions to be more flexible regarding interdisciplinary learning, and create specific structures to encourage students to combine their specializations with business and managerial studies. These inter-disciplinary programs support the development of engineers, scientists, artists, musicians and other specialists with an improved understanding of the business context of their specialization, as well as an enhanced ability to build and manage entrepreneurial activities around their innovative ideas.
• Optimize our immigration labour model: Government has an important role to play in supporting the evolution of the workforce to meet the needs of Canada’s business sector. This can be done by improving the responsiveness and flexibility of the immigration system to shifting labour needs. The federal government should also consider improving the simplicity and transparency of foreign credential recognition by implementing an application-processing procedure similar to the employer-driven model used in Australia where candidates must apply to, and have their credentials recognized by, the relevant regulatory body for their occupation before they are able to qualify as an economic class immigrant.6

22 The future of productivity
About the authors
Bill CurrieDeloitte Canada Vice Chair and Americas Managing [email protected]
Bill Currie is Deloitte’s Managing Director for the Americas, a business with over 80,000 employees and almost $14 billion in revenue across 29 countries. He is also Vice Chair of Deloitte Canada and a member of the Canadian Board of Directors. Bill is the author of a number of studies at Deloitte including the previous two productivity reports: The future of productivity – An eight-step game plan for Canada and The future of productivity – Clear choices for a competitive Canada, and has been widely quoted in the Canadian and international media.
Lawrence W. (Larry) ScottDeloitte Canada Vice Chair and Global Chief Strategy Officer [email protected] 416-874-3331
Lawrence (Larry) Scott is a Vice Chair for Deloitte Canada, and the Global Strategy Officer for the global organization Deloitte Touche Tohmatsu Limited (DTTL). He is responsible for strategy, innovation and corporate development. Deloitte is one of the largest professional services providers in the world with nearly 200,000 people in more than 150 countries.

The future of productivity 23
Contributors
Glenn IvesDeloitte Canada Chair and Americas Mining [email protected]
Glenn Ives is the Chair of Deloitte, Canada’s largest professional services firm, and a member of Deloitte’s global Board of Directors. After more than a decade in executive roles at publicly listed mining companies, Glenn joined Deloitte as an Audit partner in 1999. He is the leader of the firm’s North and South American Mining practice and is a primary contributor to the annual Mining Tracking the Trends report.
Terry StuartDeloitte Canada Chief Innovation [email protected]
Terry is Deloitte Canada’s Chief Innovation Officer and a core member of the firm’s Global Innovation Network. Terry also leads Deloitte’s Financial Services Consulting Practice in Canada. In his Chief Innovation Officer Role, Terry is responsible for helping Deloitte create new solutions and offerings across its core services: Assurance and Advisory, Enterprise Risk, Consulting, Tax and Financial Advisory.
Jonathan GoodmanPartner and Co-leader of Monitor Deloitte [email protected]
Jonathan is the co-leader of Monitor Deloitte Canada. Jonathan co-founded Monitor in Toronto in 1987 and was formerly both a senior partner of Monitor Group, and the head of the firm’s global strategy practice. Jonathan has worked closely with executive management at a variety of global corporations to develop business unit and corporate strategies, evaluate and implement M&A opportunities, create alignment of vision through organizational strategy, and to develop and execute value creation programs.
Acknowledgements
The Deloitte Future of Productivity team is indebted to Jesse McWaters and Elliot Morris, who co-authored this paper with the support of Michael Chan, Christopher Ho, Victor Lu, Natasha Sadr and Alexander Wong. We would also like to thank the many interviewees who took the time to speak to us and share their insights on Canada’s productivity challenge.

24 The future of productivity
Endnotes
1. Aggregate Income and Productivity Trends: Canada vs United States, 1961-2011.(2012, June 18). Retrieved May 28, 2013, from http://www.csls.ca/data/ipt1.asp
2. Raynor, M. E., & Ahmed, M. (2013). The three rules: How exceptionalcompanies think.
3. Deloitte analysis based on Statistics Canada and Bureau of Economic Analysis data.
4. Database of Information and Communication Technology (ICT) Investment andCapital Stock Trends: Canada vs United States. (2013, February 28). RetrievedMay 28, 2013, from http://www.csls.ca/data/ict.asp
5. Bloom, M., & Hodgson, G. (2012, October 5). CNOOC/Nexen: Yes, With Conditionsand a Commitment. The Financial Post [Toronto]. Retrieved from http://www.conferenceboard.ca/press/speech_oped/12-10-05/cnooc_nexen_yes_with_conditions_and_a_commitment.aspx
6. Canada. Human Resources and Social Development Canada. ProgramEvaluation Directorate (2007). Formative evaluation of the Foreign CredentialRecognition Program: Final report. Gatineau, Que.: Human Resources and SocialDevelopment Canada.

This page has been intentionally left blank.
The future of productivity 25

productivity.deloitte.ca
Deloitte, one of Canada’s leading professional services firms, provides audit, tax, consulting, and financial advisory services. Deloitte LLP, an Ontario limited liability partnership, is the Canadian member firm of Deloitte Touche Tohmatsu Limited. Deloitte operates in Quebec as Deloitte s.e.n.c.r.l., a Quebec limited liability partnership.
Deloitte refers to one or more of Deloitte Touche Tohmatsu Limited, a UK private company limited by guarantee, and its network of member firms, each of which is a legally separate and independent entity. Please see www.deloitte.com/about for a detailed description of the legal structure of Deloitte Touche Tohmatsu Limited and its member firms.
© Deloitte LLP and affiliated entities. Designed and produced by the Deloitte Design Studio, Canada. 13-3370


