The future of productivity in manufacturing Strategic Labour Market Intelligence Report Anne Green, Terence Hogarth, Erika Kispeter, David Owen Institute for Employment Research, University of Warwick Peter Glover Senior Research Manager UK Commission for Employment and Skills February 2016
Transcript
The future of productivity in manufacturing
Strategic Labour Market Intelligence Report
Anne Green, Terence Hogarth, Erika Kispeter, David Owen
Institute for Employment Research, University of Warwick
Peter Glover
Senior Research Manager
UK Commission for Employment and Skills
February 2016
The future of productivity in manufacturing Strategic Labour Market Intelligence Report
Foreword
In September 2015, UKCES commissioned a consortium of research organisations led by
the Institute for Employment Studies (IES) and SQW to prepare a series of a series of
strategic labour market intelligence reports on the challenges and opportunities for
increasing productivity in four sectors and two cross-cutting themes.
The recent poor productivity performance of the UK economy, especially since the end of
the recession of 2008-09, has become a major concern for economists and policy-makers.
Unlike previous recessions, job losses were not as high as might have been expected1 but
real wages have declined, falling by an average of 1.7 per cent per year between 2008 and
2014.2 Productivity growth too has been very modest: this has become known as the
‘productivity puzzle’. As a consequence, the UK, which was already some way behind many
other major developed economies on this measure, has fallen back even further. The
overall level of productivity in the United States’ economy is now 31 per cent higher than
that of the UK, while Germany’s is 28 per cent higher.3
A number of possible explanations have been put forward for this. Some commentators
believe that businesses hoarded labour on relatively low wages rather than investing in
capital, leading to stagnation in output per worker. Others have suggested risk aversion by
financial institutions has reduced access to loans for investment. The result, it is argued,
has been inefficiency in the allocation of resources in the economy, and an absence of the
‘creative destruction’ processes that can help drive up productivity.
One thing that is apparent from the data that exists on productivity is that it differs from
sector to sector. In recent years, for example, there have been high levels of productivity
growth in the transport equipment and administration/support sectors, but falls in
productivity in the finance and the chemicals and pharmaceuticals sectors4. Any research
or commentary on productivity needs to unpack some of the characteristics of sector
productivity.
1 Unemployment rose from 1.62m in February 2008 to 2.68m in October 2011 on ONS data. 2 Calculated by the Institute of Fiscal Studies based on ONS Annual Survey of Hours and Earnings. See http://www.ifs.org.uk/uploads/Presentations/Understanding%20the%20recession_230915/SMachin.pdf 3 Figures from the Office for National Statistics for GDP per hour worked, 2013. Published at http://www.ons.gov.uk/ons/rel/icp/international-comparisons-of-productivity/2013---final-estimates/info-icp-feb-15.html 4 Cook, J. Pledges, Puzzles and Policies: what’s in store for innovation and enterprise?, Viewpoint Series, SQW, http://www.sqw.co.uk/files/5514/3359/6668/Innovation_policy_post-election_-_Viewpoint_final.pdf
The future of productivity in manufacturing Strategic Labour Market Intelligence Report
In April 2015, Sir Charlie Mayfield, Chairman of the UK Commission for Employment and
Skills (UKCES), set up the Productivity Leadership Group, a cross business group of senior
leaders seeking to find practical ways to increase the productivity of British business.
Business leaders came together in specific sectoral and cross cutting groups to focus on
shared problems and opportunities (Manufacturing, Digitisation, Food and Drink,
Measurement, Better Workplace Practices, Retail and Creative)5.
In September 2015, UKCES commissioned a consortium of research organisations led by
the Institute for Employment Studies (IES) and SQW to prepare a series of a series of
strategic labour market intelligence reports on the challenges and opportunities for
increasing productivity in four sectors and two cross-cutting themes (IES, SQW, the
Institute for Employment Research (IER), and Cambridge Econometrics (CE)). The
research consortium produced six papers:
1. Robin Brighton, Chris Gibbon and Sarah Brown, Understanding the future of productivity in the creative industries, SQW
2. Annette Cox, Graham Hay, Terence Hogarth, Graham Brown, Productivity in the Retail Sector: Challenges and Opportunities, IES
3. Anne Green, Terence Hogarth, Erika Kispeter, David Owen, The future of productivity in manufacturing, Institute for Employment Research, University of Warwick
4. Terence Hogarth and Erika Kispeter, The future of productivity in food and drink manufacturing, Institute for Employment Research, University of Warwick
5. David Mack-Smith, James Lewis, Mark Bradshaw, State of Digitisation in UK Business, SQW
6. Penny Tamkin and Ben Hicks, The Relationship between UK Management and Leadership and Productivity, IES.
We would like to thank the following UKCES colleagues for their assistance with the delivery
of the project: Vicki Belt, Duncan Brown, Richard Garrett, Peter Glover, Hayley Limmer,
Aoife Ni Luanaigh.
Penny Tamkin (IES), Michael Frearson (SQW), Susan Mackay (SQW)
Project leadership team
5 The findings of this group have now been reported ( see https://howgoodisyourbusinessreally.co.uk/ )
Table 2.1 Aggregation of manufacturing industries (2-digit) according to level of technological intensity (ordered by SIC code within levels) .................... 13
Figure 2.2 Size profile of businesses in manufacturing in the UK .............................. 14
Figure 2.3 Gross value added in manufacturing, 1990-2014 (constant prices) ........ 15
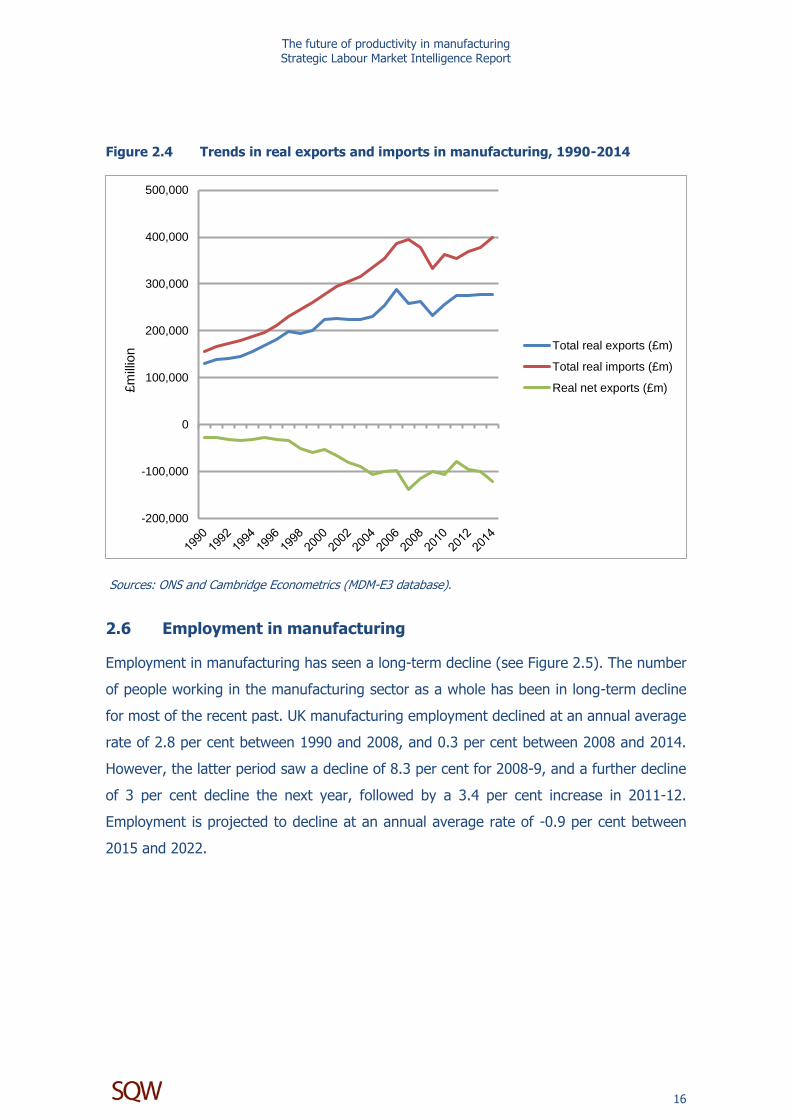
Figure 2.4 Trends in real exports and imports in manufacturing, 1990-2014 ........... 16
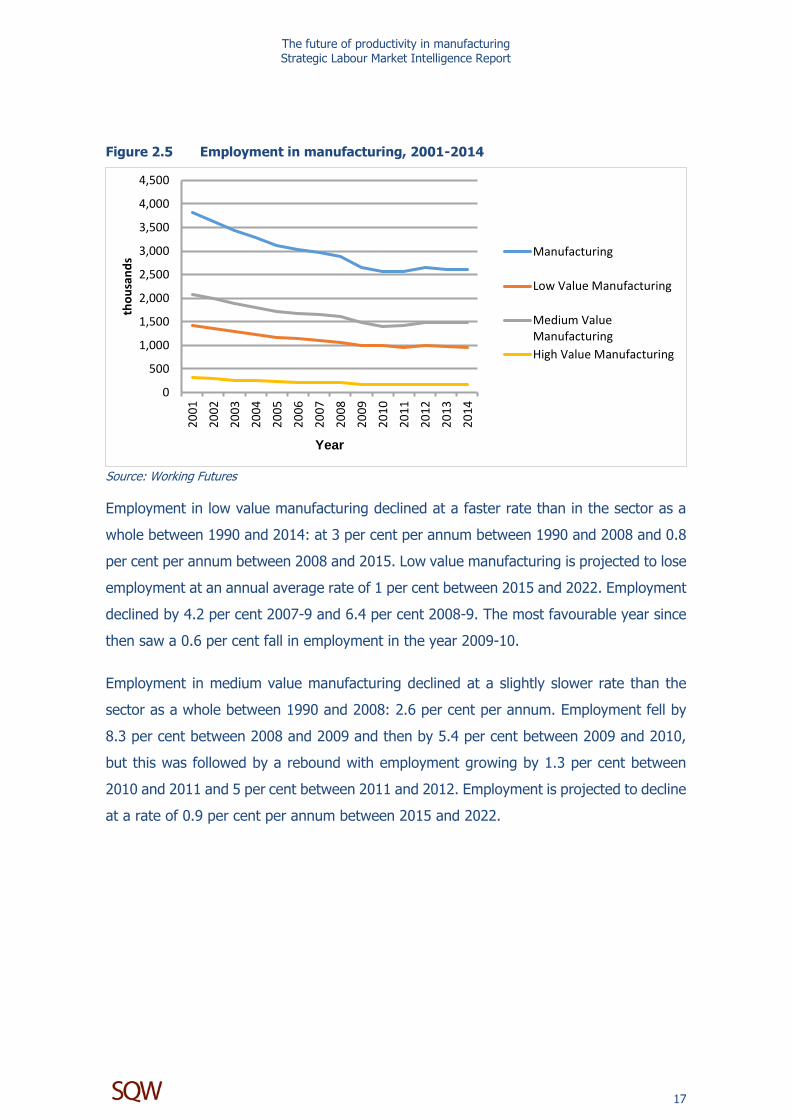
Figure 2.5 Employment in manufacturing, 2001-2014 .............................................. 17
Table 2.2 Qualification profile of the workforce in manufacturing, 2000 and 2014 19
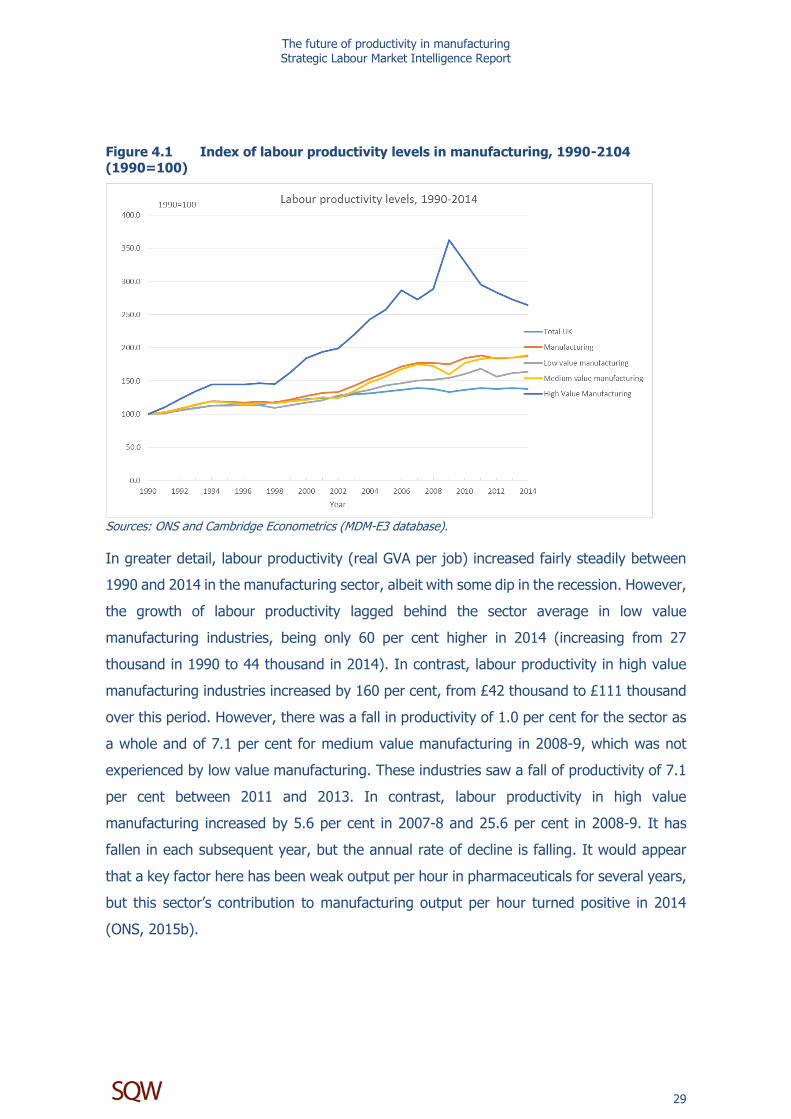
Figure 4.1 Index of labour productivity levels in manufacturing, 1990-2104 (1990=100) ............................................................................................... 29
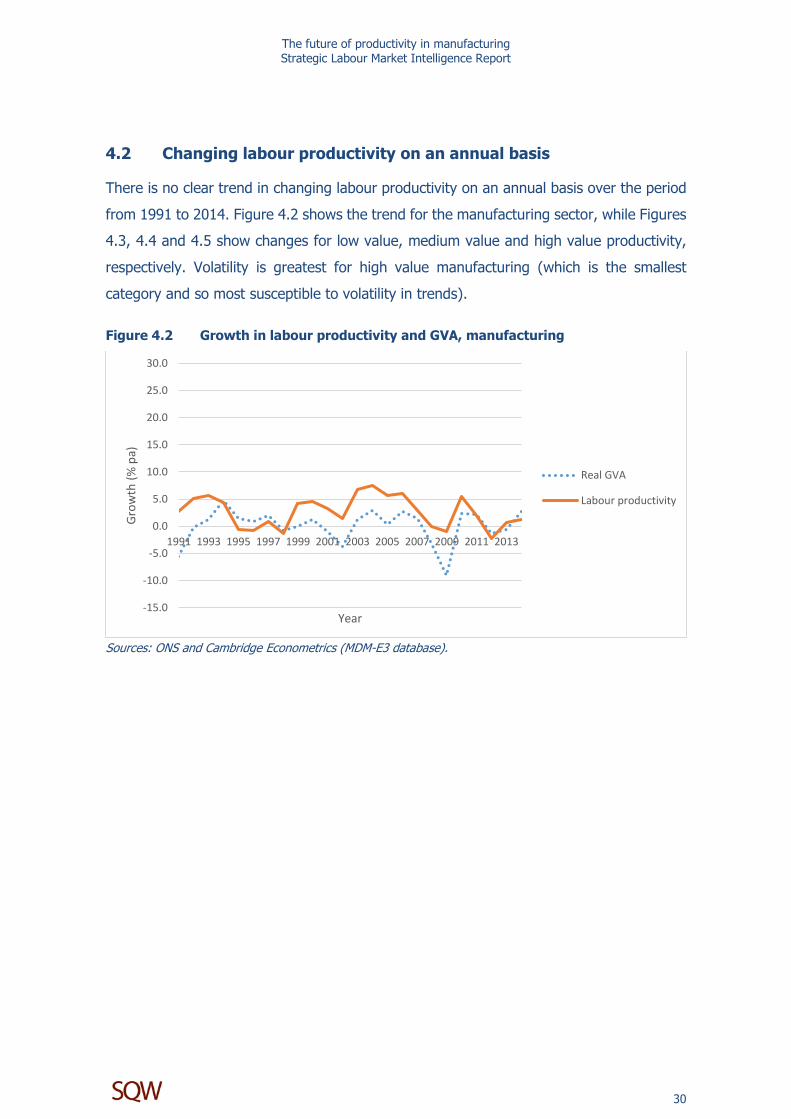
Figure 4.2 Growth in labour productivity and GVA, manufacturing ........................... 30
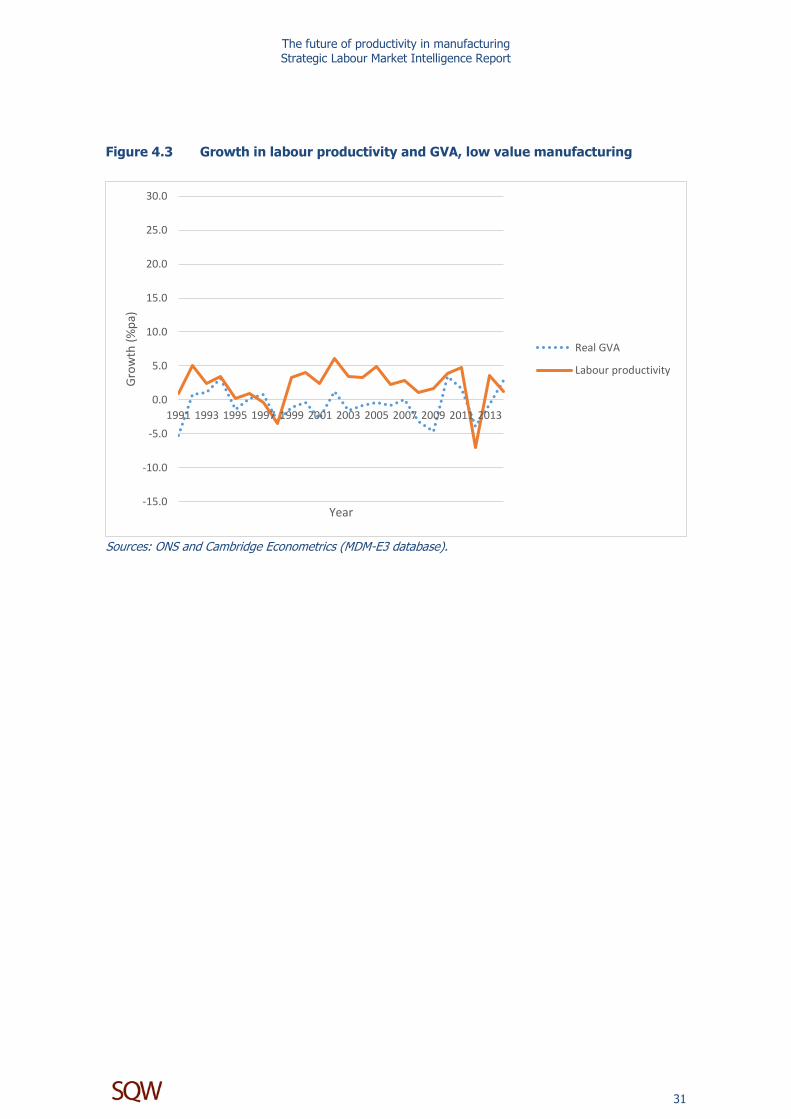
Figure 4.3 Growth in labour productivity and GVA, low value manufacturing .......... 31
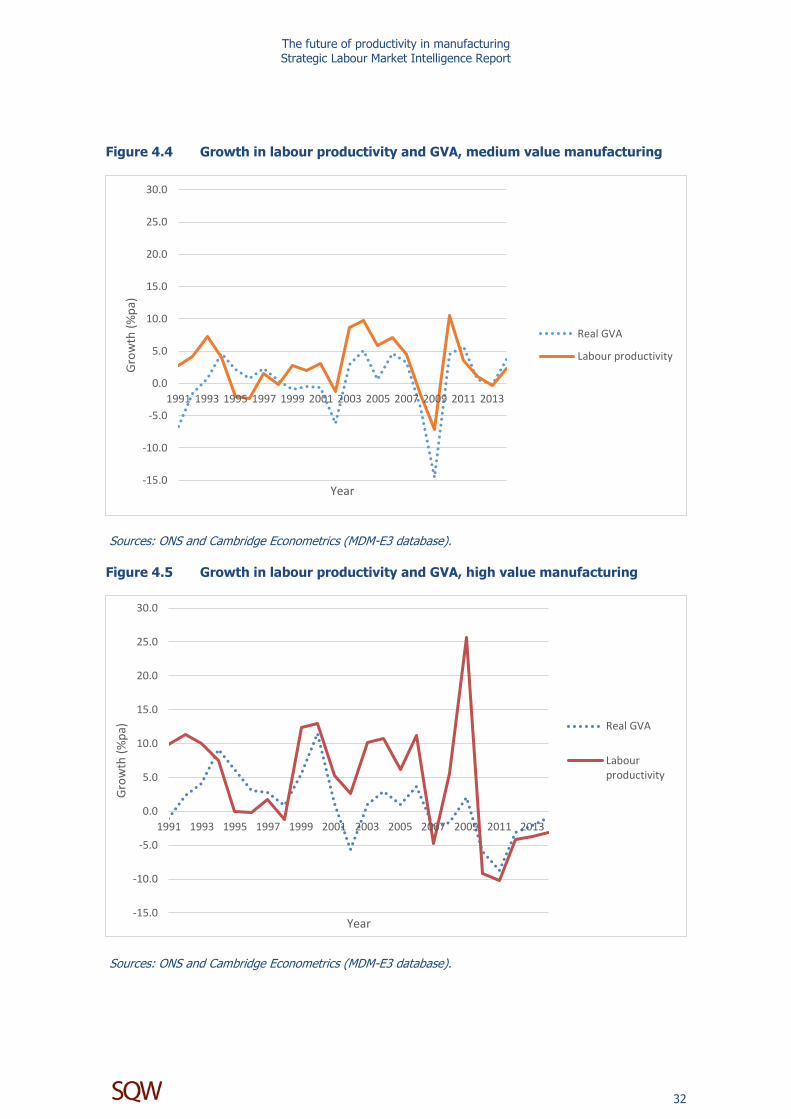
Figure 4.4 Growth in labour productivity and GVA, medium value manufacturing ... 32
Figure 4.5 Growth in labour productivity and GVA, high value manufacturing ......... 32
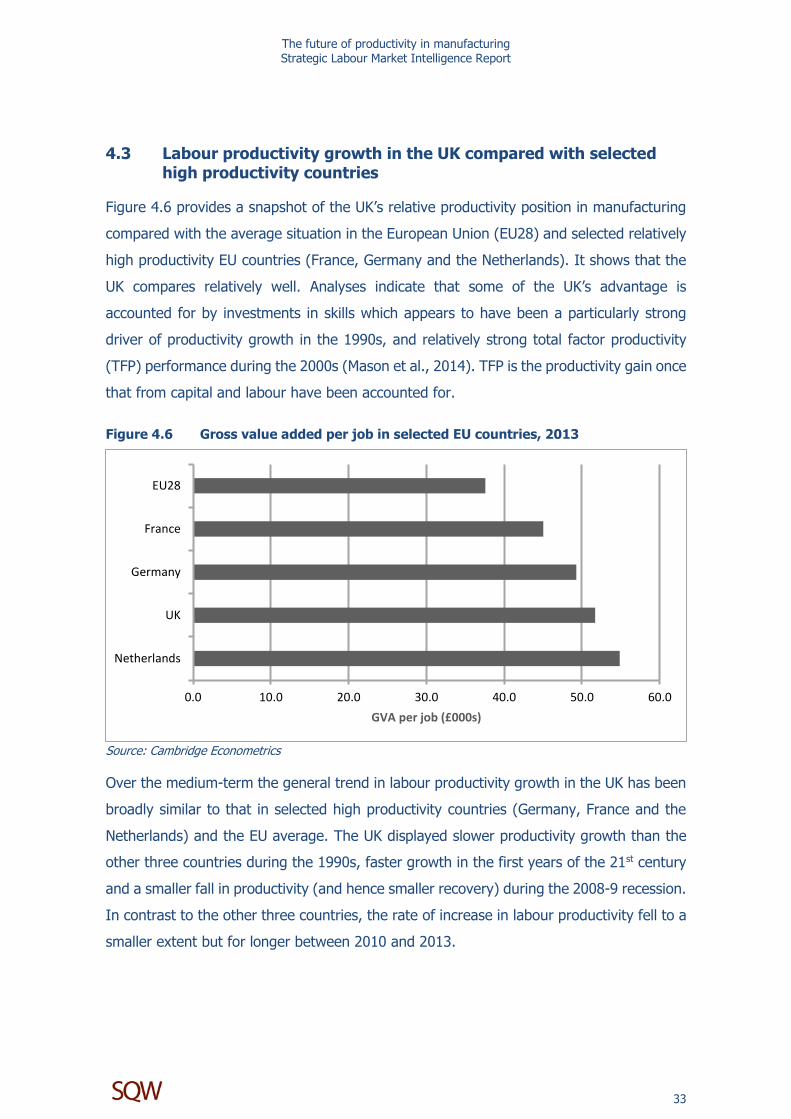
Figure 4.6 Gross value added per job in selected EU countries, 2013 ....................... 33
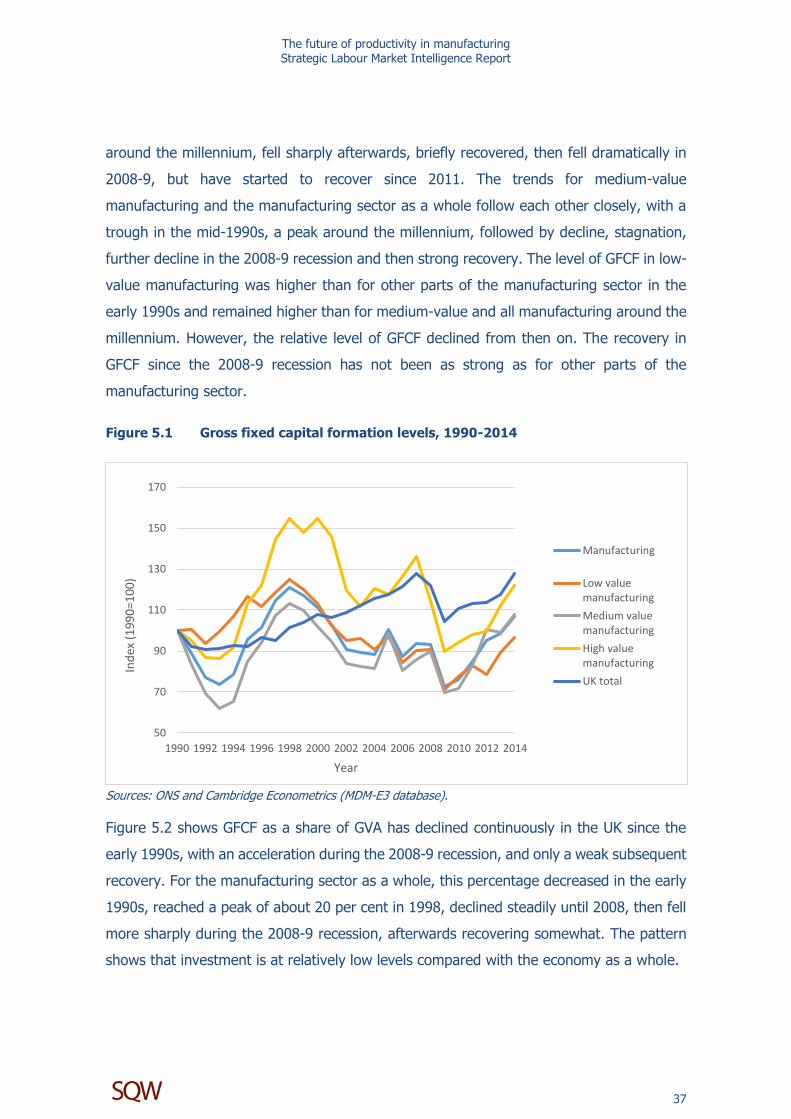
Figure 5.1 Gross fixed capital formation levels, 1990-2014 ...................................... 37
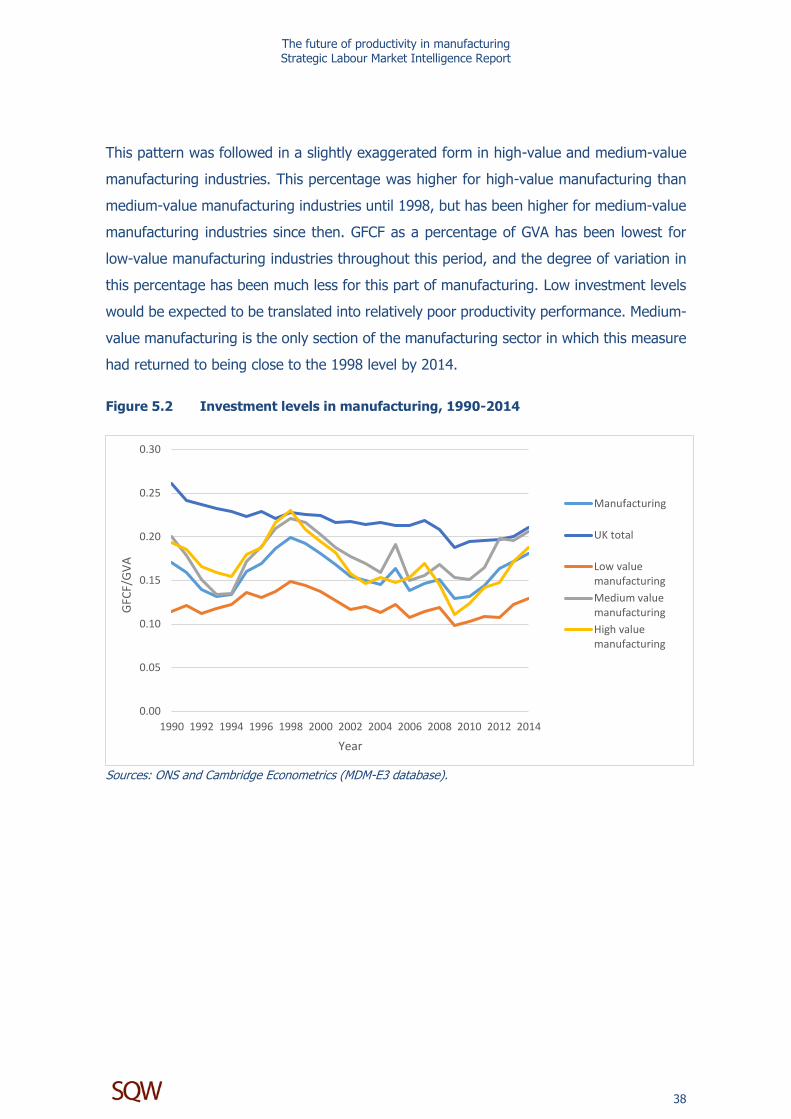
Figure 5.2 Investment levels in manufacturing, 1990-2014 ..................................... 38
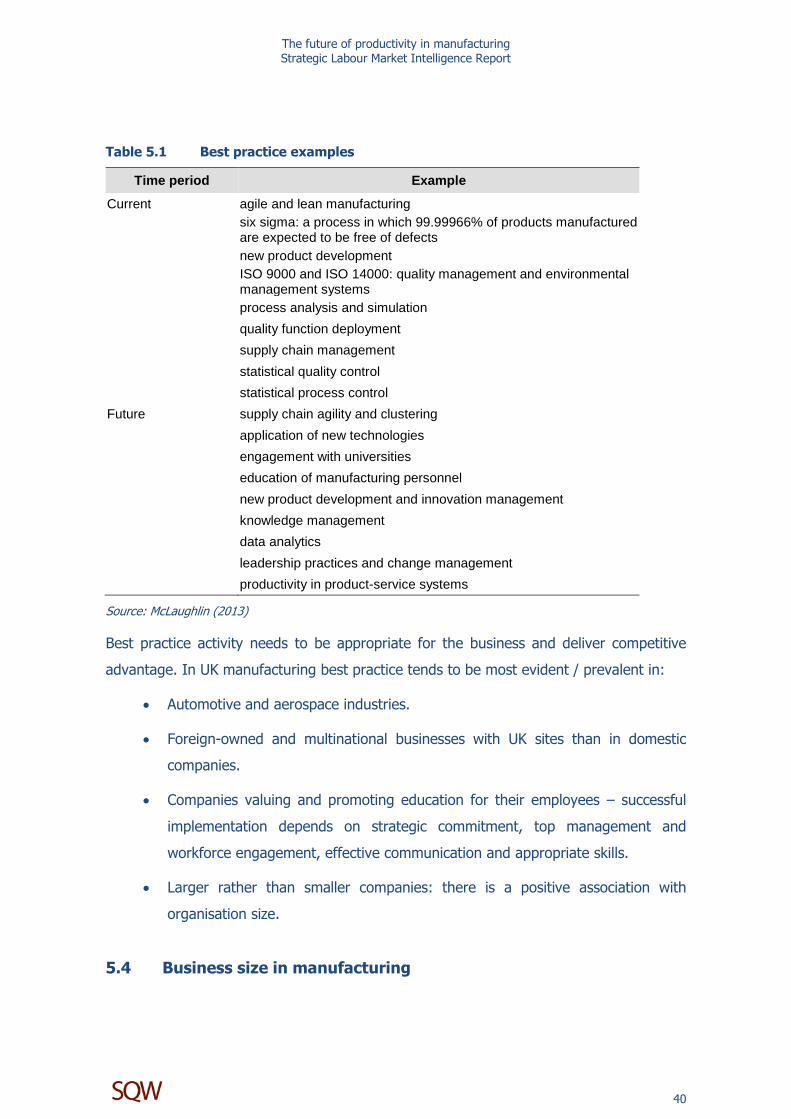
Table 5.1 Best practice examples ............................................................................. 40
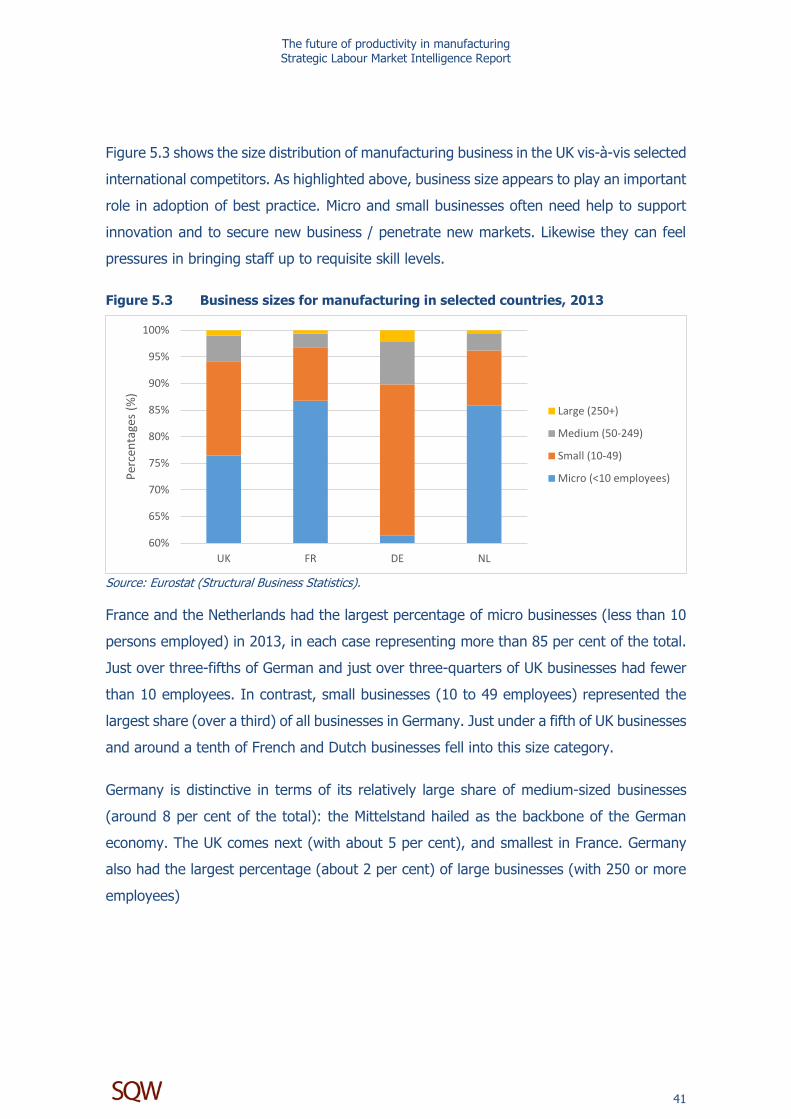
Figure 5.3 Business sizes for manufacturing in selected countries, 2013 ................. 41
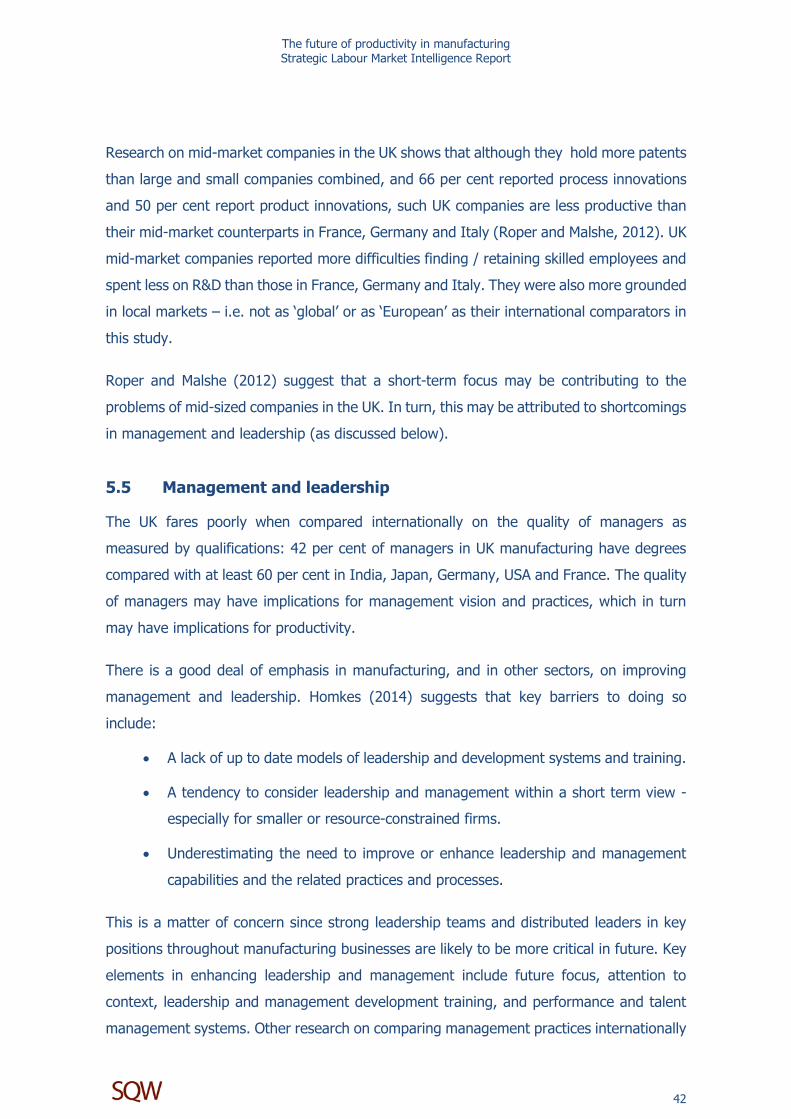
Figure 5.4 Management and training indicators ........................................................ 43
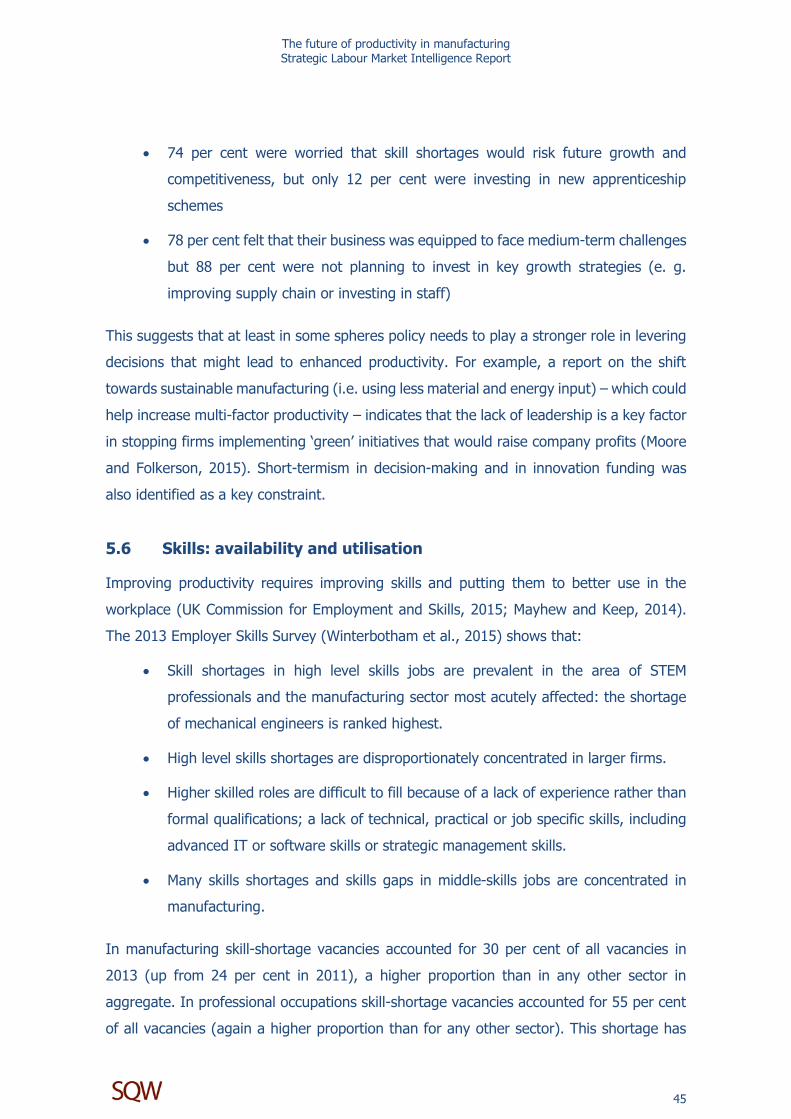
Figure 5.5 Training practice in manufacturing compared with the whole UK economy, 2013 ..............................................................................................
46
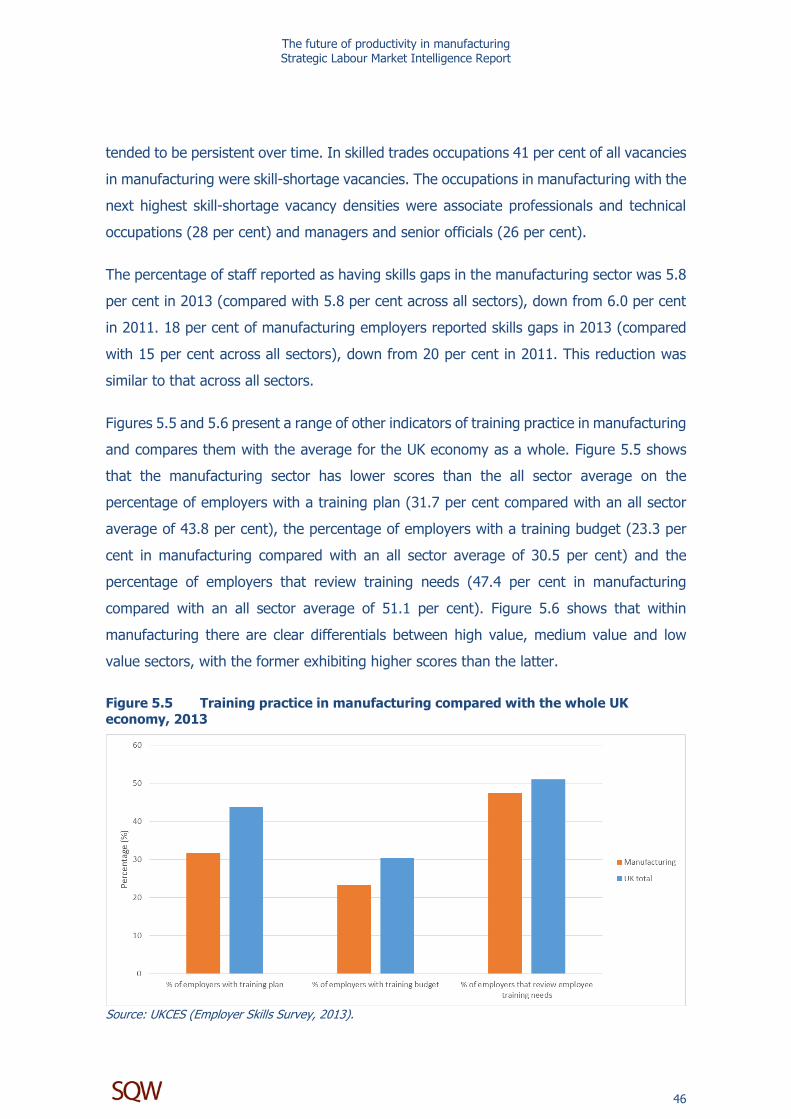
Figure 5.6 Training practice in manufacturing by sector, 2013 ................................. 47
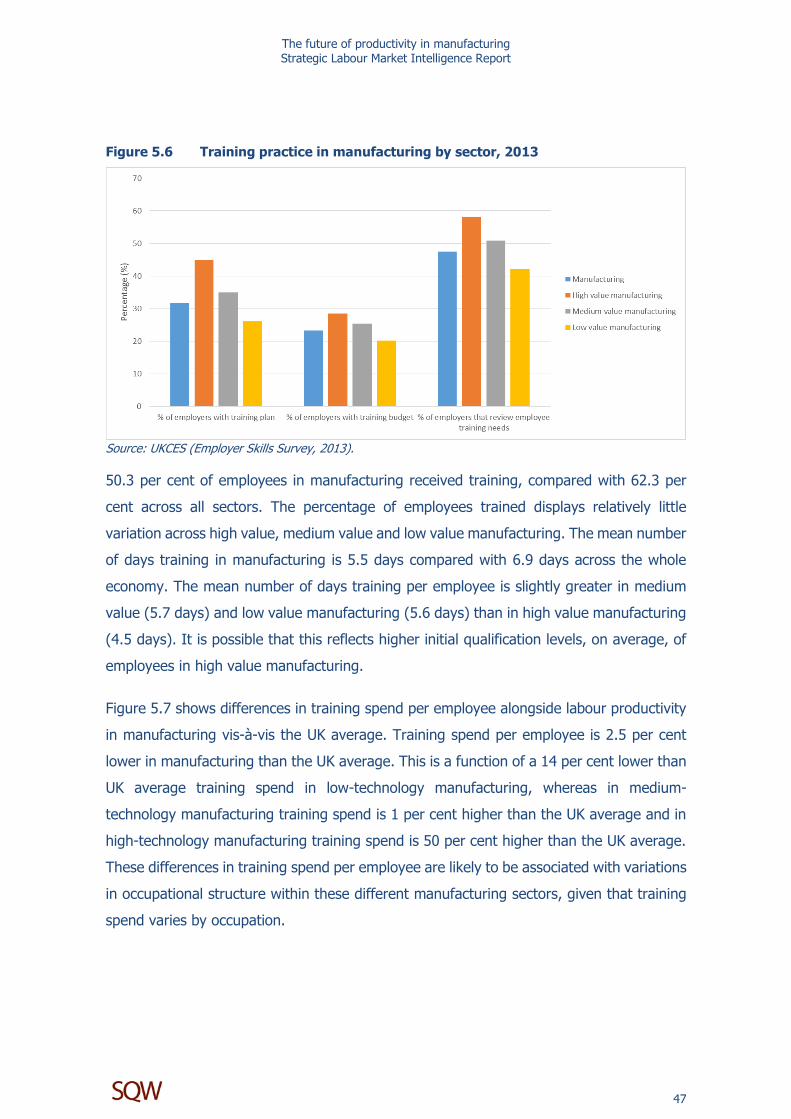
Figure 5.7 Training spend per employee and labour productivity, as differences from
the UK average, 2013 ................................................................................ 48
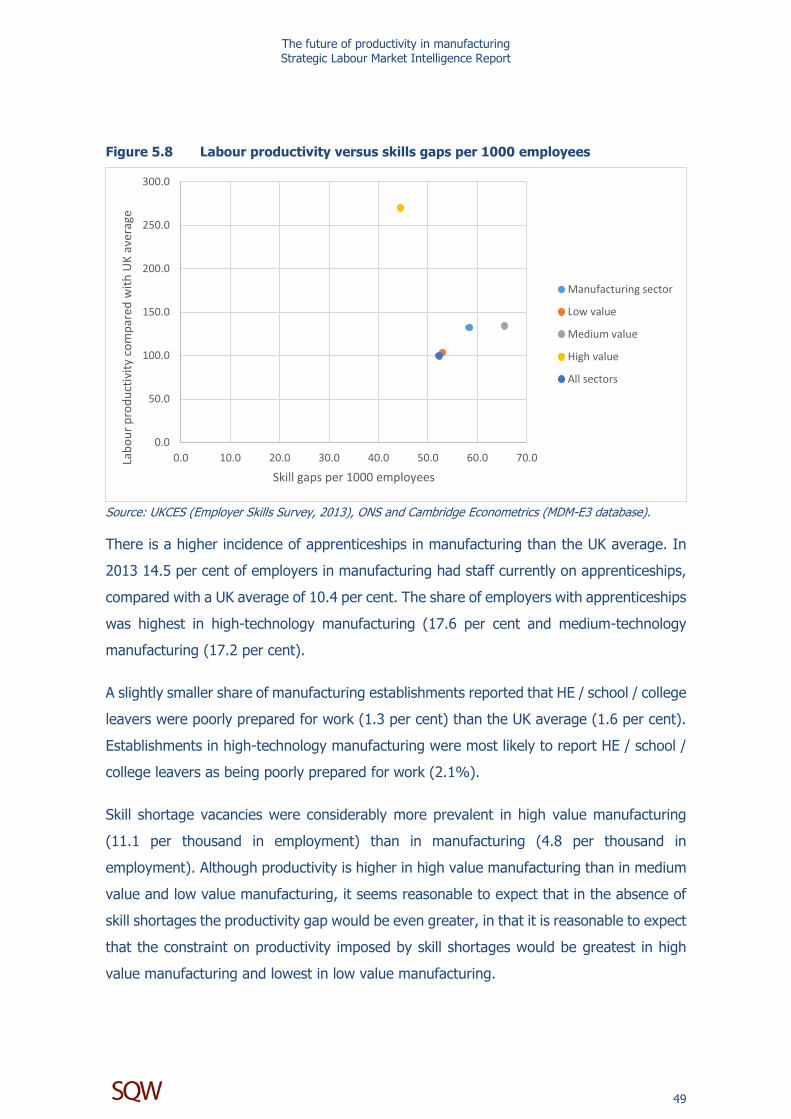
Figure 5.8 Labour productivity versus skills gaps per 1000 employees .................... 49
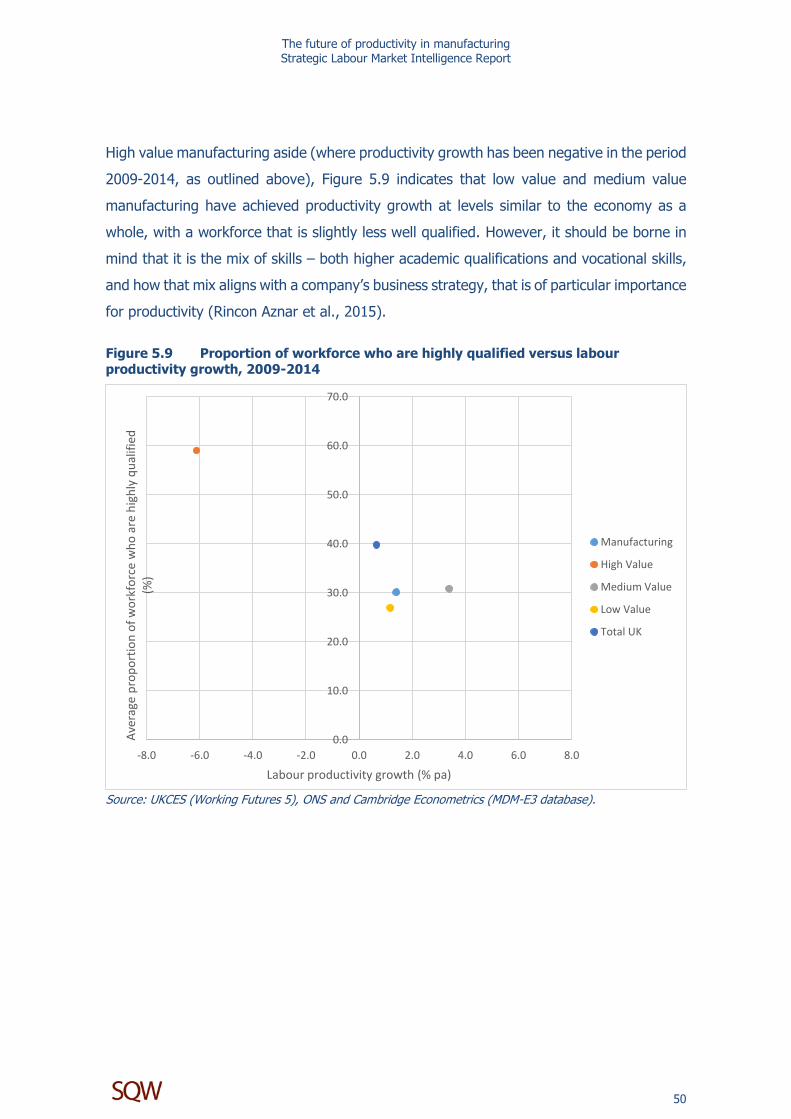
Figure 5.9 Proportion of workforce who are highly qualified versus labour productivity growth, 2009-2014 ............................................................... 50
The future of productivity in manufacturing Strategic Labour Market Intelligence Report
i
Executive Summary
Introduction
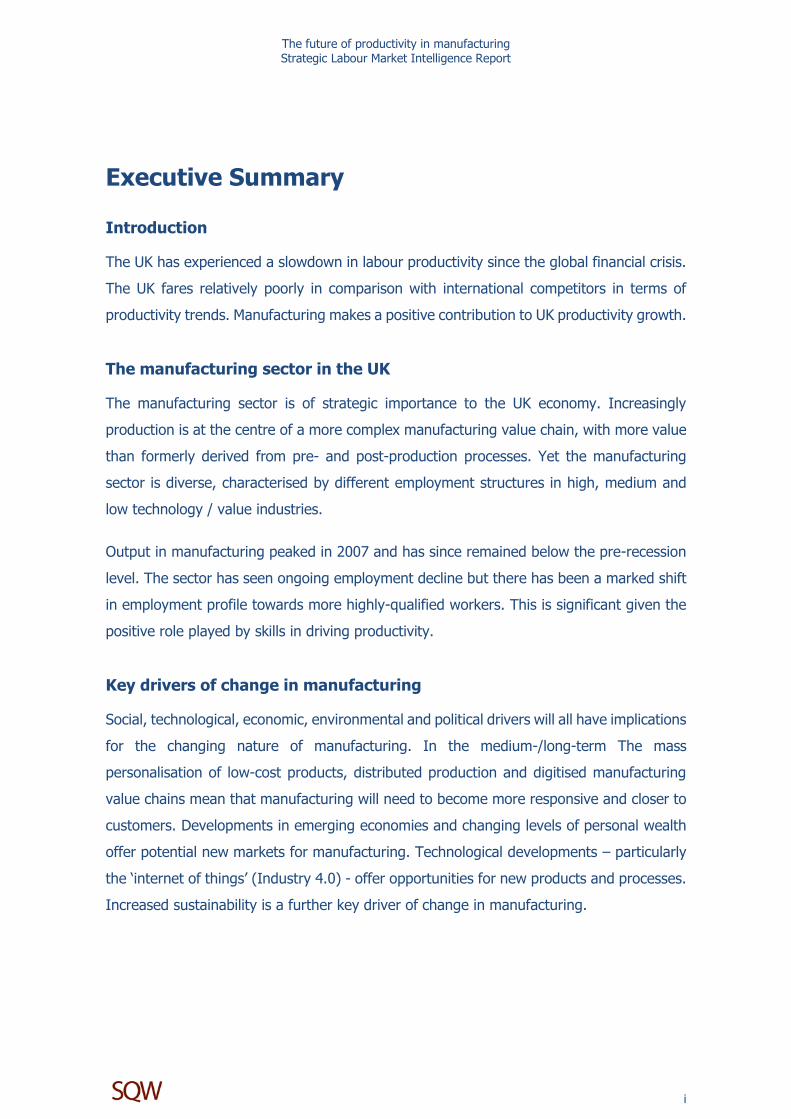
The UK has experienced a slowdown in labour productivity since the global financial crisis.
The UK fares relatively poorly in comparison with international competitors in terms of
productivity trends. Manufacturing makes a positive contribution to UK productivity growth.
The manufacturing sector in the UK
The manufacturing sector is of strategic importance to the UK economy. Increasingly
production is at the centre of a more complex manufacturing value chain, with more value
than formerly derived from pre- and post-production processes. Yet the manufacturing
sector is diverse, characterised by different employment structures in high, medium and
low technology / value industries.
Output in manufacturing peaked in 2007 and has since remained below the pre-recession
level. The sector has seen ongoing employment decline but there has been a marked shift
in employment profile towards more highly-qualified workers. This is significant given the
positive role played by skills in driving productivity.
Key drivers of change in manufacturing
Social, technological, economic, environmental and political drivers will all have implications
for the changing nature of manufacturing. In the medium-/long-term The mass
personalisation of low-cost products, distributed production and digitised manufacturing
value chains mean that manufacturing will need to become more responsive and closer to
customers. Developments in emerging economies and changing levels of personal wealth
offer potential new markets for manufacturing. Technological developments – particularly
the ‘internet of things’ (Industry 4.0) - offer opportunities for new products and processes.
Increased sustainability is a further key driver of change in manufacturing.
The future of productivity in manufacturing Strategic Labour Market Intelligence Report
ii
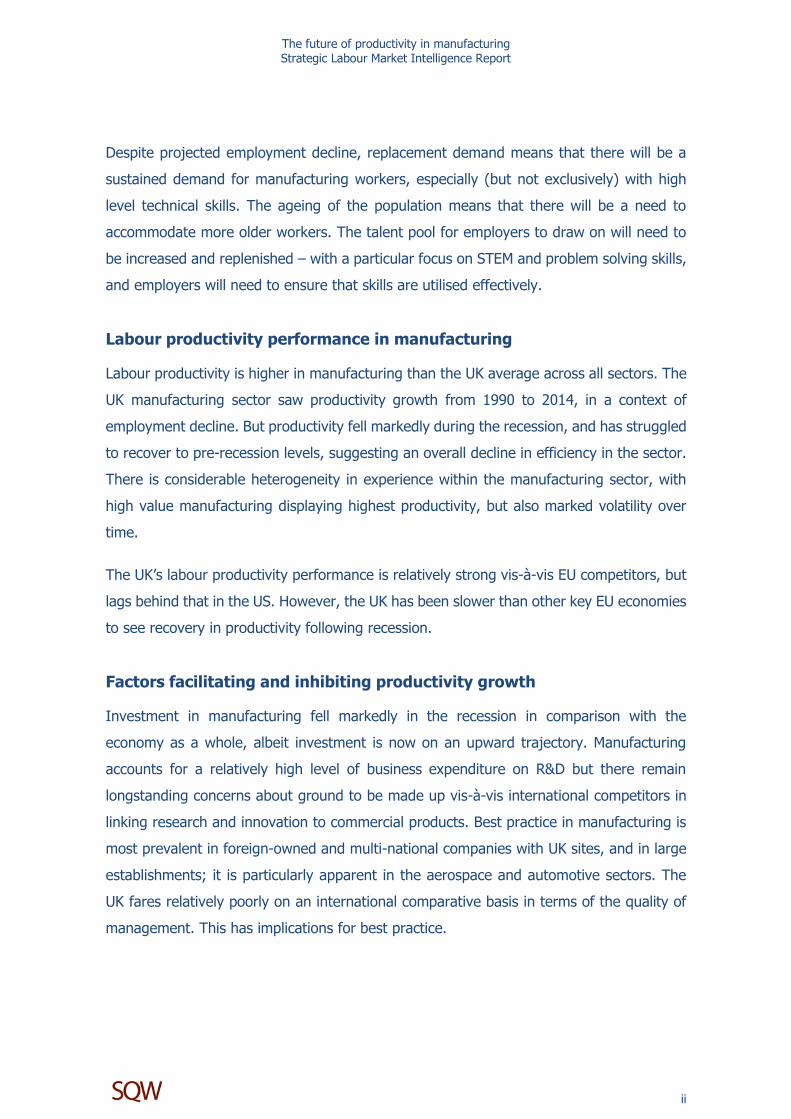
Despite projected employment decline, replacement demand means that there will be a
sustained demand for manufacturing workers, especially (but not exclusively) with high
level technical skills. The ageing of the population means that there will be a need to
accommodate more older workers. The talent pool for employers to draw on will need to
be increased and replenished – with a particular focus on STEM and problem solving skills,
and employers will need to ensure that skills are utilised effectively.
Labour productivity performance in manufacturing
Labour productivity is higher in manufacturing than the UK average across all sectors. The
UK manufacturing sector saw productivity growth from 1990 to 2014, in a context of
employment decline. But productivity fell markedly during the recession, and has struggled
to recover to pre-recession levels, suggesting an overall decline in efficiency in the sector.
There is considerable heterogeneity in experience within the manufacturing sector, with
high value manufacturing displaying highest productivity, but also marked volatility over
time.
The UK’s labour productivity performance is relatively strong vis-à-vis EU competitors, but
lags behind that in the US. However, the UK has been slower than other key EU economies
to see recovery in productivity following recession.
Factors facilitating and inhibiting productivity growth
Investment in manufacturing fell markedly in the recession in comparison with the
economy as a whole, albeit investment is now on an upward trajectory. Manufacturing
accounts for a relatively high level of business expenditure on R&D but there remain
longstanding concerns about ground to be made up vis-à-vis international competitors in
linking research and innovation to commercial products. Best practice in manufacturing is
most prevalent in foreign-owned and multi-national companies with UK sites, and in large
establishments; it is particularly apparent in the aerospace and automotive sectors. The
UK fares relatively poorly on an international comparative basis in terms of the quality of
management. This has implications for best practice.
The future of productivity in manufacturing Strategic Labour Market Intelligence Report
iii
Compared with the UK economy as a whole, manufacturing is characterised by a greater
incidence of high or very high product market strategies, but a below average incidence of
establishments using high performance working practices. Manufacturing has a higher
proportion of skill-shortage vacancies than average, especially in professional and skilled
trades occupations. These skill shortages are longstanding and are likely to inhibit
productivity growth.
Training spend per employee is slightly lower than across the economy as a whole,
although high value and medium value establishments are more likely than the UK average
to have staff on apprenticeships. The evidence also suggests that shortcomings in
management and leadership act as a brake on productivity. Manufacturing has lower scores
on a range of training activity indicators compared with the UK economy average.
Conclusion: What can employers and public policy do?
Leadership, management and development of skills aligned with ambitious product market
strategies are essential to move up the value chain and to reap productivity enhancements.
Industry 4.0 brings new challenges and opportunities for UK manufacturing. In particular,
it highlights the importance of ICT skills and investment in the IT and telecommunications
infrastructure.
To enable them to further develop their current strategic objectives and develop new
strategies, ambitious employers need to invest in recruitment, retention and replenishment
of a broad mix of skills – not only those that are production-specific – albeit technical skills
at high and intermediate levels remain centrally important. More generically, supportive
public policy can help foster an environment conducive for fostering innovation and
productivity increases.
The future of productivity in manufacturing Strategic Labour Market Intelligence Report
1
1 Productivity growth in the UK
Chapter Summary
This chapter sets the broader context for understanding the future of productivity
in manufacturing.
The UK has experienced a slowdown in labour productivity since the global
financial crisis.
The UK fares relatively poorly in comparison with international competitors in
terms of productivity trends.
Manufacturing makes a positive contribution to UK productivity growth.
1.1 Introduction
This report is concerned with the future of productivity in the manufacturing sector. It
provides an overview of key features of manufacturing in the UK and then outlines key
drivers of change in manufacturing over the medium-term, since these have implications
for manufacturing. It sets out labour productivity performance in manufacturing in the UK,
making reference to selected international comparators. Factors facilitating and inhibiting
productivity growth are identified. A final synthesis discusses the way in which employers
can enhance productivity, with particular emphasis on the contribution employment and
skills policy can make to enhancing productivity.
1.2 The productivity puzzle
In common with most western economies, the UK has experienced both a slowdown in
long run output growth and labour productivity in the period following the global financial
crisis in 2007/8. This may reflect a cyclical adjustment, albeit a prolonged one, to what
proved to be a particularly deep recession. Relatively weak productivity growth is seen to
have resulted from:
firms hoarding workers and skills in an attempt to avoid the costs of recruiting
skilled workers during the recovery phase;
The future of productivity in manufacturing Strategic Labour Market Intelligence Report
2
weak investment in capital per worker – resulting from firms being cautious about
investing in new technology and a reluctance of the banks to lend money to
business;
relatively strong growth in low skill, low productivity employment in the
immediate aftermath of recession.
These were seen to be cyclical problems that would begin to disappear as growth
accelerated (Barnett et al., 2014). More pessimistically, some commentators have pointed
to what may be a longer run structural adjustment in western economies bringing about a
new secular stagnation (Summers, 2014). This means that the recent prolonged period of
weak output growth is more than just a hangover from the global economic crisis. While
there are multifarious causes, attention has focused upon (Gordon, 2012; Eichengreen,
2014):
weak technical progress;
falling aggregate demand (individuals are saving rather than spending and firms
are unwilling to invest even at near zero interest rates);
slowing total factor productivity because of insufficient investments in
infrastructure, education and training.
Although the diagnoses derive from analysis of the US economy, and are not without
contention, they serve to illustrate the multiplicity of factors that might underlie the recent
performance of many western economies.
It is perhaps also worth noting that there are a range of measurement issues related to
measuring productivity: not least the capacity to measure the value of outputs generated
by the IT revolution (Mokyr, 2014); and being able to accurately count hours of work (the
denominator for measures of productivity) in economies where an individual’s hours of
work can be flexible.
The future of productivity in manufacturing Strategic Labour Market Intelligence Report
3
1.3 UK productivity
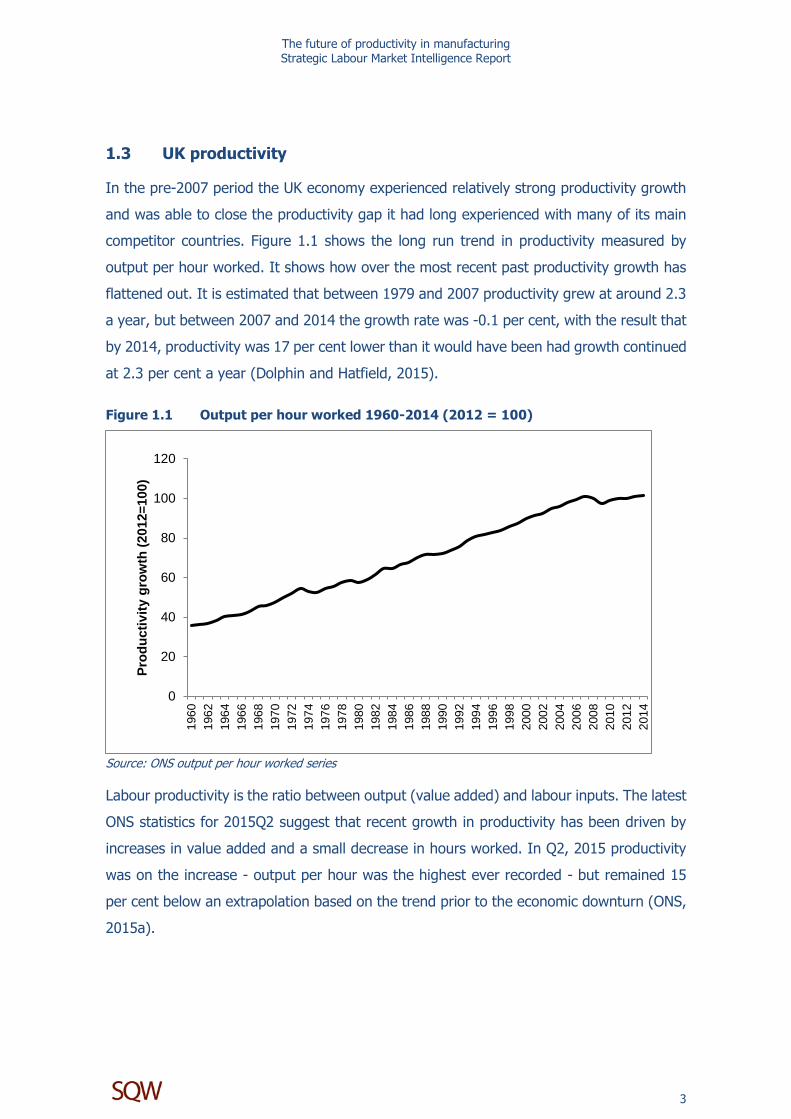
In the pre-2007 period the UK economy experienced relatively strong productivity growth
and was able to close the productivity gap it had long experienced with many of its main
competitor countries. Figure 1.1 shows the long run trend in productivity measured by
output per hour worked. It shows how over the most recent past productivity growth has
flattened out. It is estimated that between 1979 and 2007 productivity grew at around 2.3
a year, but between 2007 and 2014 the growth rate was -0.1 per cent, with the result that
by 2014, productivity was 17 per cent lower than it would have been had growth continued
at 2.3 per cent a year (Dolphin and Hatfield, 2015).
Figure 1.1 Output per hour worked 1960-2014 (2012 = 100)
Source: ONS output per hour worked series
Labour productivity is the ratio between output (value added) and labour inputs. The latest
ONS statistics for 2015Q2 suggest that recent growth in productivity has been driven by
increases in value added and a small decrease in hours worked. In Q2, 2015 productivity
was on the increase - output per hour was the highest ever recorded - but remained 15
per cent below an extrapolation based on the trend prior to the economic downturn (ONS,
2015a).
0
20
40
60
80
100
120
196
0
196
2
196
4
196
6
196
8
197
0
197
2
197
4
197
6
197
8
198
0
198
2
198
4
198
6
198
8
199
0
199
2
199
4
199
6
199
8
200
0
200
2
200
4
200
6
200
8
201
0
201
2
201
4
Pro
du
cti
vit
y g
row
th (
2012=
100)
The future of productivity in manufacturing Strategic Labour Market Intelligence Report
4
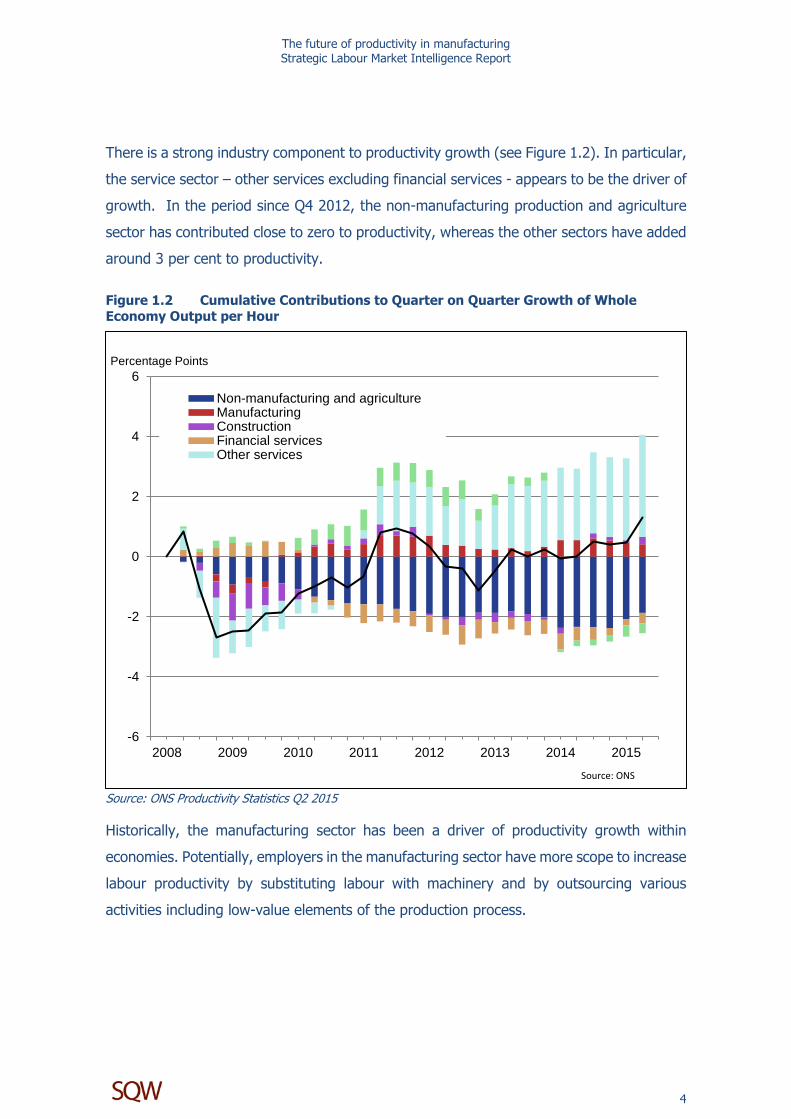
There is a strong industry component to productivity growth (see Figure 1.2). In particular,
the service sector – other services excluding financial services - appears to be the driver of
growth. In the period since Q4 2012, the non-manufacturing production and agriculture
sector has contributed close to zero to productivity, whereas the other sectors have added
around 3 per cent to productivity.
Figure 1.2 Cumulative Contributions to Quarter on Quarter Growth of Whole Economy Output per Hour
Source: ONS Productivity Statistics Q2 2015
Historically, the manufacturing sector has been a driver of productivity growth within
economies. Potentially, employers in the manufacturing sector have more scope to increase
labour productivity by substituting labour with machinery and by outsourcing various
activities including low-value elements of the production process.
-6
-4
-2
0
2
4
6
2008 2009 2010 2011 2012 2013 2014 2015
Percentage Points
Non-manufacturing and agricultureManufacturingConstructionFinancial servicesOther services
Source: ONS
The future of productivity in manufacturing Strategic Labour Market Intelligence Report
5
Parts of the service sector, such as the education and the arts, cannot achieve these types
of productivity gain or at least not to the same extent (for example, an orchestra cannot
increase its productivity by playing faster or by, for instance, outsourcing the string section
to a lower-cost ensemble) (Baumol and Bowen, 1966). But these sectors are in competition
with the ones realising productivity gains, for labour (and skills) and, accordingly, pay
wages at least equal to them.6
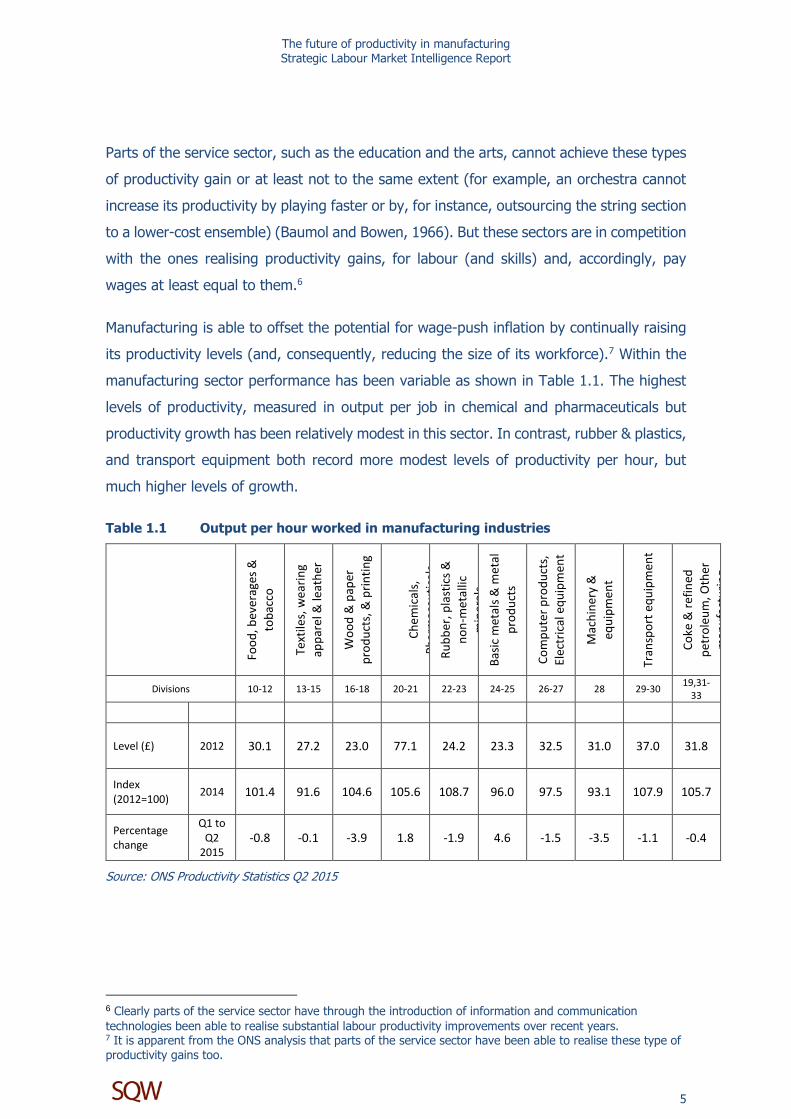
Manufacturing is able to offset the potential for wage-push inflation by continually raising
its productivity levels (and, consequently, reducing the size of its workforce).7 Within the
manufacturing sector performance has been variable as shown in Table 1.1. The highest
levels of productivity, measured in output per job in chemical and pharmaceuticals but
productivity growth has been relatively modest in this sector. In contrast, rubber & plastics,
and transport equipment both record more modest levels of productivity per hour, but
much higher levels of growth.
Table 1.1 Output per hour worked in manufacturing industries
6 Clearly parts of the service sector have through the introduction of information and communication
technologies been able to realise substantial labour productivity improvements over recent years. 7 It is apparent from the ONS analysis that parts of the service sector have been able to realise these type of productivity gains too.
The future of productivity in manufacturing Strategic Labour Market Intelligence Report
6
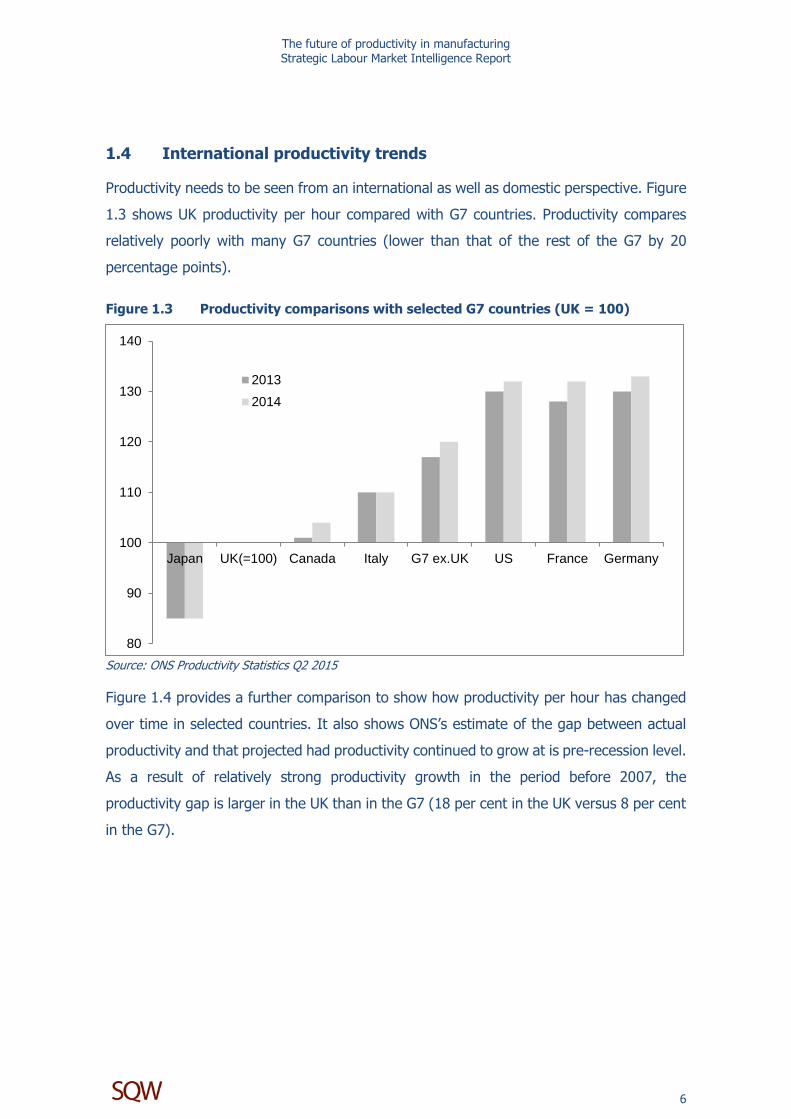
1.4 International productivity trends
Productivity needs to be seen from an international as well as domestic perspective. Figure
1.3 shows UK productivity per hour compared with G7 countries. Productivity compares
relatively poorly with many G7 countries (lower than that of the rest of the G7 by 20
percentage points).
Figure 1.3 Productivity comparisons with selected G7 countries (UK = 100)
Source: ONS Productivity Statistics Q2 2015
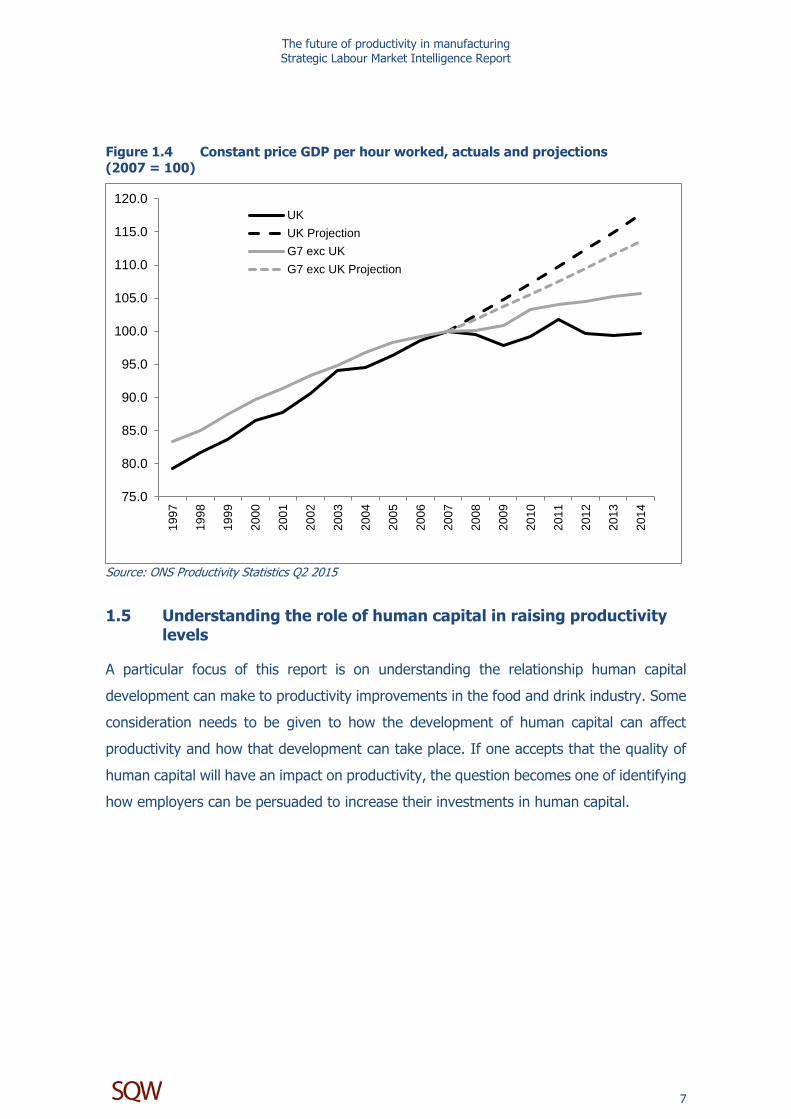
Figure 1.4 provides a further comparison to show how productivity per hour has changed
over time in selected countries. It also shows ONS’s estimate of the gap between actual
productivity and that projected had productivity continued to grow at is pre-recession level.
As a result of relatively strong productivity growth in the period before 2007, the
productivity gap is larger in the UK than in the G7 (18 per cent in the UK versus 8 per cent
in the G7).
80
90
100
110
120
130
140
Japan UK(=100) Canada Italy G7 ex.UK US France Germany
2013
2014
The future of productivity in manufacturing Strategic Labour Market Intelligence Report
7
Figure 1.4 Constant price GDP per hour worked, actuals and projections (2007 = 100)
Source: ONS Productivity Statistics Q2 2015
1.5 Understanding the role of human capital in raising productivity levels
A particular focus of this report is on understanding the relationship human capital
development can make to productivity improvements in the food and drink industry. Some
consideration needs to be given to how the development of human capital can affect
productivity and how that development can take place. If one accepts that the quality of
human capital will have an impact on productivity, the question becomes one of identifying
how employers can be persuaded to increase their investments in human capital.
75.0
80.0
85.0
90.0
95.0
100.0
105.0
110.0
115.0
120.0
199
7
199
8
199
9
200
0
200
1
200
2
200
3
200
4
200
5
200
6
200
7
200
8
200
9
201
0
201
1
201
2
201
3
201
4
UK
UK Projection
G7 exc UK
G7 exc UK Projection
The future of productivity in manufacturing Strategic Labour Market Intelligence Report
8
The human capital model specifies that in relation to transferable skills, employers will not
be willing to fund such training because they will not be able to recoup the costs of its
provision. The wage paid to persons whilst training will need to be set a level which
effectively compensates for the costs of their training and reduced productive capacity. If
the employer amasses a net training cost at the end of the training period, there will be no
way, in perfectly competitive labour market, of recouping that cost. To do so would require
the employer to pay a wage below the marginal productivity of the employee (Hogarth and
Gambin, 2016). Because the employer that had not provided training will be able to pay a
wage equal to the marginal productivity of the employee, the employee in the training
company will move to the non-training company where wages are higher.
The question then becomes one of identifying how the training employer can retain the
employee who has been trained where there is a net cost to the employer at the end of
the training period. It is known, for instance, that many companies that train engineers at
Level 2 or Level 3 encounter a substantial net cost of training at the end of the formal
training period. They are able to recoup that cost because they essentially develop a bond
between employer and employee. Often it is the very fact that the employer has trained
the employee that deepens the bond and allows the employer to recoup their training costs
in a way that the human capital model does not explicitly acknowledge (Gambin and
Hogarth, 2016; Gambin et al., 2010).
One of the ways in which the risk facing employers investing in training has been provided
has been reduced is through the employer ownership of skills. By being able to increasingly
tailor the provision of publicly funded training programmes to employer needs, the
employer is better placed to ensure that the skills provided – be it those in the FE or HE
sector – meet their needs. Employer routed funding will also provide employers will also
ensure that training meets their needs too. This does not necessarily affect the propensity
of the employer, other things being equal, of investing in transferable skills, but it does
remove the potential barrier to training that arises where employers feel that existing
provision does not match their needs (Hogarth et al., 2014). Hence and important issue
for policy is to understand how employers are able to develop the bond between employer
and employee that will allow employers to recoup their training investments, and how
willing and able the employer is to take advantage of the flexibility afforded employers to
tailor public training programmes to their needs.
The future of productivity in manufacturing Strategic Labour Market Intelligence Report
9
1.6 Conclusion
This chapter has provided an overview of productivity performance in the UK based mainly
on analysis of output per hour worked. The analysis illustrates the way in which long run
productivity growth has stalled in the UK following the global financial crisis in 2007. In
some respects, unfavourable comparisons with other countries – e.g. the gap between
actual versus projected pre-2007 productivity growth - result from the relatively strong
growth the UK experienced prior to 2007 which was sufficient to close much of the gap
with competitor countries. It is apparent, however, that other countries have experienced
stronger productivity growth since 2007.
The data also points to differences between industries within the UK. Much productivity
growth has been driven by the service sector other than financial services. This report
focuses on the manufacturing sector and a three-fold division therein outlined in Chapter
2.
The future of productivity in manufacturing Strategic Labour Market Intelligence Report
10
2 The manufacturing sector in the UK
Chapter Summary
The manufacturing sector is of strategic importance to the UK economy.
Increasingly production is at the centre of a more complex manufacturing value
chain, with more value than formerly derived from pre- and post-production
processes.
The manufacturing sector is diverse, characterised by different employment
structures in high, medium and low technology / value industries.
Output in manufacturing peaked in 2007 and has since remained below the pre-
recession level.
Manufacturing has seen ongoing employment decline but a marked shift in
employment profile towards more highly-qualified workers.
Medium technology / value industries are dominant in employment terms,
accounting for over half of all manufacturing employment, with low value
industries accounting for less than a third and high value industries for less than
a tenth of employment in the sector.
2.1 Introduction
Manufacturing is a strategically important sector for the UK economy. Despite long-term
decline in employment (see section 2.6) it accounts for nearly 70 per cent of R&D
investment and 44 per cent of all UK exports (Rhodes, 2015). Productivity growth in the
UK has historically been stronger in manufacturing than in most other sectors of the
economy – due to the way it can benefit from advancements in technology. Hence
manufacturing is a key driver of UK productivity growth.
The future of productivity in manufacturing Strategic Labour Market Intelligence Report
11
2.2 The changing nature of manufacturing
Manufacturing is traditionally understood as the production process in which raw materials
are transformed into physical products. This is changing: production remains important but
is now seen as being at the centre of a wider and more complex manufacturing value chain
involving a range of activities prior to production and after production, as well as re-use of
manufactured products back into the production process:
R&D →
Product & service development →
Supplier management →
Production →
Route to market →
After sales service →
Consumption →
Disposal → reuse remanufacturing, recycling & recovery → Production
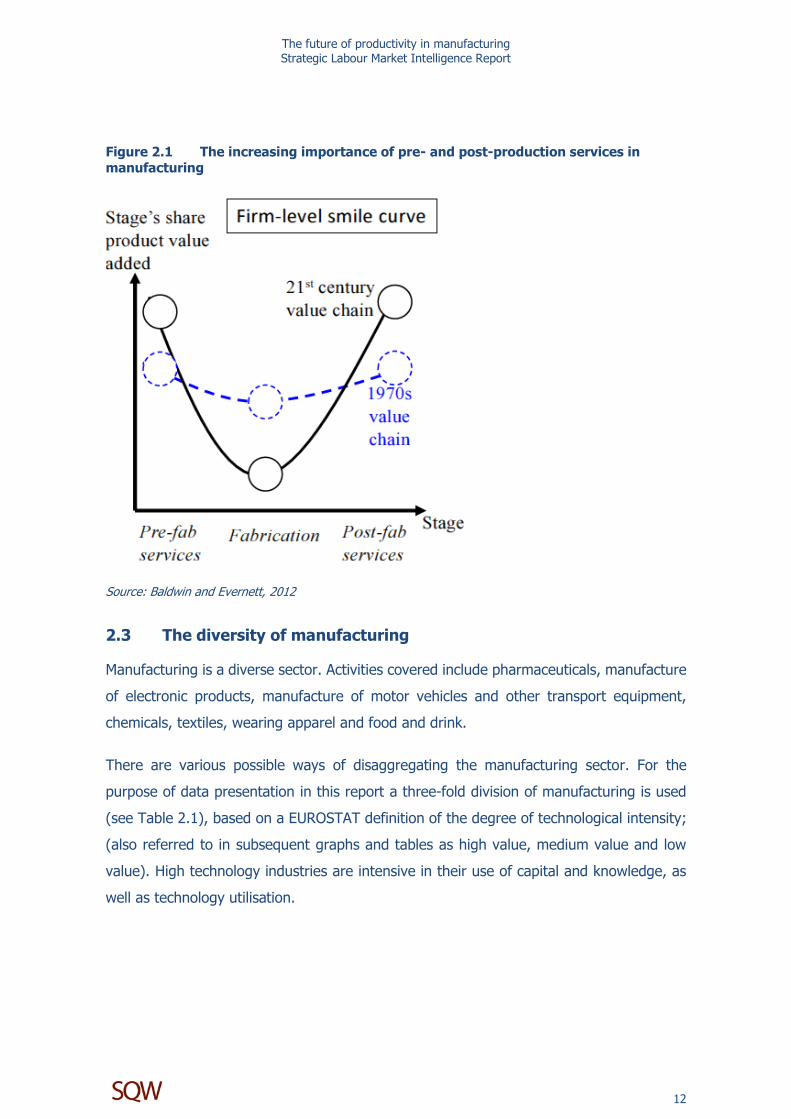
Increasingly the value of manufacturing rests not so much in the production (i.e. the
fabrication) process, but in pre- and post-production, as set out in Figure 2.1. Compared
with the situation in the 1970s these pre- and post-manufacturing services have become
more important, but production remains central.
The future of productivity in manufacturing Strategic Labour Market Intelligence Report
12
Figure 2.1 The increasing importance of pre- and post-production services in manufacturing
Source: Baldwin and Evernett, 2012
2.3 The diversity of manufacturing
Manufacturing is a diverse sector. Activities covered include pharmaceuticals, manufacture
of electronic products, manufacture of motor vehicles and other transport equipment,
chemicals, textiles, wearing apparel and food and drink.
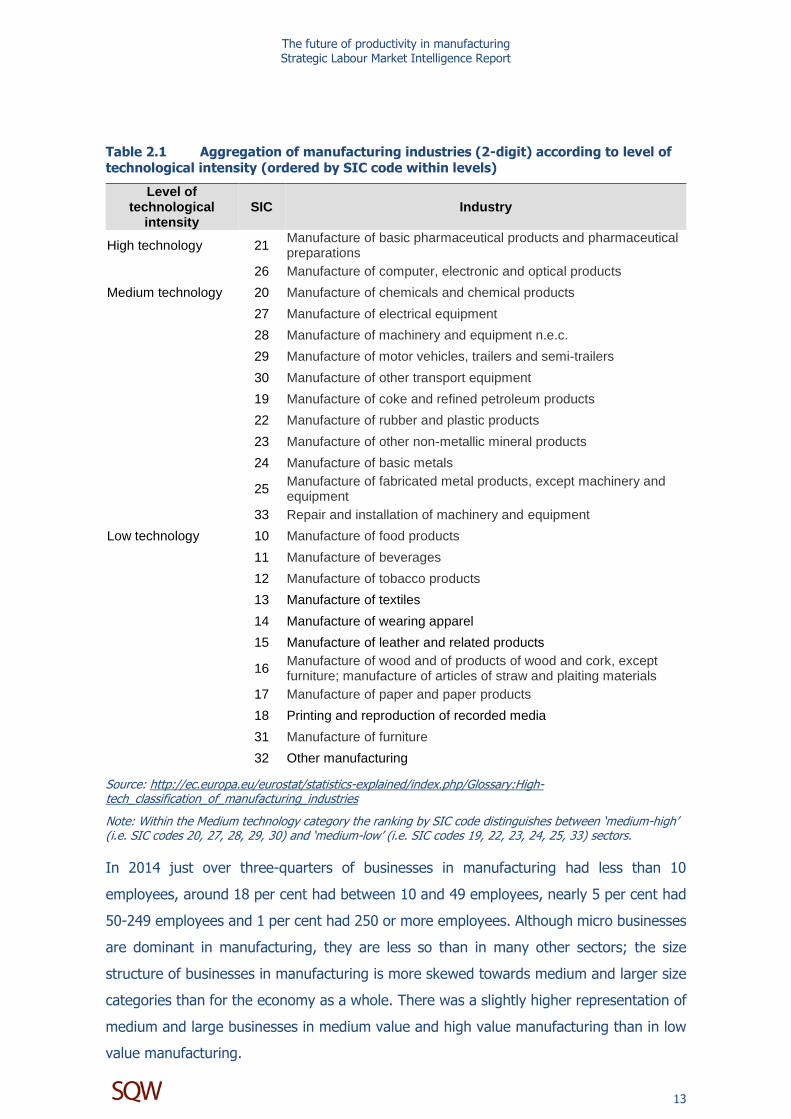
There are various possible ways of disaggregating the manufacturing sector. For the
purpose of data presentation in this report a three-fold division of manufacturing is used
(see Table 2.1), based on a EUROSTAT definition of the degree of technological intensity;
(also referred to in subsequent graphs and tables as high value, medium value and low
value). High technology industries are intensive in their use of capital and knowledge, as
well as technology utilisation.
The future of productivity in manufacturing Strategic Labour Market Intelligence Report
13
Table 2.1 Aggregation of manufacturing industries (2-digit) according to level of technological intensity (ordered by SIC code within levels)
Level of technological
intensity SIC Industry
High technology 21 Manufacture of basic pharmaceutical products and pharmaceutical preparations
26 Manufacture of computer, electronic and optical products
Medium technology 20 Manufacture of chemicals and chemical products
27 Manufacture of electrical equipment
28 Manufacture of machinery and equipment n.e.c.
29 Manufacture of motor vehicles, trailers and semi-trailers
30 Manufacture of other transport equipment
19 Manufacture of coke and refined petroleum products
22 Manufacture of rubber and plastic products
23 Manufacture of other non-metallic mineral products
24 Manufacture of basic metals
25 Manufacture of fabricated metal products, except machinery and equipment
33 Repair and installation of machinery and equipment
Low technology 10 Manufacture of food products
11 Manufacture of beverages
12 Manufacture of tobacco products
13 Manufacture of textiles
14 Manufacture of wearing apparel
15 Manufacture of leather and related products
16 Manufacture of wood and of products of wood and cork, except furniture; manufacture of articles of straw and plaiting materials
Note: Within the Medium technology category the ranking by SIC code distinguishes between ‘medium-high’ (i.e. SIC codes 20, 27, 28, 29, 30) and ‘medium-low’ (i.e. SIC codes 19, 22, 23, 24, 25, 33) sectors.
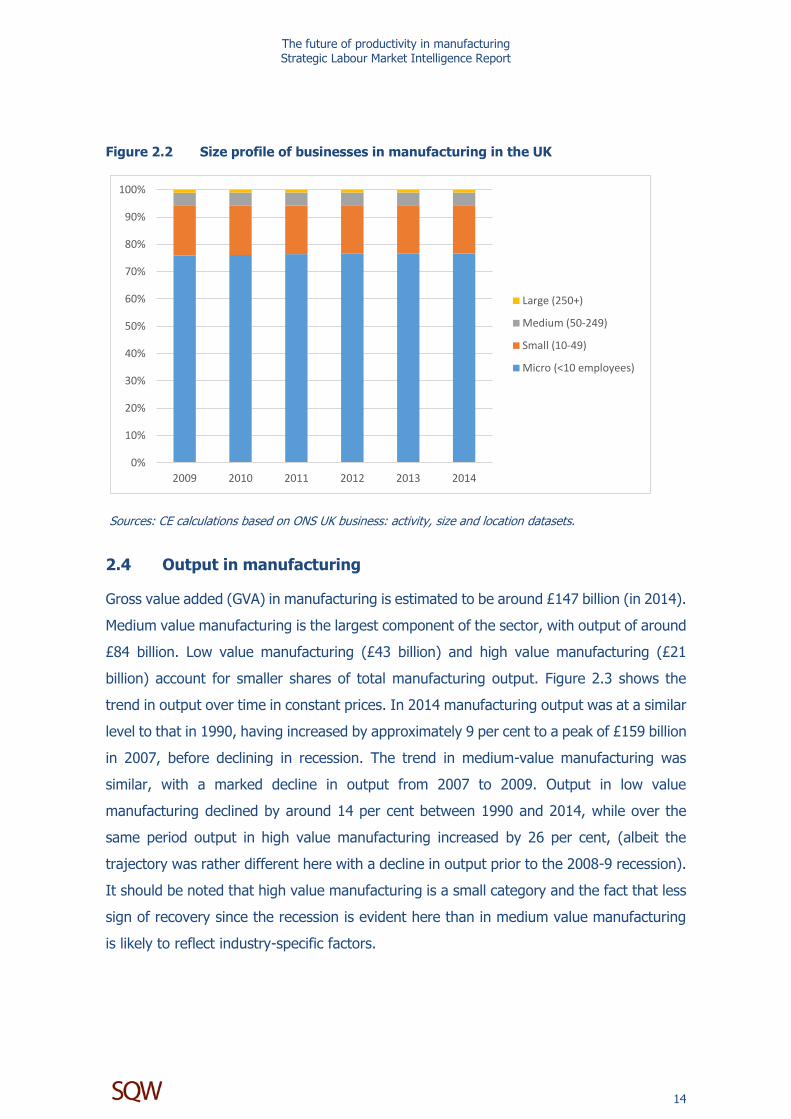
In 2014 just over three-quarters of businesses in manufacturing had less than 10
employees, around 18 per cent had between 10 and 49 employees, nearly 5 per cent had
50-249 employees and 1 per cent had 250 or more employees. Although micro businesses
are dominant in manufacturing, they are less so than in many other sectors; the size
structure of businesses in manufacturing is more skewed towards medium and larger size
categories than for the economy as a whole. There was a slightly higher representation of
medium and large businesses in medium value and high value manufacturing than in low