24
The Future of the Global The Future of the Global Economy Economy Augusto López-Claros, Ph.D. International Environment Forum Brighton, United Kingdom December 18, 2010
| Date post: | 26-Dec-2015 |
| Category: |
Documents |
| Upload: | dennis-thomas |
| View: | 214 times |
| Download: | 0 times |

The Future of the Global The Future of the Global EconomyEconomy
Augusto López-Claros, Ph.D.
International Environment ForumBrighton, United Kingdom
December 18, 2010

2
Global Economic Outlook
Macroeconomic Outlook (% GDP Growth)
2009 2010 2011
World Output -0.6 4.8 4.2
Advanced Economies -3.2 2.7 2.2
US -2.6 2.6 2.3
Japan -5.2 2.8 1.5
Euro Area -4.1 1.7 1.5
Germany -4.7 3.3 2.0
France -2.5 1.6 1.6
Italy -5.0 1.0 1.0
Middle East and N. Africa 2.0 4.1 5.1
Sub-Saharan Africa 2.6 5.0 5.5
Western Hemisphere -1.8 4.0 4.0
Brazil -0.2 7.5 4.1
Mexico -6.5 5.0 3.9
China 9.1 10.5 9.6
India 5.7 9.7 8.4
Russia -7.9 4.0 4.3

3
Rising Public Debt
Public Debt (in % of GDP)
0
20
40
60
80
100
120
140
Chile
Mex
icoBra
zil
Colombia
Argenti
na
Russia
China
South
Afri
ca
Spain
Poland
India
Portu
gal
Franc
e
Greec
eIta
ly
United S
tate
s
Germ
any
United K
ingdom
Pub
lic D
ebt
(% o
f G
DP
)

4
United States Public Debt
(in % of GDP)
0
20
40
60
80
100
120
2000
2001
2002
2003
2004
2005
2006
2007
2008
2009
2010
2011
2012
2013
2014
2015
Pub
lic d
ebt
(% o
f G
DP
)

5
U.S. Deficits: Largest in History
U.S. Fiscal Deficit: 1980-2010 (% of GDP)
Source: IMF World Economic Outlook
-14
-12
-10
-8
-6
-4
-2
0
2
4
1980 1985 1990 1995 2000 2005 2010
% o
f G
DP
6
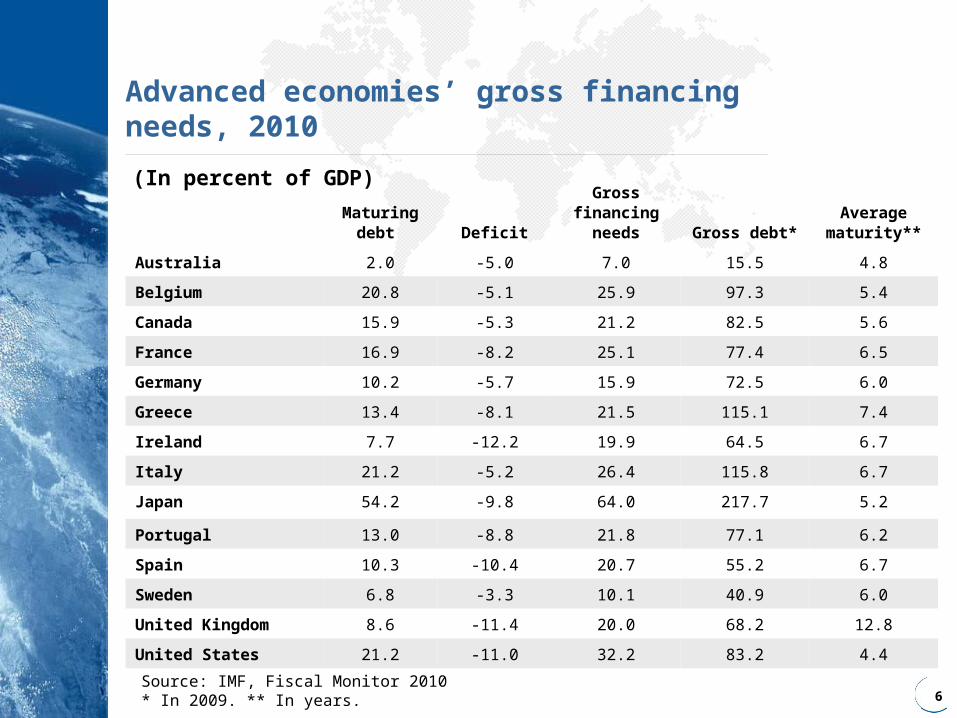
Advanced economies’ gross financing needs, 2010
(In percent of GDP)
Maturing debt Deficit
Gross financing
needs Gross debt*Average
maturity**
Australia 2.0 -5.0 7.0 15.5 4.8
Belgium 20.8 -5.1 25.9 97.3 5.4
Canada 15.9 -5.3 21.2 82.5 5.6
France 16.9 -8.2 25.1 77.4 6.5
Germany 10.2 -5.7 15.9 72.5 6.0
Greece 13.4 -8.1 21.5 115.1 7.4
Ireland 7.7 -12.2 19.9 64.5 6.7
Italy 21.2 -5.2 26.4 115.8 6.7
Japan 54.2 -9.8 64.0 217.7 5.2
Portugal 13.0 -8.8 21.8 77.1 6.2
Spain 10.3 -10.4 20.7 55.2 6.7
Sweden 6.8 -3.3 10.1 40.9 6.0
United Kingdom 8.6 -11.4 20.0 68.2 12.8
United States 21.2 -11.0 32.2 83.2 4.4
Source: IMF, Fiscal Monitor 2010* In 2009. ** In years.

7
Projected Change of Elderly
Projected shares of elderly in total population by region(in percent)
0
8
16
24
32
40
2000 2025 2050 2000 2025 2050
Population age 65+ Population age 80+
Europe Asia

8
Radically different growth experiences
GDP per capita 1980-2009 (PPP in US $)
0
10,000
20,000
30,000
40,000
50,000
1980 1985 1990 1995 2000 2005 2010
Argentina Brazil Korea Ireland Nigeria
10,499
38,685
27,938
14,525
2,274

9
Growth Experiences
Average annual per capita income growth
1970s 1980s 1990s 1970 2000
58 poorest countries
0.5 -0.4 -0.5 100 96
Other developing countries
2.5 4.0 4.0 100 280

10
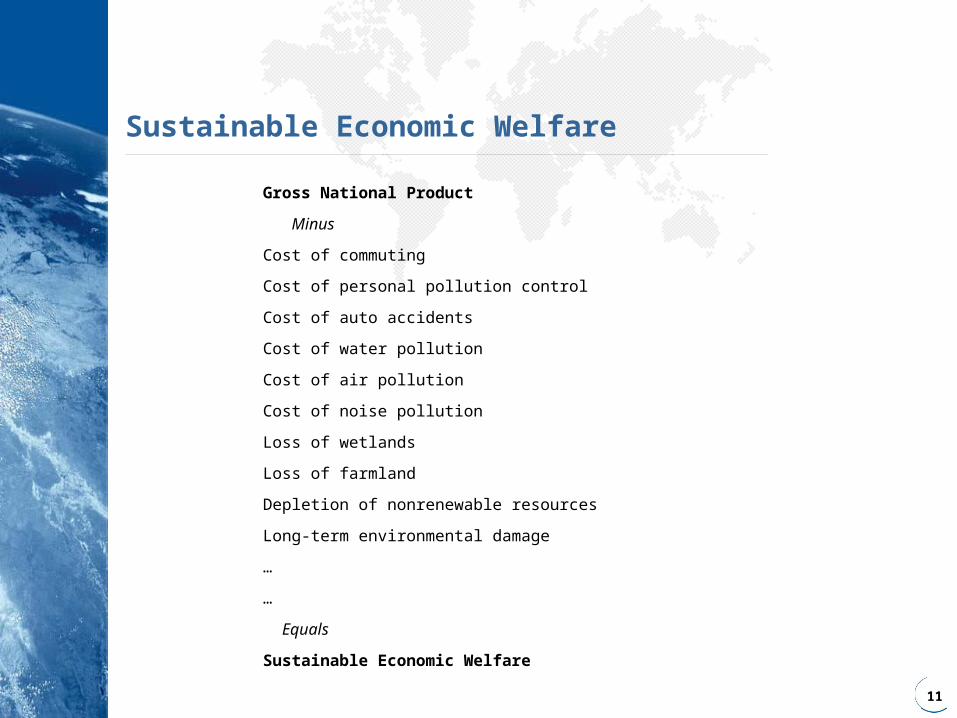
Sustainable Economic Welfare
Index of Sustainable Economic Welfare: United States
0
2,000
4,000
6,000
8,000
10,000
1950 1955 1960 1965 1970 1975 1980 1985 1990
ISEW per capita GNP per capita
11
Sustainable Economic Welfare
Gross National Product
Minus
Cost of commuting
Cost of personal pollution control
Cost of auto accidents
Cost of water pollution
Cost of air pollution
Cost of noise pollution
Loss of wetlands
Loss of farmland
Depletion of nonrenewable resources
Long-term environmental damage
…
…
Equals
Sustainable Economic Welfare

12
Average GDP per capita in dollars
Average income level
High-income countries $37,787
Upper-middle-income countries
$6,942
Lower-middle-income countries
$2,286
Low income countries $567
Source: World Bank 2008 country classification, IMF, The Economist Democracy Index

13
Decile shares of global income (2002, in %)
Decile Percentage shares
First 0.61
Second 0.94
Third 1.25
Fourth 1.62
Fifth 2.19
Sixth 3.13
Seventh 4.99
Eight 8.26
Nineth 19.71
Tenth 57.52
Total 100
Top ventile 31.34
Top to bottom decile ratio 94.6
Source: Branko Milanovic, World Bank
14
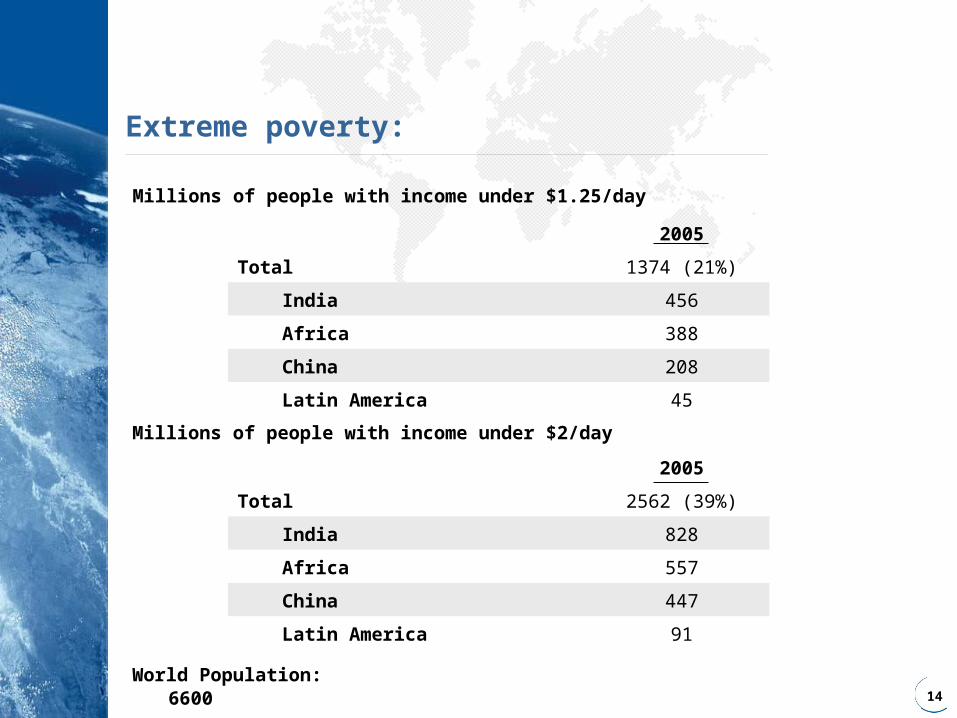
Extreme poverty:
2005
Total 1374 (21%)
India 456
Africa 388
China 208
Latin America 45
Millions of people with income under $1.25/day
2005
Total 2562 (39%)
India 828
Africa 557
China 447
Latin America 91
Millions of people with income under $2/day
World Population: 6600
15
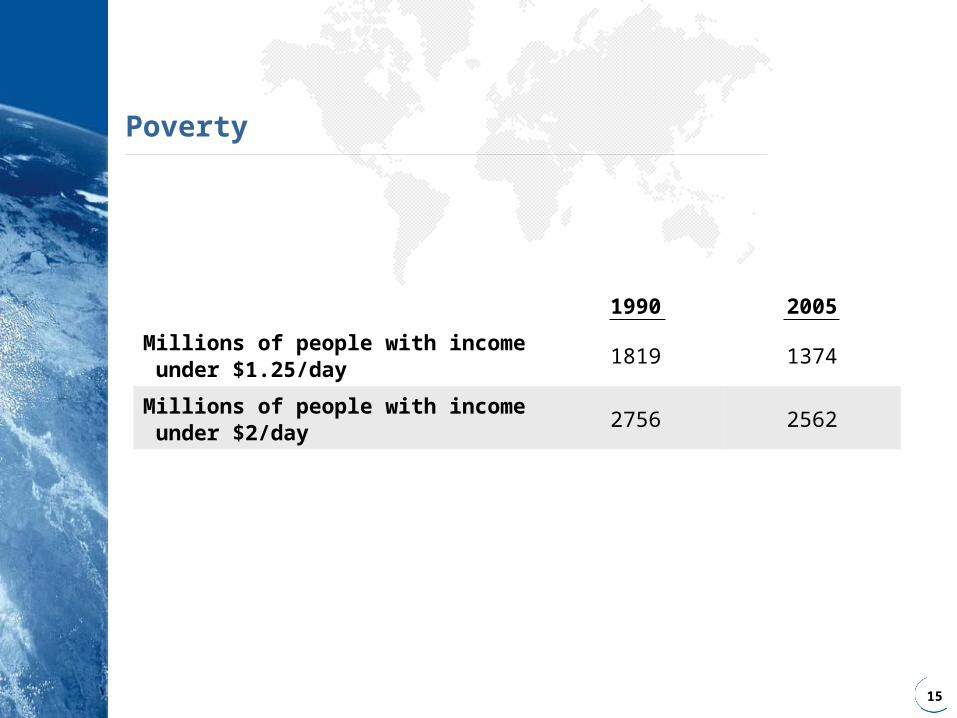
Poverty
1990 2005
Millions of people with income under $1.25/day
1819 1374
Millions of people with income under $2/day
2756 2562
16
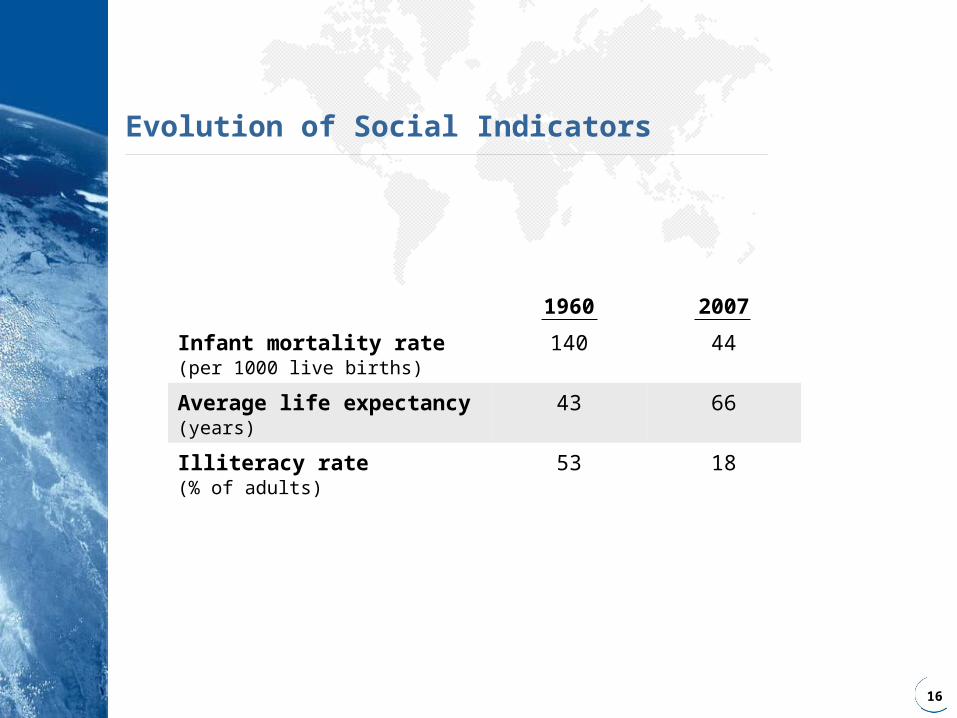
Evolution of Social Indicators
1960 2007
Infant mortality rate(per 1000 live births)
140 44
Average life expectancy(years)
43 66
Illiteracy rate(% of adults)
53 18

17
Implications of Population Growth
Population Growth from 1800 to 2050 (billions)
•Energy consumption
•Burdens of scale of human / economic activity on environment
•Consequences
―Global warming
―Loss of tropical forests
―Bio-diversity loss
0
2
4
6
8
10
1800 1950 1970 1990 2000 2010 2025 2050
18
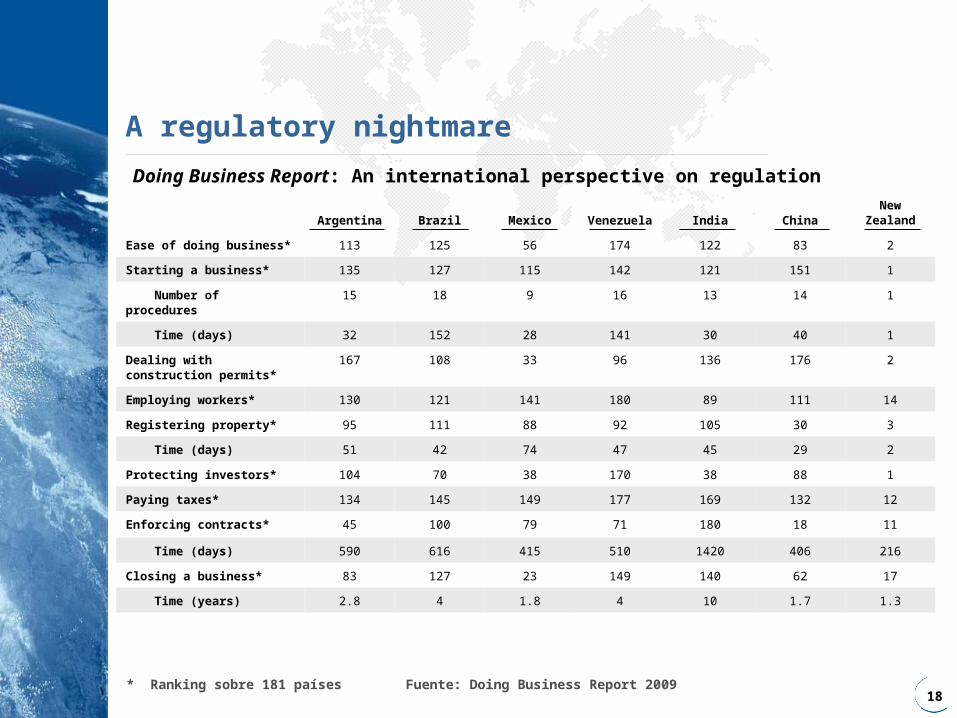
A regulatory nightmare
Doing Business Report: An international perspective on regulation
Argentina Brazil Mexico Venezuela India ChinaNew
Zealand
Ease of doing business* 113 125 56 174 122 83 2
Starting a business* 135 127 115 142 121 151 1
Number of procedures 15 18 9 16 13 14 1
Time (days) 32 152 28 141 30 40 1
Dealing with construction permits*
167 108 33 96 136 176 2
Employing workers* 130 121 141 180 89 111 14
Registering property* 95 111 88 92 105 30 3
Time (days) 51 42 74 47 45 29 2
Protecting investors* 104 70 38 170 38 88 1
Paying taxes* 134 145 149 177 169 132 12
Enforcing contracts* 45 100 79 71 180 18 11
Time (days) 590 616 415 510 1420 406 216
Closing a business* 83 127 23 149 140 62 17
Time (years) 2.8 4 1.8 4 10 1.7 1.3
* Ranking sobre 181 países Fuente: Doing Business Report 2009

19
Corruption vs. Regulation
2009 Corruptions Perceptions Index vs Ease of Doing Business Ranks
y = 0.7306x + 21.009
R2 = 0.6142
0
40
80
120
160
200
0 40 80 120 160 200
DBR
CP
I

20
21
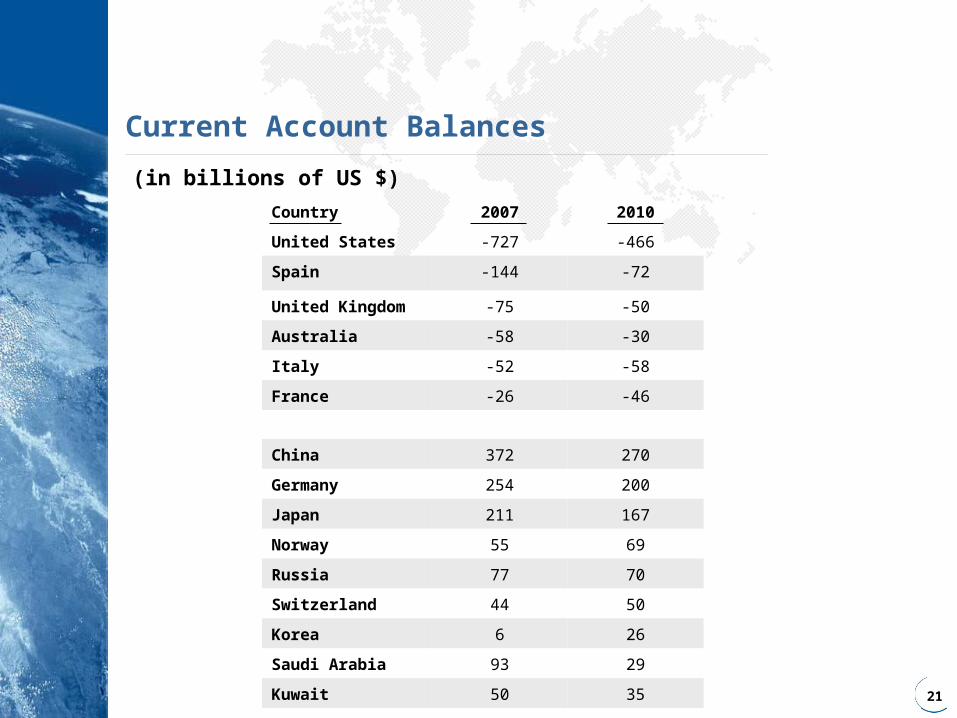
Current Account Balances
(in billions of US $)
Country 2007 2010
United States -727 -466
Spain -144 -72
United Kingdom -75 -50
Australia -58 -30
Italy -52 -58
France -26 -46
China 372 270
Germany 254 200
Japan 211 167
Norway 55 69
Russia 77 70
Switzerland 44 50
Korea 6 26
Saudi Arabia 93 29
Kuwait 50 35
22
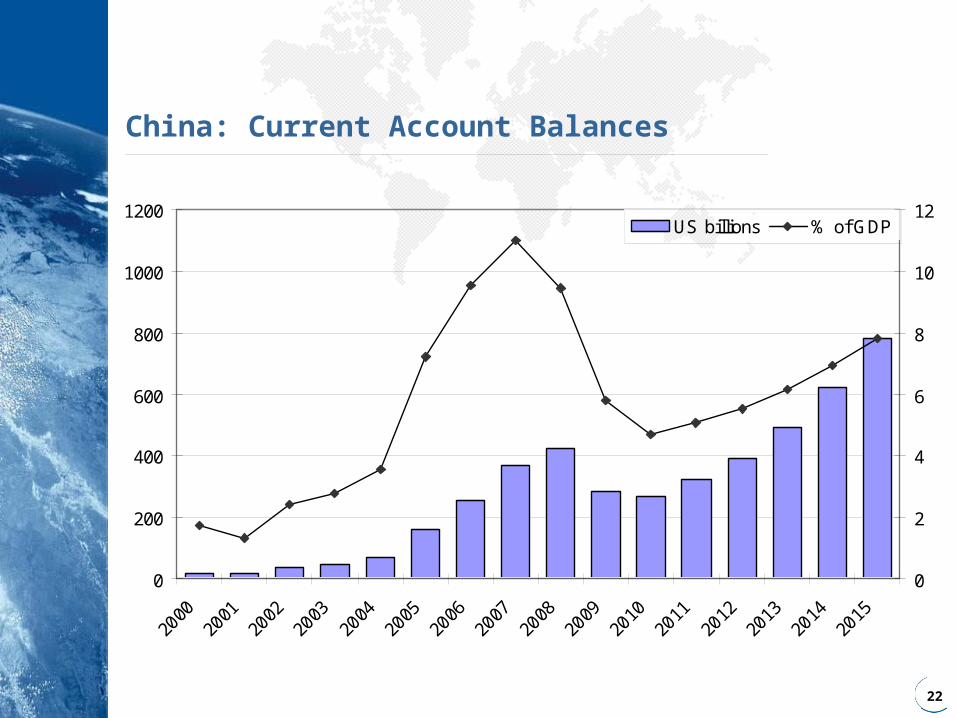
China: Current Account Balances
0
200
400
600
800
1000
1200
2000
2001
2002
2003
2004
2005
2006
2007
2008
2009
2010
2011
2012
2013
2014
2015
0
2
4
6
8
10
12US billions % of GDP
23
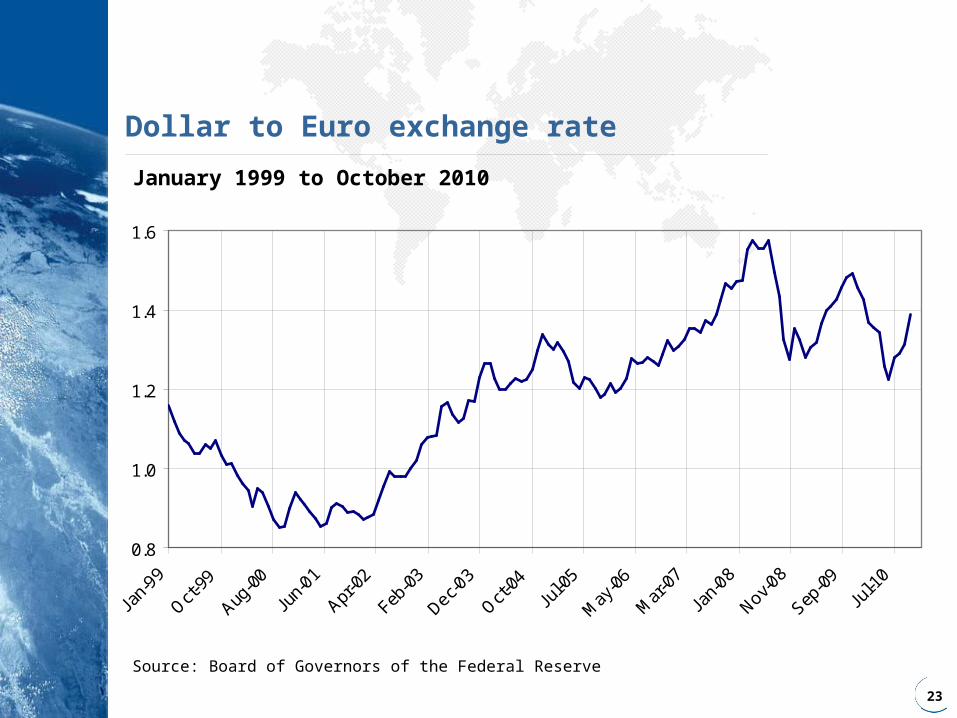
Dollar to Euro exchange rate
January 1999 to October 2010
Source: Board of Governors of the Federal Reserve
0.8
1.0
1.2
1.4
1.6
Jan-
99
Oct-99
Aug-0
0
Jun-
01
Apr-0
2
Feb-0
3
Dec-03
Oct-04
Jul-0
5
May
-06
Mar
-07
Jan-
08
Nov-08
Sep-0
9
Jul-1
0

24
Governance Gap
Global problems requiring collective action
Management of global environment
Fight against poverty
Global financial architecture
Nuclear proliferation
Illegal drugs
Terrorism and conflict prevention
Trade liberalization and distribution of benefits
Education


