The information herein has been obtained from sources we deem reliable. We do not, however, guarantee its accuracy. All information should be verified prior to purchase/leasing. View the Real Estate Agency Pamphlet by visiting our website, www.cra-nw.com/real-estate-agency-pamphlet/. CRA PRINTS WITH 30% POST-CONSUMER, RECYCLED-CONTENT MATERIAL 1 Mile 3 Mile 5 Mile Est. Population 43,800 175,248 423,139 Population Forecast 2022 47,196 189,389 456,214 Average HH Income $75,944 $92,868 $92,273 Employees 116,832 268,419 361,462 Source: Regis - SitesUSA (2017) Demographics Traffic Count SW Alder St – 9,871 ADT (14) Rental Rate Call for details 4,070 SF ground floor corner end-cap (available Summer 2017) Available Space 800 SW Alder St in Portland, OR Location THE GALT: PRIME CBD CORNER RETAIL LOCATED AT SW PARK & ALDER IN DOWNTOWN PORTLAND CONTACT: ASHLEY HEICHELBECH » [email protected]& KATHLEEN HEALY » [email protected]» 503.274.0211 COMMERCIAL REALTY ADVISORS NW LLC » 733 SW SECOND AVENUE, SUITE 200 » PORTLAND, OREGON 97204 » WWW.CRA-NW.COM » LICENSED BROKERS IN OREGON & WASHINGTON C RA • One of a kind character-rich building situated in downtown Portland’s CBD adjacent to premier hotels, restaurants & retailers and bordering downtown’s notable West End district. • Nearby high-sales retailers include The Mercantile, Target’s downtown flagship store, Zelda’s Shoe Bar, Aveda Gigi Salon & Spa, and Rich’s Cigar Store, among others. • The ground floor will be dedicated to retail with professional office space occupying the top two floors. Comments • Located directly across from the Cornelius Hotel (100-room boutique hotel currently under construction - slated to open in 2017) and The Westin. • Building currently undergoing major renovations, due for completion summer 2017. NORTH ELEVATION EAST ELEVATION
Transcript
The information herein has been obtained from sources we deem reliable. We do not, however, guarantee its accuracy. All information should be verified prior to purchase/leasing. View the Real Estate Agency Pamphlet by visiting our website, www.cra-nw.com/real-estate-agency-pamphlet/. CRA PRINTS WITH 30% POST-CONSUMER, RECYCLED-CONTENT MATERIAL
1 Mile 3 Mile 5 Mile
Est. Population 43,800 175,248 423,139Population Forecast 2022 47,196 189,389 456,214Average HH Income $75,944 $92,868 $92,273Employees 116,832 268,419 361,462
Source: Regis - SitesUSA (2017)
Demographics
Traffic Count SW Alder St – 9,871 ADT (14)
Rental Rate Call for details
4,070 SF ground floor corner end-cap (available Summer 2017)Available Space
800 SW Alder St in Portland, ORLocation
THE GALT: PRIME CBD CORNER RETAILLOCATED AT SW PARK & ALDER IN DOWNTOWN PORTLAND
CONTACT: ASHLEY HEICHELBECH » [email protected] & KATHLEEN HEALY » [email protected] » 503.274.0211 COMMERCIAL REALTY ADVISORS NW LLC » 733 SW SECOND AVENUE, SUITE 200 » PORTLAND, OREGON 97204 » WWW.CRA-NW.COM » LICENSED BROKERS IN OREGON & WASHINGTON
CRA
• One of a kind character-rich building situated in downtown Portland’s CBD adjacent to premier hotels, restaurants & retailers and bordering downtown’s notable West End district.
• Nearby high-sales retailers include The Mercantile, Target’s downtown flagship store, Zelda’s Shoe Bar, Aveda Gigi Salon & Spa, and Rich’s Cigar Store, among others.
• The ground floor will be dedicated to retail with professional office space occupying the top two floors.
Comments
• Located directly across from the Cornelius Hotel (100-room boutique hotel currently under construction - slated to open in 2017) and The Westin.
• Building currently undergoing major renovations, due for completion summer 2017.
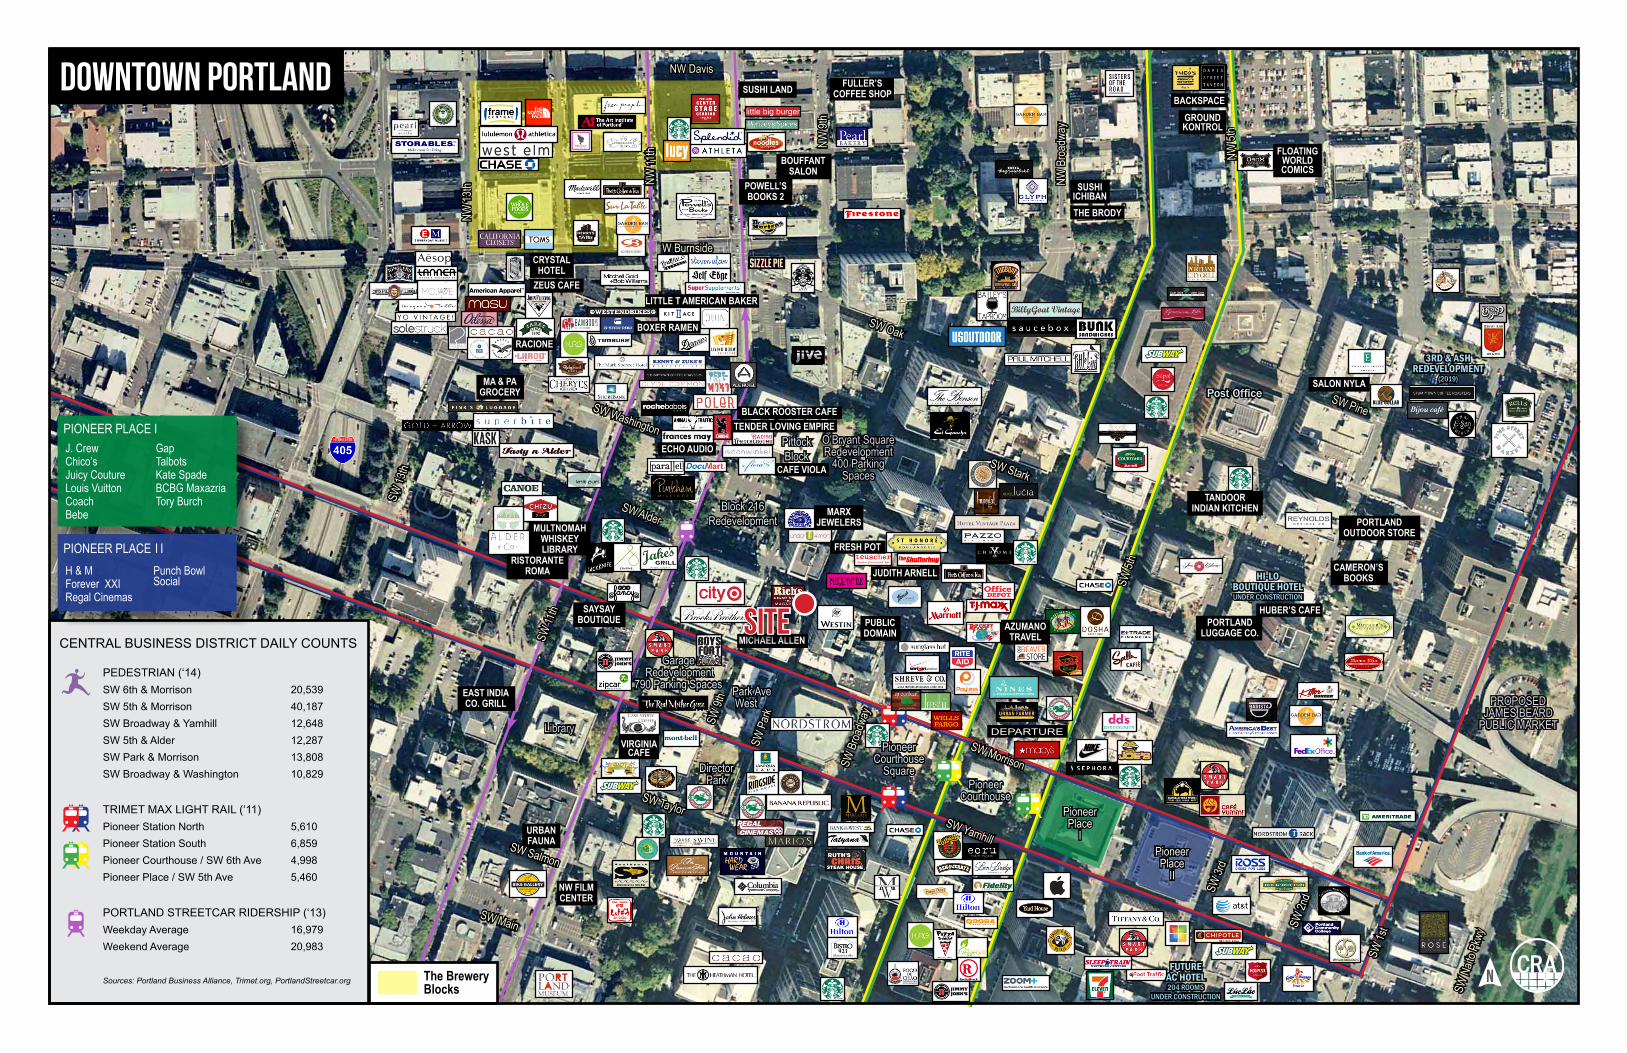
TRIMET MAX LIGHT RAIL (‘11)Pioneer Station North 5,610Pioneer Station South 6,859Pioneer Courthouse / SW 6th Ave 4,998Pioneer Place / SW 5th Ave 5,460
PORTLAND STREETCAR RIDERSHIP (‘13)Weekday Average 16,979Weekend Average 20,983
Sources: Portland Business Alliance, Trimet.org, PortlandStreetcar.org
PittockBlock
Pioneer Courthouse
SquarePioneer
Courthouse
Library
Pioneer Place
IPioneer Place
II
O’Bryant Square Redevelopment
400 Parking Spaces
Garage Redevelopment
790 Parking Spaces
DirectorPark
Park Ave West
Block 216Redevelopment
DEPARTURE
little big burger
PROPOSED JAMES BEARD
PUBLIC MARKET
Post Office
HI-LO BOUTIQUE HOTELUNDER CONSTRUCTION
FUTURE AC HOTEL204 ROOMS
UNDER CONSTRUCTION
3RD & ASH REDEVELOPMENT
(2019)
MULTNOMAH WHISKEY LIBRARY
CAFE VIOLA
SUSHI LAND FULLER’S COFFEE SHOP
POWELL’S BOOKS 2
BOUFFANT SALON
CRYSTAL HOTEL
ZEUS CAFE
MA & PA GROCERY
RACIONE
URBAN FAUNA
VIRGINIA CAFE
BOXER RAMEN
ECHO AUDIO
HUBER’S CAFE
EAST INDIACO. GRILL
SAYSAY BOUTIQUE
TANDOOR INDIAN KITCHEN
SUSHIICHIBAN
GROUND KONTROL
THE BRODY
BACKSPACE
FLOATING WORLD COMICS
MICHAEL ALLEN
NW FILM CENTER
BLACK ROOSTER CAFETENDER LOVING EMPIRE
AZUMANO TRAVEL
PORTLAND LUGGAGE CO.
PORTLAND OUTDOOR STORE
CAMERON’S BOOKS
SALON NYLA
FRESH POT
JUDITH ARNELL
PUBLIC DOMAIN
MARX JEWELERS
RISTORANTEROMA
LITTLE T AMERICAN BAKER
SW Morrison
SW Yamhill
SW Taylor
SW Salmon
SW Main
SW 5t
h
SW Washington
SW Alder
SW Oak
SW Pine
SW Stark
W Burnside
NW Davis
SW 13
th
SW 11
th
SW 9t
h
SW P
ark
SW B
roadw
ay
SW 3r
d
SW 2n
d
SW 1s
t
SW N
aito P
kwy
NW 13
th NW 11
th NW 9t
h
NW B
road
way
NW 5t
h
PIONEER PLACE IJ. CrewChico’sJuicy CoutureLouis VuittonCoachBebe
GapTalbotsKate SpadeBCBG MaxazriaTory Burch
PIONEER PLACE I IH & MForever XXIRegal Cinemas
Punch Bowl Social
The Brewery Blocks
CENTRAL BUSINESS DISTRICT DAILY COUNTS
CRAn
SITE
DOWNTOWN PORTLAND
SAYSAY BOUTIQUE MICHAEL ALLEN
MULTNOMAH WHISKEY LIBRARY
PUBLIC DOMAIN
DEPARTURE
URBAN FAUNA
VIRGINIA CAFE
FRESH POT
JUDITH ARNELL
AZUMANO TRAVEL
ZELDA’S SHOE BAR
13,977 adt
14,680 adt
10,398 adt
9,871 adt
18,100 adt
6,751 adt
Pioneer Courthouse
Square
Pioneer Courthouse
Pioneer Place
I
Pioneer Place
II
Park Ave West
Garage Redevelopment
790 Parking Spaces
Library
DirectorPark
Alder St Food Cart Pod
11th & MorrisonOffice & RetailRedevelopment Woodlark & Cornelius
Hotel Redevelopment
Redevelopment
SITE
SW B
road
way
SW 6
th A
ve
SW 5
th A
ve
SW 4
th A
ve
SW P
ark
Ave
SW 9
th A
ve
SW 1
0th
Ave
SW 1
1th
Ave
SW Alder
SW Washington
SW Morrison
SW Yamhill
SW Taylor
SW SalmonnCRA
DOWNTOWN PORTLAND | CLOSE-IN
The information contained herein has been obtained from sources Commercial Realty Advisors NW LLC deems reliable. We have no reason to doubt its accuracy, but Commercial Realty Advisors NW LLC does not guarantee the information. The prospective buyer or tenant should carefully verify all information obtained herein.
CRA
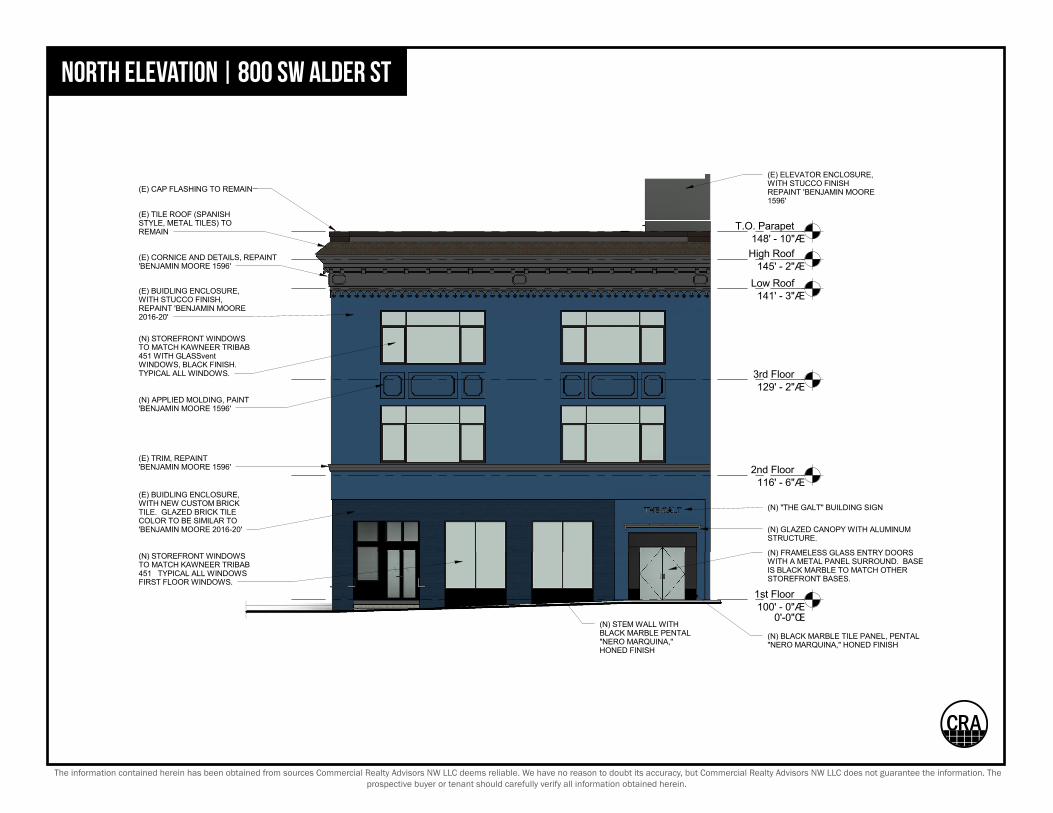
1st Floor100' - 0"Æ
0'-0"Œ
2nd Floor116' - 6"Æ
3rd Floor129' - 2"Æ
High Roof145' - 2"Æ
T.O. Parapet148' - 10"Æ
Low Roof141' - 3"Æ
(E) CAP FLASHING TO REMAIN
(E) TILE ROOF (SPANISHSTYLE, METAL TILES) TOREMAIN
(E) ELEVATOR ENCLOSURE,WITH STUCCO FINISHREPAINT 'BENJAMIN MOORE1596'
(N) STOREFRONT WINDOWSTO MATCH KAWNEER TRIBAB451 TYPICAL ALL WINDOWSFIRST FLOOR WINDOWS.
(E) TRIM, REPAINT'BENJAMIN MOORE 1596'
(N) BLACK MARBLE TILE PANEL, PENTAL"NERO MARQUINA," HONED FINISH
(N) "THE GALT" BUILDING SIGN
(N) APPLIED MOLDING, PAINT'BENJAMIN MOORE 1596'
(N) GLAZED CANOPY WITH ALUMINUMSTRUCTURE.
AR C H ITE C T S
808 SW Alder St Portland, OR 97205
August 31, 2016 DR-15COLORED NORTH ELEVATION
Project 215323
The information contained herein has been obtained from sources Commercial Realty Advisors NW LLC deems reliable. We have no reason to doubt its accuracy, but Commercial Realty Advisors NW LLC does not guarantee the information. The prospective buyer or tenant should carefully verify all information obtained herein.
CRA
NORTH ELEVATION | 800 SW ALDER ST
The information contained herein has been obtained from sources Commercial Realty Advisors NW LLC deems reliable. We have no reason to doubt its accuracy, but Commercial Realty Advisors NW LLC does not guarantee the information. The prospective buyer or tenant should carefully verify all information obtained herein.
FULL PROFILE2000-2010 Census, 2017 Estimates with 2022 ProjectionsCalculated using Weighted Block Centroid from Block Groups
Lat/Lon: 45.5202/-122.6804RF1
800 SW Alder St1 mi radius 3 mi radius 5 mi radius
Portland, OR 97205-3107
PO
PU
LATI
ON
2017 Estimated Population 43,800 175,248 423,1392022 Projected Population 47,196 189,389 456,2142010 Census Population 36,848 149,040 380,3302000 Census Population 26,639 132,031 353,906Projected Annual Growth 2017 to 2022 1.6% 1.6% 1.6%Historical Annual Growth 2000 to 2017 3.8% 1.9% 1.2%
HO
US
EH
OLD
S 2017 Estimated Households 27,445 90,636 195,2142022 Projected Households 29,421 96,876 208,4982010 Census Households 22,770 76,378 175,0182000 Census Households 17,144 66,722 159,331Projected Annual Growth 2017 to 2022 1.4% 1.4% 1.4%Historical Annual Growth 2000 to 2017 3.5% 2.1% 1.3%
AG
E
2017 Est. Population Under 10 Years 4.2% 8.6% 9.9%2017 Est. Population 10 to 19 Years 5.6% 7.0% 8.3%2017 Est. Population 20 to 29 Years 25.8% 19.0% 15.6%2017 Est. Population 30 to 44 Years 28.6% 29.2% 28.2%2017 Est. Population 45 to 59 Years 17.8% 18.2% 19.0%2017 Est. Population 60 to 74 Years 14.3% 13.8% 14.1%2017 Est. Population 75 Years or Over 3.8% 4.1% 4.8%2017 Est. Median Age 36.2 36.8 37.6
MA
RIT
AL
STA
TUS
&
GE
ND
ER
2017 Est. Male Population 55.0% 50.8% 49.5%2017 Est. Female Population 45.0% 49.2% 50.5%
2017 Est. Never Married 58.1% 49.2% 42.9%2017 Est. Now Married 20.4% 32.0% 38.0%2017 Est. Separated or Divorced 18.4% 15.6% 15.5%2017 Est. Widowed 3.1% 3.2% 3.6%
INC
OM
E
2017 Est. HH Income $200,000 or More 9.0% 12.6% 11.0%2017 Est. HH Income $150,000 to $199,999 4.3% 7.1% 7.3%2017 Est. HH Income $100,000 to $149,999 11.9% 14.1% 16.1%2017 Est. HH Income $75,000 to $99,999 10.6% 11.9% 12.9%2017 Est. HH Income $50,000 to $74,999 13.2% 13.7% 15.7%2017 Est. HH Income $35,000 to $49,999 10.3% 10.5% 10.9%2017 Est. HH Income $25,000 to $34,999 9.1% 8.4% 7.9%2017 Est. HH Income $15,000 to $24,999 9.9% 8.1% 7.4%2017 Est. HH Income Under $15,000 21.8% 13.6% 10.9%2017 Est. Average Household Income $75,944 $92,868 $92,2732017 Est. Median Household Income $53,336 $74,149 $76,1592017 Est. Per Capita Income $48,927 $48,481 $42,881
2017 Est. Total Businesses 9,343 22,326 33,1582017 Est. Total Employees 116,832 268,419 361,462
FULL PROFILE2000-2010 Census, 2017 Estimates with 2022 ProjectionsCalculated using Weighted Block Centroid from Block Groups
Lat/Lon: 45.5202/-122.6804RF1
800 SW Alder St1 mi radius 3 mi radius 5 mi radius
Portland, OR 97205-3107
RA
CE
2017 Est. White 79.6% 81.1% 80.1%2017 Est. Black 5.2% 5.9% 5.8%2017 Est. Asian or Pacific Islander 7.5% 5.4% 6.0%2017 Est. American Indian or Alaska Native 1.0% 0.8% 0.8%2017 Est. Other Races 6.7% 6.9% 7.3%
HIS
PA
NIC 2017 Est. Hispanic Population 2,866 12,468 30,450
2017 Est. Hispanic Population 6.5% 7.1% 7.2%2022 Proj. Hispanic Population 7.2% 7.9% 8.0%2010 Hispanic Population 5.8% 5.5% 6.2%
ED
UC
ATI
ON
(Adu
lts 2
5 or
Old
er)
2017 Est. Adult Population (25 Years or Over) 34,519 135,103 319,4962017 Est. Elementary (Grade Level 0 to 8) 1.1% 1.2% 1.6%2017 Est. Some High School (Grade Level 9 to 11) 3.2% 2.4% 2.7%2017 Est. High School Graduate 8.4% 8.8% 11.1%2017 Est. Some College 20.1% 17.8% 19.3%2017 Est. Associate Degree Only 5.7% 5.8% 6.5%2017 Est. Bachelor Degree Only 35.7% 36.2% 34.2%2017 Est. Graduate Degree 25.8% 27.9% 24.5%
HO
US
ING 2017 Est. Total Housing Units 29,106 94,380 201,815
2017 Est. Owner-Occupied 15.8% 33.9% 47.8%2017 Est. Renter-Occupied 78.5% 62.1% 48.9%2017 Est. Vacant Housing 5.7% 4.0% 3.3%
HO
ME
S B
UIL
T B
Y Y
EA
R 2010 Homes Built 2005 or later 0.6% 0.9% 0.6%2010 Homes Built 2000 to 2004 24.2% 13.9% 10.4%2010 Homes Built 1990 to 1999 14.5% 9.7% 8.8%2010 Homes Built 1980 to 1989 9.7% 6.7% 6.5%2010 Homes Built 1970 to 1979 9.1% 10.2% 11.3%2010 Homes Built 1960 to 1969 9.4% 9.7% 10.1%2010 Homes Built 1950 to 1959 8.2% 9.1% 11.9%2010 Homes Built Before 1949 40.8% 53.6% 49.0%
HO
ME
VA
LUE
S
2010 Home Value $1,000,000 or More 4.4% 3.7% 2.0%2010 Home Value $500,000 to $999,999 34.6% 40.1% 27.3%2010 Home Value $400,000 to $499,999 15.0% 19.6% 18.9%2010 Home Value $300,000 to $399,999 25.2% 21.6% 25.8%2010 Home Value $200,000 to $299,999 18.7% 14.6% 23.2%2010 Home Value $150,000 to $199,999 4.8% 2.9% 4.0%2010 Home Value $100,000 to $149,999 1.8% 1.3% 1.7%2010 Home Value $50,000 to $99,999 0.3% 0.4% 0.5%2010 Home Value $25,000 to $49,999 0.2% 0.3% 0.4%2010 Home Value Under $25,000 1.0% 0.8% 1.1%2010 Median Home Value $452,073 $488,166 $411,6282010 Median Rent $1,022 $1,008 $992
FULL PROFILE2000-2010 Census, 2017 Estimates with 2022 ProjectionsCalculated using Weighted Block Centroid from Block Groups
Lat/Lon: 45.5202/-122.6804RF1
800 SW Alder St1 mi radius 3 mi radius 5 mi radius
Portland, OR 97205-3107
LAB
OR
FO
RC
E
2017 Est. Labor Population Age 16 Years or Over 41,223 153,193 361,1312017 Est. Civilian Employed 62.4% 69.0% 68.7%2017 Est. Civilian Unemployed 4.2% 2.8% 2.8%2017 Est. in Armed Forces - - - 2017 Est. not in Labor Force 33.4% 28.2% 28.5%2017 Labor Force Males 55.3% 50.9% 49.3%2017 Labor Force Females 44.7% 49.1% 50.7%
OC
CU
PA
TIO
N
2010 Occupation: Population Age 16 Years or Over 25,898 105,518 247,9662010 Mgmt, Business, & Financial Operations 23.4% 21.9% 20.7%2010 Professional, Related 33.3% 35.6% 34.1%2010 Service 14.7% 15.7% 15.6%2010 Sales, Office 21.5% 18.3% 19.3%2010 Farming, Fishing, Forestry 0.7% 0.5% 0.4%2010 Construction, Extraction, Maintenance 1.6% 2.4% 3.2%2010 Production, Transport, Material Moving 4.8% 5.6% 6.6%2010 White Collar Workers 78.2% 75.8% 74.1%2010 Blue Collar Workers 21.8% 24.2% 25.9%
TRA
NS
PO
RTA
TIO
NTO
WO
RK
2010 Drive to Work Alone 45.8% 51.1% 55.9%2010 Drive to Work in Carpool 5.2% 6.3% 7.3%2010 Travel to Work by Public Transportation 16.0% 14.7% 13.4%2010 Drive to Work on Motorcycle 0.3% 0.5% 0.5%2010 Walk or Bicycle to Work 23.3% 18.2% 14.2%2010 Other Means 1.0% 0.7% 0.7%2010 Work at Home 8.5% 8.5% 8.0%
TRA
VE
L TI
ME 2010 Travel to Work in 14 Minutes or Less 31.0% 27.4% 23.0%
2010 Travel to Work in 15 to 29 Minutes 38.5% 45.0% 45.4%2010 Travel to Work in 30 to 59 Minutes 24.9% 26.9% 30.3%2010 Travel to Work in 60 Minutes or More 7.1% 6.0% 6.4%2010 Average Travel Time to Work 20.5 21.1 22.5
CO
NS
UM
ER
EX
PE
ND
ITU
RE
2017 Est. Total Household Expenditure $1.58 B $6.00 B $12.9 B2017 Est. Apparel $55.2 M $211 M $453 M2017 Est. Contributions, Gifts $113 M $456 M $963 M2017 Est. Education, Reading $68.3 M $266 M $559 M2017 Est. Entertainment $87.4 M $337 M $727 M2017 Est. Food, Beverages, Tobacco $239 M $891 M $1.92 B2017 Est. Furnishings, Equipment $54.0 M $211 M $454 M2017 Est. Health Care, Insurance $139 M $512 M $1.10 B2017 Est. Household Operations, Shelter, Utilities $494 M $1.86 B $4.00 B2017 Est. Miscellaneous Expenses $23.7 M $87.3 M $188 M2017 Est. Personal Care $20.6 M $77.7 M $167 M2017 Est. Transportation $284 M $1.08 B $2.37 B