80
The Genetic Epidemiology of Complex Diseases: Myopia Eric Yap Research Director Biomedical Sciences Laboratory Defence Medical Research Institute [email protected]

The Genetic Epidemiology of Complex Diseases: Myopia
Eric YapResearch Director
Biomedical Sciences LaboratoryDefence Medical Research Institute

"...a sickly child, with thin limbs and a large, pasty face surrounded by dark curly hair. He was born with defective eyesight-myopia plus anocular polyopy (multiple vision). His stomach and gall bladder gave constant trouble; he suffered from boils, rashes, and possibly from piles, for he tells us that he could never sit still for any length of time..."
Johannes Kepler(1571-1630)
• inverted image on retina• role of cornea and lens• concave & convex lenses• myope’s image in front of retina• alterations in eye shape allow distant and near vision• “near work” hypothesis: study and fine work in childhood accustoms eye to near objects, resulting in permanent finite far point.

FACE-REST DESIGNED BY KALLMANN, A GERMAN
OPTICIAN

Optics of Myopia
MYOPIAEMMETROPIA
Axial length
Corneal curvature
Refractive
Lens power
1 D = 0.32 - 0.45 mm axial length

Biometric variation
Normally distributed:– lens power– corneal power– total refraction– anterior chamber depth
Peaked, Skewed:– axial length
Emmetropization
Tron (1934): 275 eyesStenstrom (1946): 1000 eyes

Schooling and MyopiaPrevalence of myopia in 10,060 children
Thirty three Schools Grade and % of Myopiain Breslau VIII VII VI V IV III II I
5 Village schools 1 2 320 Municipal elementary 3 4 102 Middle schools 0 10 6 13 9 15 2 Girls’ high schools 1 2 7 8 6 16 12 19Holy Ghost Real 7 12 25 27 25 59Zwinger 11 21 13 23 28 29Elizabeth Gymnasium 11 17 19 31 48 65Magdelen Gymnasium 14 19 28 30 35 47
Cohn H: Hygiene of the eye. London, Simpkin, Marshall & Co, 1886

Education and Myopia
Education strongly associated with risk of myopia
Severity of myopia increased with increasing level of education
Myopia in Different Educational Groups
68% 71% 73%81%
90% 88% 86%
3% 4% 6%12%
24%18% 21%
0%
10%
20%
30%
40%
50%
60%
70%
80%
90%
100%
NFE Pri PSLE O A Dip Uni
Educational Status
Prev
alen
ce
Myopia Severe Myopia

Genetic EpidemiologyStages in identifying disease genes
RESEARCH QUESTION
Disease characteristics?
Familial clustering?
Genetic or Environmental?
Mode of inheritance?
Disease susceptibility loci?
Gene? Mutation?
METHOD/APPROACH
– Descriptive epidemiology
– Family aggregation
studies
– Twin/Adoption studies
– Segregation analysis
– Linkage analysis
– Association studies
OBJECT
Species
Population
Family
Genetic locus
Gene
Mutation

Genetic Epidemiology of Complex DiseasesLogic flow in identifying disease genes
RESEARCH QUESTIONS
Disease prevalence and features?
Familial clustering?
Genetic or Environmental?
Mode of inheritance?
Disease susceptibility loci?
Gene? Mutation?

Population Studies
Disease prevalence? Phenotypes? Risk factors?
Epidemiology of Genetic Traits and Disease
Descriptive studies of distribution– geographic differences– ethnic differences– phenotype, intermediate phenotypes

Refractive Errors in Singapore
0
500
1000
1500
2000
25002 1 0 -1 -2 -3 -4 -5 -6 -7 -8 -9 -10
-11
-12
Spherical Equivalence (D)
No. o
f Sub
ject
s
Emmetropes: 16.2%
Mild & Moderate Myopes: 67.9%
Severe Myopes: 15.4%
15095 male subjects, mean age: 19 yrs, cohort: 1996/7
Overall Mean Sph Eq = -2.6D
0.5%

Distribution of Refractive Errors in Young Singaporean
0.05
0.15
0.25
Chinese - 2.75D
Nor: 16.2%
Mild & Moderate Myopia: 67.9%
Severe Myopia: 15.4%
Long:0.5%
Overall Median Sph Eq = -2.25D
Indian -1.13DMalay - 0.88D
17.3%
7.7%
5.9%
0.2
Freq
uenc
y
0.1
0
-12-10 -11-1 -2 -3 -4 -5 -6 -8 -9-73 2 1 0Refraction of worse eye (D)
15,095 subjects, mean age: 19 yrs, cohort: 1996/7

Age of Onset of Myopia
0
2
4
6
8
10
12
14
16
18
20
-20-18-16-14-12-10-8-6-4-20
Refractive Error at Age 19
Age
whe
n sp
ecta
cles
firs
t wor
n
Onset
Ave Onset

Myopia Complications
Peripheral Retinal Degeneration
0%10%20%30%40%50%60%70%80%90%
100%
-1 -2 -3 -4 -5 -6 -7 -8 -9 -10 -11
Refractive Error (D)
Pre
vale
nce
Macular Changes
0%10%20%30%40%50%60%70%80%90%
100%
2 1 0 -1 -2 -3 -4 -5 -6 -7 -8 -9 -10 -11 -12 -13
Refractive Error (D)
Grade VIGrade IIIGrade IIGrade I
Peripheral retinal changes in myopia (943 eyes)
Stages of macular change in myopia (1110 eyes)

Contrast Sensitivity Function
0.1
1
10
1000 1.5 3 6 12 20
Spatial Frequency (CPD)
Emmetropes+1.00 D to -1.00 D
Low Myopes-1.00 D to -6.00 D
High Myopesabove -6.00 D
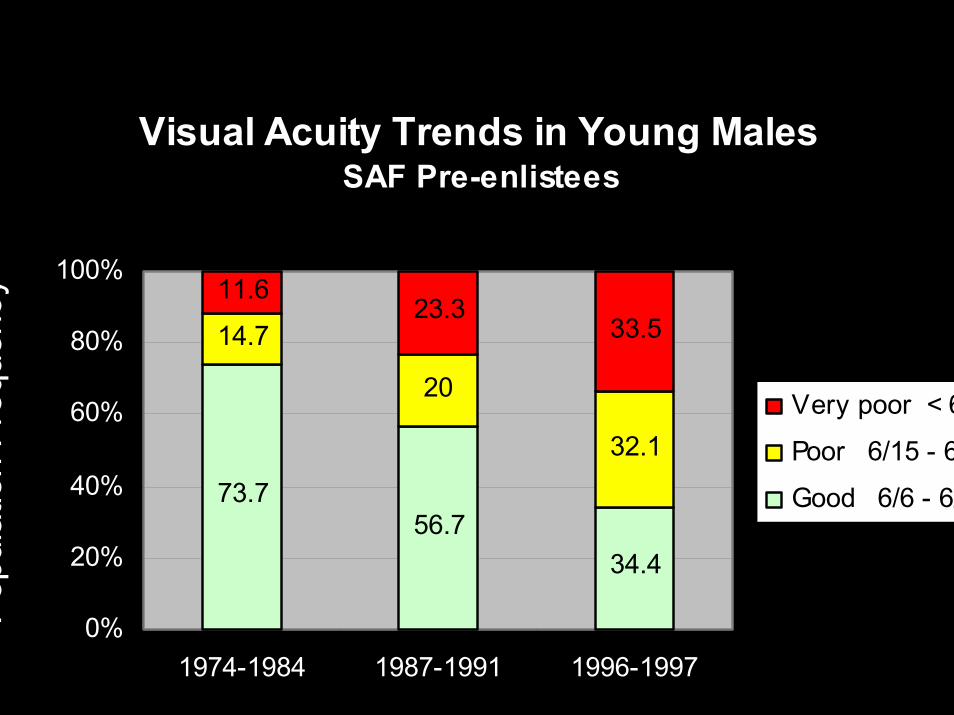
Visual Acuity Trends in Young MalesSAF Pre-enlistees
73.756.7
34.4
14.7
20
32.1
11.623.3
33.5
0%
20%
40%
60%
80%
100%
1974-1984 1987-1991 1996-1997
Popu
latio
n Fr
eque
ncy
Very poor < 6
Poor 6/15 - 6
Good 6/6 - 6/

Refractive Error Trends in Males
0%20%40%60%80%
100%P
opul
atio
n Fr
eque
ncy
<-12.25 0.2% 0.3%
-8.25 to –12.00 1.5% 3.2%
-3.25 to –8.00 30.8% 37.4%
-0.75 to –3.00 28.5% 34.2%
+0.50 to –0.50 39.0% 24.9%
1993 1996-7

Familial clustering
Is there clustering of cases in families?
Family aggregation studies“Is disease more prevalent in relatives of affected than
relatives of non-affecteds?” – Relative risk, λs
– Biases: ascertainment, self-reporting (over/under), diagnostic categories, double-blind/co-morbidity studies, sampling bias
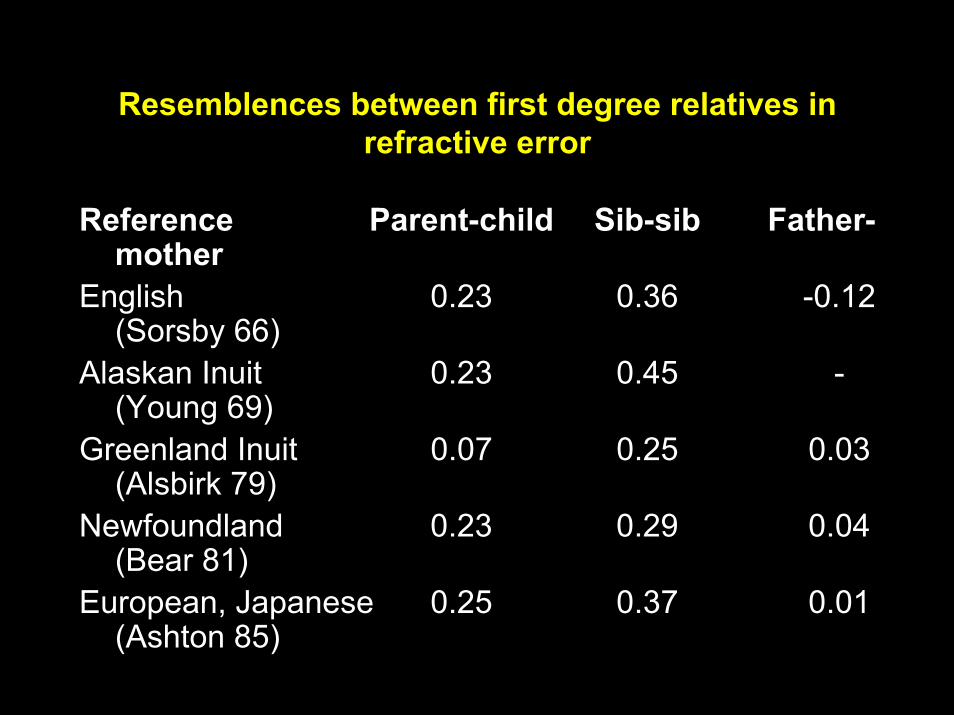
Resemblences between first degree relatives in refractive error
Reference Parent-child Sib-sib Father-mother
English 0.23 0.36 -0.12(Sorsby 66)
Alaskan Inuit 0.23 0.45 -(Young 69)
Greenland Inuit 0.07 0.25 0.03(Alsbirk 79)
Newfoundland 0.23 0.29 0.04(Bear 81)
European, Japanese 0.25 0.37 0.01(Ashton 85)

Family History
No. of Subjects who are No. of Myopic Parents Emmetropic Myopic Severely Myopic
0 47 215 106 1 or 2 20 330 234
Odds Ratio 1 3.61 5.19 P < 0.001 < 0.001
Parental History & Myopia (952 subjects)
No. of Subjects who are Myopic Siblings Emmetropic Myopic Severely Myopic
YES 34 473 304 NO 42 68 26
Odds Ratio 1 8.59 14.4 P < 0.001 < 0.001
Sibling History & Myopia (947 subjects)

Evidence of Familial Clustering of MyopiaDMRI Survey of 617 refracted subjects, 1997
20%
40%
60%
80%
100%Severe Myopia
Mild-ModerateMyopia
Non-myopia
0%No myopic
parentWith myopic
parent(s)Non-myopic sibMyopic sib(s)
Increased relative risks of myopia and severe myopia:OR = 3.6 and 5.2 (parental history)OR = 8.6 and 14.4 (sibling history)

Genetics or Environment
Is familial clustering due to common environment, inherited (genetic) susceptibility or shared cultural risk factors?
Twin studies“Is risk in identical twin of affected greater than in fraternal twin of
affected?” Concordance, discordance
Adoption studies“Is risk in biological relatives of affected adoptees greater than adopted
relatives of affected adoptees?” [Adoption bias]“Is risk in biological relatives of affected adoptees greater than biological
relatives of unaffected adoptees?”

Twin Concordance Studies
Shared Environment
Unique Environment
Genetics
DZ
MZPhenotype
sharing
0 0.5 1
Genetic sharing

Twin Studies in Myopia
MZDZ
Country Age Diag MZ DZ ConMZ ConDZ h Ref
Finland Adult 0.5D 54 55 0.80 0.51 0.58 Teikari 91
Taipei 7-23yrs QTL 49 37 0.65 0.46 0.24 Lin 87
Shanghai 7-19yrs Lo, 5D 49 37 0.82 0.58 0.61 Hu 81
Taipei 10-15yrs 0.5D 238 123 0.89 0.51 - Chen 87
Italy 3-7yrs QTL 19 20 - - 0.08-0.14 Angi 93

Next Session

Wayne Stayskal, Tampa, FL

Genetic EpidemiologyStages in identifying disease genes
RESEARCH QUESTION
Disease characteristics?
Familial clustering?
Genetic or Environmental?
Mode of inheritance?
Disease susceptibility loci?
Gene? Mutation?
METHOD/APPROACH
– Descriptive epidemiology
– Family aggregation
studies
– Twin/Adoption studies
– Segregation analysis
– Linkage analysis
– Association studies
OBJECT
Species
Population
Family
Genetic locus
Gene
Mutation

Mode of Inheritance
How is genetic susceptibility inherited?
Segregation analysis
“Is distribution of affected individuals within families consistent with a specific genetic model?”

Modes of inheritance
Single gene (Mendelian)– Autosomal
• recessive• dominant
– X-linkedSingle gene (non-Mendelian)
– Mitochondrial, ImprintedMultiple gene (complex, quantitative trait)
– digenic– oligogenic– polygenic

X-linked MyopiaBEDPartial BEDDeuteranopia
Bornholm Eye Disease:• bilateral myopia >=6D• amblyopia• optic nerve hypoplasia• RPE thinning• subnormal ERG flicke• deuteranopia
M Schwartz et al (1990) Clinical Genetics 38:281-6

An L-type calcium-channel gene mutated in incomplete X-linked congenital stationary night
blindnessTim M. Strom et al. Nature Genetics 19, 260 – 263 (1998)

Loss-of-function mutations in a calcium-channel 1-subunit gene in Xp11.23 cause incomplete X-linked
congenital stationary night blindness N. Torben Bech-Hansen et al. Nature Genetics 19, 264 – 267 (1998)

Pseudo-Mendelian Traits
Category of Adult Relatives (n) Trait (%)Fathers (249) 16.1Mothers (249) 6.0Siblings (137) 21.9Grandparents (598) 2.8Uncles / Aunts (1313) 2.1
• Overall first degree relatives 13.4• General population 0.22• Relative risk (first degree relative) 60.9• Overall second degree relatives 2.4• Relative risk (second degree relative) 10.7
“Simulation of Mendelism revisted: the recessive trait for attending medical school” P McGuffin & P Huckle 1990: Am J Hum Genet 46:994-9

Genetic Loci
Where are the genetic loci / susceptibility genes?
Linkage analysis“Is hypothetical susceptibility gene near a known genetic
marker?”– Parametric (requires known model, estimation of θ,
penetrance): extended pedigree– Nonparametric: Affected relative pair analysis (eg. sib-pair)

Approaches to Linkage and Association
Linkage AnalysisParametric AnalysisNon-parametric Analysis
Affected relative pairs
Linkage Disequilibrium / Association AnalysisCase-controlFamily-based association

Genetic Linkage Analysis
c/da/b
Classical Linkage Sib-pair Linkage
•120 concordant Sib Pairs•SAF and SERI•top 10 percentile•Chinese

Human Genetics Approaches
Candidate Gene“Hypothesis”
Genome Wide“Discovery”
a/b c/d
a/c
Case Control Association
Family Based Association
Sib-pair Linkage
n = 95 severe myopesn = 120 concordant sib pairs

Tools for Linkage and Association Analysis
MarkersShort Tandem Repeats / MicrosatellitesMinisatellites / Variable Number of Tandem RepeatsSingle Nucleotide Polymorphisms
Maps
Genotyping Technologies

CH
RO
MO
SOM
E L
INK
AG
E M
AP
OF
TH
E
OX
FOR
D M
ICR
OSA
TE
LL
ITE
SE
T (R
eed)

Non-Parametric Linkage Analysis
Affected Relative PairsSib Pair - concordant
discordant
c/da/b
Alleles IBDa/c 0 b/da/c 1 b/ca/c 1 a/da/c 2 a/c
Alleles Identical by DescentSib-pairs sharing 0 1 2No linkage 25% 50% 25%Linkage eg 10% 55% 35%

Non-Parametric Linkage Analysis
without parental info
Alleles IBSa/c 0 b/da/c 1 b/ca/c 1 a/da/c 2 a/c
Alleles Identical by State

Mapping Complex Traits by Genome Wide Linkage Analysis
Type I diabetesType II diabetesMultiple sclerosisRheumatoid arthritisCrohn’s diseaseEssential hypertensionCoronary artery diseaseAsthmaAlcoholismSchizophrenia
Many others

cM
11.32
11.31
11.2
11.17.6cM
D18S1140
“Evidence that a locus for familial high myopia maps to chromosome 18p.”Young TL et al. (1998) Am J Hum Genet 63:109-19.
D18S591.5
D18S476D18S11460.1
4.5
D18S4811.4
D18S63D18S11380.1
0.7 D18S52
9.4
D18S62
18.6
D18S11504.1
D18S1116Idiogram of Chromosome 18
Genethon Genetic Map

D12S1052D12S1684D12S1708D12S81D12S1710D12S351
D12S393
D12S1588
D12S318
30.1cM
Idiogram of Chromosome 12
Genethon Genetic Map
D12S327D12S1716
24.324.224.12322
21
15141312
11.2
12
13
D12S1706D12S346D12S1671 “A second locus for familial
high myopia maps to chromosome 12q.”Young TL et al. (1998) Am J Hum Genet 63:1419-24
D12S306D12S1607PAH
D12S1074D12S360D12S78D12S338D12S1075D12S317D12S1605D12S2070


Sib –pair IBD analysis (MLS)
Data not available

Sib –pair IBD analysis
Data not available

Multipoint non-parametric linkage analysis (NPL)
NPL score: 2.23
TDT analysis
Data not available

Population-optimal marker panelsComparison of established panels among
Caucasian, Japanese and Chinese
Wu Hui Min / Tan Ene ChooRita Yong, Selena Tan, Joyce Chang,
Linda Gan, Eric Yap

Whole genome STR marker in 200 unrelated Chinese individuals
0.000.100.200.300.400.500.600.700.800.901.00
0 5 10 15 20 25Number of Alleles
Het
eroz
ygos
ity

Heterozygosity of STR markers in 3 populations
0
10
20
30
40
50
60
<0.3
0
0.31
-0.4
0
0.41
- 0.
50
0.51
- 0.
60
0.61
- 0.
70
0.71
- 0.
80
0.81
- 0.
90
> 0.
90
Heterozygosity
Freq
uenc
y (%
)
Caucasian Japanese Chinese
Caucasian 90.8%Japanese 63.7%Chinese 63.6%
h > 0.7

Heterozygosity of STR markers in 3 populations
0
5
10
15
20
25
30
-45 -40 -35 -30 -25 -20 -15 -10 -5 0 5 10 15 20 25 30 35 40 45
Difference in Heterozygosity
Freq
uenc
y (%
)
Chinese vs Caucasians
Chinese vs Japanese
Less informative in ChineseMore informative in Chinese

• 285 STR marker panel (Reed et al.)– Oxford panel selected from Genethon
• Median heterozygosity 0.72 (Tan/Wu, Luo)
• h independent of sample size – Simulation: 10<n<200 for 2-27 alleles
• Propose using 192 STR with h >0.7, covering 84% of genome at 20cM

Mining for polymorphic STR useful for high resolution genetic mapping
Liu Hai Feng, Teow Loo NinWu Hui Min, Linda Gan, Ng Sock Hoon,
Eric Yap

Genome/Contig sequence
Identify tandem repeats
parser Tandem Repeat Finder
Wet lab validation and use
$$$

Map of Chromosome 12q21(83 Mb to 95 Mb)
Repeats 1 2 3 4 5 6 more total
Number 12 50 3 24 8 7 112 216
1 cM
Predicted dinucleotide repeats in chromosome 12q (85 Mb - 95 Mb) by TRF
No. of contigs: 18 (build 29)
Total length: 10,468 kb
No. of DTR: 789 (Density : 0.075 per kb or 1 per 13.3kb)

Genome/Contig sequence
Identify tandem repeats
parser Tandem Repeat Finder
Predict highly polymorphic STR
Machine learning MLAP
Wet lab validation and use

Machine Learning for Predicting Polymorphisms
• Learning and test set– Genethon dinucleotide markers
• Highly polymorphic h>0.8• Lowly polymorphic h<0.5
• Parameters– Mechanism: strand slippage during replication

Machine learning algorithm for prediction of high-polymorphic DTRs
Data not available

Characteristics of MLAP Predictions
304
454
31
NP P HP
The no. of predicted polymorphism of candidate DTRs by MLAP, where “NP” represents non-polymorphic(Het < 0.5), “HP” represents highly polymorphic (Het > 0.8), and “P” represents those with Het between 0.5 and 0.8.

H <
0.10
0.10
£ H
< 0
.20
0.20
£ H
< 0
.30
0.30
£ H
< 0
.40
0.40
£ H
< 0
.50
0.50
£ H
< 0
.60
0.60
£ H
< 0
.70
0.70
£ H
< 0
.80
0.80
£ H
< 0
.90
0.90
£ H
< 1
.00
AT
C A0
2
4
6
8
10
12
Heterozygosity
Type of repeat and polymorphism
AT
GA
CA

H <
0.10
0.10
£ H
< 0
.20
0.20
£ H
< 0
.30
0.30
£ H
< 0
.40
0.40
£ H
< 0
.50
0.50
£ H
< 0
.60
0.60
£ H
< 0
.70
0.70
£ H
< 0
.80
0.80
£ H
< 0
.90
0.90
£ H
< 1
.00
INTRA
012345678
Heterozygosity
INTRA
INTER
Position and polymorphism
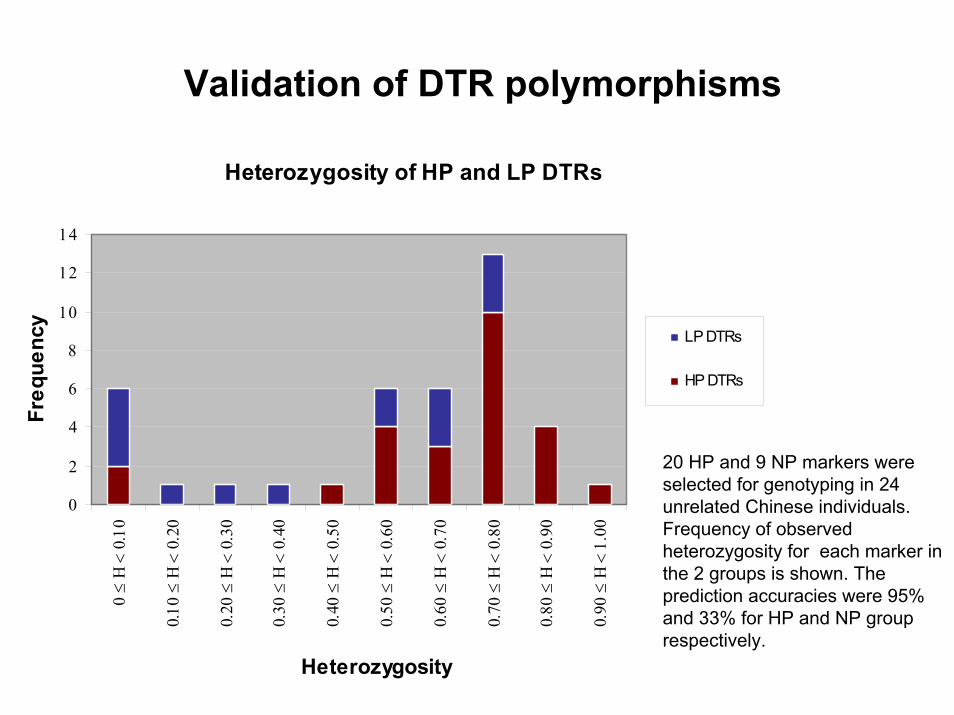
Validation of DTR polymorphisms
Heterozygosity of HP and LP DTRs
0
2
4
6
8
10
12
14
0 ≤
Η <
0.1
0
0.10
≤ Η
< 0
.20
0.20
≤ Η
< 0
.30
0.30
≤ Η
< 0
.40
0.40
≤ Η
< 0
.50
0.50
≤ Η
< 0
.60
0.60
≤ Η
< 0
.70
0.70
≤ Η
< 0
.80
0.80
≤ Η
< 0
.90
0.90
≤ Η
< 1
.00
Heterozygosity
Freq
uenc
y
LP DTRs
HP DTRs
20 HP and 9 NP markers were selected for genotyping in 24 unrelated Chinese individuals. Frequency of observed heterozygosity for each marker in the 2 groups is shown. The prediction accuracies were 95% and 33% for HP and NP group respectively.

Gene and Mutation
What gene and mutations are associated with diseas
Disease-genotype association, linkage dysequilibrium“Do affected individuals have certain allele/genotype more often
than by chance?”– Population-based allelic association– Family-based allelic association
Mutation analysis“Are there functional mutations that account for phenotype?”

Gene Association Studies
a/b c/d
a/c
Case Control Association
Family Based Association

Population Admixture
Allele m
Allele M
Differing allelic frequencies and disease prevalences in two subpopulations, with no biological association –> Apparent associationIf both subpopulations mate randomly and completely (panmixia), then population is homogeneous and admixture is no longer significant.To overcome artifacts:
– use homogeneous populations– replicate study in several
populations– use meiotic (family-based)
association studies
Population I Population II
HEALTHY HEALTHYDISEASE

Family-Based Association
Types of analyses:Haplotype relative risk (HRR) Rubinstein& FalkAffected family-based controls (AFBAC) ThomsonTransmission distortion test (TDT) Spielman
a/b c/d
a/c
HRR eg.Alleles a b c dtransmitted 1 0 1 0not transmitted 0 1 0 1
“Are alleles a and c transmitted more frequently in affected than alleles b and d?”

Trabecular Meshwork Inducible Glucocrticoid Receptor(TIGR) or Myocilin Gene
NGA17
NGA19Exon 1 Exon 3Exon 2
-224
C/T
-103 to –99
TATA boxNGA17
NGA19Exon 1 Exon 3Exon 2
-224
C/T
-103 to –99
TATA box
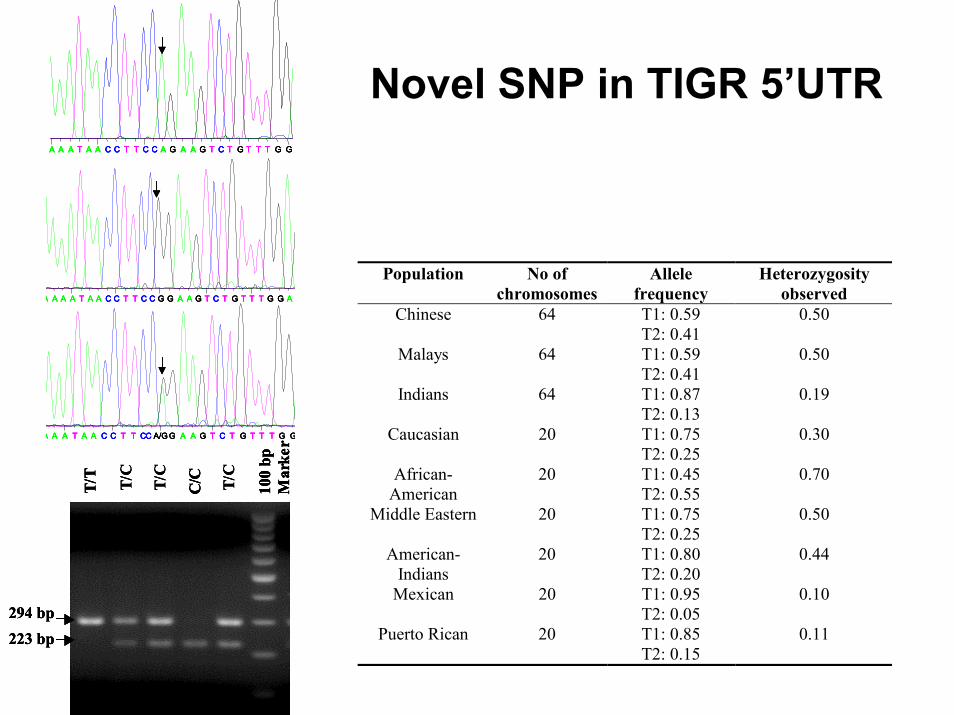
A A A T A A C C T T CC A/G G A A G T C T G T T T G G
A A A T A A C C T T C C A G A A G T C T G T T T G G A
A A A A T A A C C T T C C G G A A G T C T G T T T G G A
A A A T A A C C T T CC A/G G A A G T C T G T T T G GA A A T A A C C T T CC A/G G A A G T C T G T T T G GA A A T A A C C T T CC A/G G A A G T C T G T T T G G
A A A T A A C C T T C C A G A A G T C T G T T T G G A
A A A A T A A C C T T C C G G A A G T C T G T T T G G A
A A A T A A C C T T C C A G A A G T C T G T T T G G AA A A T A A C C T T C C A G A A G T C T G T T T G G A
A A A A T A A C C T T C C G G A A G T C T G T T T G G AA A A A T A A C C T T C C G G A A G T C T G T T T G G A
100
bp
Mar
ker
T/T
C/C T/
C
T/C
T/C
294 bp223 bp
100
bp
Mar
ker
T/T
C/C T/
C
T/C
T/C
100
bp
Mar
ker
T/T
C/C
100
bp
Mar
ker
T/T
C/C T/
C
T/C
T/C
294 bp223 bp294 bp223 bp
Novel SNP in TIGR 5’UTR
Population No of chromosomes
Allele frequency
Heterozygosity observed
Chinese 64 T1: 0.59 T2: 0.41
0.50
Malays 64 T1: 0.59 T2: 0.41
0.50
Indians 64 T1: 0.87 T2: 0.13
0.19
Caucasian 20 T1: 0.75 T2: 0.25
0.30
African-American
20 T1: 0.45 T2: 0.55
0.70
Middle Eastern 20 T1: 0.75 T2: 0.25
0.50
American-Indians
20 T1: 0.80 T2: 0.20
0.44
Mexican 20 T1: 0.95 T2: 0.05
0.10
Puerto Rican 20 T1: 0.85 T2: 0.15
0.11

Data for TDT Analysis
Age Gender Refraction (Mean, SD)
• First sample set 16-43 M:46 -6.5 to –16.75D91 cases (21.5,1) F:45 (-11.25, 2.15)
• Second sample 5-15 M:75 -1.5 to –14.85D 129 cases (10.3, F:54 (-5.89, 3.33)
5.4)
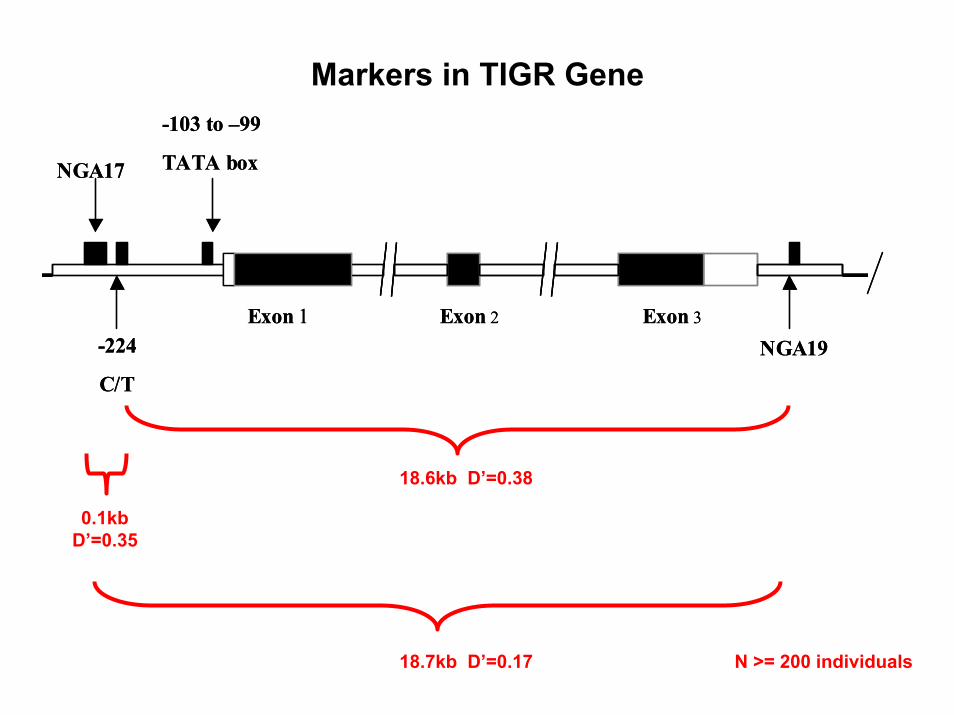
Markers in TIGR Gene
NGA17
NGA19Exon 1 Exon 3Exon 2
-224
C/T
-103 to –99
TATA boxNGA17
NGA19Exon 1 Exon 3Exon 2
-224
C/T
-103 to –99
TATA box
18.6kb D’=0.38
0.1kbD’=0.35
18.7kb D’=0.17 N >= 200 individuals

Family Association analysis of TIGR Gene
Single locus TDT analysis
ns
p < 0.001
p = 0.002
0
10
20
30
40
D1S210 D1S2815 NGA17 TIGR NGA19
Markers
Chi-s
quar
e
X2 (Sum)X2 (Max)

TDT analysis of the 3 markers of the MYOC gene in myopia families.
MarkersNo of Allele Het (%) X 2
sum
Allele (%) TR NT X 2
OR (95% CI)
NGA19 7 60.5 27.89* 122 (1.2) 0 2 2124
(23.3) 21 43 7.56126 (0.6) 3 0 3128
(65.7) 57 30 8.38†3.4 (1.84,
6.13)130 (5.2) 6 8 0.29132 (2.3) 0 6 6134 (1.7) 4 2 0.67
*p = 0.001, †p = 0.013
a. First family set (44 families):

TDT analysis of the 3 markers of the MYOC gene in myopia families.
b. Second family set (60 families):
MarkersNo of Allele Het (%) X 2
sum
Allele (%) TR NT X 2
OR (95% CI)
NGA19 4 71.9 11.32* 124 (27.1) 38 47 0.95128
(69.5) 55 36 3.972.2 (1.25,
3.39)130 (3.0) 3 12 5.4132 (0.4) 0 1 1
*p = 0.04,

TDT analysis of the 3 markers of the MYOC gene in myopia families.
c. Combined family set (104 families):
MarkersNo of Allele Het (%) X 2
sum
Allele (%) TR NT X 2
OR (95% CI)
NGA19 7 53.4 35.18* 122 (0.5) 0 2 2124
(25.5) 59 90 6.45126 (0.2) 3 0 3128
(67.9) 112 66
11.89**2.7 (1.80,
4.13)130 (3.9) 9 20 4.17132 (1.2) 0 7 7134 (0.7) 4 2 0.67
* p < 0.001, ** p = 0.002

Family Association analysis of TIGR Gene
Multi-locus TDT analysis
Haplotypes %
TR (Obs)
TR (Exp)
X2
(1df ) P
(2sided) **TIGR-NGA19
T1 128 30.5 113.74 95.38 9.88 0.002 NGA17-NGA19 215 128 19.5 70.63 57.78 7.31 0.007
NGA17-TIGR NGA19 215 T1 128 19.5 66.5 53.23 8.37 0.004
* Global p < 0.05, ** Global p = 0.005
*
*
Significant association of allele 128 of NGA19 and severe myopia

Summary & Conclusions
Locally developed capability:– facilities for high
throughput genotyping capability
– unique expertise in genetic epidemiology for disease gene hunting
Application to other dis:– SLE, Hypertension– Pb poisoning, Diabetic
nephropathy
Myopia is a complex (heterogeneous) genetic disease
Evidence for a novel gene on chromosome 12 predisposing to myopia discovered
Replicated allelic and haplotypic association to TIGR gene

Genetics Approaches
Positional Cloning / Linkage
•Discovery-based, systematic*•Genome-wide*•Mendelian*•Study relatives – extended or nuclear families*•Large pedigrees with multiple affecteds ideal*•Highly informative markers (Microsatellites)*
Candidate Gene / Association (Linkage Dysequilibrium)•Hypothesis-driven, intuitive, pathways or models*•Not genome-wide*•Complex diseases*•Requires individuals, small families*•Isolated homogeneous population ideal*•Highly abundant markers (SNPs)*
* With Exceptions

Research Team
Myopia & Human Genetics GroupDMRI/SERI


