The Geographic Flow of Bank Funding and Access to Credit: Branch Networks and Local-Market Competition Victor Aguirregabiria * University of Toronto and CEPR Robert Clark * Queen’s University Hui Wang * Peking University September, 2017 Abstract The integration of deposit and loan markets may be constrained by the geographic dispersion of depositors, borrowers, and banks. Asymmetric information between geographic locations, monitoring costs, transaction costs, and imperfections in interbank wholesale markets can all serve as frictions to the flow of funds across markets, leaving some with limited access to credit. Banks’ branch networks can reduce some of these frictions and increase the flow of funding to geographic locations where credit is in greater demand. However, local market power and economies of scope between deposits and loans at the local level may have a negative impact on the geographic flow of credit. This paper studies empirically the contribution of branch networks, local market power, and economies of scope to this flow. Our results are based on the estimation of a structural model of bank oligopoly competition for deposits and loans in multiple geographic markets using data at the bank-county-year level from the US banking industry for the period 1998-2010. The identification of the model exploits the independence of transitory local shocks between geographic locations which are distant enough from each other. The estimated model shows that a bank’s total deposits has a very significant effect on the bank’s market shares in loan markets. We also find evidence that is consistent with significant economies of scope between deposits and loans at the local level. Counterfactual experiments show that these economies of scope generate a substantial home-bias in the utilization of funds. Local market power has also a significant negative effect on the geographic flow of credit. Keywords: Geographic flow of bank funds; Access to credit; Bank oligopoly competition; Branch networks; Economies of scope between deposits and loans. JEL codes: L13, L51, G21 Victor Aguirregabiria. Address: 150 St. George Street. Toronto, ON, M5S 3G7, Canada. Phone: (416) 978-4358. E-mail: [email protected]Robert Clark. Address: 94 University Avenue. Kingston, ON, K7L 3N6, Canada. E-mail: [email protected]Hui Wang. Address: Guanghua School of Management. Peking University. Beijing, 100871, China. E-mail: [email protected]* Preliminary and incomplete. We want to thank Jason Allen, Heski Bar-Isaac, Lu Han, Ali Horta¸ csu, Jean-Fran¸ cois Houde, Jakub Kastl, Matt Osborne, Carlo Regiani, Howard Smith, Xavier Vives, and participants in seminars and conferences at the Carey Business School, the University of Toronto, the Vancouver School of Economics, Industrial Organization of the Financial Sector conference at the Becker-Friedman Institute, Jornadas de Economia Industrial and CEPR/JIE School and Conference on Applied Industrial Organization for helpful comments. We are grateful to Paul Lim for excellent research assistance.
Transcript
The Geographic Flow of Bank Funding and Access to Credit:
Branch Networks and Local-Market Competition
Victor Aguirregabiria∗
University of Toronto and CEPRRobert Clark∗
Queen’s UniversityHui Wang∗
Peking University
September, 2017
Abstract
The integration of deposit and loan markets may be constrained by the geographic dispersionof depositors, borrowers, and banks. Asymmetric information between geographic locations,monitoring costs, transaction costs, and imperfections in interbank wholesale markets can allserve as frictions to the flow of funds across markets, leaving some with limited access to credit.Banks’ branch networks can reduce some of these frictions and increase the flow of fundingto geographic locations where credit is in greater demand. However, local market power andeconomies of scope between deposits and loans at the local level may have a negative impacton the geographic flow of credit. This paper studies empirically the contribution of branchnetworks, local market power, and economies of scope to this flow. Our results are based onthe estimation of a structural model of bank oligopoly competition for deposits and loans inmultiple geographic markets using data at the bank-county-year level from the US bankingindustry for the period 1998-2010. The identification of the model exploits the independence oftransitory local shocks between geographic locations which are distant enough from each other.The estimated model shows that a bank’s total deposits has a very significant effect on thebank’s market shares in loan markets. We also find evidence that is consistent with significanteconomies of scope between deposits and loans at the local level. Counterfactual experimentsshow that these economies of scope generate a substantial home-bias in the utilization of funds.Local market power has also a significant negative effect on the geographic flow of credit.
Keywords: Geographic flow of bank funds; Access to credit; Bank oligopoly competition;Branch networks; Economies of scope between deposits and loans.
JEL codes: L13, L51, G21
Victor Aguirregabiria. Address: 150 St. George Street. Toronto, ON, M5S 3G7, Canada.Phone: (416) 978-4358. E-mail: [email protected]
Robert Clark. Address: 94 University Avenue. Kingston, ON, K7L 3N6, Canada. E-mail:[email protected]
Hui Wang. Address: Guanghua School of Management. Peking University. Beijing, 100871,China. E-mail: [email protected]
∗Preliminary and incomplete. We want to thank Jason Allen, Heski Bar-Isaac, Lu Han, Ali Hortacsu, Jean-FrancoisHoude, Jakub Kastl, Matt Osborne, Carlo Regiani, Howard Smith, Xavier Vives, and participants in seminars andconferences at the Carey Business School, the University of Toronto, the Vancouver School of Economics, IndustrialOrganization of the Financial Sector conference at the Becker-Friedman Institute, Jornadas de Economia Industrialand CEPR/JIE School and Conference on Applied Industrial Organization for helpful comments. We are grateful toPaul Lim for excellent research assistance.
1 Introduction
There is evidence that heterogeneity exists in the ability of individuals to access credit. Since
access to financing has been linked to entrepreneurship levels, employment, wages, and economic
growth (see for instance Gine and Townsend (2004)), this heterogeneity can lead to socio-economic
inequality. Moreover, there is mounting concern among policy makers that differences in the ability
to access loans is at least partly geographic, with individuals in some regions able to more easily
obtain financing than individuals in other regions.
An important determinant of credit provision is the availability of deposits: greater deposits
allow banks to make more loans. Unfortunately, in any given region, the demand for loans may
not always coincide with the availability of deposits. This would not be a problem in an economy
without geographic frictions, as funds would flow from one area to another such that, in equilibrium,
the expected rate of return and the risk of the marginal loan would be the same across geographic
markets, and the funding of an investment project would not depend on its geographic location.
In actual economies, geographic distance between borrowers and lenders can increase asymmetric
information, monitoring costs, and transaction costs of liquidity within banks. All these can serve
as frictions to the flow of funds across markets and can generate substantial geographic imbalances
in the provision of, and access to, credit (credit deserts).1
Wholesale liquidity markets and bank branch networks can help to alleviate the effects of these
frictions. Banks can buy and sell liquidity (deposits) in the interbank wholesale market. However,
there are transaction costs involved in using these wholesale markets due to bank precautionary
motives and liquidity hoarding (Ashcraft el al., 2011, Acharya and Merrouche, 2012). Banks can
also use branching as an instrument to reduce geographic frictions in the flow of credit. By opening
branches in multiple locations, a bank can reduce its geographic distance with borrowers, and
therefore it can reduce frictions which are related to the geographic distance between lender and
borrowers. If transaction costs between branches of the same bank are smaller than the costs
of using interbank markets (Coase, 1937), then banks’ branch networks may increase the flow of
funding to geographic locations where credit is in greater demand.
Two counterbalancing forces can affect negatively the willingness of a bank to transfer funds
between its branches: (i) economies of scope between deposits and loans at the branch level, and
(ii) local market power. Clients may prefer to have their deposit account and their mortgage in the
same bank. For the bank, the cost of managing a deposit account and a loan may be smaller if they
1Brevoort and Wolken (2009) and Nguyen (2015) show that the geographic distance between borrowers and lendershave a negative impact on the amount of credit.
1
belong to the same client. These economies of scope between deposits and loans create incentives
to concentrate lending activity in those branches with high levels of deposits, and therefore to limit
the geographic flow of liquidity to markets with more need of credit.2 Local market power implies
that a change in the marginal cost of loans (e.g., a reduction in the interbank interest rate) is only
partially passed-through to borrowers. As a result, smaller local markets with highly concentrated
market structures may not benefit from aggregate shocks in the supply of credit as much as more
competitive markets. Local market power can have a negative impact on the geographic flow of
credit.3
The purpose of this paper is to provide systematic evidence on the extent to which deposits
and loans are geographically imbalanced in the US commercial banking industry, and to investigate
empirically the contribution of branch networks, economies of scope, and local market power to this
imbalance. We focus on three empirical questions: (i) How important is the ‘home bias’ generated
by economies of scope between deposits and loans?; (ii) What is the contribution of local market
power to the geographic distribution of bank credit?; and (iii) How did the deregulation that allowed
banks to expand geographically in the 1990s and 2000s affect the geographic flow of bank funds?
Our results are based on the estimation of a structural model of bank oligopoly competition for
deposits and loans in multiple geographic markets. The equilibrium of the model allows for rich
interconnections across geographic locations and between deposit and loan markets such that local
shocks in demand for deposits or loans can affect endogenously the volume of loans and deposits
in every local market. We characterize an equilibrium of this multimarket oligopoly model and
propose an algorithm to solve for an equilibrium. We estimate this structural model using data
from the US banking industry for the period 1998-2010. Our novel dataset merges data at the
bank-county-year level from two sources. Deposit and branch-network information are collected
from the Summary of Deposit (SOD) data provided by the Federal Deposit Insurance Corporation
(FDIC). Information on loans comes from the Home Mortgage Disclosure Act (HMDA) data set,
which provides detailed information on mortgage loans.
In our model, differentiated banks sell deposit and loan products in multiple local markets
(counties). The model incorporates three (endogenous) variables, which are key factors in a bank’s
demand and cost of loans and deposits in a local market. A first factor is the number of branches
2As we discuss in our Model section (section 3), these economies of scope between deposits and loans may bedriven either by consumer demand (i.e., one-stop banking) or by variable costs. See also Kashyap, Rajan, and Stein(2002) and Egan, Lewellen, and Sunderam (2017) for models and empirical evidence on the positive synergies betweenbanks’ deposit and lending activities.
3Black and Strahan (2002) and Cetorelli and Strahan (2006) provide empirical evidence of how entrepreneursand potential entrants in nonfinancial sectors face more difficult access to credit in local markets characterized by aconcentrated banking sector.
2
the bank has in the local market. The number of branches reduces marginal costs of lending and
may generate consumer awareness and willingness to pay. A second factor is the total amount of
deposits the bank has at the national level, that reduces the bank’s risk for liquidity shortage and
the need to borrow at interbank wholesale markets. This introduces an important interconnection
between local markets in a bank’s operation. A third factor is the amount of deposits the bank
has in the local market that increases consumer demand for loans and reduces the bank’s marginal
cost of a loan due to economies of scope in managing deposits and loans. These three factors are
fundamental in the determination of the geographic flow of liquidity in the equilibrium of the model.
The stronger the effect of local branches on the demand and cost of loans, the more concentrated
are loan markets and this has a negative impact on the geographic diffusion of credit. Economies
of scope between deposits and loans also reduce geographic flow of credit. In contrast, the effect of
total bank deposits on local loans have a positive impact on the geographic diffusion of credit.
Our model builds on and extends the literature on structural models of bank competition. Neven
and Roller (1999) estimate a model of bank oligopoly competition in deposits and loans in seven
European countries. Their model assumes competition at the national level and it does not allow
for multiple local markets or for economies of scope between deposits and loans. Previous studies
have proposed and estimated structural equilibrium models for bank deposits as a differentiated
product. Dick (2008) estimates a demand model for bank deposits, and Egan, Hortacsu, and
Matvos (2017) distinguish between insured and uninsured deposits, and endogenize bank defaults
and bank runs. Our paper extends these previous studies by: (a) incorporating demand, supply,
and competition in the market for bank loans; (b) allowing for economies of scope between deposits
and loans, that introduces and important link between these markets at the local market level; and
(c) including the effect of a bank’s total liquidity on the demand and costs of deposits and loans in
local markets.4 Corbae and D’Erasmo (2013) propose and calibrate a dynamic equilibrium model
of the US banking industry that incorporates Stackelberg oligopoly competition in both deposits
and loans, endogenous market entry and exit, and multiple geographic markets. Our model is
static and it does not endogenize bank-entry exit decisions. However, it provides a more detailed
description of the geographic inter-connections between deposits and loans at the bank-county
level. Aguirregabiria, Clark, and Wang (2016) estimate a model of banks’ geographic location of
branches, and study the role of geographic risk diversification in the configuration of bank branch
networks. In the current paper, we extend this previous model by incorporating competition in
4In Egan, Hortacsu & Matvos (2017), the demand for uninsured deposits of a bank depends on the bank’s totalliquidity. However, their model does not incorporate demand and supply of loans and how they depend on the bank’sliquidity.
3
both loans and deposits, and inter-connections between these two markets and across geographic
markets. Here we also focus on competition at the intensive margin and omit the part of the model
that has to do with competition at the extensive margin, i.e., opening and closing branches, and
entry and exit in loans/deposits local markets.
Three sets of structural parameters are fundamental for the predictions of the model: (a)
parameters that capture the effect of the number of local branches on a bank’s demand and marginal
cost for deposits and loans; (b) parameters that capture economies of scope between deposits and
loans at the local level; and (c) parameters that measure the effect of a bank’s global deposits on the
marginal cost of loans. Estimation of these parameters must address endogeneity and simultaneity
issues. For the identification of the effect of local variables (i.e., number of branches and local
deposits), we exploit moment conditions that combine assumptions from ‘BLP instruments’ in the
estimation of demand of differentiated products (Berry, Levinsohn, and Pakes, 1995), restrictions
on the serial correlation structure of the unobservables, and a time-to-build assumption on a bank’s
decision to open (close) branches in the spirit of dynamic panel data models (Arellano and Bond,
1991, Arellano and Bover, 1995, Blundell and Bond, 1999). The identification of the effect of total
deposits is more challenging since this variable has only variation over time at the bank level. Our
identification strategy exploits a zero covariance restriction between the local idiosyncratic shocks
of far apart locations.
The estimation of the model provides the following results. The number of branches in a county
increases (reduces) substantially the demand (cost) for both deposits and loans, though the effect is
significantly smaller for loans. We find evidence of substantial economies of scope between deposits
and loans at the level of bank and local market. The effect of a bank’s total deposits on demand
(cost) of loans is positive (negative) and very significant both economically and statistically. Banks’
internal liquidity reduces the costs of lending.
Our structural approach allows us to evaluate factual and counterfactual policies that affect the
flow of funding to those markets where deposits are scarce. We consider the following counterfactual
experiments. First, we look at the effects of the consolidation of US baking industry and the
geographic expansion of branch networks by looking at the counterfactual equilibrium if banks’
branch networks were the ones in 1994, before Riegle-Neal act. Second, we study the effects of
eliminating the home bias due to economies of scope between deposits and loans. Third, we look at
the effect of eliminating county heterogeneity in local market power. Finally, we study the potential
geographic non-neutrality of different government policies. We evaluate how a (counterfactual) tax
on deposits would affect the provision of credit and, more interestingly, its geographic distribution.
4
We also investigate to what extent national aggregate shocks (e.g., business cycle, monetary policy)
affect bank credit in a geographic non-neutral way.
We are not the first to study the relationship between retail funding and loan activity. The
closest to our work is a recent set of papers that take advantage of the exogenous variation provided
by the shale boom to study the extent to which banks use their branch networks to transfer funds
from one local market to another (Gilje, 2012; Gilje, Loutskina, and Strahan, 2016; Loutskina and
Strahan, 2015; and Petkov, 2016). Our paper complements in different ways the empirical findings
by Gilje, Loutskina, and Strahan (2016). First, our empirical analysis of the relationship between
the geographic location of a bank’s branches (deposits) and loans extends to all the local markets
(counties) in US. Second, we study the contribution of local market power to the geographic flow of
banks’ funds. Third, our approach for the identification of the effect of total deposits on local loans
exploits more general sources of exogenous variation than those associated to local catastrophic
events or discoveries of natural resources. Finally, our structural model allows us to identify the
different sources of transaction costs for the flow of funding, and to perform counterfactual experi-
ments to evaluate the effect on credit of reducing these costs.
The rest of the paper proceeds as follows. In the next section we describe the data and present
descriptive evidence on the geographic dispersion of deposits and loans. In Section 3 we describe our
model and in Section 4 we explain how we go about estimating it. Section 5 presents our empirical
We combine two data sources at the bank-county level. Branch and deposit information is collected
from the Summary of Deposit (SOD) data provided by the Federal Deposit Insurance Corporation
(FDIC). Information on mortgage loans comes from the Home Mortgage Disclosure Act (HMDA)
data set.
The SOD dataset is collected on June 30th of each year and covers all depository institutions
insured by the FDIC, including commercial banks and saving associations. The dataset includes
information at the branch level on deposits, address, and bank affiliation. Based on the county
identifier of each branch, we can construct a measure of the number of branches and total deposits
for each bank in each county.5
5A small proportion of branches in the SOD dataset (around 5% of all branches) have zero recorded deposits.These might be offices in charge of loans or administrative issues. We exclude them in our analysis.
5
Under the HMDA, most mortgage lending institutions are required to disclose information on
the mortgage loans that they originate or purchase in a given year.6 At the level of financial insti-
tution, county, and year, we have information on the number and volume of mortgage applications,
mortgage loans actually issued, and mortgage loans subsequently securitized.
The type of institutions reporting to HMDA include both depository institutions and non-
depository institutions, mainly Independent Mortgage Companies (IMCs).7 By definition, only
the former, including banks and thrifts, can be matched with the SOD data.8 Other than this
matching issue, this paper focuses on depository institutions because these are the institutions that
rely heavily on branching and deposits to fund their loans. By contrast, IMCs rely on wholesale
funding and mortgage brokers (Rosen, 2011). Focusing on depository institutions is consistent with
the research questions addressed in this paper. Nevertheless, to take into account competition in
the mortgage market from non-depository institutions, we aggregate at the county-year level the
total number and volume of loan mortgages from these institutions, and we use this information
in our construction of market shares and in the estimation of our structural model of demand and
supply of mortgages.
County level data on socioeconomic characteristics are obtained from various products of the
Census Bureau. The US Census Bureau provides various data products through which we obtain
detailed county level characteristics to estimate our model. Population counts by age, gender,
and ethnic group are obtained from the Population Estimates. Median household income at the
county level is extracted from the State and County Data Files, whereas income per capita is
provided by the Bureau of Economic Analysis (BEA). Information on local business activities such
as two-digit-industry level employment and number of establishments is provided by the County
Business Patterns. Finally, detailed geographic information, including the area and population
weighted centroid of each county, and locations of the landmarks in the US, is obtained from the
Topologically Integrated Geographic Encoding and Referencing system (TIGER) dataset.
We also use information on county-level house prices for 2742 counties between 1990-2015 from
the Federal Housing Finance Agency (see Bogin, Doerner and Larson, 2016), and county-level
6There are some geographic restrictions on loan reporting. According to the Community Reinvestment Act (CRA),large banks have to report information on all their loans regardless of the geographic location. Furthermore, regardlesstheir size, lenders located in an MSA must report on loans originated in an MSA, though they can choose not toreport loans outside MSAs. Only small lenders located outside of MSAs do not have to report. This means that theHMDA dataset may not include mortgage loans issued by small banks and originated in rural locations. However,according to the US census, about 83 percent of the population lived in an MSA region during our sample period.Therefore, HMDA provides information on the majority of residential mortgage lending activities.
7IMCs are for-profit lenders that are neither affiliated nor subsidiaries of banks’ holding companies.8We match banks in the SOD and HMDA datasets using their certificate number (provided by FDIC to every
insured depository institution) or/and their RSSD number (assigned by Federal Reserve to every financial institution).We match thrifts using their docket numbers.
6
bankruptcy data from the U.S. Bankruptcy Courts.9
We derive bank-level characteristics from balance sheets and income statement information in
the banks’ quarterly reports provided to the different regulatory bodies: the Federal Reserve Board
(FRB)’s Report on Condition and Income (Call Reports) for commercial banks, and the Office of
Thrift Supervision (OTS)’s Thrift Financial Report (TFR) for saving associations.
The National Information Center records the timing of major historical events, such as renaming,
merger and acquisition, and bankruptcy, of all depository institutions that ever existed in the United
States. This information allows us to identify all the merger cases and the involved banks during
the sample period.
There are two features of our data and empirical approach that deserve specific discussion.
First, we have data on mortgage loans at the bank-county-year level but we do not have data on
other forms of bank credit. Ideally, we would like to use information on other types of bank loans,
but, to our knowledge, such data are not publicly available at the bank-county-year level. However,
mortgage loans represent the most substantial part of bank loans, and even of bank assets. Using
bank level information from the 2010 Call Reports, Mankart, Michaelides, and Pagratis (2016) show
that mortgages account for between 62% and 72% of all bank loans, and between 38% and 45% of
total bank assets, where the range of values captures heterogeneity in these ratios according to bank
size (i.e., larger banks tend to have a smaller share of mortgage loans in total loans and assets).
They also report that bank deposits represent between 68% and 85% of total bank liabilities.
Therefore, our focus on deposits and mortgages, though motivated by data availability, captures a
very substantial fraction of total bank liabilities and assets, respectively. Furthermore, other sorts
of loans may be taken out at one location, but used to finance projects elsewhere. This would make
studying the flow of funding and access to credit difficult. In contrast, mortgages are much more
local.
Second, publicly available data on interest rates of deposits and loans are not available at the
bank-county-year level, or even at a more aggregate geographic level. Furthermore, the existing
proprietary data on interest rates are not as clean as the quantity data on deposits and mortgage
loans that we use, and they are based on geographic interpolations, and therefore, potentially
important measurement errors. The loan-rate data in particular are available only for a small
set of lenders. The lack of good price data at the bank-county-year level would be an important
limitation if we wanted to separately estimate demand and marginal cost. However, that is not
the goal of this paper. To answer all the empirical questions in this paper, we need to estimate
9More specifically, we use Table F 5A Business and Nonbusiness Bankruptcy County Cases Commenced, byChapter of the Bankruptcy Code During the 12-Month Period Ending June 30, 2007.
7
the value of consumers willingness-to-pay net of banks’ marginal costs for the different deposit and
loan products, as well as how these net willingness-to-pay depends on different variables such as
local bank branches. We show that these primitives can be identified without information on prices
of deposits and loans.
Finally, it is necessary to comment on the fact that we define our markets to be counties, the
primary administrative divisions for most states. Markets determine the set of branches that are
competing with each other for consumer deposits and loans within a geographic area. Although
other market definitions, such as State or Metropolitan Statistical Area, have been employed in
some previous empirical studies on the US banking industry, many have considered county as their
measure of geographic market (see for instance Ashcraft, 2005; Calomiris and Mason, 2003; Huang,
2008; Gowrisankaran and Krainer, 2011; and Uetake and Wanatabe, 2012).
2.2 Summary statistics
We concentrate on the period 1998-2010. Our matched sample includes 6263 banks in 3143 counties.
Of these counties, 2861 have deposits in at least one year during the sample period: there are 282
counties with zero deposits at every year during the sample period. However, we observe positive
amounts of mortgage loans in these counties with zero deposits. These 282 counties with no deposits
but positive mortgages are rural or suburban markets where people live and make investments but
where there are no bank branches. We keep all 3143 counties in our analysis. The dataset contains
a total of 1,483,729 bank-county-year observations.
8
Table 1Summary Statistics
Bank Level Statistics (48,531 bank-year obs.)
Variable Mean S. D. Pctile 5 Median Pctile 95
Number of branches 10.9 51.3 1.0 4.0 28.0
Number of counties with deposits > 0 3.4 10.4 1.0 2.0 9.0
Number of counties with new loans > 0 30.4 146.0 1.0 8.0 72.0
Total deposits (in million $) 616 3,906 37 147 1,486
Total new loans (in million $) 184 3,286 1 13 272
County Level Statistics (40,736 county-year obs.)Variable Mean S. D. Pctile 5 Median Pctile 95
Number of branches (per county) 13.0 32.5 0.0 4.0 55.0
Number of banks with deposits > 0 4.0 6.2 0.0 2.0 14.0
Number of banks with loans > 0 36.2 34.9 4.0 26.0 107.0
HHI market of deposits 3176 2067 1111 2548 7813
HHI market of new loans 710 650 253 528 1718
Deposits per capita (in ,000 $) 5.3 6.4 0.0 4.2 14.0
New loans per capita (in ,000 $) 1.2 1.6 0.1 0.8 3.8
Income per capita (in ,000 $) 27.9 8.1 18.1 26.6 41.7
Population (in ,000 people) 94.0 302.1 3.2 25.4 398.8
Share population ≤ 19 (in %) 27.4 3.4 22.2 27.3 33.1
Share population ≥ 50 (in %) 33.3 6.3 23.4 33.0 44.2
Annual change in house price index 3.0 5.7 -5.9 3.0 12.3
Number of bankruptcy filings 435 1506 6 107 1799
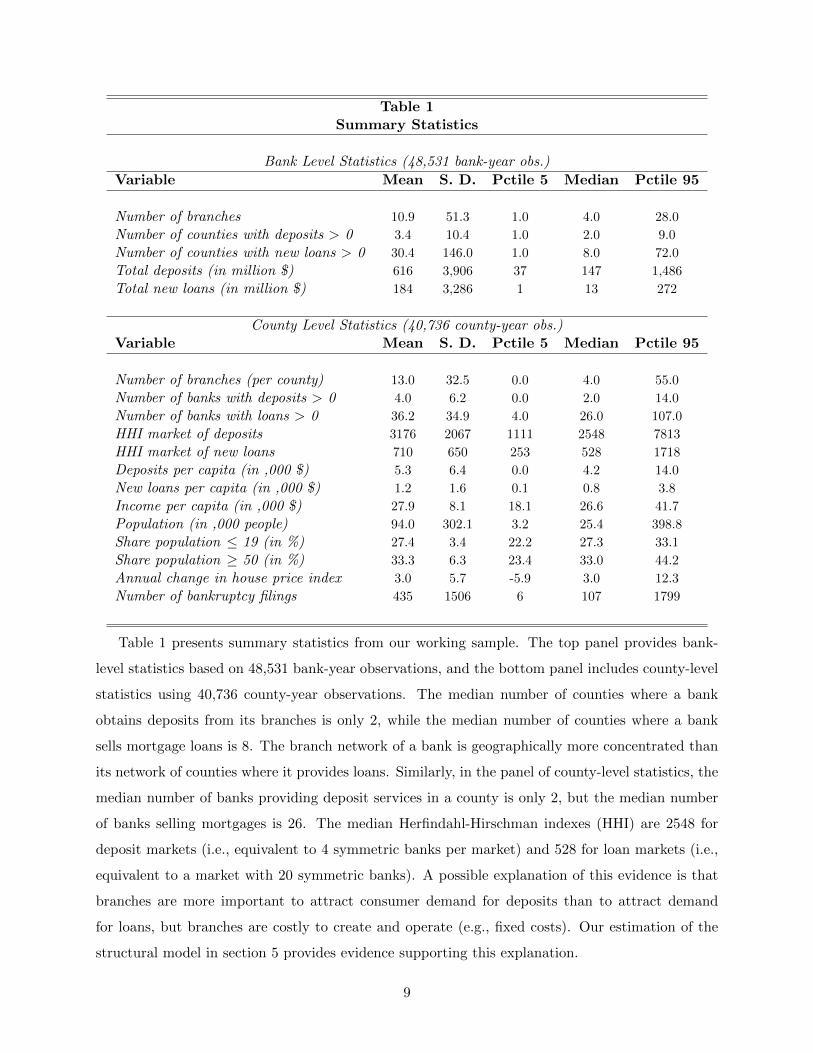
Table 1 presents summary statistics from our working sample. The top panel provides bank-
level statistics based on 48,531 bank-year observations, and the bottom panel includes county-level
statistics using 40,736 county-year observations. The median number of counties where a bank
obtains deposits from its branches is only 2, while the median number of counties where a bank
sells mortgage loans is 8. The branch network of a bank is geographically more concentrated than
its network of counties where it provides loans. Similarly, in the panel of county-level statistics, the
median number of banks providing deposit services in a county is only 2, but the median number
of banks selling mortgages is 26. The median Herfindahl-Hirschman indexes (HHI) are 2548 for
deposit markets (i.e., equivalent to 4 symmetric banks per market) and 528 for loan markets (i.e.,
equivalent to a market with 20 symmetric banks). A possible explanation of this evidence is that
branches are more important to attract consumer demand for deposits than to attract demand
for loans, but branches are costly to create and operate (e.g., fixed costs). Our estimation of the
structural model in section 5 provides evidence supporting this explanation.
9
Given this level of concentration in mortgage markets, one might argue that market power is
very low and should not have any impact on the geographic diffusion of credit. However, this
argument does not take into account that branches can still have an impact on demand and cost
of loans, and that economies of scope imply that market power in deposit markets have spillover
on the mortgage markets.
Figures 1 to 4 present time series of some aggregate magnitudes from our working sample, i.e.,
deposits, mortgages, loans, banks, and branches) over our sample period. Figure 1 presents the
evolution of the stock of deposits and the flow of new mortgage loans aggregated over all banks
and counties with a yearly frequency. Both time series follow a similar pattern, with strong growth
in the early 2000s followed by a decline of new mortgages and a very modest increase of deposits
in the last years of the decade. Figure 2 provides evidence on the importance of mortgage loans
in assets for lenders in the HMDA dataset. The median share is just below 40% at the start of
our sample, rising to over 50% at the time of the financial crisis. Figure 3 provides evidence on
the share of deposits in liabilities for lenders in the HMDA dataset. The median share is around
80%. Figure 4 shows the evolution of the number of banks and branches per county. At the start
of our sample there were just over 7.5 banks and about 26 branches per county. These numbers
increased steadily to almost 9 and over 31, respectively, by the time of the crisis, before decreasing
slightly. Note that the increase from 1994 to 2009 coincides with the rolling out of Riegel Neal,
which permitted banks to branch across state lines. Over the same time period the percentage of
multi-state banks increased from less than 1% to around 7%.
10
Figure 1: Time Series of Stock of Deposits and Flow of New Mortgage Loans
Figure 2: Share of Mortgage Loans in Total Assets
11
Figure 3: Share of Deposits in Liabilities
Figure 4: Number of banks and branches by county
12
2.3 Geographic patterns of deposits and loans
Figure 5 presents maps with the geographic distribution of counties’ positions as net borrowers
or net lenders. We present these maps for three different years in our sample: 1999, 2004, and
2009. We first describe the construction of the statistics in these figures. For every county-year, we
calculate the county’s share of deposits over aggregate national deposits. Similarly, we calculate the
county’s share of new loans over the aggregate amount of new loans in the nation. Based on these
shares, we construct at the county level the index SL−D that represents the difference between the
county’s share of loans and its share of deposits. We sort counties into four groups: (i) counties
belonging to top 10 percentiles of SL−D (Share Loans >> Share Deposits); (ii) counties between
the 10th and 50th percentiles of SL−D (Share Loans > Share Deposits); (iii) counties between the
50th and 90th percentiles of SL−D (Share Loans < Share Deposits); and (iv) counties belonging
to the bottom 10 percentiles of SL−D (Share Loans << Share Deposits). Figure 5 shows clear
evidence of deposit and loan imbalances, with some regions having very high share of deposits, but
low share of loans and vice versa. It also reveals regional patterns in the net borrowing/lending
position of counties. There are also interesting changes over time that are related to the mortgage
boom and the subsequent financial crisis at the end of the decade.
Figure 5. Distribution of borrower/lender counties
TX
MT
CA
ID
AZ
NV
NM
OR
CO
WY
ILUT
MNSD
IA
KS
NE
ND
WI
WA
OK
MO
FL
MI
IN
GA
NY
AL
PA
ARNC
LA
TN
MS
VAKY
OH
ME
SC
WV
MI
VTNH
MDNJ
MACT
DE
RI
Legend
share D << share Lshare D < share Lshare D > share Lshare D >> share L
1999
13
TX
MT
CA
ID
AZ
NV
NM
OR
CO
WY
ILUT
MNSD
IA
KS
NE
ND
WI
WA
OK
MO
FL
MI
IN
GA
NY
AL
PA
ARNC
LA
TN
MS
VAKY
OH
ME
SC
WV
MI
VTNH
MDNJ
MACT
DE
RI
Legend
share D << share Lshare D < share Lshare D > share Lshare D >> share L
2004
TX
MT
CA
ID
AZ
NV
NM
OR
CO
WY
ILUT
MNSD
IA
KS
NE
ND
WI
WA
OK
MO
FL
MI
IN
GA
NY
AL
PA
ARNC
LA
TN
MS
VAKY
OH
ME
SC
WV
MI
VTNH
MDNJ
MACT
DE
RI
Legend
share D << share Lshare D < share Lshare D > share Lshare D >> share L
2009
14
Figure 6 presents the empirical distribution of segregation indexes calculated at the bank-year
level. Borrowing from the literature on racial geographic segregation,10 we calculate the segregation
index : (1/2)∑
m |qdjmt/Qdjt − q`jmt/Q
`jt|, where qdjmt and q`jmt represent the amount of deposits and
loans, respectively, of bank j in county m and year t, and Qdjt and Q`
jt represent the bank’s total
amounts of deposits and loans. This index is a measure of the bank’s transfer of funds between
geographic locations or, alternatively, a measure of the bank’s home bias. For instance, a segregation
score equal to zero represents an extreme case of home bias, i.e., the bank’s geographic distributions
of loans and deposits are identical. At the other extreme, a segregation index equal one means that
the bank gets all its deposits in markets where does not provide loans, and sells loans only in
markets where does not have deposits, which is an extreme case of geographic diffusion of loans.
In Figure 6 we consider the subsample of banks with at least five counties with positive values for
either loans or deposits. We find that most banks are involved to some degree in the transfer of
funds across geographic locations. In fact, the index is quite large (greater than 0.5) for more than
one third of these banks.
Figure 7 presents the time series of a national level segregation index calculated using county
level observations. This segregation index is defined as:
SIt =1
2
M∑m=1
∣∣∣∣Qdmt
Qdt
− Q`mt
Q`t
∣∣∣∣ (1)
whereQd
mt
Qdt
andQ`
mt
Q`t
are the shares of county m in the aggregate national amounts of deposits and
new mortgage loans, respectively. This index measures the transfer of funds between geographic
locations. The index increased substantially during the period 2000-2006, from 0.29 to 0.35. How-
ever, it experienced substantial reductions in the 2007-2008 financial crisis (from in 0.35 to 0.32)
and to a lower extent at year 2000 dot-com crisis (from 0.31 to 0, 29).
10This type of index was first proposed by Jahn, Schmid, and Schrag (1947).
15
Figure 6. Segregation Indexes between Deposit and Loan Distributions:
At the bank-year level
Figure 7. Time Series of the National Segregation Index
Seggregation Index (National level using county shares)
17
3 Model
Consider an economy with M geographic markets (counties), indexed by m ∈ M = {1, 2, ...,M},
and B banks, indexed by j ∈ {1, 2, ..., B}. Let Mdj represent the set of markets where bank j has
branches and sells deposits. Similarly, M`j represents the set of markets where bank j sells loans.
This set of markets M`j includes all the markets where the bank has branches, but it may include
other markets where the bank has contacts with mortgage brokers that provide clients for the bank.
Therefore, M`j includes the set Md
j but it can be larger, i.e., Mdj ⊆M`
j .
We take networks {Mdj}Bj=1 and {M`
j}Bj=1 as given. One can think of these networks as being
the result of a dynamic game of market entry-exit decisions with networks. The specification and
estimation of such a complex game is beyond the scope of this paper. Instead, we consider these
sets to be pre-determined and focus on the endogenous determination of the amounts of deposits
and loans in the equilibrium of a model of multi-market oligopoly competition.
Each local market is populated by two groups of consumers: savers who demand deposit prod-
ucts, and investors who demand loan products. Banks sell deposit and loan products in these local
markets. These products are horizontally differentiated between banks due to different product
characteristics and to spatial differentiation within a local market. This view of banks’ services as
differentiated products is in the spirit of previous papers in the literature such as Degryse (1996),
Schargrodsky and Sturzenegger (2000), Cohen and Mazzeo (2007 and 2010), Gowrisankaran and
Krainer (2011), or Egan, Hortacsu, and Matvos (2017), among others. A novel feature of our model,
that is key for the purposes of this paper, is that it introduces endogenous links between deposit
and loan markets and between these markets at different geographic locations.
Bank j sells deposit products in every market in the set Mdj , and sells loan products in every
market in the setM`j .11 The (variable) profit function of bank j is equal to interests from new loans
(pre-existing loans are considered as pre-determined fixed profits), minus payments to depositors,
minus costs of managing deposits and loans, and minus the costs (or returns) from the bank’s
activity at interbank wholesale markets:
Πj =
M∑m=1
p`jm q`jm + pdjm qdjm − Cjm
(q`jm, q
djm
)− (r0 + cj0)Bj (2)
where p`jm and pdjm are prices for loans and deposits, respectively, for bank j in market m, and q`jm
and qdjm are the corresponding amounts of loans and deposits. Note that typically the price for
loans will be positive (p`jm > 0) because borrowers pay a positive interest rate to obtain a loan,
while the price of deposits is typically negative (pdjm > 0) because the bank should pay savers to
11For the sake of notational simplicity, we omit in this section the time subindex t.
18
attract their deposits. Market m = 0 represents the interbank wholesale market; r0 is the interbank
interest rate; Bj is the net borrowing position of bank j at the interbank market; and cj0 is a bank-
specific transaction costs associated to using the interbank market. The interbank interest rate r0
is determined by the Federal Reserve, and it is exogenous in this model.
The function Cjm
(q`jm, q
djm
)represents the cost of managing deposits and loans in market
m. A bank’s resources constraint implies that,12 Bj = Q`j − Qd
j , where Q`j ≡
∑Mm=1 q
`jm and
Qdj ≡
∑Mm=1 q
djm are bank j’s total new loans and deposits, respectively. Solving this restric-
tion in the profit function, we have that Πj =∑M
m=1 p`jm q`jm+ pdjm qdjm− Cjm
(q`jm, q
djm
), with
Cjm
(q`jm, q
djm
)≡ Cjm
(q`jm, q
djm
)+ (r0 + cj0) (q`jm − qdjm). For the rest of the paper we do not
include the term (r0 + cj0) (q`jm − qdjm) explicitly in the variable cost function, but it should be
understood that marginal costs include the component r0 + cj0 with positive sign for loans and
negative for deposits.
Section 3.1 describes the demand system for deposits and loans. Section 3.2 presents our
specification of bank variable costs. The equilibrium of the model is described in section 3.3.
Comparative statics exercises and numerical solutions are provided in section 3.4.
3.1 Demand for deposit and loan products
(a) Demand for deposit products. There is a population of Hdm savers in market m. Each saver has
a fixed amount of wealth that we normalize to one unit.13 A saver has to decide whether to deposit
her unit of savings in a bank and at which bank. Due to transportation costs, savers consider only
banks with branches in their own local market. In other words, banks can get deposits only in
markets where they have branches. Banks provide differentiated deposit products. The (indirect)
utility for a saver from depositing her wealth in bank j in market m is (we omit the individual-saver
subindex in variables udjm and εdjm):
udjm = xdjm βdm − αd pdjm + ξdjm + εdjm (3)
xdjm is a vector of characteristics of bank j (other than the deposit interest rate) that are valuable
to depositors and observable to the researcher, such as the number of branches of bank j in the
market, njm. The vector βdm contains the marginal utilities of the product characteristics xdjm.
These marginal utilities may vary across markets according to observable and unobservable (to the
researcher) market characteristics, e.g., per capita income, age distribution, etc. Variable pdjm is the
12More precisely, we have that Bj = S`j + Q`
j −Qdj , where S`
j is the stock of live pre-existing loans. However, S`j is
pre-determined and it does not have any effect on variable profits.13See section 4 for a description of our measure of this ‘unit’ and of the number of consumers in the market, as
well as our approach to deal with possible misspecification of these values.
19
price of deposit services (i.e., consumer fees minus the deposit interest rate), and αd is the marginal
utility of income. The term ξdjm represents other characteristics of bank j in market m that are
observable and valuable to savers but unobservable for us as researchers. Variable εdjm represents
savers’ idiosyncratic preferences, and we assume that it is independently and identically distributed
across banks with type 1 extreme value distribution. The utility from the outside alternative is
normalized to zero. Let sdjm ≡ qdjm/Hdm be the market share of bank j in the market for deposits
at location m. The model implies that:
sdjm =1{m ∈Md
j
}exp
{xdjm βdm − αd pdjm + ξdjm
}1 +
∑Bk=1 1
{m ∈Md
k
}exp
{xdkm βdm − αd pdkm + ξdkm
} (4)
where 1 {.} is the indicator function such that 1{m ∈Md
j
}is a dummy variable that indicates
whether bank j has branches in market m.
The vector of product characteristics xdjm includes three elements that are important for the
implications of the model: (i) the number of branches (njm); (ii) the bank’s share of the local
market for loans (s`jm); and (iii) the bank’s total amount of deposits (Qdj ). The number of branches
captures the effects of consumer transportation cost as well as consumer awareness about the bank’s
presence. The share in the local market of loans captures economies of scope at the consumer level
of having deposits and loans in the same bank, i.e., one-stop banking. The bank’s total deposits
capture consumers’ concerns for the probability of default or bank-run. Therefore, we have that,
xdjmβ
dm = βd0,m + βdn hn(njm) + βd` s
`jm + βdQ hQ(Qd
j ) (5)
where hn(.) and hQ(.) are known monotonic functions, e.g., logarithm. We can also generalize this
specification to incorporate the consumer valuation of a bank’s number of branches in neighboring
counties. We use the function sdjm = djm(pdjm, s`jm, Q
dj ) to represent the demand for deposits,
where, for notational convenience, we include explicitly as arguments the endogenous variables
(pdjm, s`jm, Q
dj ).
(b) Demand for loan products. Each local market is also populated by investors / borrowers. Let
H`m be the number of new borrowers in market m. Each (new) borrower is endowed with an
investment project that requires 1 unit of loans. The set of possible choices that a borrower has is
not limited to the banks that have branches in the market. There are banks that sell mortgages in
the market but do not have physical branches, i.e., remember thatMdj ⊆M`
j . However, borrowers
may also value the geographic proximity of the bank as represented by the branches of the bank
in the local market. Banks provide differentiated loan products. For a borrower located in market
20
m, the (indirect) utility of a loan from bank j is:
u`jm = x`jm β`m − α` p`jm + ξ`jm + ε`jm (6)
The variables and parameters in this utility function have a similar interpretation as in the utility
for deposits presented above. Variable p`jm represents the interest rate of a loan from bank j in
market m. We also assume that the variables ε`jm are identically distributed across banks with type
1 extreme value distribution, and the utility from the outside alternative is normalized to zero. Let
s`jm ≡ q`jm/H`m be the market share of bank j in the market for loans at location m. According to
the model, we have that:
s`jm =1{m ∈M`
j
}exp
{x`jm β`m − α` p`jm + ξ`jm
}1 +
∑Bk=1 1
{m ∈M`
k
}exp
{x`km β`m − α` p`km + ξ`km
} (7)
As was the case for deposits, the vector of product characteristics x`jm includes: (i) the number
of branches (njm); (ii) the bank’s share of the local market for deposits (sdjm); and (iii) the bank’s
total amount of deposits in all the markets (Qdj ). As explained above for the demand for deposits,
the number of branches captures consumer transportation cost and consumer awareness, and the
amount of local deposits portrays economies of scope between deposits and loans for the consumer
if using the same bank. Consumers value a bank’s total amount of deposits because it is related to
the bank’s risk of liquidity shortage and default. Thus, we have that
x`jmβ
`m = β`0m + β`n hn(njm) + β`d s
djm + β`Q hQ(Qd
j ). (8)
We use the function s`jm = `jm(p`jm, sdjm, Q
dj ) to represent the demand for loans.
(c) Demand system for deposits and loans. The demand system can be represented by the equations
s`jm = `jm(p`jm, sdjm, Q
dj ) and sdjm = djm(pdjm, s
`jm, Q
dj ). For the moment, let us consider this demand
system for a single bank, taking as given prices of loans and deposits for the rest of the banks. This
system establishes links between the amount of deposits and loans in the same local market and
across different geographic markets. Taking prices as given, the solution of this system of equations
with respect to the markets shares {s`jm, sdjm} implies the reduced form demand system:
sdjm = fdjm
(pdj ,p
`j
)and s`jm = f `jm
(pdj ,p
`j
)(9)
where pdj and p`
j are the vectors with bank j’s interests rates for deposits and loans, respectively,
at every local market where this bank is active. Loans (deposits) in a local market depend on the
bank’s interest rates for loans and deposits in every market where the bank operates. Therefore, the
21
demand-price derivatives, say ∂fdjm/∂p`jm or ∂f `jm/∂p
djm, incorporate local and global multiplier ef-
fects. For instance, taking into account that s`jm = `jm(p`jm, sdjm, Q
dj ) and sdjm = djm(pdjm, s
`jm, Q
dj ),
we have the following system of equations:
∂f `jm
∂p`jm=
∂`jm
∂p`jm+∂`jm
∂sdjm
∂fdjm
∂p`jm+∂`jm
∂Qdj
∑m′∈Md
j
∂fdjm′
∂p`jm
∂fdjm
∂p`jm=
∂djm
∂s`jm
∂f `jm
∂p`jm+∂djm
∂Qdj
∑m′∈Md
j
∂fdjm′
∂p`jm
∂fdjm′
∂p`jm=
∂djm′
∂s`jm′
∂f `jm′
∂p`jm+∂djm′
∂Qdj
∑m′∈Md
j
∂fdjm′
∂p`jm
for m′ 6= m
∂f `jm′
∂p`jm=
∂`jm′
∂sdjm′
∂fdjm′
∂p`jm+∂`jm′
∂Qdj
∑m′∈Md
j
∂fdjm′
∂p`jm
for m′ 6= m
(10)
This is a system of linear equations in the vector of partial derivatives {∂f `jm′/∂p`jm; ∂fdjm′/∂p`jm:
for m′ ∈ Mj}, where Mj ≡ Mdj ∪M`
j . Solving this linear system we can obtain this vector in
terms of the derivatives of the structural demand functions `jm and djm. The solution to this
system implicitly implies the existence of local and global multiplier effects to the changes in local
interest rates. More formally, let ∂f `j,(p`jm)
be the |M`j |×1 vector of partial derivatives {∂f `jm′/∂p`jm :
m′ ∈M`j}, and similarly, let ∂fd
j,(p`jm)be the |Md
j |×1 vector {∂fdjm′/∂p`jm : m′ ∈M`j}. The system
of equations (10) implies the following solution for [∂f `j,(p`jm)
, ∂fdj,(p`jm)
] in terms of derivatives of the
structural demand functions:[∂f `
j,(p`jm)
∂fdj,(p`jm)
]=
[I−
0|M`j |×|M`
j |; Aj,(p`jm)
Bj,(p`jm) Cj,(p`jm)
]−1 i(m)
|M`j |∂`jm/∂p
`jm
0|Mdj |
(11)
where I is the identify matrix; 0 is a matrix of zeros; i(m)
|M`j |
is a vector with 1 at the m-th element and
zeroes elsewhere; and Aj,(p`jm), Bj,(p`jm), and Cj,(p`jm) are matrices with the following definitions:
Aj,(p`jm) ≡ diag{∂`j,sd
}+ diag
{∂`j,Qd
}1|M`
j |×|Mdj |
Bj,(p`jm) ≡ diag{∂dj,s`
}Cj,(p`jm) ≡ diag
{∂dj,Qd
}1|Md
j |×|Mdj |
(12)
diag{v} is a diagonal matrix with vector v in the diagonal; 1 is a matrix of ones; ∂`j,sd is the
|M`j | × 1 vector with elements ∂`jm/∂s
djm; ∂`j,Qd is the |M`
j | × 1 vector with elements ∂`jm/∂Qdj ;
and similarly ∂dj,s` and ∂dj,Qd are the |Mdj | × 1 vectors with elements ∂djm/∂s
`jm and ∂djm/∂Q
dj ,
respectively.
22
3.2 Variable cost function
We consider the following specification for the variable cost function:
Cjm
(q`jm, q
djm
)=
[ωdjm + γdn hn(njm) + γd` s
`jm + γdQ hQ(Qd
j )]qdjm
+[ω`jm + γ`n hn(njm) + γ`d s
djm + γ`Q hQ(Qd
j )]q`jm
(13)
The terms γdn hn(njm) and γ`n hn(njm) portray economies of scale and scope between branches of
a bank in the same market. Some costs of providing deposits and loans are shared by multiple
branches. The terms γd` s`jm qdjm and γ`d s
djm q`jm capture economies of scope in the management of
deposits at the branch level. The component γ`Q hQ(Qdj ) captures how the marginal cost of loans
declines with the bank’s total volume of deposits Qdj .
3.3 Bank competition and equilibrium
A bank can charge a different interest rate for deposits (loans) at each local market. We assume
that banks compete a la Nash-Bertrand. Therefore, each bank chooses its vectors of interest rates
for deposits and loans, pj ≡ {pdjm : m ∈Mdj ; p`jm : m ∈M`
j}, to maximize its profit.
A marginal change in the interest rate of deposits of bank j in county m has the following effects
on the bank’s profit: (i) the standard marginal revenue and marginal cost effect from deposits in
the same market; (ii) the indirect effect on the profits from loans in the same local market; (iii) the
indirect effect on the profits from deposits in other geographic markets where the bank operates;
and similarly, (iv) the indirect effect on the profits from loans in other geographic markets. That
is, [qdjm +
(pdjm −
∂Cjm
∂qdjm
)∂fdjm
∂pdjm
]︸ ︷︷ ︸ +
(p`jm −
∂Cjm
∂q`jm
)∂f `jm
∂pdjm︸ ︷︷ ︸(i) (ii)
+∑
m′ 6=m
(pdjm′ −
∂Cjm′
∂qdjm′
)∂fdjm′
∂pdjm︸ ︷︷ ︸ +∑
m′ 6=m
(p`jm′ −
∂Cjm′
∂q`jm′
)∂f `jm′
∂pdjm︸ ︷︷ ︸ = 0
(iii) (iv)
(14)
And we have a similar expression for the marginal conditional of optimality with respect to the
interest rate of loans. This set of marginal conditions of optimality for every bank j and every
geographic market m determine the equilibrium of the model.
Using the logit structure of the demands for loans and deposits, we now develop expressions that
characterize the Bertrand equilibrium and that we use for the estimation of the model parameters
23
and for our counterfactual experiments. Under the logit specification of demand, the system of
marginal conditions of optimality imply the following pricing equations:
p`jm = c`jm + ∆`j +
1
α`(1− s`jm)−βd`αdsdjm
pdjm = cdjm + ∆dj +
1
αd(1− sdjm)−β`dα`s`jm
(15)
where c`jm and cdjm represent marginal costs, and ∆`j and ∆d
j are terms that depend on marginal
costs and demand aggregated over all the markets where bank j operates.
For our empirical analysis, it is convenient to write the equilibrium conditions in terms of the
market shares as the only endogenous variables. Let sd0m and s`0m be the market shares of the
outside alternative for deposits and loans in market m. By definition, sd0m = Hdm −
∑Bj=1 s
djm and
s`0m = H`m −
∑Bj=1 s
`jm. The logit model implies that ln(sdjm/s
d0m) = xd
jm βdm + αd pdjm + ξdjm.
Subbing the pricing equations into this expression, we obtain the following system of equilibrium
equations in terms of market shares:
y(sdjm, s
d0m
)= xd
jmβdm − αd
[cdjm + ∆d
j
]+αdβ`dα`
s`jm + ξdjm
y(s`jm, s
`0m
)= x`
jmβ`m − α`
[c`jm + ∆`
j
]+α`βd`αd
sdjm + ξ`jm
(16)
where, for any value of the shares (sj , s0), the function y (sj , s0) is defined as ln
(sjs0
)+
1
1− sj.
Given the structure of demand and marginal costs with xdjmβ
dm = βd0,m + βdn hn(njm) + βd`
q`jm + βdQ hQ(Qdj ) and cdjm = ωd
jm + γdn hn(njm) + γd` s`jm + γdQ hQ(Qd
j ), it is clear that the term
xdjmβ
dm − αd cdjm is equal to:
xdjmβ
dm − αdcdjm = θdn hn(njm) + θd` s
`jm + θdQ hQ(Qd
j ) (17)
where the θ’s are structural parameters that depend on both demand and marginal cost parameters.
More specifically, θdn ≡ βdn − αd γdn, θd` ≡ βd` − αd γd` , and θdQ ≡ βdQ − αd γdQ, and we have similar
expressions for θ`n, θ`d, and θ`Q in the loan equation. Similarly, we have that the ”error terms” in
the deposit and loan equations depend on both demand and cost shocks: ηdjm ≡ ξdjm − αd ωdmt and
η`jm ≡ ξ`jm − α` ω`mt.
The parameters θ, together with the parameters αdβ`d/α` and α`βd` /α
d and the exogenous
variables of the model, contain all the information that we need to construct the equilibrium
mapping of the model and obtain an equilibrium. Given this model structure, we do not need
to separately identify demand and cost parameters. All our empirical results are based on the
24
estimation of these parameters and the implementation of counterfactual experiments using the
equilibrium mapping.
4 Estimation of the structural model
4.1 Specification assumptions
We complete the specification of the econometric model with the following functional form assump-
tions. First, the specification of function hn(njm) is completely nonparametric. Therefore, with
some abuse of notation, we use the parameters {θdn(nj) : for nj = 1, 2, ..., nmax} to represent the
terms θdn hn(nj). Similarly, we define the parameters {θ`n(nj) : for nj = 1, 2, ..., nmax} in the equa-
tion for loans. We consider a logarithmic specification for the function hQ, i.e., hQ(Qdj ) = ln(Qd
j ).
We define the parameters θd` ≡ θd` +αdβ`d/α` and θ`d ≡ θ`d+α`βd` /α
d that capture economies between
deposits and loans at the bank-county level.
For the unobservables ηdjmt and η`jmt, we consider the following component structure specifica-
tion:
ηdjmt = ηd(1)jm + η
d(2)t + η
d(3)jt + η
d(4)jmt (18)
ηd(1)jm represents bank-county fixed effects (i.e., bank-county dummies); η
d(2)t is an aggregate national
shock (i.e., time dummies); ηd(3)jt represents an bank-specific national level shock; and η
d(4)jmt is a
bank-county-specific shock. The error term in the loan equation has the same structure.
Given these specification assumptions, the equations of the econometric model are:
ydjmt = z′mt δd +
nmax∑n=1
θdn(n) 1jmt(n) + θd` s`jmt + θdQ ln(Qd
jt) + ηdjmt
y`jmt = z′mt δ` +
nmax∑n=1
θ`n(n) 1jmt(n) + θ`d sdjmt + θ`Q ln(Qd
jt) + η`jmt
(19)
where ydjmt ≡ y(sdjmt, s
d0mt
), y`jmt ≡ y
(s`jmt, s
`0mt
), 1jmt(n) ∈ {0, 1} is the binary variable that
indicates that the number of branches njmt is equal to n, and zmt is a vector of market characteristics
that captures the relative value of the outside alternative. More specifically, zmt includes a housing
price index and its growth, bankruptcy cases, population density, and age distribution.
Market size and market shares for deposits and loans. To construct market shares we need first
to construct market size variables Hdmt and H`
mt. We have used the following approach. First, we
postulate that the the market sizes Hdmt and H`
mt are proportional to the total population in county
25
m at period t:14
Hdmt = λd POPmt and H`
mt = λ` POPmt
where λd and λ` are positive constants and POPmt is total population in county m at period t.
Constants λd and λ` are chosen such that the the constructed market shares satisfy the model
constraint that the sum of the market shares∑M
m=1 sdjmt = Qd
mt/Hdmt and
∑Mm=1 s
`jmt = Q`
mt/H`mt
are always smaller than one. More specifically, λd = maxm,t
{Qd
mtPOPmt
}and λ` = maxm,t
{Q`
mtPOPmt
}.
These constants are λd = 547 (thousand USD) and λ` = 103 (thousand USD).
Admittedly, using POPmt as a measure of market size, and assuming that λd and λ` are constant
across counties and over time, seem like strong restrictions. To control for measurement error in this
measure of market size, we include socioeconomic characteristics at the county-level as explanatory
variables in the model. The effect of these socioeconomic characteristics in the model can be
interpreted as corrections for market size.
4.2 Identification restrictions
In the structural equations in (19), regressors s`jmt, sdjmt, and ln(Qd
jt) are endogenous variables
of the model, and therefore they are correlated with the error terms ηdjmt and η`jmt because of
simultaneity. Furthermore, though the number branches njmt is not an endogenous variable in
our structural model, we expect this variable to depend also on the supply and demand shocks in
deposits and loan markets. Therefore, the number of branches is also an endogenous variable in
the econometric model.
Assumptions ID-1 and ID-2 describe the restrictions that we impose in the model to deal with
endogeneity and to identify the θ parameters.
Assumption ID-1: Market characteristics zmt are strictly exogenous regressors with respect to
the bank-county-specific shocks ηd(4)jmt and η
`(4)jmt, i.e., for any pair of markets (m,m′) and any pair of
years (t, t′), we have that E(zmt η
d(4)jm′t′
)= 0 and E
(zmt η
`(4)jm′t′
)= 0. �
Assumption ID-2: The market specific component of market characteristics, i.e., z∗mt ≡ zmt −
E(zmt|t), are not correlated with the bank-specific national level shocks ηd(3)jt and η
`(3)jt , i.e., for any
market m and bank j, we have that E(z∗mt η
d(3)jt
)= 0 and E
(z∗mt η
`(3)jt
)= 0. �
Assumption ID-3: The bank-county-specific shocks ηd(4)jmt and η
`(4)jmt are not serially correlated.
�14We have also tried total county income, instead of county population. Our empirical results are very robust to
this.
26
These three assumptions provide moment conditions that identify all the θ parameters. We can
distinguish two sets of moment restrictions. Consider a bank that is active in at least two markets,
say m and m∗. Then, we can construct a difference-in-difference transformation of the equations
in (19): a difference between the equations for markets m and m∗, that removes the components
ηd(2)t and η
d(3)jt from the error term; a time difference between the equations at periods t and t− 1,
that eliminates the bank-county fixed effects ηd(1)jm . The transformed equations become:
∆ydjmt = ∆z′mt δd +
nmax∑n=1
θdn(n) ∆1jmt(n) + θd` ∆s`jmt + ∆ηd(4)jmt
∆y`jmt = ∆z′mt δ` +
nmax∑n=1
θ`n(n) ∆1jmt(n) + θ`d ∆sdjmt + ∆η`(4)jmt
(20)
where the ∼ symbol represents the difference between markets transformation, e.g., ydjmt ≡ ydjmt −
ydjm∗t, and ∆ represents the time difference transformation, e.g., ∆ydjmt ≡ [ydjmt−ydjm∗t]− [ydjm,t−1−
ydjm∗,t−1]. Note that the difference between markets also eliminates the effect of the aggregate
volume of deposits, ln(Qdjt), such that parameters θ`Q and θdQ cannot be identified from these
equations. However, Assumptions ID-1 and ID-3 imply the following moment conditions:
E([
zmt
xjm,t−s
]∆η
d(4)jmt
)= 0
E([
zmt
xjm,t−s
]∆η
`(4)jmt
)= 0
(21)
for s ≥ 2, and where xjmt represents the vector of bank-county specific endogenous variables, {ydjmt,
y`jmt, sdjmt, s
`jmt, njmt}. These moment conditions identify the parameters δd, δ`, θdn(n), θ`n(n), θd` ,
and θ`d.
Consider now another type of differences-in-differences transformation of the equations in (19):
we still apply the time difference between the equations at periods t and t − 1 to eliminate bank-
county fixed effects ηd(1)jm ; and we apply difference with respect to the average equation at period t,
i.e., ydjmt −E(ydjmt|t), that eliminates the aggregate national level shocks ηd(2)t from the error term.