The Geography of Separate and Unequal: Modern-day Segregation in Boston A Presentation to the Mayor's Office of Resilience and Racial Equity – Nov 14, 2016 Marcos Luna, Ph.D. Professor of Geography Geo-Information Sciences Graduate Program Coordinator Salem State University
Transcript
The Geography of Separate and Unequal: Modern-day Segregation in Boston
A Presentation to the Mayor's Office of Resilience and Racial Equity – Nov 14, 2016
Marcos Luna, Ph.D. Professor of Geography Geo-Information Sciences Graduate Program Coordinator Salem State University
Main Points
• Boston is increasingly diverse, but still very segregated
• The most racially isolated group is non-Hispanic White people
• School children are the most racially and ethnically diverse and the most segregated
• Racial and ethnic segregation means segregation of burdens and opportunities
WHAT IS SEGREGATION?
Marcos
Sticky Note
What is segregation? At its most basic, segregation is the separation of groups of people - by race, class, religion, etc - within a country, community, or establishment. Actually identifying and measuring segregation, however, is not so simple. In fact, researchers have been debating how to measure segregation for decades, and dozens of segregation indices have been proposed.
Dimensions of Segregation
• Evenness
• Exposure/Isolation
• Clustering
• Concentration
• Centralization
Massey, Douglas S., and Nancy A. Denton. 1988. "The Dimensions of Residential Segregation." Social Forces 67:281-315. Weinberg, Iceland, and Steinmetz .Measurement of Segregation by the U.S. Bureau of the Census in Racial and Ethnic Residential Segregation in the United States: 1980-2000.
Marcos
Sticky Note
In the late 1980s, Douglas Massey and Nancy Denton, two lions in the field of race studies, cleared the deck somewhat by performing a systematic analysis of 19 of these segregation indices. They concluded that segregation is not a singular phenomenon, but rather can be understood as consisting of 5 dimensions of spatial variation
Dimensions of Spatial Segregation
Sean F. Reardon & David O'Sullivan. “Measures of Spatial Segregation” Sociological Methodology. V. 34, n.1, p. 121-162, 2004
Marcos
Sticky Note
Nearly two decades later, Sean Reardon and David O'Sullivan proposed an even simpler conceptualization of residential segregation consisting of only 2 dimensions: spatial exposure/isolation: the extent that members of one group encounter members of another group (or their own group, in the case of spatial isolation) spatial evenness/clustering: the extent to which groups are similarly distributed
Even distribution; high exposure
Clustered distribution; isolated
IS THERE SEGREGATION?
Marcos
Sticky Note
Marked set by Marcos
Marcos
Sticky Note
How segregated is Boston and our region, and is it becoming more or less so? In evaluating the degree of segregation, we start by looking at the aggregate demographics of the region and the city as a whole. This establishes our benchmark of comparison.
5% 7% 10% 11%
88% 83%
79% 75%
5%
6% 6% 7% 2%
4% 5% 6%
0
1,000,000
2,000,000
3,000,000
4,000,000
5,000,000
6,000,000
7,000,000
1990 2000 2010 2015
Tota
l Po
pu
lati
on
Massachusetts Demographics, 1990 - 2015
Non-Hispanic Asians
Non-Hispanic Blacks
Non-Hispanic Whites
Hispanics
Decennial Census for 1990, 2000, and 2010, and American Community Survey 1-year Estimate for 2015. Numbers are for listed groups only.
Marcos
Sticky Note
Since 1990, the state population has grown by a little over 10%. It has also become more racially and ethnically diverse. Although the non-Hispanic White population has declined, the state is still mostly White and much whiter than the rest of the nation.
11% 15%
18% 20%
60% 52%
49%
46%
24%
25% 23%
24%
5% 8%
9%
10%
0
100,000
200,000
300,000
400,000
500,000
600,000
700,000
1990 2000 2010 2015
Tota
l Po
pu
lati
on
Boston Demographics, 1990 - 2015
Non-Hispanic Asians
Non-Hispanic Blacks
Non-Hispanic Whites
Hispanics
Decennial Census for 1990, 2000, and 2010, and American Community Survey 1-year Estimate for 2015. Numbers are for listed groups only.
Marcos
Sticky Note
After a period of decline ending in 2000, the City of Boston’s total population has since grown, increasing by at least 14% since 1990 (and over 15% since 2000), which is a significantly greater rate of growth than the state as a whole. The total non-Hispanic White population in Boston has decreased by 12% since 1990 (double the rate of the state level decline). Where non-Hispanic Whites once constituted 60% of the city’s population – the majority of the population – they are now less than half. Non-Hispanic Whites are still the largest racial group in Boston, but they are no longer the majority. Since at least 2010, Boston has been a majority minority city. Without question, Boston has become more diverse. But greater diversity does not necessarily mean the absence of racial or ethnic segregation.
Marcos
Sticky Note
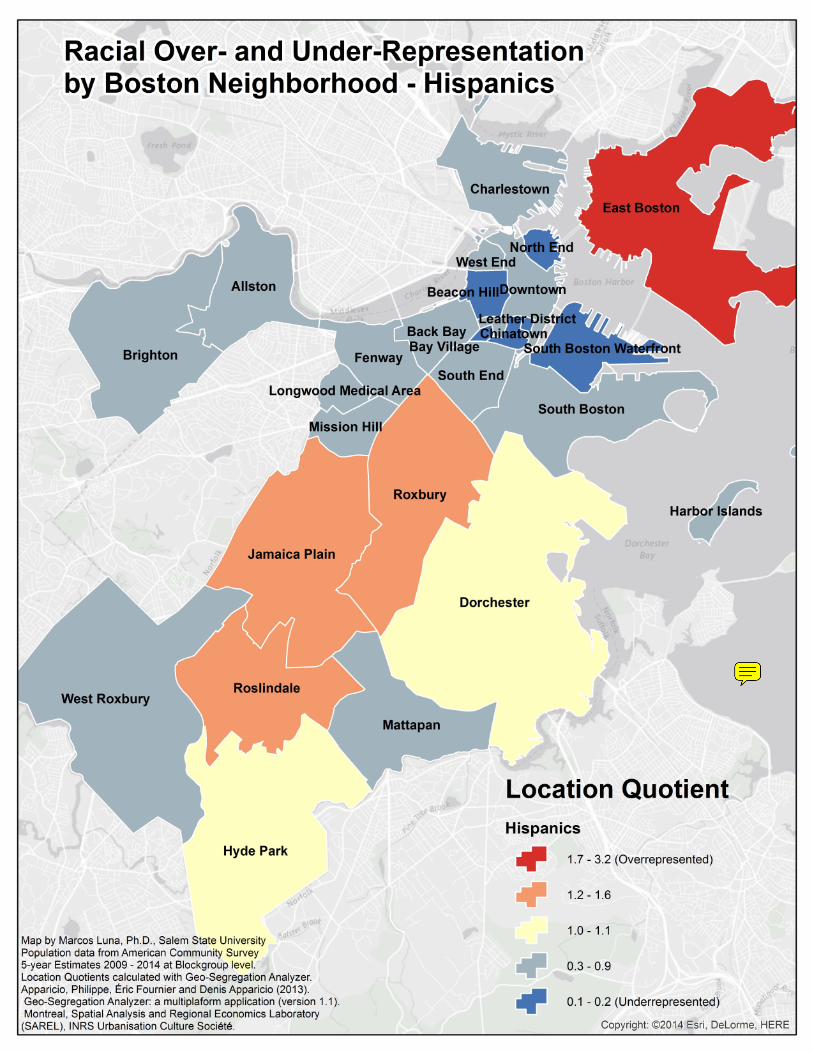
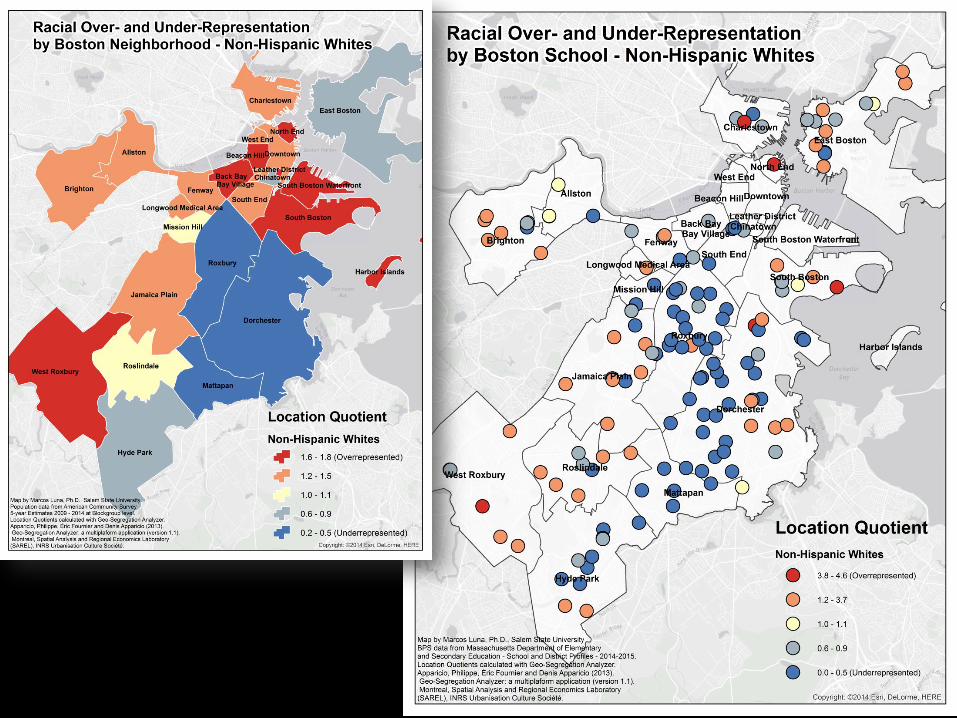
The location quotient is useful for identifying spatial units in a metropolitan area where a population group is under-represented (LQ < 1) or conversely, over-represented (LQ > 1). The LQ measures the degree to which a population group’s representation in a given neighborhood reflects its representation in the larger metropolitan area.
0.4
0.45
0.5
0.55
0.6
0.65
0.7
0.75
1990 2000 2010 2009-2014
Segr
ega
tio
n In
de
x Racial Segregation in Boston, 1990 - 2014
Hispanics
Non-Hispanic Whites
Non-Hispanic Blacks
Non-Hispanic Asians
Based on Blockgroup level data from the Decennial Census for 1990, 2000, and 2010, and American Community Survey 5-year Estimates for 2009-2014. Segregation indices calculated with Geo-Segregation Analyzer (version 1.1). Apparicio, Philippe, Éric Fournier and Denis Apparicio (2013). Montreal, Spatial Analysis and Regional Economics Laboratory (SAREL), INRS Urbanisation Culture Société.
Marcos
Sticky Note
The Segregation Index is a measure of evenness. It measures the distribution of one or more population groups across the spatial units of the metropolitan area (e.g., census block groups). Values range between 1 and 0. The higher the number, the more unevenly distributed, and the lower the number, the more evenly distributed.
0
0.1
0.2
0.3
0.4
0.5
0.6
0.7
0.8
0.9
1
1990 2000 2010 2009-2014
Iso
lati
on
Ind
ex
Racial Isolation in Boston, 1990 - 2014
Hispanics
Non-Hispanic Whites
Non-Hispanic Blacks
Non-Hispanic Asians
Based on Blockgroup level data from the Decennial Census for 1990, 2000, and 2010, and American Community Survey 5-year Estimates for 2009-2014. Isolation indices calculated with Geo-Segregation Analyzer (version 1.1). Apparicio, Philippe, Éric Fournier and Denis Apparicio (2013). Montreal, Spatial Analysis and Regional Economics Laboratory (SAREL), INRS Urbanisation Culture Société.
Marcos
Sticky Note
The Isolation Index is a measure of exposure. The isolation index measures the extent to which a group is exposed only to its own members. The more a group is exposed to itself, the less it is exposed to other groups. Values range between 1 and 0. The higher the number, the more isolated or segregated a group is; the less exposure it has to other groups.
0
0.1
0.2
0.3
0.4
0.5
0.6
1990 2000 2010 2009-2014
Inte
ract
ion
Ind
ex w
ith
No
n-H
isp
anic
Wh
ite
s Interaction of Minorities with NH Whites in Boston, 1990 - 2014
Hispanics
Non-Hispanic Blacks
Non-Hispanic Asians
Based on Blockgroup level data from the Decennial Census for 1990, 2000, and 2010, and American Community Survey 5-year Estimates for 2009-2014. Interaction indices calculated with Geo-Segregation Analyzer (version 1.1). Apparicio, Philippe, Éric Fournier and Denis Apparicio (2013). Montreal, Spatial Analysis and Regional Economics Laboratory (SAREL), INRS Urbanisation Culture Société.
Marcos
Sticky Note
The interaction index measures the exposure of one group to another group. Values range between 1 and 0. The higher the number, the greater the potential for interaction, and the less segregation. The lower the number, the less potential there is for interaction, and therefore more segregation.
0
0.1
0.2
0.3
0.4
0.5
0.6
1990 2000 2010 2009-2014
Inte
ract
ion
Ind
ex w
ith
Min
ori
tie
s
Interaction of NH Whites with Minorities in Boston, 1990 - 2014
Hispanics
Non-Hispanic Blacks
Non-Hispanic Asians
Based on Blockgroup level data from the Decennial Census for 1990, 2000, and 2010, and American Community Survey 5-year Estimates for 2009-2014. Interaction indices calculated with Geo-Segregation Analyzer (version 1.1). Apparicio, Philippe, Éric Fournier and Denis Apparicio (2013). Montreal, Spatial Analysis and Regional Economics Laboratory (SAREL), INRS Urbanisation Culture Société.
Marcos
Sticky Note
Of all racial groups in Boston, Non-Hispanic Whites have the least interaction with other racial groups.
Changing Racial Composition in Schools
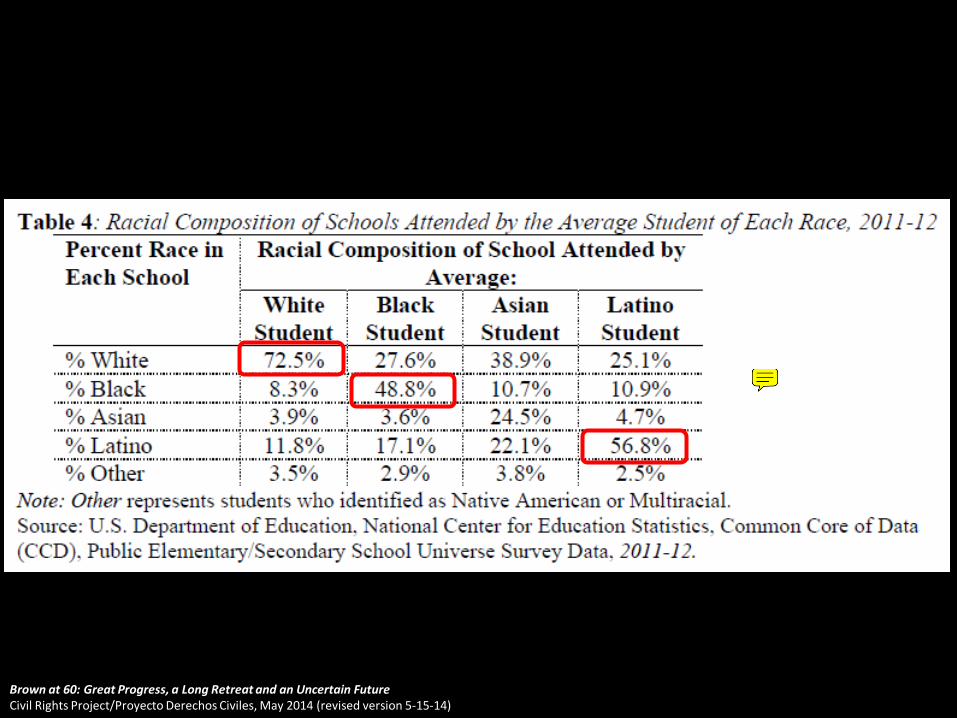
Brown at 60: Great Progress, a Long Retreat and an Uncertain Future Civil Rights Project/Proyecto Derechos Civiles, May 2014 (revised version 5-15-14)
50%
Marcos
Sticky Note
When we talk about segregation, we tend to talk about residential segregation. Although non-Whites make up only 25% of US population as a whole, nearly 50% of all school-age children are non-White. This is a massive shift in the demographics of this country.
Brown at 60: Great Progress, a Long Retreat and an Uncertain Future Civil Rights Project/Proyecto Derechos Civiles, May 2014 (revised version 5-15-14)
Marcos
Sticky Note
Despite this massive demographic shift, the relative exposure of children of different races is still very uneven. Note that the average white student is attends a school where 72.5% of children are white.
Brown at 60: Great Progress, a Long Retreat and an Uncertain Future Civil Rights Project/Proyecto Derechos Civiles, May 2014 (revised version 5-15-14)
Marcos
Sticky Note
The crusade to desegregate American schools has resulted in major change, especially in the South. In the wake of court-rulings forcing desegregation and other desegregation policies starting in the mid 1960s, schools in the South have become much less segregated. However, these accomplishments are fragile. Since the late 1980s, school desegregation policies have been deliberately dismantled as a result of new court rulings, and changes in attitude by the political leadership.
Brown at 60: Great Progress, a Long Retreat and an Uncertain Future Civil Rights Project/Proyecto Derechos Civiles, May 2014 (revised version 5-15-14)
Marcos
Sticky Note
Over the last 40+ years, the South has experienced the largest drop in segregation, followed by the West, and these two regions now have the lowest levels of school segregation for Black children. The Midwest and Border regions (i.e. the historic border between "free" and "slave states") have had modest decreases in segregation. The Northeast, by contrast, has only grown more segregated since the late 1960s and now represents the most racially segregated region of the country for Black school children.
BPS data from Massachusetts Department of Elementary and Secondary Education - School and District Profiles - 2014-2015. City of Boston data based on data from the American Community Survey 1-year Estimates for 2015 of children age 5 – 17.
40.9% 32%
13.3% 20%
37.8%
40%
7.7%
8%
0
10,000
20,000
30,000
40,000
50,000
60,000
70,000
80,000
Boston Schools Boston School-Age Children
Tota
l Po
pu
lati
on
Boston School Enrollment and City of Boston School-Age Population, 2015
Asian
Black
White
Hispanic
Marcos
Sticky Note
There are approximately 145 K-12 schools within the City of Boston with over 63,000 students combined. This population is considerably more diverse than the city population as a whole. Where the general population of Boston is over 46% white, only 13% of Boston school children are White. Hispanic students are over-represented in Boston schools when compared to their share of the city’s school-age population. Non-Hispanic White students are the most underrepresented racial group in Boston schools; considerably smaller proportion than their share of the city’s school-age population would suggest.
0
0.1
0.2
0.3
0.4
0.5
0.6
Hispanic White Black Asian
Segr
ega
tio
n In
de
x
Racial Segregation in Boston Schools, 2015
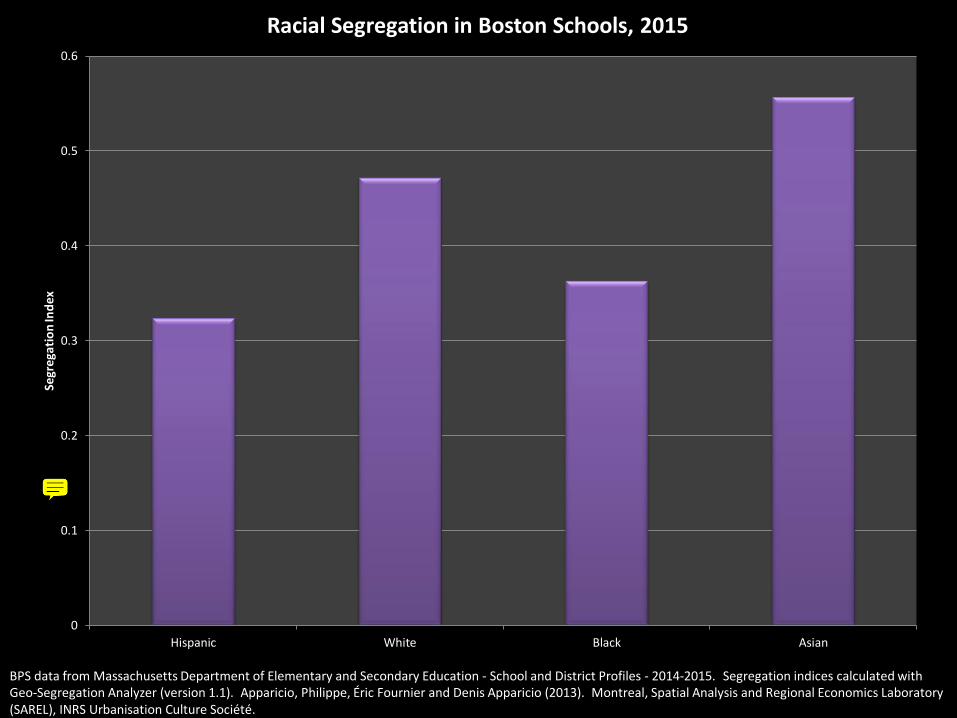
BPS data from Massachusetts Department of Elementary and Secondary Education - School and District Profiles - 2014-2015. Segregation indices calculated with Geo-Segregation Analyzer (version 1.1). Apparicio, Philippe, Éric Fournier and Denis Apparicio (2013). Montreal, Spatial Analysis and Regional Economics Laboratory (SAREL), INRS Urbanisation Culture Société.
Marcos
Sticky Note
Asian students are the most unevenly distributed amongst Boston schools, followed by Non-Hispanic Whites. In other words, these two groups tend to be clustered in a few schools, rather than spread across the schools relative to their proportion of the student population.
0
0.1
0.2
0.3
0.4
0.5
0.6
Hispanic White Black Asian
Iso
lati
on
Ind
ex
Racial Isolation in Boston Schools, 2015
BPS data from Massachusetts Department of Elementary and Secondary Education - School and District Profiles - 2014-2015. Isolation indices calculated with Geo-Segregation Analyzer (version 1.1). Apparicio, Philippe, Éric Fournier and Denis Apparicio (2013). Montreal, Spatial Analysis and Regional Economics Laboratory (SAREL), INRS Urbanisation Culture Société.
Marcos
Sticky Note
Amongst the schools’ racial groups, Hispanic students are the most racially isolated, followed closely by Black students. These students find themselves overwhelmingly in schools with members of their own group.
Marcos
Sticky Note
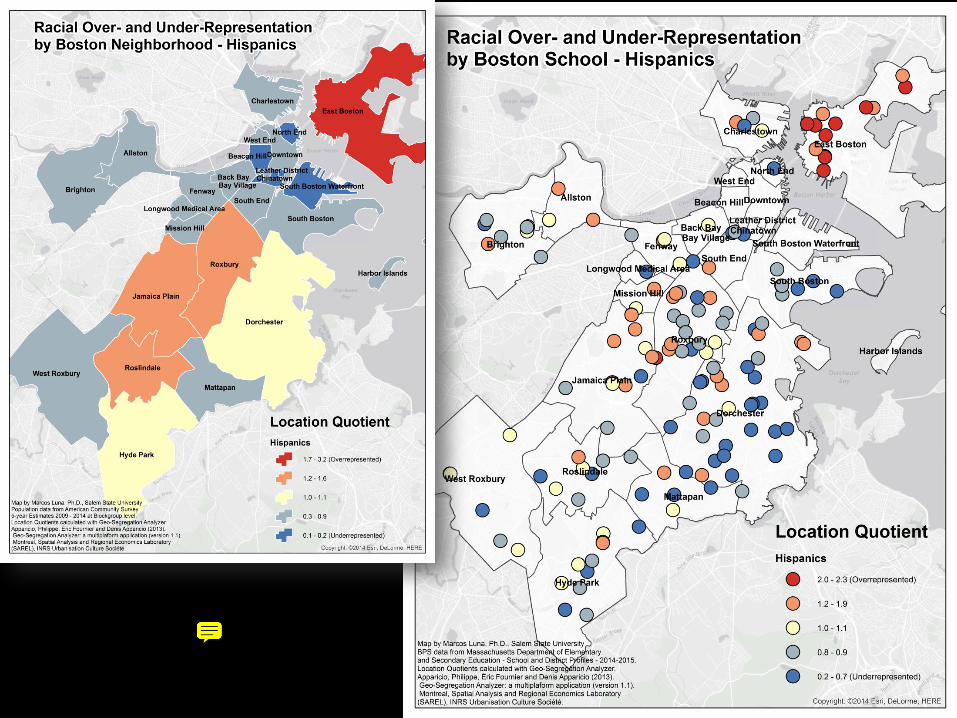
In the same way that we evaluated Boston neighborhoods, we can look at Boston schools to identify to where and to what degree the various racial and ethnic groups are over and under-represented relative to their proportion of the school population. Hispanic school children in Boston schools appear to be notably overrepresented in East Boston. In fact, the pattern of over- and under-representation seems to echo what’s going on with the general city population in those same neighborhoods.
WHY IS THERE SEGREGATION?
“‘De facto segregation’ means Negroes are segregated, but nobody did it.” --- James Baldwin, 1965.
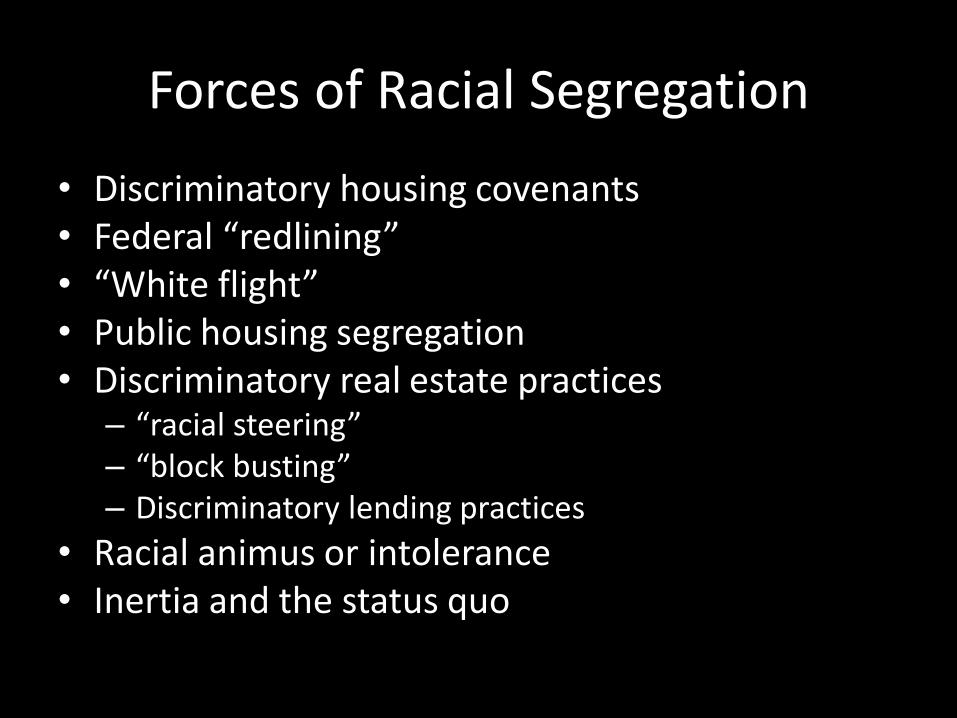
Forces of Racial Segregation
• Discriminatory housing covenants • Federal “redlining” • “White flight” • Public housing segregation • Discriminatory real estate practices
• Racial animus or intolerance • Inertia and the status quo
WHY IS SEGREGATION NOT GOOD?
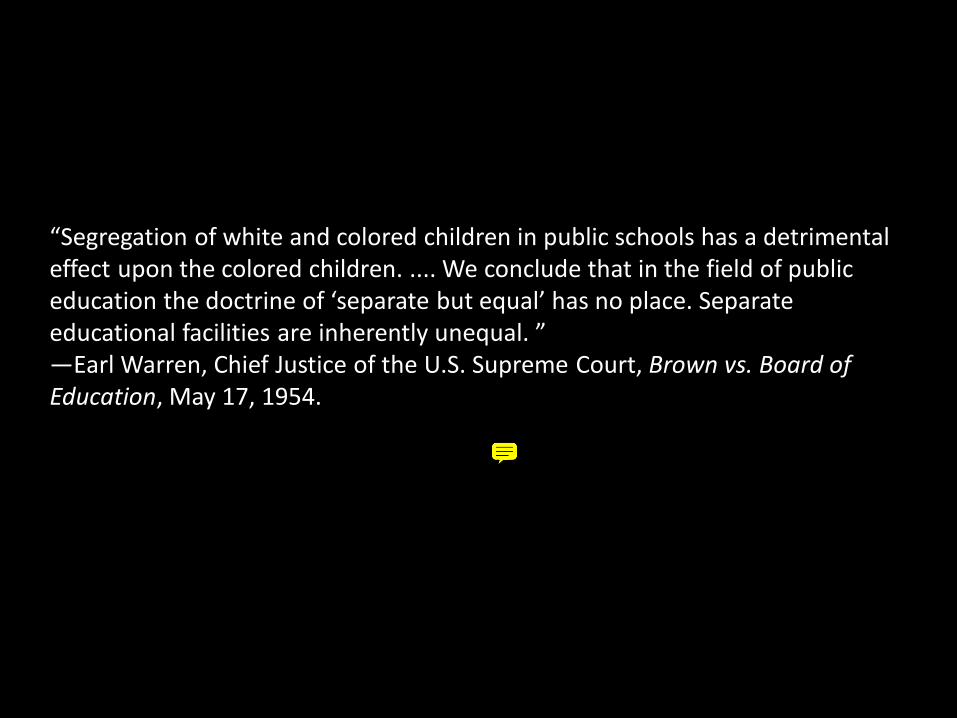
“Segregation of white and colored children in public schools has a detrimental effect upon the colored children. .... We conclude that in the field of public education the doctrine of ‘separate but equal’ has no place. Separate educational facilities are inherently unequal. ” —Earl Warren, Chief Justice of the U.S. Supreme Court, Brown vs. Board of Education, May 17, 1954.
Marcos
Sticky Note
The problem with racial segregation is that it is inherently the separation that we are talking about. And this separation is always coupled with inequalities in the things that matter in society: wealth, health, and general wellbeing. On a more practical level, racial segregation creates a racialized geography. Anything that happens in that space or geography becomes implicated in the politics of race. Whether intentional or not, it has the same effect.
WHAT CAN WE DO ABOUT RACIAL SEGREGATION?
What can we do?
• Work to undo segregation
– Increase opportunity for exposure and interaction
– Eliminate barriers to exposure, integration, and interaction
• Mitigate the impacts of segregation
– Uncouple economic and social privilege from race and place