101
THE GEOGRAPHY OF THE UK’S CREATIVE AND HIGH–TECH ECONOMIES Hasan Bakhshi, John Davies, Alan Freeman and Peter Higgs January 2015
| Date post: | 12-Mar-2019 |
| Category: |
Documents |
| Upload: | truongthuan |
| View: | 216 times |
| Download: | 0 times |
THE GEOGRAPHY OF THE UK’S CREATIVE AND HIGH–TECH ECONOMIES
Hasan Bakhshi, John Davies, Alan Freeman and Peter Higgs
January 2015

Nesta is an innovation charity with a mission to help people and organisations bring great ideas to life.
We are dedicated to supporting ideas that can help improve all our lives, with activities ranging from early–stage investment to in–depth research and practical programmes.
Nesta is a registered charity in England and Wales with company number 7706036 and charity number 1144091. Registered as a charity in Scotland number SCO42833. Registered office: 1 Plough Place, London, EC4A 1DE.
www.nesta.org.uk ©Nesta 2015
Acknowledgements
The authors would like to thank Douglas Cameron and Tom Knight of the Department for
Culture, Media & Sport for their assistance in producing the data tables and figures in this report,
and Mark Spilsbury and Derek Bosworth for their comments on an earlier version.
3 THE GEOGRAPHY OF THE UK’S CREATIVE AND HIGH-TECH ECONOMIES
CONTENTS
EXECUTIVE SUMMARY 4
1 INTRODUCTION 6
2 POLICY CONTEXT 8 2.1 Definitions of the UK’s creative economy 8
2.2 Definitions of the UK’s high-tech economy 9
3 DYNAMIC MAPPING METHODOLOGY 12
4 DATA SOURCES 15
5 THE CREATIVE ECONOMY 16 5.1 Classifying the creative economy 16
5.2 The size of the creative economy 19
5.3 Growth of the creative economy 22
5.4 Regional geography of the UK’s creative economy 23
6 THE HIGH-TECH ECONOMY 28 6.1 Defining the high-tech economy 28
6.2 The size of the high-tech economy 40
6.3 Growth of the high-tech economy 42
6.4 Regional geography of the UK’s high-tech economy 43
7 THE CREATIVE AND HIGH-TECH ECONOMIES COMPARED 49
8 SUB-REGIONAL GEOGRAPHY OF THE UK’S CREATIVE AND HIGH-TECH 57 ECONOMIES 8.1 The sub-regional geography of the UK’s creative economy and its components 58
8.2 The sub-regional geography of the UK’s high-tech economy and its components 61
8.3 How the sub-regional distributions of the creative and high-tech economies 64 compare
9 CONCLUSIONS AND NEXT STEPS 71
10 GLOSSARY 74
11 REFERENCES 76
APPENDICES 81 1 Appendix of SOC tables 81
2 Appendix of SIC tables 88
3. Appendix on employment intensity distributions 94
4 Appendix on using intensity as a discriminator between industries 95
5 Appendix on industries with a STEM intensity of 15 per cent or 96 more (with more than 4,000 employees) that do not fall within the Eurostat high-tech definition.
ENDNOTES 98

4 THE GEOGRAPHY OF THE UK’S CREATIVE AND HIGH-TECH ECONOMIES
EXECUTIVE SUMMARY
The UK’s creative and high–tech economies are major employers. Between them, and without double counting, they account for 4.76 million jobs, or around 16 per cent of the UK workforce (average of 2011–2013). Within this, 2.52 million jobs are
in the creative economy, 3.11 million are in the high–tech economy, and 0.87 million are in both.
Between 2011 and 2013, employment in the UK’s creative economy (jobs in the creative industries plus creative jobs elsewhere) grew by 4.3 per cent per annum (p.a.) on average, over three times faster than the workforce as a whole (1.2 per cent p.a.).1 This is also faster than employment growth in the high–tech economy – that is, jobs in the high–tech industries plus Science, Technology, Engineering and Mathematics (STEM) jobs outside the high–tech industries – which grew at 2.1 per cent p.a.
Similarly, employment in the UK’s creative industries grew at 5.0 per cent p.a., much faster than the 1.5 per cent p.a. growth of employment in the high–tech industries (which was dragged down by particularly slow growth in non–STEM occupations).
Echoing Nesta’s previous research findings using business registry data,2 we detect strong tendencies for creative and high–tech employment to co–locate. The creative economy is, however, less equally distributed across the UK, with London being more prominent than it is in the UK’s high–tech economy. There is some evidence though of a slight catch up since 2011 as London’s creative economy workforce has grown more slowly than most parts of the country.
How big are the UK’s creative and high–tech economies?
There were 2.52 million jobs in the UK’s creative economy (average 2011–2013), representing 8.3 per cent of the workforce. This consisted of 1.65 million jobs in the creative industries (866,000 of which were in creative occupations and 782,000 of which were in other roles) and 876,000 jobs in creative occupations outside of the creative industries (sometimes called ‘embedded creatives’). That is, there are slightly more creative jobs outside the UK’s creative industries than within.3
There were 3.11 million jobs in the high–tech economy (average 2011–2013), around 10.3 per cent of the workforce. This consisted of 2.33 million jobs in high–tech industries (805,000 of which were in STEM occupations and approximately 1.53 million in other roles) and 782,000 STEM jobs outside the high–tech industries. The extent to which STEM jobs are embedded in the wider UK economy is therefore similar in proportional terms to creative jobs.
0.87 million jobs fell within both the creative and high–tech economies (average 2011–2013, 2.8 per cent of the workforce); 0.46 million of these were at the same time both creative and STEM occupations. 0.54 million people worked in industries that we classify as both creative and high–tech. That part of the UK workforce where the creative and high–tech economies meet has been particularly dynamic, growing faster than the workforce as a whole over the 2011–2013 period at 8.0 p.a. on average (with dual creative/high–tech occupations growing at 5.7 per cent p.a. and dual creative/high–tech industry employment growing especially rapidly at 9.6 per cent p.a.). Policymakers should therefore pay particular attention to this segment of the UK’s economy.
5 THE GEOGRAPHY OF THE UK’S CREATIVE AND HIGH-TECH ECONOMIES
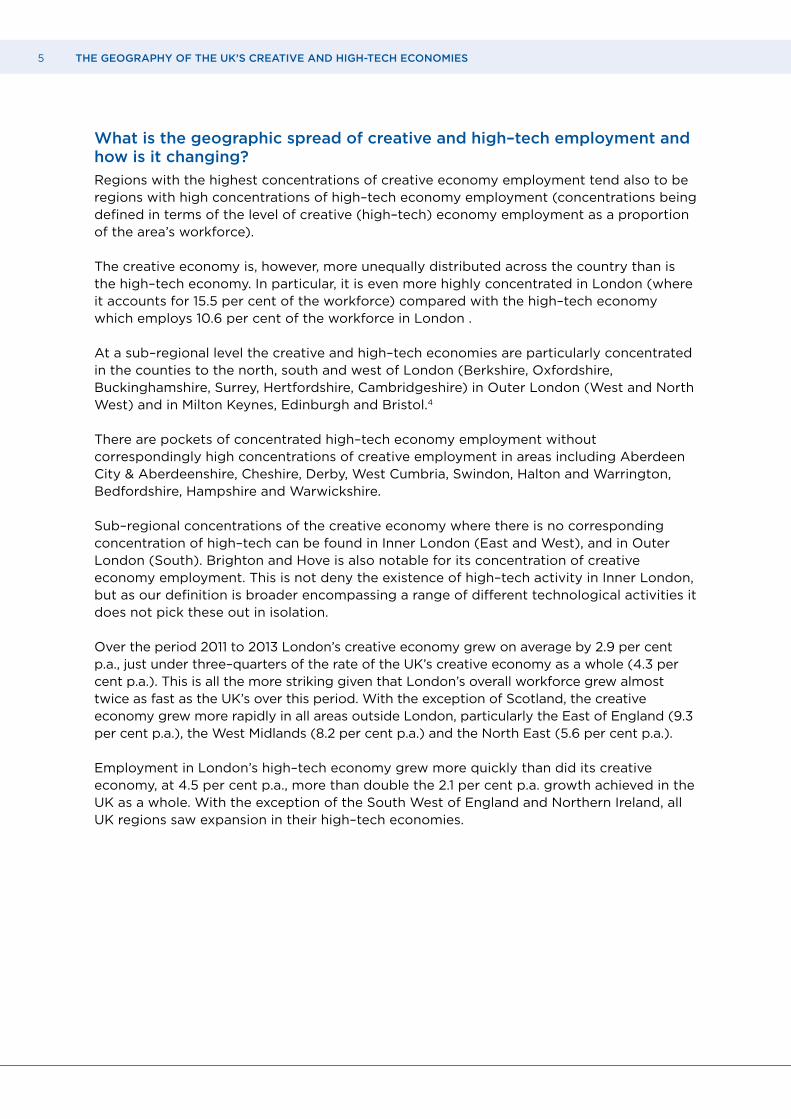
What is the geographic spread of creative and high–tech employment and how is it changing?
Regions with the highest concentrations of creative economy employment tend also to be regions with high concentrations of high–tech economy employment (concentrations being defined in terms of the level of creative (high–tech) economy employment as a proportion of the area’s workforce).
The creative economy is, however, more unequally distributed across the country than is the high–tech economy. In particular, it is even more highly concentrated in London (where it accounts for 15.5 per cent of the workforce) compared with the high–tech economy which employs 10.6 per cent of the workforce in London .
At a sub–regional level the creative and high–tech economies are particularly concentrated in the counties to the north, south and west of London (Berkshire, Oxfordshire, Buckinghamshire, Surrey, Hertfordshire, Cambridgeshire) in Outer London (West and North West) and in Milton Keynes, Edinburgh and Bristol.4
There are pockets of concentrated high–tech economy employment without correspondingly high concentrations of creative employment in areas including Aberdeen City & Aberdeenshire, Cheshire, Derby, West Cumbria, Swindon, Halton and Warrington, Bedfordshire, Hampshire and Warwickshire.
Sub–regional concentrations of the creative economy where there is no corresponding concentration of high–tech can be found in Inner London (East and West), and in Outer London (South). Brighton and Hove is also notable for its concentration of creative economy employment. This is not deny the existence of high–tech activity in Inner London, but as our definition is broader encompassing a range of different technological activities it does not pick these out in isolation.
Over the period 2011 to 2013 London’s creative economy grew on average by 2.9 per cent p.a., just under three–quarters of the rate of the UK’s creative economy as a whole (4.3 per cent p.a.). This is all the more striking given that London’s overall workforce grew almost twice as fast as the UK’s over this period. With the exception of Scotland, the creative economy grew more rapidly in all areas outside London, particularly the East of England (9.3 per cent p.a.), the West Midlands (8.2 per cent p.a.) and the North East (5.6 per cent p.a.).
Employment in London’s high–tech economy grew more quickly than did its creative economy, at 4.5 per cent p.a., more than double the 2.1 per cent p.a. growth achieved in the UK as a whole. With the exception of the South West of England and Northern Ireland, all UK regions saw expansion in their high–tech economies.
6 THE GEOGRAPHY OF THE UK’S CREATIVE AND HIGH-TECH ECONOMIES
1. INTRODUCTION
In recent years, analysts have variously employed terms such as the knowledge economy,5 information economy,6 creative economy,7 and high–tech economy8 to characterise a trend in advanced developed countries towards economic activities
where conceptions of technical know–how, expertise and creativity are considered critical. The two concepts of creative and high–tech industries have had particular longevity – in the UK and beyond – though definitional ambiguities have prevented an understanding of how they compare. This report corrects these ambiguities, clarifies the relationship between creative and high–tech industries and compares their size and recent performance.
In policy circles, it is widely believed that both these industries enjoy faster productivity growth than other sectors and are therefore good for a country’s international competiveness and economic growth. They are also viewed as engines of job growth as they employ highly–skilled workers who are less vulnerable to substitution from new technologies.9 Last, but not least, both sectors are seen as supporting growth in the wider economy, insofar as they create knowledge spillovers, such as those embodied in mobile labour, which drive innovation and productivity growth in other industries. These spillovers, it is argued, constitute a market failure and justify policy intervention. As such, policymakers in an increasing number of countries – developing as well as developed – are prioritising their creative and high–tech industries for policy support (UNESCO, 2013, Edwards and Lawrence, 2010).
The importance of skilled labour and human capital is reflected in an emphasis on talent in the definitions used to understand these industries, as illustrated, for example, by the Department for Culture, Media & Sport (DCMS) definition of the creative industries, and the role assigned to STEM knowledge or skills in many accounts of the high–tech industries. Thus, the DCMS’s 1998 Mapping Document, the first national attempt to define the UK’s creative industries, defined them as:10
those industries which have their origin in individual creativity, skill and talent and which have a potential for wealth and job creation through the generation and exploitation of intellectual property
and a US Congressional Office of Technology Assessment document describes high–tech firms as those:11
engaged in the design, development, and introduction of new products and/or innovative manufacturing processes through the systematic application of scientific and technical knowledge
In our 2013 study, A Dynamic Mapping of the UK’s Creative Industries,12 we noted that concepts like the ‘creative industries’ and ‘creative economy’ – indeed ‘creativity’ itself – although widely used by policymakers, lacked sufficiently clear and rigorous definitions. The report aimed to address this weakness by introducing clear criteria for which occupations should or should not be considered ‘creative’ for measurement purposes. The report also introduced a methodology for determining which industries should be classified as ‘creative’ based on their creative intensity (Freeman 2004, 2008a, Bakhshi et al., 2013:12), defined as the proportion of an industry’s workforce in creative occupations. It found that creative intensity distinguishes

7 THE GEOGRAPHY OF THE UK’S CREATIVE AND HIGH-TECH ECONOMIES
‘creative industries’ from other industries which also employ creative talent: although large numbers of individuals are employed in creative occupations in many industries, only a small number of these – the ‘creative industries’ – have exceptionally high levels of creative intensity.
Concepts like ‘high–tech industry’, and ‘STEM’ occupation, it turns out, are also plagued by definitional ambiguities and uncertainties. The wide range of classifications adopted by different studies – even within countries – has given rise to significant differences in estimates of the size, growth and geography of the high–tech industries and also of the demand for, and use made of, STEM occupations and skills in the wider economy.
The idea of using STEM workforce intensity (the proportion of an industry’s workforce in STEM occupations) to identify high–tech industries has been independently applied by a number of US researchers. For example, Hecker (2005:58) defines high–tech industries in the US as follows:
An industry is considered high tech if employment in technology–oriented occupations accounted for a proportion of that industry’s total employment that was at least twice the 4.9 per cent average for all industries.13
In this report, we ground our definition of STEM occupations, the high–tech industries and the wider high–tech economy, in a statistical analysis of STEM intensity which mirrors our use of creative intensity, but which differs from it in significant ways (and in particular, as discussed below, reflecting the fact that STEM intensity turns out to be a weaker discriminator between industries than creative intensity).
In summary, in this report we make the following contributions:
1. We review the classifications of the creative and high–tech economies in the UK context (Section 2).
2. We update the baseline estimates of the UK’s creative industries and creative economy in Dynamic Mapping for the period 2011–2013 and analyse their growth rates and geographies (Section 5).14
3. We estimate the number of individuals employed in STEM occupations in the UK and analyse how STEM intensity is distributed across industries. We find that the tendency for a small set of industries to have particularly high proportions of STEM workers in their workforce is less pronounced than is the case for creative occupations in the creative economy (Section 6).
4. We combine the STEM intensity analysis with Eurostat’s classifications of high–tech industries, based on their level of R&D spend (for manufacturing) and knowledge intensity, measured by the qualifications of their workforce15 for (services), to generate a classification of high–tech industries, and corresponding estimates of the size, growth and regional geography of high–tech industries and the high–tech economy (Section 6).
5. Using our classifications for creative and high–tech industries and economies we compare the make–up of these two parts of the UK economy and describe how they relate to one another in accounting terms (Section 7).
6. We analyse the sub–regional geography of the UK’s creative and high–tech economies and compare it with how other sectors are distributed (Section 8).
7. We conclude by summarising the research findings and discussing the implications for measurement and future research (Section 9).
The next section provides some of the UK context on debates surrounding the definition of the creative and high–tech economies.

8 THE GEOGRAPHY OF THE UK’S CREATIVE AND HIGH-TECH ECONOMIES
2 POLICY CONTEXT
2.1 DEFINITIONS OF THE UK’S CREATIVE ECONOMY
The 1998 and 2001 DCMS Mapping Documents16 proposed that 13 sub–sectors made up the creative industries. These industries appeared to form a reasonably coherent group based on the generation of commercial value by creative talent. The 13 sub–sectors however, contained a notable split between household–facing sub–sectors like music, film and performing arts and business–facing sectors like advertising, design and software, leading to accusations of over–inclusion and boosterism.17
There were also many caveats and limitations in the DCMS Mapping Documents concerning gaps, a lack of comparability across sub–sectors, and the reliance on highly aggregated source data. The annual DCMS Creative Industries Economic Estimates, first published in 2002, attempted to address some of these challenges, at least for those sub–sectors identifiable using the official Standard Industrial Classification (SIC) codes, by producing each year the same headline statistics on Gross Value Added (GVA), employment, net exports and the number of creative businesses, based on consistent data sources for each sub–sector. These headline statistics showed the UK’s creative industries were growing at twice the rate of other sectors, helping to raise the profile of the sector.18
A great many challenges remained in the DCMS statistics as a result of the limitations of the SIC codes, which are set in conjunction with the UN’s industrial classification system for the purposes of international consistency and which are reviewed only at roughly ten–year intervals.
Partly because of this – but also due to differing data needs – sector bodies such as UK Music, the British Fashion Council and the Crafts Council started producing their own sector–specific economic statistics, along with equivalent bodies across the devolved nations and the English regions. Inconsistent treatments of sectoral boundaries (what should be included and what should not) led to a plethora of non–comparable estimates. The result was an ever–increasing landscape of sectoral, national and regional statistics that purported to measure similar things but were not strictly comparable.19
The position was exacerbated further in December 2011 when the DCMS removed two software–related occupations and industries from its classifications, cutting £25.9 billion from the amount creative industries were estimated to contribute to UK GVA. This decision showed a lack of appreciation for the interconnected relationship between software and creative content. But it also exposed the fact that the DCMS statistics had always been based on a pragmatic selection of occupational and industrial codes, and not on a systematic methodology.
Dynamic Mapping proposed an explicit methodology for determining which occupations and industries should be classified as creative for measurement purposes. It assessed the different characteristics which make an occupation creative, and then used the workforce intensity of employment in creative occupations to identify creative industries.20 By
9 THE GEOGRAPHY OF THE UK’S CREATIVE AND HIGH-TECH ECONOMIES
showing that a defining characteristic of creative industries was their especially intensive use of creative talent, it provided a statistical basis for treating the different creative industries as a coherent group. Following a public consultation exercise, in January 2014 the DCMS adopted this methodology for its official creative industries economic estimates.21
2.2 DEFINITIONS OF THE UK’S HIGH–TECH ECONOMY
Policymakers in the UK have long held the view that the UK’s future growth prospects depend on it having a strong high–tech economy. The 2011 HM Treasury/BIS Plan for Growth states that:
Britain has to earn its way in the modern world. We have to become much more productive so we can be a leading high tech, highly skilled economy. We must build a new model of economic growth – where instead of borrowing from the rest of the world, we invest and we save and we export. Our economy must become more balanced.22
This quote brings out a number of aspects of UK policymakers’ interest in high–tech: the idea that it is a future area of opportunity, the association of high–tech with high skills, and the view that the UK economy needs to be more ‘balanced’.23
However, the rhetoric of ‘high–tech’ has outpaced improvement in its measurement. Its scope is rarely defined, statistics on its economic importance are lacking and, in contrast to the creative economy, there is no ‘official’ classification. A review of the use of the term in the UK public policy literature reveals that it has been variously thought of as:
• A set of technologies.
• A group of firms that invest in high levels of R&D activity.
• A key employment destination for Science Technology Engineering and Mathematics (STEM) talent.
• A distinct group of industries.
We discuss these in turn:
A set of technologies
In 2012 David Willetts, the Minister of State of Science and Universities, in a speech on the UK’s high–tech future24 referred to the Government Office for Science’s 2010 report identifying future technologies and innovations likely to be important to the UK in the 2020s. These being classified into the following broad categories:25
• Biotechnology and Pharmaceuticals.
• Materials and Nanotechnology.
• Digital and Networks.
• Energy and low–carbon technologies.
10 THE GEOGRAPHY OF THE UK’S CREATIVE AND HIGH-TECH ECONOMIES
In a subsequent publication, Willetts outlined ‘eight great technologies’ where the government was working to ensure that they were properly supported, these being:
1. Robotics and autonomous systems
2. Satellites
3. Advanced materials
4. Regenerative medicine
5. Energy storage
6. Synthetic biology
7. Agri–science
8. Big data26
A group of firms that invest in high levels of R&D activity
In 2010, a report by James Dyson set out a plan for making the UK the leading high–tech exporter in Europe.27 This included a range of policy measures, among which were a number of support proposals for high-tech companies to encourage R&D investment. One of these was that the level of Enterprise Investment Scheme (EIS) tax relief should be raised for angel investors in high-tech companies. High-tech companies being defined on the basis of their level of R&D activities.
An employment destination for STEM talent
There is a long tradition in the UK of assessing whether the UK is producing enough people with STEM skills to meet its future workforce needs, resulting in successive reports by the Government on this subject: DTI (2006),28 DFES (2006),29 DIUS (2009)30 and BIS (2011).31
More recently, in 2011 and 2013 the UK Commission for Employment and Skills (UKCES) has undertaken reviews of the supply of and demand for high–level STEM skills in the UK.32 The 2011 review was undertaken with the explicit aim of recognising that STEM skills support ‘research, innovation and high–tech manufacturing’.33 It concluded that there was a broad match between the proportion of the workforce with high–level STEM skills and the proportion of jobs requiring such skills. However, it also found evidence of skills shortages in some sub–sectors, such as at graduate entry–level in engineering. The 2013 study, which contained projections out to 2020 under different economic growth scenarios, similarly concluded that although there were no STEM skills shortages in the UK workforce as a whole, certain regions and sectors regions suffered from skills gaps that held back growth.34
The argument that specific high–tech industries are significant employers of STEM occupations has been made even more strongly in the US, as we discuss in Section 3 in more detail.
11 THE GEOGRAPHY OF THE UK’S CREATIVE AND HIGH-TECH ECONOMIES
A distinct group of industries
An alternative approach has been to directly identify a set of industries as ‘high–tech’. For example, KPMG’s 2013 analysis of the location and changes in the UK’s ‘tech economy’ defined technology industries by the following SIC codes, allowing their economic contribution to be estimated in the same way that DCMS does with the creative industries:
• Software publishing (SIC 582).
• Computer programming, consultancy and related activities (SIC 620).
• Data processing, hosting and related activities; web portals (SIC 631).
• Manufacture of computer, electronic and optical products (SIC 26).
• Manufacture of electrical equipment (SIC 27).
BIS’s (2012) research paper on UK industrial strategy36 assessed which high–tech sectors would in the future make the largest contribution to UK economic growth and employment. The report referred to high–tech in the context of ‘high–medium tech manufacturing’, though which industries codes were taken to make up this measure, and their current economic contribution to employment and value added, were not provided.37
Having reviewed the UK context for defining the creative and high–tech economies, the next two sections outline the key features of the Dynamic Mapping methodology and the data sources for our analysis. The two subsequent sections present quantitative estimates of the size, growth and geography of the UK’s creative and high–tech economies.
12 THE GEOGRAPHY OF THE UK’S CREATIVE AND HIGH-TECH ECONOMIES
3 DYNAMIC MAPPING METHODOLOGY
The Dynamic Mapping methodology as originally applied to classify the creative economy consists of three stages.38 First, a set of occupations are identified as creative. Second, the workforce intensity of these occupations is calculated for
each industry in the economy. Third, based on the distribution of creative intensity across industries, a threshold intensity is identified, above which all industries are determined to be creative for measurement purposes and all those below are not.
Considering these stages in a little more detail:
1. Choice of occupation In the first stage, all occupations in the UK workforce – as represented by Standard Occupational Classification (SOC) codes39 describing the nature of a job – are subjectively assessed on their creativity against five criteria.40, 41 A set of creative occupations is identified on this basis.
2. Calculation of intensity In the second stage, for every industry – as defined by a set of Standard Industrial Classification (SICs) codes – the intensity i.e. the proportion of the industry’s workforce employed in the selected occupations in the first stage is calculated. For example, SIC code 5912, the ‘Motion Picture, video and television programme post–production activities’ industry employed 12,000 people in 2012 (rounded to the nearest 1,000), of whom 8,000 were working in creative occupations. Accordingly, its creative intensity calculated from these rounded figures, is 8,000/12,000 = 67 per cent in that year.
3. Partitioning the industry according to an intensity threshold In the third stage, the distribution of creative occupation intensity is examined across all industries and a threshold intensity selected which is used to partition industries into two groups.
In Dynamic Mapping, the creative intensity threshold was selected by an intuitive equiprobabilistic criterion. That is, it was selected to be the intensity at which it was, on the best available estimate of the population parameters (based on the latest published DCMS estimates at the time of publication), equally likely that a creative industry would be wrongly rejected as not creative (a false negative) as would a non–creative industry be wrongly selected as being creative (a false positive). Appendix 4 contains further discussion of the issues raised in determining the threshold intensity in this report.
The set of occupations and industries generated by this analysis defines the employment in the ‘economy’ of interest. In the case of the creative economy, this consists of a combination of three types of employment:
1. Specialists: those working in creative occupations in creative industries.
2. Non–specialists: those working in a creative industry, but who are not themselves employed in a creative occupation.
3. Embedded: those working in creative occupations outside creative industries.
This has previously been described as the ‘Creative Trident’ (Higgs et al., 2005, Higgs et al., 2008).
In the present study, we ask if the same approach can be used to study the relation between the occupations and industries commonly considered part of the ‘high–tech’ economy. We begin by considering, in more depth, the appropriate group of occupations, starting from occupations commonly labelled as STEM occupations.

13 THE GEOGRAPHY OF THE UK’S CREATIVE AND HIGH-TECH ECONOMIES
The connection between STEM intensity and high–tech industries has been studied quite extensively in the US. In 2004, the US Bureau of Labor Statistics (BLS) conducted an inter–agency seminar in which participants concluded that the Bureau should explore the whole range of factors contributing to the high–tech nature of an industry, including:
• A high proportion of scientists, engineers, and technicians (science, engineering, and technician occupation intensity).
• A high proportion of R&D employment (R&D employment intensity).
• Production of high–tech products, as specified on a Census Bureau list of advanced–technology products.
• Use of high–tech production methods, including heavy use of high–tech capital goods and services in the production process.
Following this, the BLS (Hecker, 2005) produced a classification of high–tech industries based on their intensity of high–tech employment.42 High–tech industries were defined as those where the proportion of employment in the industry was at least twice the average (mean) of US industries as a whole. This classification was subsequently used by, among other studies, the Bay Area Council Economic Institute in their 2012 report on high–tech employment and wages in the United States.43
Similarly, Echeverri–Carroll and Ayala, in their 2009 study of the effects of high–tech industry agglomerations on wages, classified as high–tech those manufacturing and service industries whose proportion of so–called ‘technology orientated workers’ was twice the national average or at least 6 per cent of their workforce.44
While not using the language of ‘high–tech’, a much quoted study from the Brookings Institution (Rothwell 2013), uses an approach similar to Dynamic Mapping, by using the O*NET database (Occupational Information Network Data Collection Program) which contains information from extensive surveys of workers to classify occupations on the extent of their (in this case) STEM knowledge content.45
The report defines STEM occupations according to whether an occupation has a score at least 1.5 standard deviations from the mean for a given set of STEM–related criteria in O*NET. The resulting list of STEM occupations is then used to calculate a STEM intensity to identify industries with a particularly high use of STEM occupations, or, in other words, the high–tech industries.
In this report, we compute creative and STEM intensity for all UK industries at the 4–digit SIC level to identify, and therefore measure the economic contribution of, creative and high–tech industries, and the wider creative and high–tech economies they are part of.
Conceptually, it will help to fix ideas to establish a terminology that lets us discuss similarities and differences between these areas in a coherent way. If the relationship between STEM occupations and high–tech industries were the same as that between creative occupations and creative industries, then we could map ideas developed in the two areas of research as shown in Table 2.1.

14 THE GEOGRAPHY OF THE UK’S CREATIVE AND HIGH-TECH ECONOMIES
TABLE 2.1 CONCEPTUAL SEGMENTATION OF THE CREATIVE AND HIGH– TECH ECONOMIES
The next section discusses the data sources we use in the analysis, and is followed by two sections that present estimates of employment in the creative and high–tech economies.
Specialist Non–specialist Embedded Industry Total Occupation Economy (specialist + Total (specialist (Industry + non–specialist) + embedded) Embedded) OR Occupation + non–specialist
Creative Non–Creative Embedded Creative Creative Creative specialist specialist Creatives Industries Occupations Economy
STEM specialist Non–STEM Embedded High–tech STEM High–tech specialist STEM workers Industries Occupations Economy
15 THE GEOGRAPHY OF THE UK’S CREATIVE AND HIGH-TECH ECONOMIES
4 DATA SOURCES
The source for labour market data we use in this report is the Office for National Statistics’ (ONS) Annual Population Survey (APS).46 The APS consists of the core Labour Force Survey (LFS) described below and a series of booster
samples which are undertaken using a shorter questionnaire than the LFS. Currently, the quarterly Main LFS dataset contains around 120,000 individuals and the APS dataset contains around 340,000 individuals.47 The results presented in this report are calculated using the APS weighted to gross up the figures to the population level.
The LFS is a quarterly household survey covering the UK; each year, the four quarters are combined to provide an annual survey. The LFS has the following characteristics:
• It covers both employee jobs and self-employment, which includes sole traders.
• It provides data on both the occupation of a person, and the industry that employs that person.
• It is repeated regularly – the surveys are conducted quarterly, but the data is amalgamated and joined with additional, so-called ‘booster’ surveys to produce an annual result.
Sections 5 and 6 discuss the creative and high-tech economies in turn. Each section covers the classifications we adopt, and the size, recent growth (since 2011) and the regional UK geography of the sector.

16 THE GEOGRAPHY OF THE UK’S CREATIVE AND HIGH-TECH ECONOMIES
5 THE CREATIVE ECONOMY
5.1 CLASSIFYING THE CREATIVE ECONOMY
In January 2014, the DCMS adopted the Dynamic Mapping approach to identifying creative occupations and industries.48
Uncertainties in the data and classifications meant that the DCMS considered it was important to review the inclusion or exclusion of some industries with creative intensities around the threshold level. The final classification of industries therefore also drew on feedback obtained from users of the statistics through a public consultation exercise (most obviously, SIC codes for museums and libraries were included on this basis). The consultation process, which led to the agreement of the final classification, was supported by cross-industry coordination overseen by the government’s Creative Industries Council, including Nesta, the Sector Skills Councils (Creative Skillset and Creative and Cultural Skills), DCMS and a number of other industry bodies.
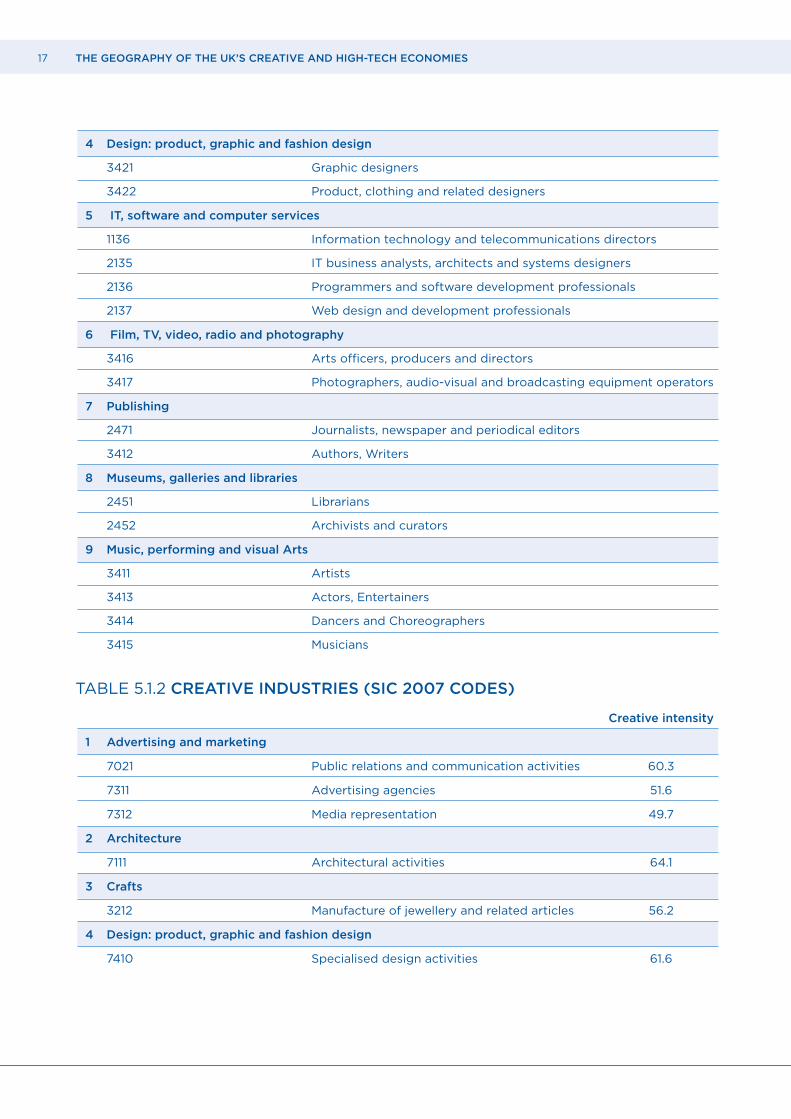
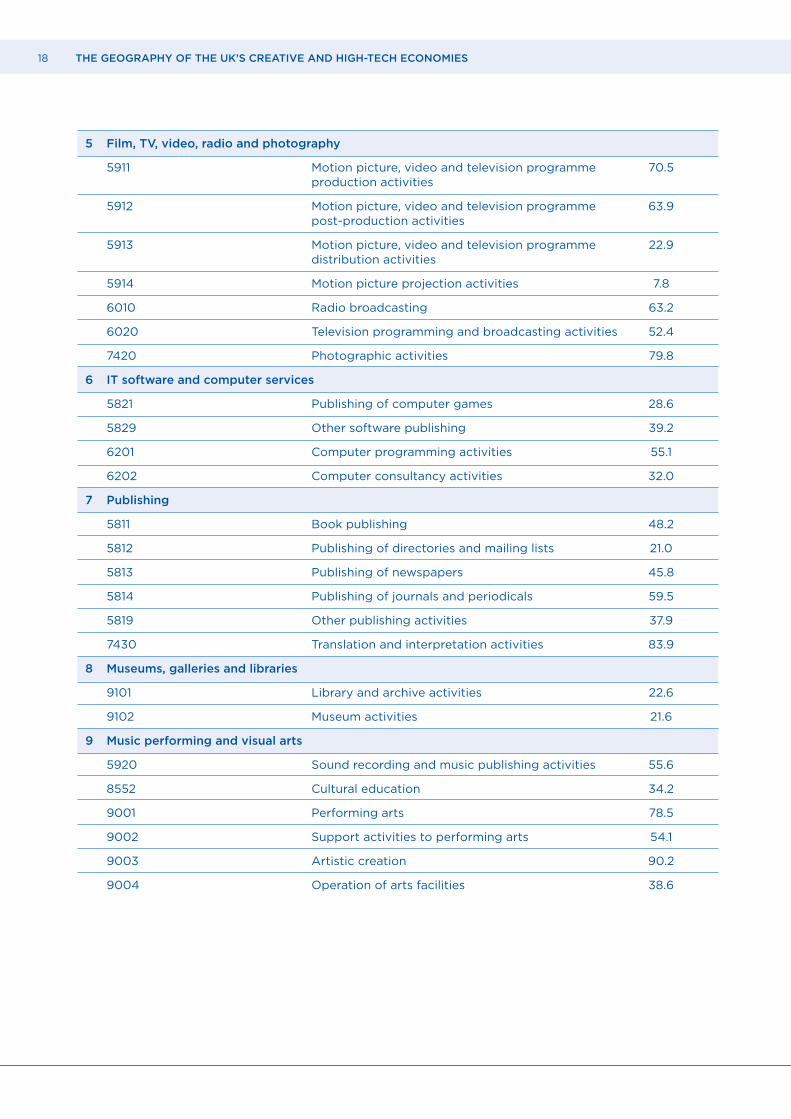
In this report, to be consistent with the resulting official creative industry statistics, we use the DCMS classifications for creative occupations and industries published in the January 2014 statistical release, even though there are some small differences with those in Dynamic Mapping. The corresponding 30 occupations and 31 industries are set out respectively in Tables 5.1.1 and 5.1.2 below, along with the creative intensities using 2013 APS data.49
TABLE 5.1.1 CREATIVE OCCUPATIONS (SOC2010 CODES)
1 Advertising and marketing
1132 Marketing and sales directors
1134 Advertising and public relations directors
2472 Public relations professionals
2473 Advertising accounts managers and creative directors
3543 Marketing associate professionals
2 Architecture
2431 Architects
2432 Town Planners
2435 Chartered architectural technologists
3121 Architectural technologists and town planning technicians
3 Crafts
5211 Smiths and forge workers
5411 Weavers and Knitters
5441 Glass and ceramics makers, decorators and finishers
5442 Furniture makers and other craft woodworkers
5449 Other skilled trades n.e.c.
17 THE GEOGRAPHY OF THE UK’S CREATIVE AND HIGH-TECH ECONOMIES
4 Design: product, graphic and fashion design
3421 Graphic designers
3422 Product, clothing and related designers
5 IT, software and computer services
1136 Information technology and telecommunications directors
2135 IT business analysts, architects and systems designers
2136 Programmers and software development professionals
2137 Web design and development professionals
6 Film, TV, video, radio and photography
3416 Arts officers, producers and directors
3417 Photographers, audio-visual and broadcasting equipment operators
7 Publishing
2471 Journalists, newspaper and periodical editors
3412 Authors, Writers
8 Museums, galleries and libraries
2451 Librarians
2452 Archivists and curators
9 Music, performing and visual Arts
3411 Artists
3413 Actors, Entertainers
3414 Dancers and Choreographers
3415 Musicians
Creative intensity
1 Advertising and marketing
7021 Public relations and communication activities 60.3
7311 Advertising agencies 51.6
7312 Media representation 49.7
2 Architecture
7111 Architectural activities 64.1
3 Crafts
3212 Manufacture of jewellery and related articles 56.2
4 Design: product, graphic and fashion design
7410 Specialised design activities 61.6
TABLE 5.1.2 CREATIVE INDUSTRIES (SIC 2007 CODES)
18 THE GEOGRAPHY OF THE UK’S CREATIVE AND HIGH-TECH ECONOMIES
5 Film, TV, video, radio and photography
5911 Motion picture, video and television programme 70.5 production activities
5912 Motion picture, video and television programme 63.9 post-production activities
5913 Motion picture, video and television programme 22.9 distribution activities
5914 Motion picture projection activities 7.8
6010 Radio broadcasting 63.2
6020 Television programming and broadcasting activities 52.4
7420 Photographic activities 79.8
6 IT software and computer services
5821 Publishing of computer games 28.6
5829 Other software publishing 39.2
6201 Computer programming activities 55.1
6202 Computer consultancy activities 32.0
7 Publishing
5811 Book publishing 48.2
5812 Publishing of directories and mailing lists 21.0
5813 Publishing of newspapers 45.8
5814 Publishing of journals and periodicals 59.5
5819 Other publishing activities 37.9
7430 Translation and interpretation activities 83.9
8 Museums, galleries and libraries
9101 Library and archive activities 22.6
9102 Museum activities 21.6
9 Music performing and visual arts
5920 Sound recording and music publishing activities 55.6
8552 Cultural education 34.2
9001 Performing arts 78.5
9002 Support activities to performing arts 54.1
9003 Artistic creation 90.2
9004 Operation of arts facilities 38.6
19 THE GEOGRAPHY OF THE UK’S CREATIVE AND HIGH-TECH ECONOMIES
5.2 THE SIZE OF THE CREATIVE ECONOMY
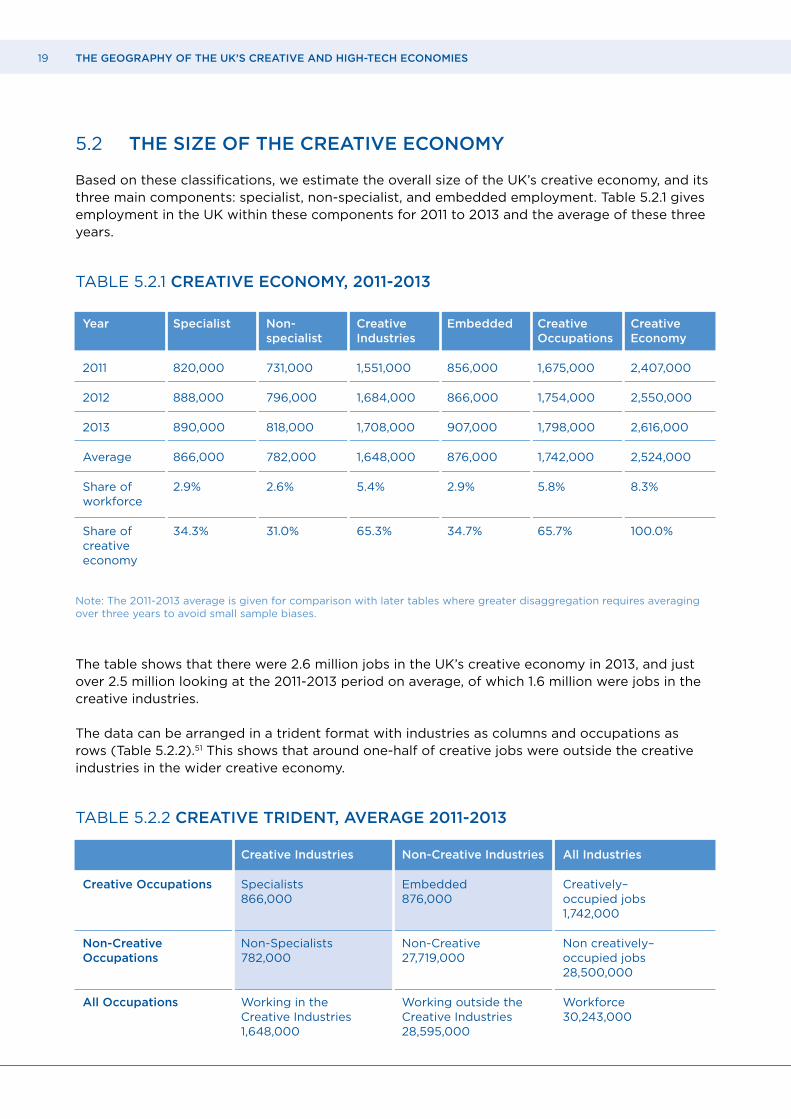
Based on these classifications, we estimate the overall size of the UK’s creative economy, and its three main components: specialist, non-specialist, and embedded employment. Table 5.2.1 gives employment in the UK within these components for 2011 to 2013 and the average of these three years.
TABLE 5.2.1 CREATIVE ECONOMY, 2011-2013
Note: The 2011-2013 average is given for comparison with later tables where greater disaggregation requires averaging over three years to avoid small sample biases.
The table shows that there were 2.6 million jobs in the UK’s creative economy in 2013, and just over 2.5 million looking at the 2011-2013 period on average, of which 1.6 million were jobs in the creative industries.
The data can be arranged in a trident format with industries as columns and occupations as rows (Table 5.2.2).51 This shows that around one-half of creative jobs were outside the creative industries in the wider creative economy.
TABLE 5.2.2 CREATIVE TRIDENT, AVERAGE 2011-2013
Year Specialist Non- Creative Embedded Creative Creative specialist Industries Occupations Economy
2011 820,000 731,000 1,551,000 856,000 1,675,000 2,407,000
2012 888,000 796,000 1,684,000 866,000 1,754,000 2,550,000
2013 890,000 818,000 1,708,000 907,000 1,798,000 2,616,000
Average 866,000 782,000 1,648,000 876,000 1,742,000 2,524,000
Share of 2.9% 2.6% 5.4% 2.9% 5.8% 8.3% workforce
Share of 34.3% 31.0% 65.3% 34.7% 65.7% 100.0% creative economy
Creative Industries Non-Creative Industries All Industries
Creative Occupations Specialists Embedded Creatively– 866,000 876,000 occupied jobs 1,742,000
Non-Creative Non-Specialists Non-Creative Non creatively– Occupations 782,000 27,719,000 occupied jobs 28,500,000
All Occupations Working in the Working outside the Workforce Creative Industries Creative Industries 30,243,000 1,648,000 28,595,000
20 THE GEOGRAPHY OF THE UK’S CREATIVE AND HIGH-TECH ECONOMIES
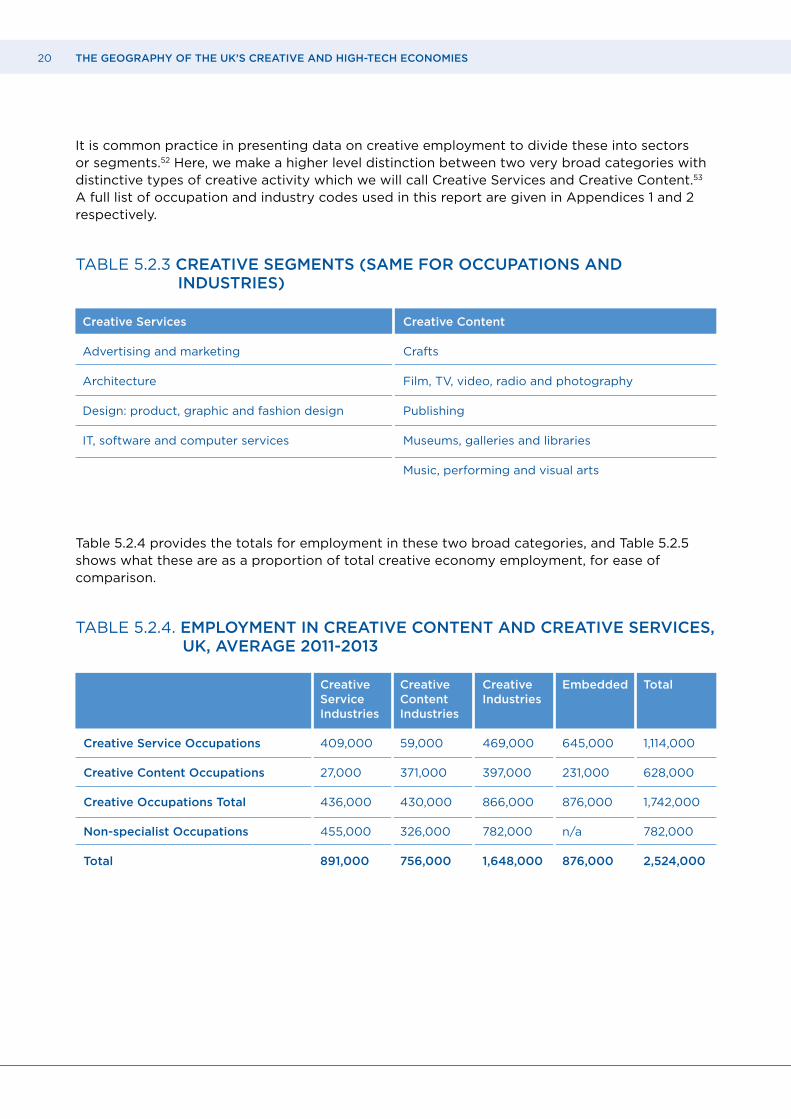
It is common practice in presenting data on creative employment to divide these into sectors or segments.52 Here, we make a higher level distinction between two very broad categories with distinctive types of creative activity which we will call Creative Services and Creative Content.53 A full list of occupation and industry codes used in this report are given in Appendices 1 and 2 respectively.
TABLE 5.2.3 CREATIVE SEGMENTS (SAME FOR OCCUPATIONS AND INDUSTRIES)
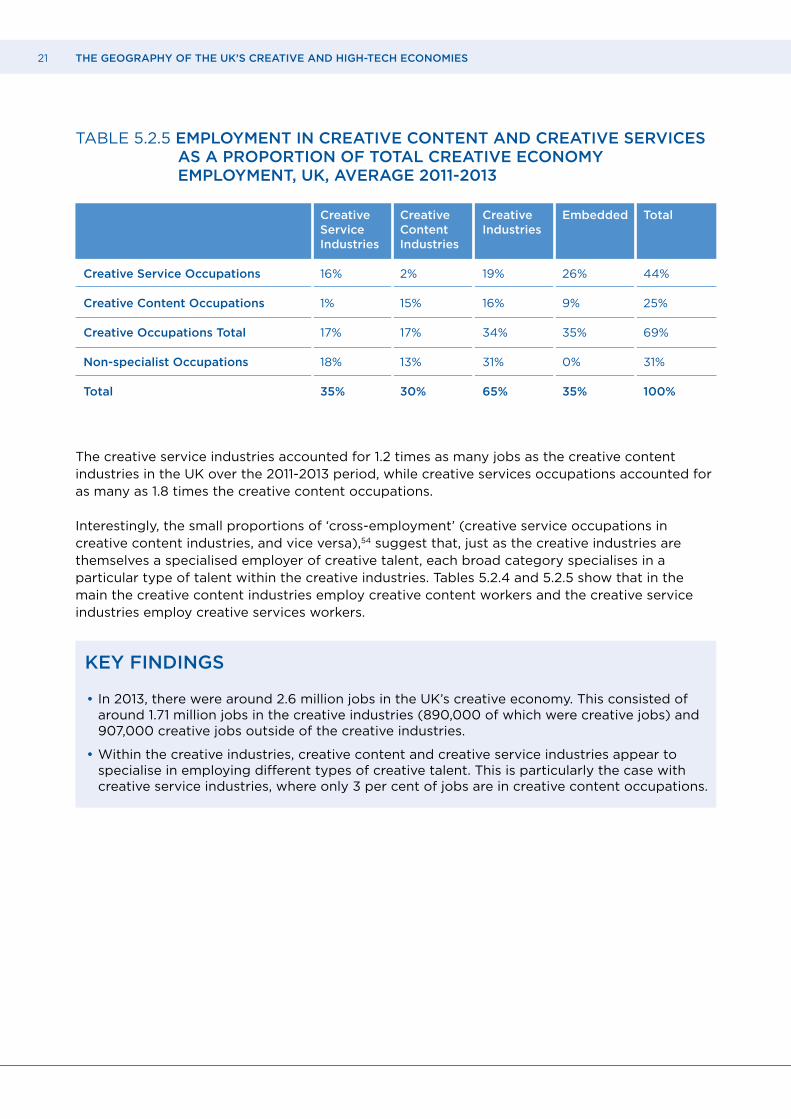
Table 5.2.4 provides the totals for employment in these two broad categories, and Table 5.2.5 shows what these are as a proportion of total creative economy employment, for ease of comparison.
TABLE 5.2.4. EMPLOYMENT IN CREATIVE CONTENT AND CREATIVE SERVICES, UK, AVERAGE 2011-2013
Creative Services Creative Content
Advertising and marketing Crafts
Architecture Film, TV, video, radio and photography
Design: product, graphic and fashion design Publishing
IT, software and computer services Museums, galleries and libraries
Music, performing and visual arts
Creative Creative Creative Embedded Total Service Content Industries Industries Industries
Creative Service Occupations 409,000 59,000 469,000 645,000 1,114,000
Creative Content Occupations 27,000 371,000 397,000 231,000 628,000
Creative Occupations Total 436,000 430,000 866,000 876,000 1,742,000
Non-specialist Occupations 455,000 326,000 782,000 n/a 782,000
Total 891,000 756,000 1,648,000 876,000 2,524,000
21 THE GEOGRAPHY OF THE UK’S CREATIVE AND HIGH-TECH ECONOMIES
TABLE 5.2.5 EMPLOYMENT IN CREATIVE CONTENT AND CREATIVE SERVICES AS A PROPORTION OF TOTAL CREATIVE ECONOMY EMPLOYMENT, UK, AVERAGE 2011-2013
The creative service industries accounted for 1.2 times as many jobs as the creative content industries in the UK over the 2011-2013 period, while creative services occupations accounted for as many as 1.8 times the creative content occupations.
Interestingly, the small proportions of ‘cross-employment’ (creative service occupations in creative content industries, and vice versa),54 suggest that, just as the creative industries are themselves a specialised employer of creative talent, each broad category specialises in a particular type of talent within the creative industries. Tables 5.2.4 and 5.2.5 show that in the main the creative content industries employ creative content workers and the creative service industries employ creative services workers.
KEY FINDINGS
• In 2013, there were around 2.6 million jobs in the UK’s creative economy. This consisted of around 1.71 million jobs in the creative industries (890,000 of which were creative jobs) and 907,000 creative jobs outside of the creative industries.
• Within the creative industries, creative content and creative service industries appear to specialise in employing different types of creative talent. This is particularly the case with creative service industries, where only 3 per cent of jobs are in creative content occupations.
Creative Creative Creative Embedded Total Service Content Industries Industries Industries
Creative Service Occupations 16% 2% 19% 26% 44%
Creative Content Occupations 1% 15% 16% 9% 25%
Creative Occupations Total 17% 17% 34% 35% 69%
Non-specialist Occupations 18% 13% 31% 0% 31%
Total 35% 30% 65% 35% 100%
22 THE GEOGRAPHY OF THE UK’S CREATIVE AND HIGH-TECH ECONOMIES
5.3 GROWTH OF THE CREATIVE ECONOMY
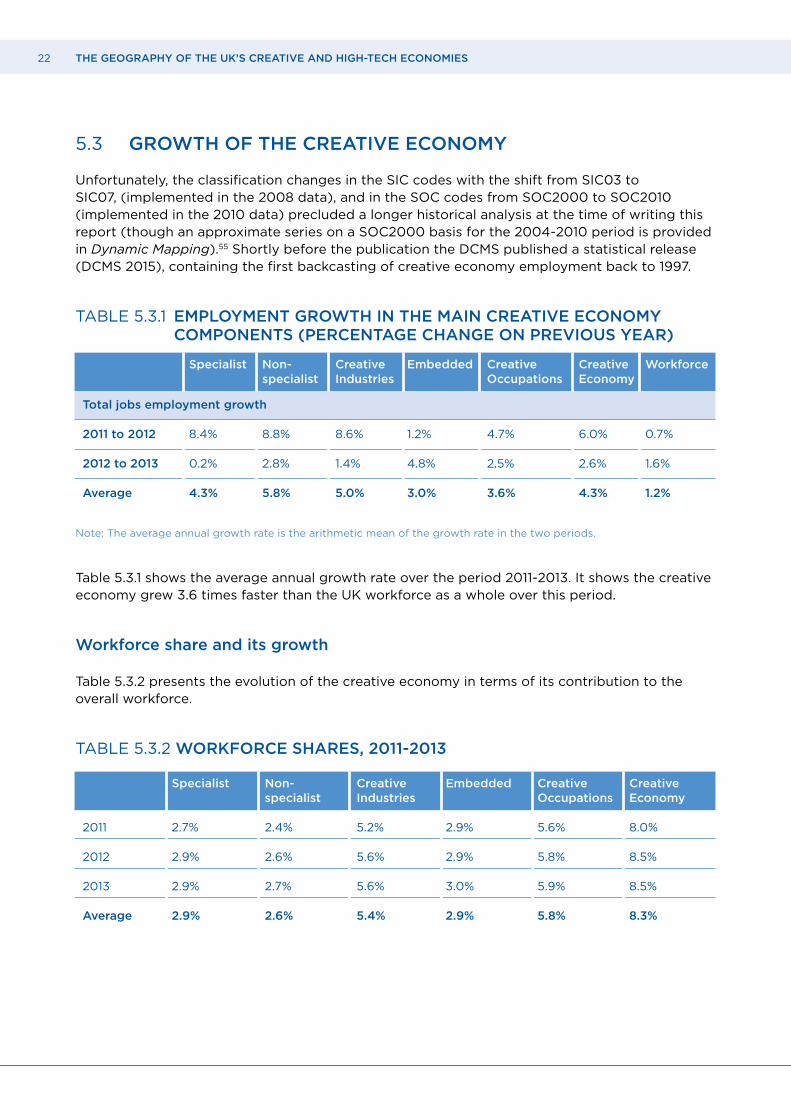
Unfortunately, the classification changes in the SIC codes with the shift from SIC03 to SIC07, (implemented in the 2008 data), and in the SOC codes from SOC2000 to SOC2010 (implemented in the 2010 data) precluded a longer historical analysis at the time of writing this report (though an approximate series on a SOC2000 basis for the 2004-2010 period is provided in Dynamic Mapping).55 Shortly before the publication the DCMS published a statistical release (DCMS 2015), containing the first backcasting of creative economy employment back to 1997.
TABLE 5.3.1 EMPLOYMENT GROWTH IN THE MAIN CREATIVE ECONOMY COMPONENTS (PERCENTAGE CHANGE ON PREVIOUS YEAR)
Note: The average annual growth rate is the arithmetic mean of the growth rate in the two periods.
Table 5.3.1 shows the average annual growth rate over the period 2011-2013. It shows the creative economy grew 3.6 times faster than the UK workforce as a whole over this period.
Workforce share and its growth
Table 5.3.2 presents the evolution of the creative economy in terms of its contribution to the overall workforce.
TABLE 5.3.2 WORKFORCE SHARES, 2011-2013
Specialist Non- Creative Embedded Creative Creative Workforce specialist Industries Occupations Economy
Total jobs employment growth
2011 to 2012 8.4% 8.8% 8.6% 1.2% 4.7% 6.0% 0.7%
2012 to 2013 0.2% 2.8% 1.4% 4.8% 2.5% 2.6% 1.6%
Average 4.3% 5.8% 5.0% 3.0% 3.6% 4.3% 1.2%
Specialist Non- Creative Embedded Creative Creative specialist Industries Occupations Economy
2011 2.7% 2.4% 5.2% 2.9% 5.6% 8.0%
2012 2.9% 2.6% 5.6% 2.9% 5.8% 8.5%
2013 2.9% 2.7% 5.6% 3.0% 5.9% 8.5%
Average 2.9% 2.6% 5.4% 2.9% 5.8% 8.3%

23 THE GEOGRAPHY OF THE UK’S CREATIVE AND HIGH-TECH ECONOMIES
KEY FINDINGS
• Employment in the creative economy grew over three times faster than the workforce as a whole between 2011 and 2013, at 4.3 per cent p.a. on average.
• As a result, the creative economy’s contribution to the overall workforce increased from 8.0 per cent to 8.5 per cent between 2011 and 2013.
5.4 REGIONAL GEOGRAPHY OF THE UK’S CREATIVE ECONOMY
Table 5.4.1 presents the size of the different components of the creative economy and the workforce as a whole for the UK’s regions and Devolved National Administrations (DNAs),56 reported as the average of 2011 to 2013 to minimise fluctuations related to sample survey biases. These appear in descending order of the size of their creative economies’ employment.
TABLE 5.4.1 CREATIVE ECONOMY EMPLOYMENT IN THE REGIONS AND DNAS, UK, AVERAGE 2011-2013
Note: There are a small number of people in the survey sample that count towards the UK totals in this and subsequent tables, but are not allocated to any region.
Specialist Non- Creative Embedded Creative Creative Workforce specialist Industries Occupations Economy
London 261,000 183,000 444,000 168,000 429,000 613,000 3,945,000
South East 148,000 155,000 303,000 164,000 312,000 467,000 4,374,000
Eastern 84,000 81,000 165,000 86,000 170,000 251,000 2,980,000
South West 69,000 59,000 128,000 73,000 143,000 201,000 2,645,000
North West 62,000 64,000 126,000 74,000 135,000 199,000 3,217,000
Scotland 53,000 51,000 105,000 59,000 113,000 164,000 2,554,000
West 41,000 49,000 91,000 67,000 108,000 157,000 2,481,000 Midlands
Yorkshire and 49,000 41,000 90,000 60,000 109,000 150,000 2,511,000 Humberside
East 38,000 47,000 85,000 59,000 97,000 144,000 2,187,000 Midlands
Wales 25,000 23,000 48,000 29,000 54,000 78,000 1,369,000
North East 18,000 18,000 36,000 21,000 39,000 57,000 1,168,000
Northern 17,000 10,000 27,000 16,000 33,000 43,000 814,000 Ireland
UK 866,000 782,000 1,648,000 876,000 1,742,000 2,524,000 30,243,000

24 THE GEOGRAPHY OF THE UK’S CREATIVE AND HIGH-TECH ECONOMIES
Figure 5.4.1 shows the regional/DNA distribution of the creative economy workforce, London and the South East account for a very significant share of creative economy employment, as noted previously in Freeman (2010). Together London and the South East of England region account for 43 per cent of employment in the creative economy in the UK.
FIGURE 5.4.1 THE REGIONAL/DNA DISTRIBUTION OF THE CREATIVE ECONOMY WORKFORCE, UK, AVERAGE, 2011-2013
Table 5.4.2 presents the different components of the creative economy as shares of the regional workforce. The particular importance of the creative economy to London’s economy is apparent in this table. The creative economy’s share of London’s workforce – at 15.5 per cent – is almost double the national figure. Creative occupations in creative industries are also a higher proportion of the creative economy than in other regions, at 43 per cent (=6.6/15.5), a point consistent with earlier findings.57
TABLE 5.4.2 WORKFORCE SHARES OF THE COMPONENTS OF THE CREATIVE
North East
North West
Yorkshire and Humberside
East Midlands
West Midlands
Eastern
London
South East
South West
Wales
Scotland
Northern Ireland
2% 2%
6%
6%
6%
10%
24%
19%
8%
3%
6% 8%
Specialist Non- Creative Embedded Creative Creative specialist Industries Occupations Economy
London 6.6% 4.6% 11.3% 4.3% 10.9% 15.5%
South East 3.4% 3.5% 6.9% 3.8% 7.1% 10.7%
Eastern 2.8% 2.7% 5.5% 2.9% 5.7% 8.4%
South West 2.6% 2.2% 4.8% 2.8% 5.4% 7.6%
East 1.8% 2.1% 3.9% 2.7% 4.5% 6.6% Midlands
25 THE GEOGRAPHY OF THE UK’S CREATIVE AND HIGH-TECH ECONOMIES
Scotland 2.1% 2.0% 4.1% 2.3% 4.4% 6.4%
West 1.7% 2.0% 3.7% 2.7% 4.4% 6.3% Midlands
North West 1.9% 2.0% 3.9% 2.3% 4.2% 6.2%
Yorkshire and 1.9% 1.6% 3.6% 2.4% 4.3% 6.0% Humberside
Wales 1.8% 1.7% 3.5% 2.1% 4.0% 5.7%
Northern 2.1% 1.2% 3.3% 2.0% 4.1% 5.3% Ireland
North East 1.5% 1.5% 3.1% 1.8% 3.4% 4.9%
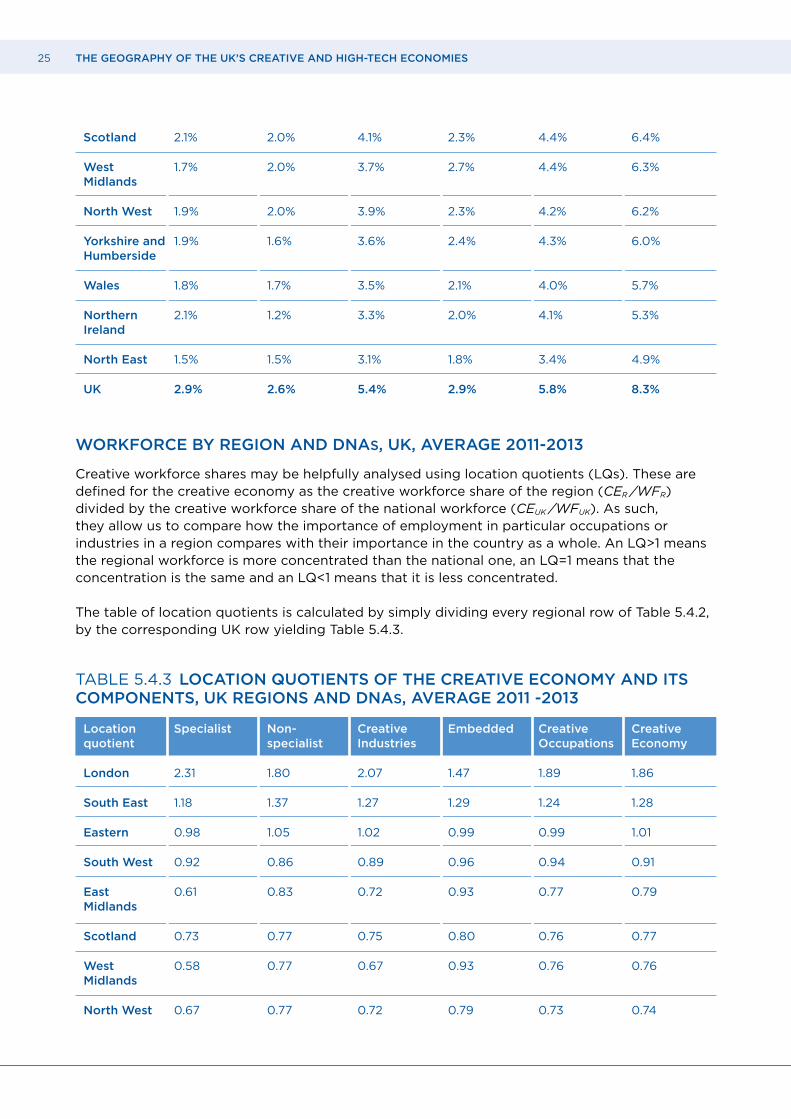
UK 2.9% 2.6% 5.4% 2.9% 5.8% 8.3%
WORKFORCE BY REGION AND DNAS, UK, AVERAGE 2011-2013
Creative workforce shares may be helpfully analysed using location quotients (LQs). These are defined for the creative economy as the creative workforce share of the region (CER ⁄WFR) divided by the creative workforce share of the national workforce (CEUK ⁄WFUK). As such, they allow us to compare how the importance of employment in particular occupations or industries in a region compares with their importance in the country as a whole. An LQ>1 means the regional workforce is more concentrated than the national one, an LQ=1 means that the concentration is the same and an LQ<1 means that it is less concentrated.
The table of location quotients is calculated by simply dividing every regional row of Table 5.4.2, by the corresponding UK row yielding Table 5.4.3.
TABLE 5.4.3 LOCATION QUOTIENTS OF THE CREATIVE ECONOMY AND ITS COMPONENTS, UK REGIONS AND DNAS, AVERAGE 2011 -2013
Location Specialist Non- Creative Embedded Creative Creative quotient specialist Industries Occupations Economy
London 2.31 1.80 2.07 1.47 1.89 1.86
South East 1.18 1.37 1.27 1.29 1.24 1.28
Eastern 0.98 1.05 1.02 0.99 0.99 1.01
South West 0.92 0.86 0.89 0.96 0.94 0.91
East 0.61 0.83 0.72 0.93 0.77 0.79 Midlands
Scotland 0.73 0.77 0.75 0.80 0.76 0.77
West 0.58 0.77 0.67 0.93 0.76 0.76 Midlands
North West 0.67 0.77 0.72 0.79 0.73 0.74
26 THE GEOGRAPHY OF THE UK’S CREATIVE AND HIGH-TECH ECONOMIES
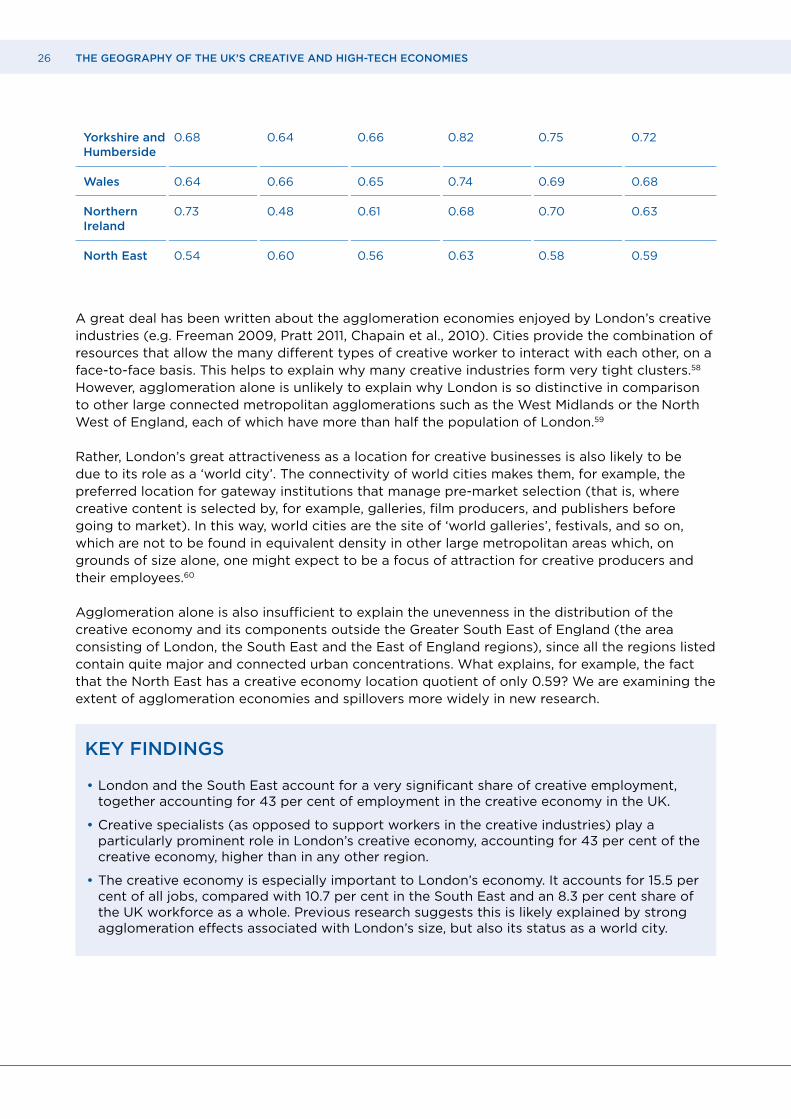
Yorkshire and 0.68 0.64 0.66 0.82 0.75 0.72 Humberside
Wales 0.64 0.66 0.65 0.74 0.69 0.68
Northern 0.73 0.48 0.61 0.68 0.70 0.63 Ireland
North East 0.54 0.60 0.56 0.63 0.58 0.59
A great deal has been written about the agglomeration economies enjoyed by London’s creative industries (e.g. Freeman 2009, Pratt 2011, Chapain et al., 2010). Cities provide the combination of resources that allow the many different types of creative worker to interact with each other, on a face-to-face basis. This helps to explain why many creative industries form very tight clusters.58 However, agglomeration alone is unlikely to explain why London is so distinctive in comparison to other large connected metropolitan agglomerations such as the West Midlands or the North West of England, each of which have more than half the population of London.59
Rather, London’s great attractiveness as a location for creative businesses is also likely to be due to its role as a ‘world city’. The connectivity of world cities makes them, for example, the preferred location for gateway institutions that manage pre-market selection (that is, where creative content is selected by, for example, galleries, film producers, and publishers before going to market). In this way, world cities are the site of ‘world galleries’, festivals, and so on, which are not to be found in equivalent density in other large metropolitan areas which, on grounds of size alone, one might expect to be a focus of attraction for creative producers and their employees.60
Agglomeration alone is also insufficient to explain the unevenness in the distribution of the creative economy and its components outside the Greater South East of England (the area consisting of London, the South East and the East of England regions), since all the regions listed contain quite major and connected urban concentrations. What explains, for example, the fact that the North East has a creative economy location quotient of only 0.59? We are examining the extent of agglomeration economies and spillovers more widely in new research.
KEY FINDINGS
• London and the South East account for a very significant share of creative employment, together accounting for 43 per cent of employment in the creative economy in the UK.
• Creative specialists (as opposed to support workers in the creative industries) play a particularly prominent role in London’s creative economy, accounting for 43 per cent of the creative economy, higher than in any other region.
• The creative economy is especially important to London’s economy. It accounts for 15.5 per cent of all jobs, compared with 10.7 per cent in the South East and an 8.3 per cent share of the UK workforce as a whole. Previous research suggests this is likely explained by strong agglomeration effects associated with London’s size, but also its status as a world city.

27 THE GEOGRAPHY OF THE UK’S CREATIVE AND HIGH-TECH ECONOMIES
Where is the creative economy growing?
Table 5.4.4 shows the annual average growth rates for employment in different components of the creative economy from 2011 to 2013, by region and DNA in the UK.
TABLE 5.4.4 PERCENTAGE ANNUAL EMPLOYMENT GROWTH IN THE CREATIVE ECONOMY IN THE MAJOR REGIONS/DNAS, UK, AVERAGE 2011-2013
These tables show that the fastest growing parts of the UK’s creative economy over this period have been the East of England, the West Midlands and the North East of England. With the exception of Scotland, which has experienced a negative growth rate on average in its creative economy over this period, London has been the slowest growing region.
KEY FINDINGS
• Since 2011 London’s creative economy workforce has been growing more slowly than most of the rest of the UK. The creative economy has been growing particularly rapidly in the East of England, West Midlands and North East of England.
Having analysed the size, growth and regional geography of the creative economy we present equivalent results for the high-tech economy.
Specialist Non– Embedded Creative Creative Creative Workforce Specialist Occupations Industries Economy
Eastern 9.0% 14.0% 5.6% 7.2% 11.5% 9.3% 1.5%
West 12.1% 11.5% 3.9% 6.8% 11.8% 8.2% 1.8% Midlands
North East 6.5% 13.3% -0.9% 2.4% 9.8% 5.6% 0.8%
Yorkshire and 15.4% 3.5% -0.5% 6.3% 9.7% 5.5% 1.6% Humberside
South East 5.6% 6.1% 2.3% 3.8% 5.8% 4.5% 1.5%
East 17.8% 8.5% -5.1% 2.6% 12.4% 4.5% 0.5% Midlands
South West 9.6% 1.8% 0.6% 4.8% 5.9% 3.9% 0.9%
North West 4.0% 1.8% 5.7% 4.9% 2.8% 3.9% 0.3%
Wales 8.9% 5.7% -2.8% 2.4% 7.4% 3.3% 1.7%
Northern -10.0% 1.0% 23.5% 3.7% -6.2% 3.1% 0.3% Ireland
London -1.9% 5.7% 8.2% 1.8% 1.0% 2.9% 2.0%
Scotland -0.6% -1.1% -1.3% -1.0% -0.8% -1.0% 0.2%
UK 4.3% 5.8% 3.0% 3.6% 5.0% 4.3% 1.2%
28 THE GEOGRAPHY OF THE UK’S CREATIVE AND HIGH-TECH ECONOMIES
6 THE HIGH-TECH ECONOMY
In this section, we define the high-tech economy in terms of a set of high-tech industries and STEM occupations embedded in the wider economy, and from this derive estimates of its size, growth since 2011 and regional geography.
6.1 DEFINING THE HIGH–TECH ECONOMY
In our approach we propose a baseline classification for STEM occupations based on a review of pre-existing treatments of STEM work. We compare the industries selected as STEM-intensive – or ‘high-tech’ – at different intensity thresholds with a classification of high-tech industries produced by the EU’s statistical agency, Eurostat, based on R&D and knowledge intensity, and use this analysis to derive a classification that we use in this report.
6.1.1 Definition of STEM occupations in the literature
As discussed in Section 3, the concept of STEM has its origins in concerns that the qualifications of the workforce, and in particular, the supply of STEM-qualified graduates, do not match the needs of industry. There have been perennial complaints that the UK economy is not producing enough high-quality STEM graduates. There has, however, been remarkably little attempt to build a consensus on what constitutes a STEM occupation.
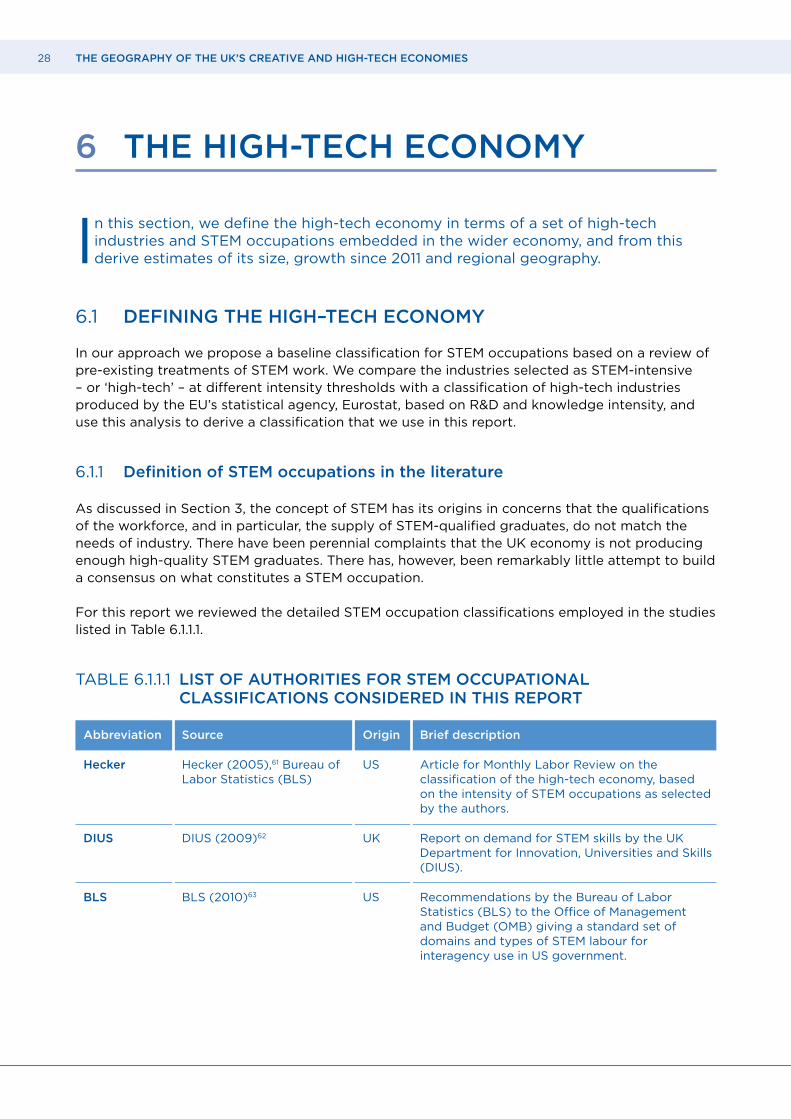
For this report we reviewed the detailed STEM occupation classifications employed in the studies listed in Table 6.1.1.1.
TABLE 6.1.1.1 LIST OF AUTHORITIES FOR STEM OCCUPATIONAL CLASSIFICATIONS CONSIDERED IN THIS REPORT
Abbreviation Source Origin Brief description
Hecker Hecker (2005),61 Bureau of US Article for Monthly Labor Review on the Labor Statistics (BLS) classification of the high-tech economy, based on the intensity of STEM occupations as selected by the authors.
DIUS DIUS (2009)62 UK Report on demand for STEM skills by the UK Department for Innovation, Universities and Skills (DIUS).
BLS BLS (2010)63 US Recommendations by the Bureau of Labor Statistics (BLS) to the Office of Management and Budget (OMB) giving a standard set of domains and types of STEM labour for interagency use in US government.

29 THE GEOGRAPHY OF THE UK’S CREATIVE AND HIGH-TECH ECONOMIES
RAE Greenwood et al., (2011)64 UK Report prepared by the Institute of Education on the market value of STEM occupations produced for the Royal Academy of Engineering.
Brookings Rothwell (2013)65 US Independent report on ‘the hidden STEM economy’ prepared for the Brookings Institution.
Note: In cases where the classifications are given in terms of the North American codes of the NAICS system, we have converted them to the nearest SOC2010 equivalents.66
According to the broadest classification we consider, that of the BLS (2010), it turns out that there are over four million STEM jobs in the UK. The narrowest, derived from Hecker, yields less than half this number, as shown in Table 6.1.1.2. The full list of occupations treated as STEM according to different accounts is given in Appendix 1, Table A1-4.
TABLE 6.1.1.2 OCCUPATIONAL EMPLOYMENT TOTALS (1000S) ACCORDING TO DIFFERENT DEFINITIONS OF STEM OCCUPATIONS, WORKFORCE JOBS, UK, AVERAGE 2011-2013
This table confirms that the considerable variation in how STEM occupations are classified has a significant effect on the number of jobs that are estimated to be in STEM occupations.
In the next section we undertake an analysis of STEM intensity according to these different STEM classifications, to determine whether a distinct set of high-tech industries can be identified that have an especially high percentage of STEM workers in their workforces.
6.1.2 How the distribution of STEM intensity is affected by different definitions of STEM occupations
To examine STEM intensity as a means of selecting a group of high-tech industries, we first construct the frequency distributions shown in Figure 6.1.2.1 for the set of STEM classifications given in Table 6.1.1.2. Each chart shows the distribution of STEM intensity for different classifications.
BLS Brookings RAE DIUS Hecker (BLS) Workforce
STEM 4,552,000 4,436,000 3,030,000 2,474,000 2,088,000 30,243,000 Employment

30 THE GEOGRAPHY OF THE UK’S CREATIVE AND HIGH-TECH ECONOMIES
FIGURE 6.1.2.1 FREQUENCY DISTRIBUTION OF EMPLOYMENT BY STEM INTENSITY, ACCORDING TO VARIOUS CLASSIFICATIONS OF STEM OCCUPATIONS (AVERAGE OF 2011-2013)
Note: The tables underlying these charts may be found in Appendix 3
DIUS800
600
400
200
0
Hecker800
600
400
200
0
RAE
STEM intensity (average 2011–2013)
Em
plo
ym
en
t 0
00
’s
800
600
400
200
0
5 10 15 20 25 30 35 40 45 50 55 60 65 70 75 80 85 90 95 100
Brookings800
600
400
200
0
31 THE GEOGRAPHY OF THE UK’S CREATIVE AND HIGH-TECH ECONOMIES
It is apparent from the chart that regardless of which of the four classifications of STEM occupations is used there is no one distinct set of industries where these occupations are uniquely unusually concentrated. This means that, unlike the case of creative intensity, we cannot use STEM intensity on its own with these definitions to identify the high-tech industries – that is, the employment of STEM occupations in the UK economy is much less specialised than is the case with creative workers.
How can we proceed? The distributions of STEM intensity above suggest that the discriminatory power of STEM intensity is perhaps greater for the narrower classifications of Hecker and RAE.
A theoretical justification for a narrower classification would be that STEM occupations constitute, in some way, one of the means by which scientific ‘knowledge’ finds its way into the processes and outputs of an enterprise or activity. Formally, we might think of them as:
roles explicitly involved in the development of new knowledge from the domains of science and engineering or in the rigorous application of existing science and engineering knowledge and processes to new circumstances.
The application of existing science and engineering knowledge and processes is necessary, but not sufficient according to this view, for an occupation to be a STEM occupation – though we accept this is a question of judgment. Routine application of engineering processes to standardised product or process should not be sufficient to be considered a STEM occupation. For this reason, occupations with high administrative or manual components – such as laboratory technicians or air-conditioning technicians are outside the scope of STEM occupations in our treatment.
Similar to creative occupations, STEM occupations involve weighing up alternatives and making decisions and choices that can significantly alter the outcome of the work. The routine following of a STEM-developed process, such as on a production line or in the installation of network cabling in an office does not in this conception make the role “STEM”. For this reason, we do not classify as STEM many technician occupations, even when they are in a STEM field. Implementing someone else’s STEM decision or checklist does not in itself, we argue, make the occupation itself STEM.
How does this view of STEM occupations compare with our treatment of creative work? We think STEM and creative occupations differ in at least two ways:
• Uniqueness Creative occupations are focussed on adding value through uniqueness – the market rewards those creators who can tap into the wants and needs of users, including businesses, with a product or service that is unique, even if only for a short time. Success in the fields of science and engineering knowledge is also initially measured through the novelty of the contribution, but subsequent to this the replicability of a result must always be established.
• Domain One of the criteria for creative occupations is that the output of the occupation is typically considered to be a creative service or product whatever the industry setting. In the case of STEM, we suggest, the range of output domains is much broader – from construction (material sciences), manufacturing (robotics), to agriculture (pesticides research and chemical engineering) and financial services (big data modelling).
By reviewing the set of STEM classifications used to generate the distributions in Figure 6.1.1 and applying the principles above, we propose a pragmatic set of STEM occupations, shown in Table 6.1.2.1 (described as ‘baseline’ to acknowledge the reality that classifying individual occupations as STEM or not STEM – or indeed creative or non-creative – is inherently fuzzy).
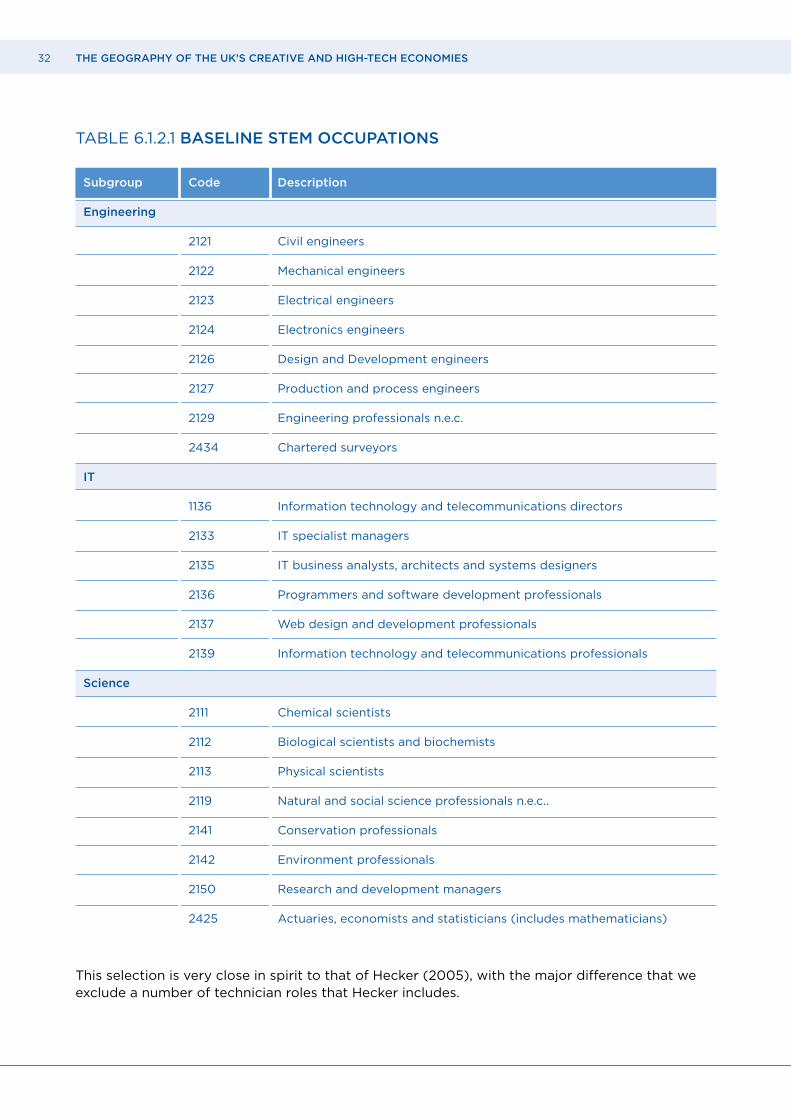
32 THE GEOGRAPHY OF THE UK’S CREATIVE AND HIGH-TECH ECONOMIES
TABLE 6.1.2.1 BASELINE STEM OCCUPATIONS
This selection is very close in spirit to that of Hecker (2005), with the major difference that we exclude a number of technician roles that Hecker includes.
Subgroup Code Description
Engineering
2121 Civil engineers
2122 Mechanical engineers
2123 Electrical engineers
2124 Electronics engineers
2126 Design and Development engineers
2127 Production and process engineers
2129 Engineering professionals n.e.c.
2434 Chartered surveyors
IT
1136 Information technology and telecommunications directors
2133 IT specialist managers
2135 IT business analysts, architects and systems designers
2136 Programmers and software development professionals
2137 Web design and development professionals
2139 Information technology and telecommunications professionals
Science
2111 Chemical scientists
2112 Biological scientists and biochemists
2113 Physical scientists
2119 Natural and social science professionals n.e.c..
2141 Conservation professionals
2142 Environment professionals
2150 Research and development managers
2425 Actuaries, economists and statisticians (includes mathematicians)
33 THE GEOGRAPHY OF THE UK’S CREATIVE AND HIGH-TECH ECONOMIES
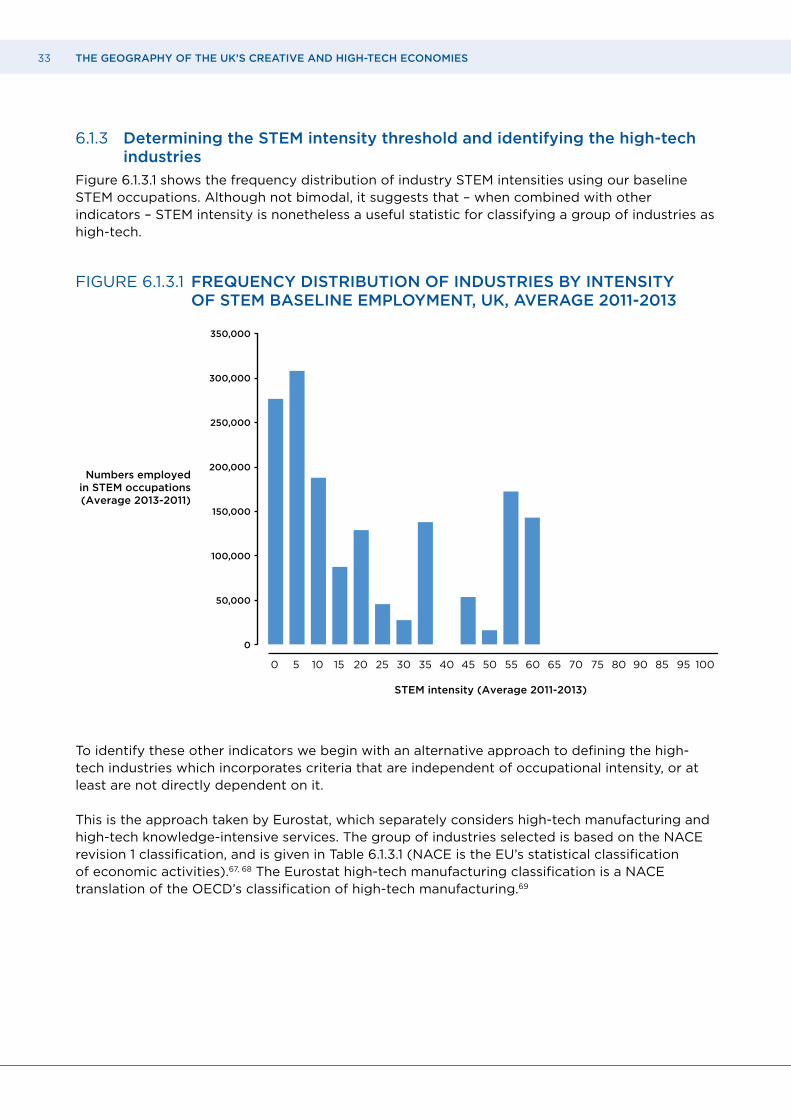
6.1.3 Determining the STEM intensity threshold and identifying the high-tech industries
Figure 6.1.3.1 shows the frequency distribution of industry STEM intensities using our baseline STEM occupations. Although not bimodal, it suggests that – when combined with other indicators – STEM intensity is nonetheless a useful statistic for classifying a group of industries as high-tech.
FIGURE 6.1.3.1 FREQUENCY DISTRIBUTION OF INDUSTRIES BY INTENSITY OF STEM BASELINE EMPLOYMENT, UK, AVERAGE 2011-2013
To identify these other indicators we begin with an alternative approach to defining the high-tech industries which incorporates criteria that are independent of occupational intensity, or at least are not directly dependent on it.
This is the approach taken by Eurostat, which separately considers high-tech manufacturing and high-tech knowledge-intensive services. The group of industries selected is based on the NACE revision 1 classification, and is given in Table 6.1.3.1 (NACE is the EU’s statistical classification of economic activities).67, 68 The Eurostat high-tech manufacturing classification is a NACE translation of the OECD’s classification of high-tech manufacturing.69
350,000
250,000
300,000
200,000
150,000
100,000
50,000
0
STEM intensity (Average 2011-2013)
Numbers employedin STEM occupations(Average 2013-2011)
0 5 10 15 20 25 30 35 40 45 50 55 60 65 70 75 80 8590 95 100
34 THE GEOGRAPHY OF THE UK’S CREATIVE AND HIGH-TECH ECONOMIES
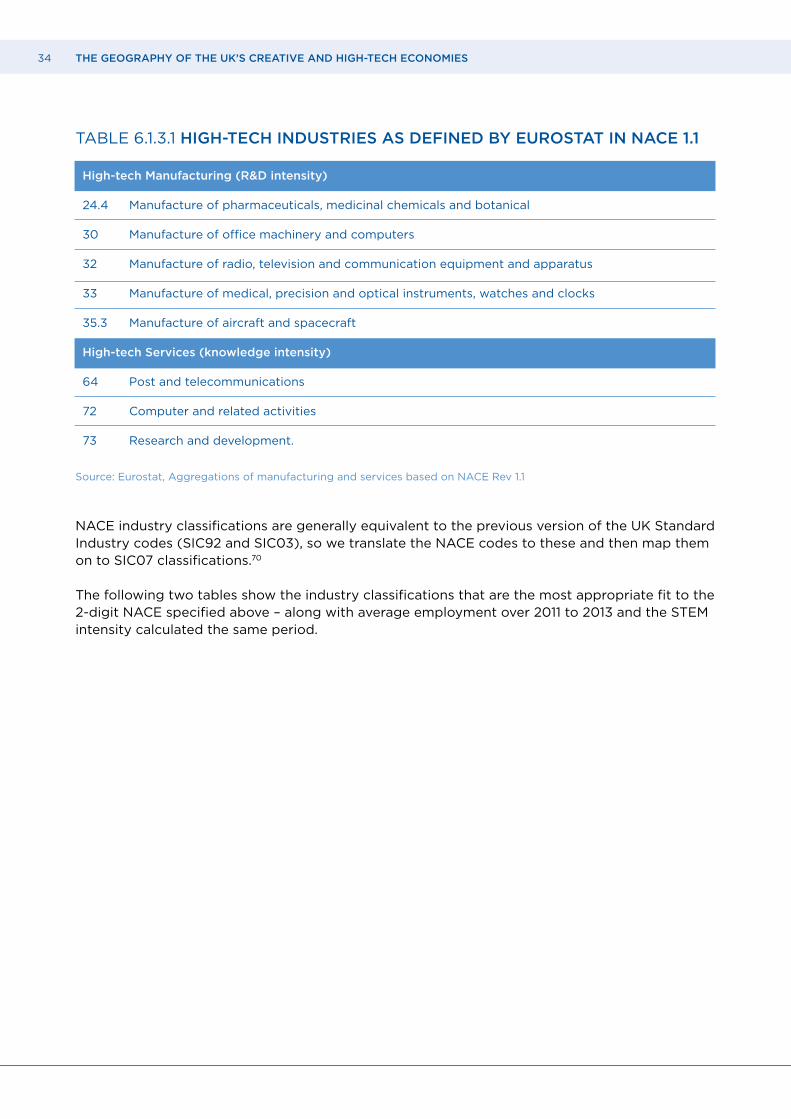
TABLE 6.1.3.1 HIGH-TECH INDUSTRIES AS DEFINED BY EUROSTAT IN NACE 1.1
Source: Eurostat, Aggregations of manufacturing and services based on NACE Rev 1.1
NACE industry classifications are generally equivalent to the previous version of the UK Standard Industry codes (SIC92 and SIC03), so we translate the NACE codes to these and then map them on to SIC07 classifications.70
The following two tables show the industry classifications that are the most appropriate fit to the 2-digit NACE specified above – along with average employment over 2011 to 2013 and the STEM intensity calculated the same period.
High- tech Manufacturing (R&D intensity)
24.4 Manufacture of pharmaceuticals, medicinal chemicals and botanical
30 Manufacture of office machinery and computers
32 Manufacture of radio, television and communication equipment and apparatus
33 Manufacture of medical, precision and optical instruments, watches and clocks
35.3 Manufacture of aircraft and spacecraft
High- tech Services (knowledge intensity)
64 Post and telecommunications
72 Computer and related activities
73 Research and development.
35 THE GEOGRAPHY OF THE UK’S CREATIVE AND HIGH-TECH ECONOMIES
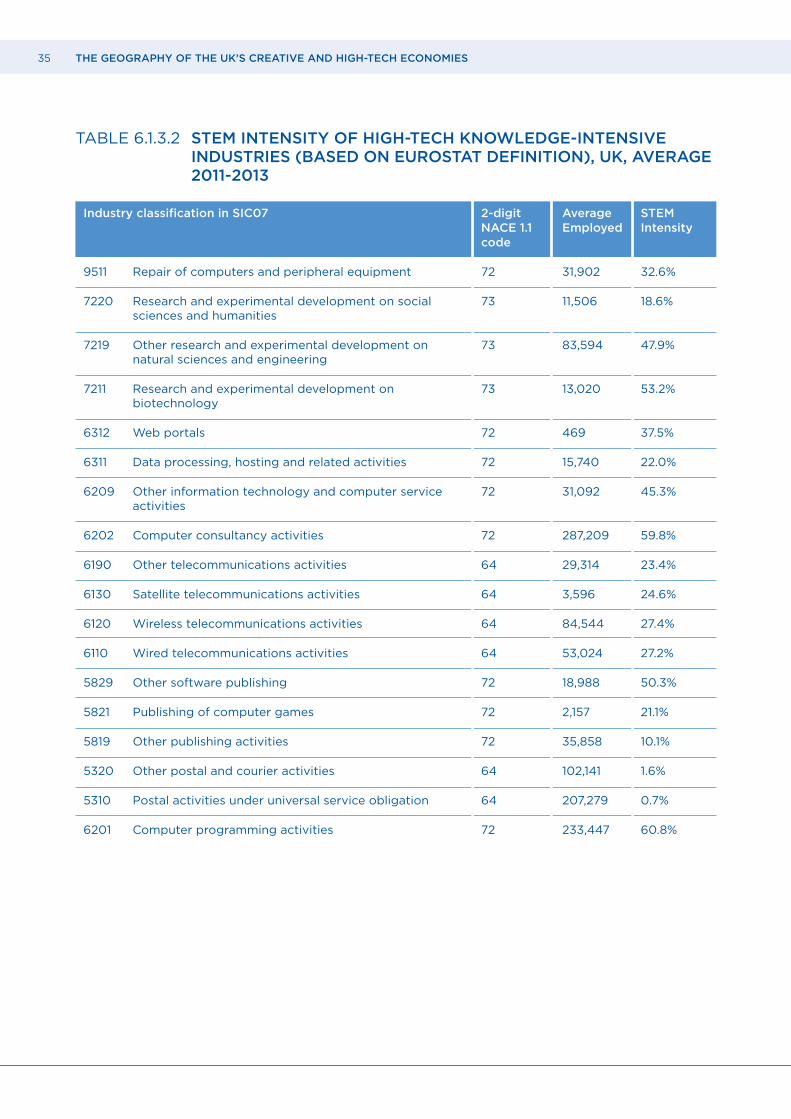
TABLE 6.1.3.2 STEM INTENSITY OF HIGH-TECH KNOWLEDGE-INTENSIVE INDUSTRIES (BASED ON EUROSTAT DEFINITION), UK, AVERAGE 2011-2013
Industry classification in SIC07 2- digit Average STEM NACE 1.1 Employed Intensity code
9511 Repair of computers and peripheral equipment 72 31,902 32.6%
7220 Research and experimental development on social 73 11,506 18.6% sciences and humanities
7219 Other research and experimental development on 73 83,594 47.9% natural sciences and engineering
7211 Research and experimental development on 73 13,020 53.2% biotechnology
6312 Web portals 72 469 37.5%
6311 Data processing, hosting and related activities 72 15,740 22.0%
6209 Other information technology and computer service 72 31,092 45.3% activities
6202 Computer consultancy activities 72 287,209 59.8%
6190 Other telecommunications activities 64 29,314 23.4%
6130 Satellite telecommunications activities 64 3,596 24.6%
6120 Wireless telecommunications activities 64 84,544 27.4%
6110 Wired telecommunications activities 64 53,024 27.2%
5829 Other software publishing 72 18,988 50.3%
5821 Publishing of computer games 72 2,157 21.1%
5819 Other publishing activities 72 35,858 10.1%
5320 Other postal and courier activities 64 102,141 1.6%
5310 Postal activities under universal service obligation 64 207,279 0.7%
6201 Computer programming activities 72 233,447 60.8%
36 THE GEOGRAPHY OF THE UK’S CREATIVE AND HIGH-TECH ECONOMIES
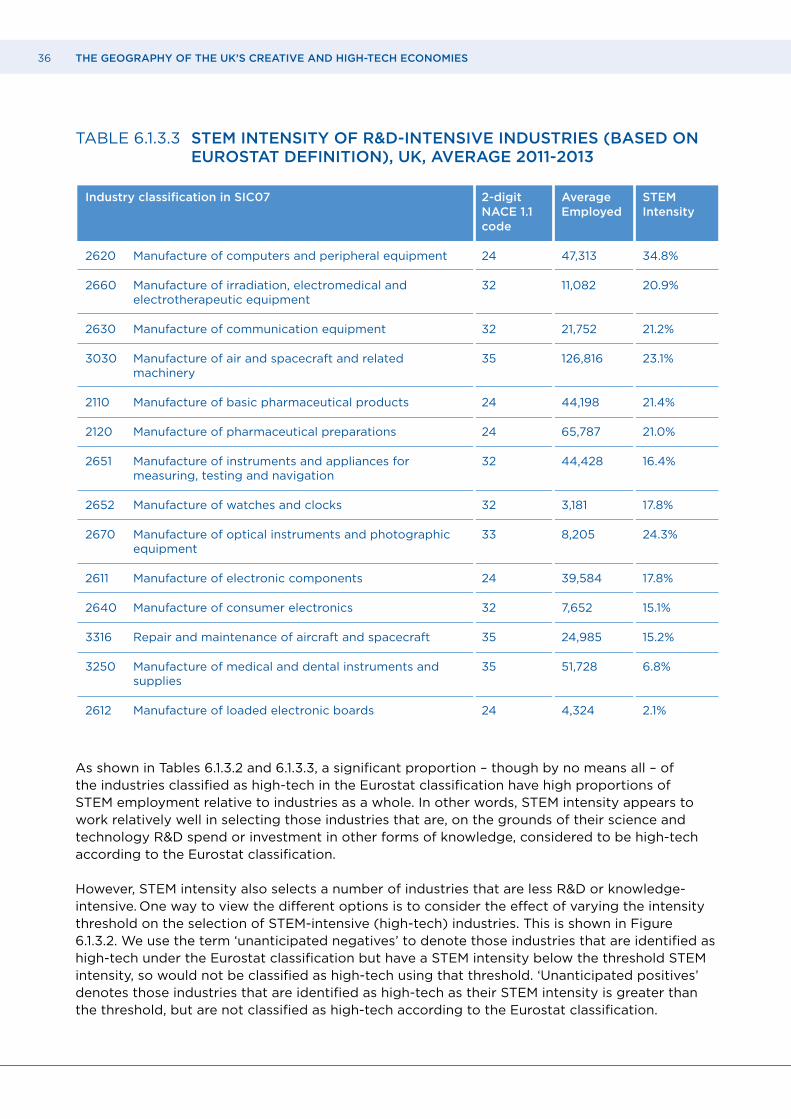
TABLE 6.1.3.3 STEM INTENSITY OF R&D-INTENSIVE INDUSTRIES (BASED ON EUROSTAT DEFINITION), UK, AVERAGE 2011-2013
As shown in Tables 6.1.3.2 and 6.1.3.3, a significant proportion – though by no means all – of the industries classified as high-tech in the Eurostat classification have high proportions of STEM employment relative to industries as a whole. In other words, STEM intensity appears to work relatively well in selecting those industries that are, on the grounds of their science and technology R&D spend or investment in other forms of knowledge, considered to be high-tech according to the Eurostat classification.
However, STEM intensity also selects a number of industries that are less R&D or knowledge-intensive. One way to view the different options is to consider the effect of varying the intensity threshold on the selection of STEM-intensive (high-tech) industries. This is shown in Figure 6.1.3.2. We use the term ‘unanticipated negatives’ to denote those industries that are identified as high-tech under the Eurostat classification but have a STEM intensity below the threshold STEM intensity, so would not be classified as high-tech using that threshold. ‘Unanticipated positives’ denotes those industries that are identified as high-tech as their STEM intensity is greater than the threshold, but are not classified as high-tech according to the Eurostat classification.
Industry classification in SIC07 2- digit Average STEM NACE 1.1 Employed Intensity code
2620 Manufacture of computers and peripheral equipment 24 47,313 34.8%
2660 Manufacture of irradiation, electromedical and 32 11,082 20.9% electrotherapeutic equipment
2630 Manufacture of communication equipment 32 21,752 21.2%
3030 Manufacture of air and spacecraft and related 35 126,816 23.1% machinery
2110 Manufacture of basic pharmaceutical products 24 44,198 21.4%
2120 Manufacture of pharmaceutical preparations 24 65,787 21.0%
2651 Manufacture of instruments and appliances for 32 44,428 16.4% measuring, testing and navigation
2652 Manufacture of watches and clocks 32 3,181 17.8%
2670 Manufacture of optical instruments and photographic 33 8,205 24.3% equipment
2611 Manufacture of electronic components 24 39,584 17.8%
2640 Manufacture of consumer electronics 32 7,652 15.1%
3316 Repair and maintenance of aircraft and spacecraft 35 24,985 15.2%
3250 Manufacture of medical and dental instruments and 35 51,728 6.8% supplies
2612 Manufacture of loaded electronic boards 24 4,324 2.1%
37 THE GEOGRAPHY OF THE UK’S CREATIVE AND HIGH-TECH ECONOMIES
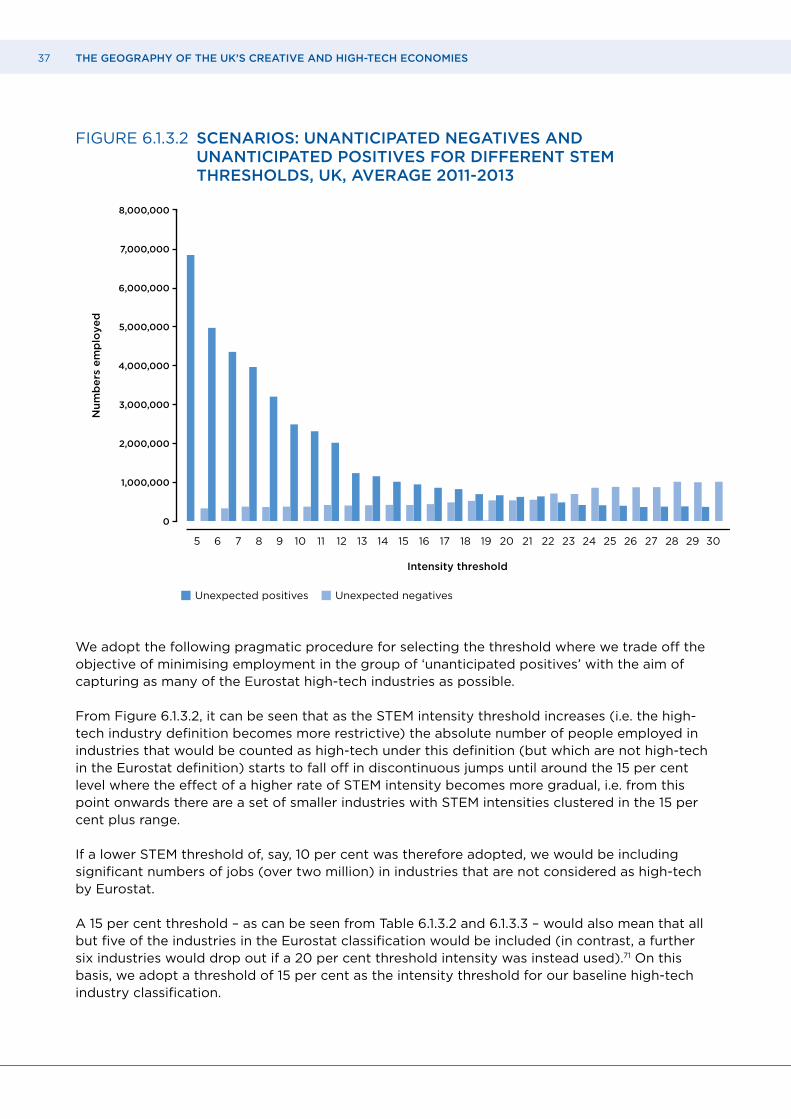
FIGURE 6.1.3.2 SCENARIOS: UNANTICIPATED NEGATIVES AND UNANTICIPATED POSITIVES FOR DIFFERENT STEM THRESHOLDS, UK, AVERAGE 2011-2013
We adopt the following pragmatic procedure for selecting the threshold where we trade off the objective of minimising employment in the group of ‘unanticipated positives’ with the aim of capturing as many of the Eurostat high-tech industries as possible.
From Figure 6.1.3.2, it can be seen that as the STEM intensity threshold increases (i.e. the high-tech industry definition becomes more restrictive) the absolute number of people employed in industries that would be counted as high-tech under this definition (but which are not high-tech in the Eurostat definition) starts to fall off in discontinuous jumps until around the 15 per cent level where the effect of a higher rate of STEM intensity becomes more gradual, i.e. from this point onwards there are a set of smaller industries with STEM intensities clustered in the 15 per cent plus range.
If a lower STEM threshold of, say, 10 per cent was therefore adopted, we would be including significant numbers of jobs (over two million) in industries that are not considered as high-tech by Eurostat.
A 15 per cent threshold – as can be seen from Table 6.1.3.2 and 6.1.3.3 – would also mean that all but five of the industries in the Eurostat classification would be included (in contrast, a further six industries would drop out if a 20 per cent threshold intensity was instead used).71 On this basis, we adopt a threshold of 15 per cent as the intensity threshold for our baseline high-tech industry classification.
8,000,000
7,000,000
6,000,000
5,000,000
4,000,000
3,000,000
2,000,000
1,000,000
0
5 6 7 8 9 10 11 12 13 14 15 16 17 18
Intensity threshold
19 20 21 22 23
Nu
mb
ers
em
plo
ye
d
24 25 26 27 28 29 30
Unexpected positives Unexpected negatives

38 THE GEOGRAPHY OF THE UK’S CREATIVE AND HIGH-TECH ECONOMIES
As with the treatment of creative industries (and described in detail in Dynamic Mapping), following the application of the threshold intensity we remove those industry codes for which the APS sample size is too small to be statistically reliable (a threshold of 4,000 was used for this). This results in a baseline high-tech industrial classification, shown in the Table 6.1.3.4 below.
TABLE 6.1.3.4 HIGH-TECH INDUSTRIES (EMPLOYMENT AND STEM INTENSITY)
SIC07 Average Average intensity employment percentage (2011-2013) (2011-2013)
610 Extraction of crude petroleum 26.73 16,820
910 Support activities for petroleum and natural gas 22.99 62,370 extraction
1820 Reproduction of recorded media 22.33 7,317
1920 Manufacture of refined petroleum products 19.79 29,777
2013 Manufacture of other inorganic basic chemicals 17.59 15,517
2059 Manufacture of other chemical products n.e.c. 17.29 8,797
2110 Manufacture of basic pharmaceutical products 21.41 44,198
2120 Manufacture of pharmaceutical preparations 21.04 65,787
2452 Casting of steel 21.51 5,210
2611 Manufacture of electronic components 17.85 39,584
2620 Manufacture of computers and peripheral equipment 34.83 47,313
2630 Manufacture of communication equipment 21.16 21,752
2640 Manufacture of consumer electronics 15.08 7,652
2651 Manufacture of instruments and appliances for 16.37 44,428 measuring, testing and navigation
2660 Manufacture of irradiation, electromedical and 20.89 11,082 electrotherapeutic equipment
2670 Manufacture of optical instruments and 24.29 8,205 photographic equipment
2752 Manufacture of non-electric domestic appliances 22.49 4,924
2811 Manufacture of engines and turbines, except aircraft, 15.14 28,511 vehicle and cycle engines
2894 Manufacture of machinery for textile, apparel and leather 15.07 5,073 production
3030 Manufacture of air and spacecraft and related machinery 23.10 126,816

39 THE GEOGRAPHY OF THE UK’S CREATIVE AND HIGH-TECH ECONOMIES
3316 Repair and maintenance of aircraft and spacecraft 15.23 24,985
3511 Production of electricity 22.03 67,345
4221 Construction of utility projects for fluids 16.73 16,540
4222 Construction of utility projects for electricity and 16.41 4299 telecommunications
4299 Construction of other civil engineering projects n.e.c. 18.74 146,532
4920 Freight rail transport 15.45 7,558
4950 Transport via pipeline 19.67 5,738
5829 Other software publishing 50.35 18,988
6110 Wired telecommunications activities 27.20 53,024
6120 Wireless telecommunications activities 27.36 84,544
6190 Other telecommunications activities 23.43 29,314
6201 Computer programming activities 60.79 233,447
6202 Computer consultancy activities 59.85 287,209
6203 Computer facilities management activities 37.00 9,140
6209 Other information technology and computer service 45.31 31,092 activities
6311 Data processing, hosting and related activities 22.00 15,740
6520 Reinsurance 15.49 13,170
6629 Other activities auxiliary to insurance and pension 25.79 11,966 funding
7112 Engineering activities and related technical consultancy 37.61 354,048
7120 Technical testing and analysis 16.96 48,399
7211 Research and experimental development on 53.24 13,020 biotechnology
7219 Other research and experimental development on 47.91 83,594 natural sciences and engineering
7220 Research and experimental development on social 18.61 11,506 sciences and humanities
7490 Other professional, scientific and technical activities n.e.c. 23.85 73,316
9104 Botanical and zoological gardens and nature reserve 20.11 12,387 activities
9511 Repair of computers and peripheral equipment 32.63 31,902
9512 Repair of communication equipment 16.09 7,520
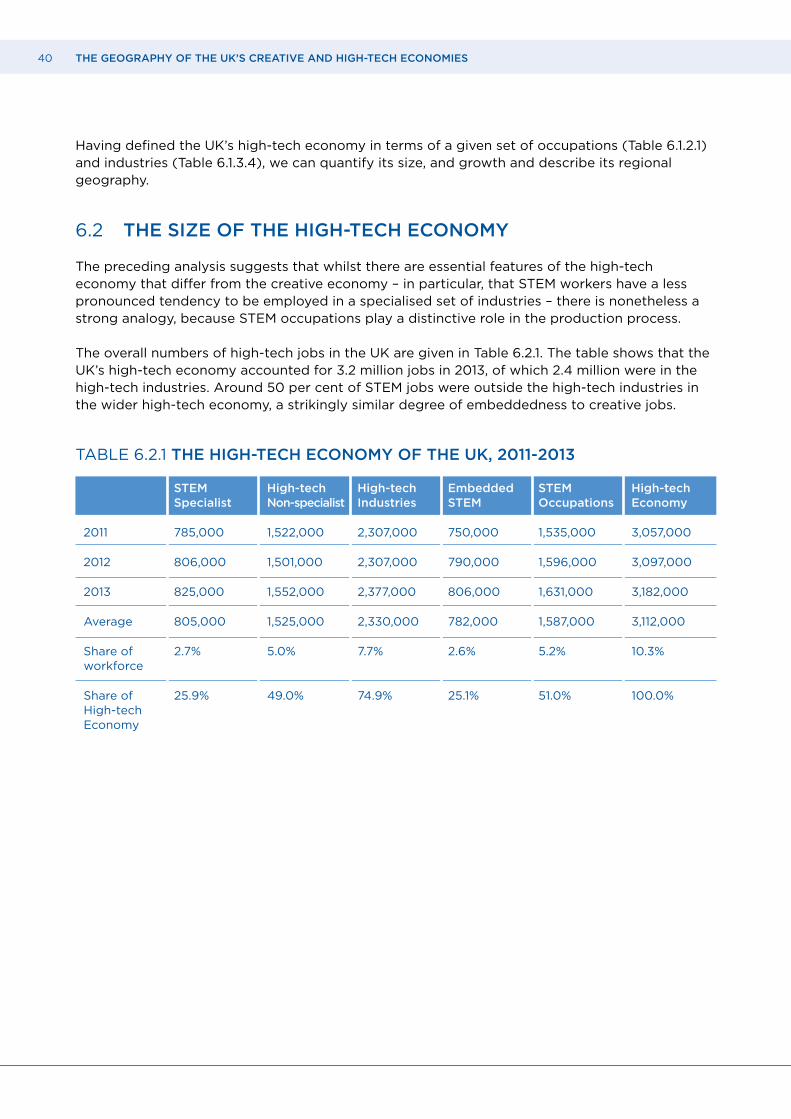
40 THE GEOGRAPHY OF THE UK’S CREATIVE AND HIGH-TECH ECONOMIES
Having defined the UK’s high-tech economy in terms of a given set of occupations (Table 6.1.2.1) and industries (Table 6.1.3.4), we can quantify its size, and growth and describe its regional geography.
6.2 THE SIZE OF THE HIGH-TECH ECONOMY
The preceding analysis suggests that whilst there are essential features of the high-tech economy that differ from the creative economy – in particular, that STEM workers have a less pronounced tendency to be employed in a specialised set of industries – there is nonetheless a strong analogy, because STEM occupations play a distinctive role in the production process.
The overall numbers of high-tech jobs in the UK are given in Table 6.2.1. The table shows that the UK’s high-tech economy accounted for 3.2 million jobs in 2013, of which 2.4 million were in the high-tech industries. Around 50 per cent of STEM jobs were outside the high-tech industries in the wider high-tech economy, a strikingly similar degree of embeddedness to creative jobs.
TABLE 6.2.1 THE HIGH-TECH ECONOMY OF THE UK, 2011-2013
STEM High-tech High-tech Embedded STEM High-tech Specialist Non-specialist Industries STEM Occupations Economy
2011 785,000 1,522,000 2,307,000 750,000 1,535,000 3,057,000
2012 806,000 1,501,000 2,307,000 790,000 1,596,000 3,097,000
2013 825,000 1,552,000 2,377,000 806,000 1,631,000 3,182,000
Average 805,000 1,525,000 2,330,000 782,000 1,587,000 3,112,000
Share of 2.7% 5.0% 7.7% 2.6% 5.2% 10.3% workforce
Share of 25.9% 49.0% 74.9% 25.1% 51.0% 100.0% High-tech Economy
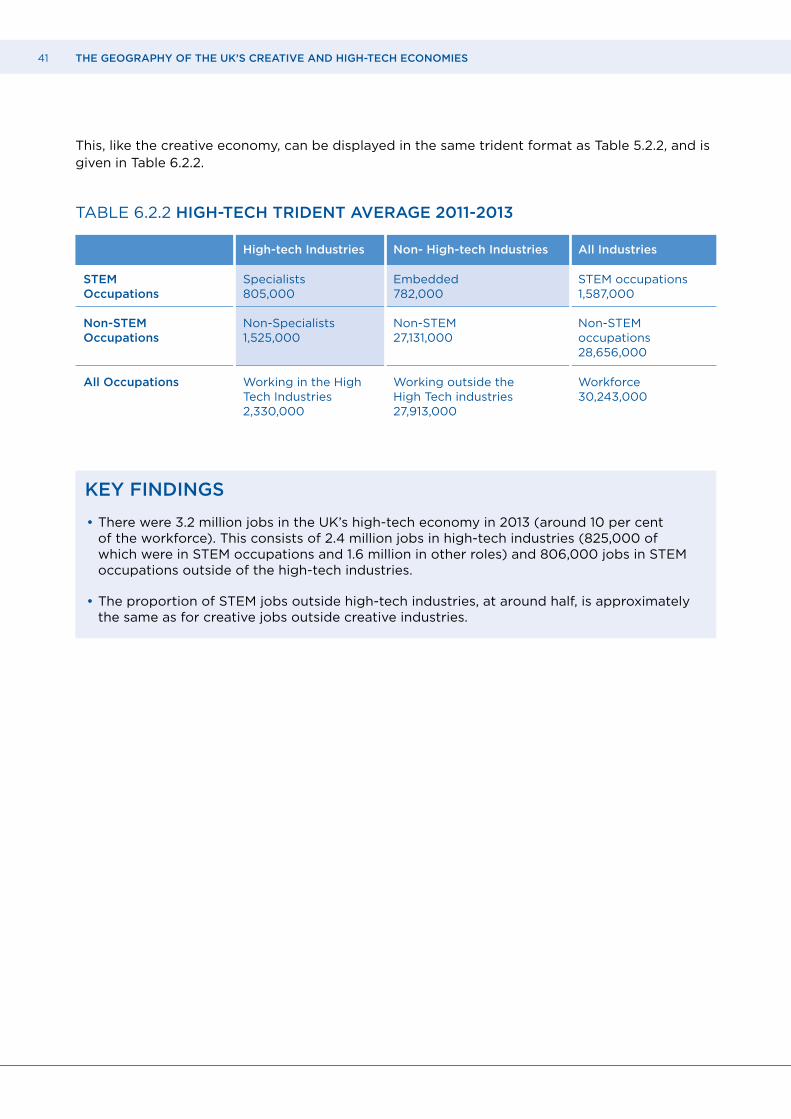
41 THE GEOGRAPHY OF THE UK’S CREATIVE AND HIGH-TECH ECONOMIES
This, like the creative economy, can be displayed in the same trident format as Table 5.2.2, and is given in Table 6.2.2.
TABLE 6.2.2 HIGH-TECH TRIDENT AVERAGE 2011-2013
KEY FINDINGS
• There were 3.2 million jobs in the UK’s high-tech economy in 2013 (around 10 per cent of the workforce). This consists of 2.4 million jobs in high-tech industries (825,000 of which were in STEM occupations and 1.6 million in other roles) and 806,000 jobs in STEM occupations outside of the high-tech industries.
• The proportion of STEM jobs outside high-tech industries, at around half, is approximately the same as for creative jobs outside creative industries.
High-tech Industries Non- High-tech Industries All Industries
STEM Specialists Embedded STEM occupations Occupations 805,000 782,000 1,587,000 Non-STEM Non-Specialists Non-STEM Non-STEM Occupations 1,525,000 27,131,000 occupations 28,656,000
All Occupations Working in the High Working outside the Workforce Tech Industries High Tech industries 30,243,000 2,330,000 27,913,000
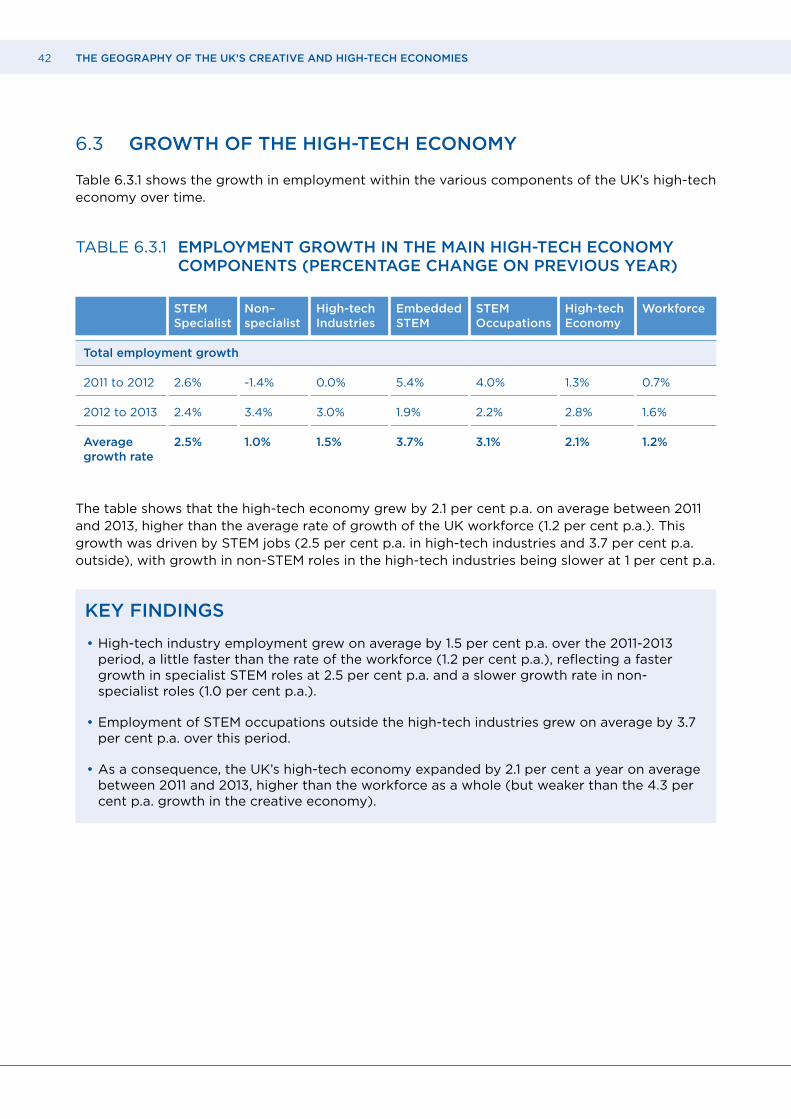
42 THE GEOGRAPHY OF THE UK’S CREATIVE AND HIGH-TECH ECONOMIES
6.3 GROWTH OF THE HIGH-TECH ECONOMY
Table 6.3.1 shows the growth in employment within the various components of the UK’s high-tech economy over time.
TABLE 6.3.1 EMPLOYMENT GROWTH IN THE MAIN HIGH-TECH ECONOMY COMPONENTS (PERCENTAGE CHANGE ON PREVIOUS YEAR)
The table shows that the high-tech economy grew by 2.1 per cent p.a. on average between 2011 and 2013, higher than the average rate of growth of the UK workforce (1.2 per cent p.a.). This growth was driven by STEM jobs (2.5 per cent p.a. in high-tech industries and 3.7 per cent p.a. outside), with growth in non-STEM roles in the high-tech industries being slower at 1 per cent p.a.
KEY FINDINGS
• High-tech industry employment grew on average by 1.5 per cent p.a. over the 2011-2013 period, a little faster than the rate of the workforce (1.2 per cent p.a.), reflecting a faster growth in specialist STEM roles at 2.5 per cent p.a. and a slower growth rate in non-specialist roles (1.0 per cent p.a.).
• Employment of STEM occupations outside the high-tech industries grew on average by 3.7 per cent p.a. over this period.
• As a consequence, the UK’s high-tech economy expanded by 2.1 per cent a year on average between 2011 and 2013, higher than the workforce as a whole (but weaker than the 4.3 per cent p.a. growth in the creative economy).
STEM Non– High-tech Embedded STEM High-tech Workforce Specialist specialist Industries STEM Occupations Economy
Total employment growth
2011 to 2012 2.6% -1.4% 0.0% 5.4% 4.0% 1.3% 0.7%
2012 to 2013 2.4% 3.4% 3.0% 1.9% 2.2% 2.8% 1.6%
Average 2.5% 1.0% 1.5% 3.7% 3.1% 2.1% 1.2% growth rate
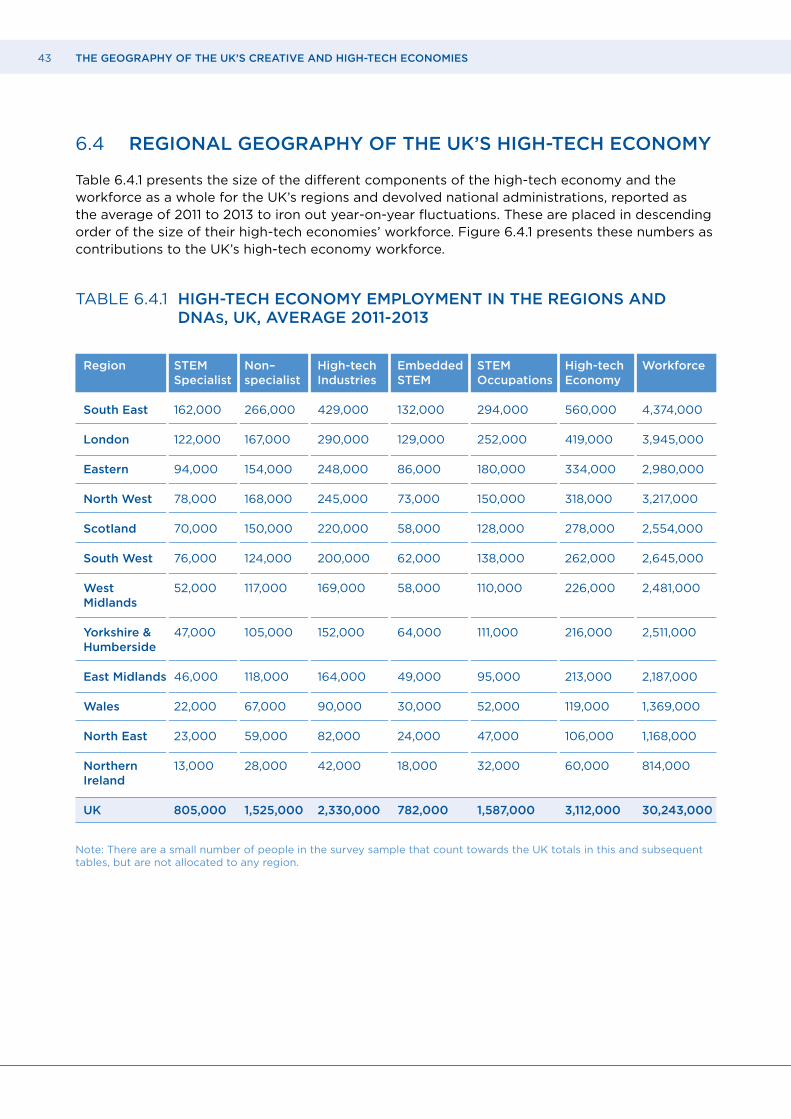
43 THE GEOGRAPHY OF THE UK’S CREATIVE AND HIGH-TECH ECONOMIES
6.4 REGIONAL GEOGRAPHY OF THE UK’S HIGH-TECH ECONOMY
Table 6.4.1 presents the size of the different components of the high-tech economy and the workforce as a whole for the UK’s regions and devolved national administrations, reported as the average of 2011 to 2013 to iron out year-on-year fluctuations. These are placed in descending order of the size of their high-tech economies’ workforce. Figure 6.4.1 presents these numbers as contributions to the UK’s high-tech economy workforce.
TABLE 6.4.1 HIGH-TECH ECONOMY EMPLOYMENT IN THE REGIONS AND DNAS, UK, AVERAGE 2011-2013
Note: There are a small number of people in the survey sample that count towards the UK totals in this and subsequent tables, but are not allocated to any region.
Region STEM Non– High-tech Embedded STEM High-tech Workforce Specialist specialist Industries STEM Occupations Economy
South East 162,000 266,000 429,000 132,000 294,000 560,000 4,374,000
London 122,000 167,000 290,000 129,000 252,000 419,000 3,945,000
Eastern 94,000 154,000 248,000 86,000 180,000 334,000 2,980,000
North West 78,000 168,000 245,000 73,000 150,000 318,000 3,217,000
Scotland 70,000 150,000 220,000 58,000 128,000 278,000 2,554,000
South West 76,000 124,000 200,000 62,000 138,000 262,000 2,645,000
West 52,000 117,000 169,000 58,000 110,000 226,000 2,481,000 Midlands
Yorkshire & 47,000 105,000 152,000 64,000 111,000 216,000 2,511,000 Humberside
East Midlands 46,000 118,000 164,000 49,000 95,000 213,000 2,187,000
Wales 22,000 67,000 90,000 30,000 52,000 119,000 1,369,000
North East 23,000 59,000 82,000 24,000 47,000 106,000 1,168,000
Northern 13,000 28,000 42,000 18,000 32,000 60,000 814,000 Ireland
UK 805,000 1,525,000 2,330,000 782,000 1,587,000 3,112,000 30,243,000

44 THE GEOGRAPHY OF THE UK’S CREATIVE AND HIGH-TECH ECONOMIES
FIGURE 6.4.1 THE REGIONAL/DNA DISTRIBUTION OF THE HIGH-TECH ECONOMY WORKFORCE, UK, AVERAGE, 2011-2013
Figure 6.4.1 shows that London and the South East account for a very significant share of UK high-tech employment, though at 31 per cent this is less pronounced than in the case of the creative economy (43 per cent). Table 6.4.2 gives the regional workforce shares for all the components of the UK’s high-tech economy. With a workforce share of 10.6 per cent, London has a smaller proportion of high-tech employment than the South East, and has a proportion equivalent to that of Scotland – strikingly different from the creative economy, where the difference between London and Scotland’s creative economy workforce share is nine percentage points (Table 5.4.2).
Table 6.4.3 gives the corresponding location quotients (which as before normalise the various workforce shares for the region/DNA’s overall share in the UK workforce) and for convenience gives the creative economy equivalents. This confirms the general finding that the distribution of high-tech economy jobs is more even than in the case of the creative economy, with location quotients ranging from 0.72 to 1.24 compared with those for regional creative economy which range from 0.59 to 1.86.
North East
North West
Yorkshire and Humberside
East Midlands
West Midlands
Eastern
London
South East
South West
Wales
Scotland
Northern Ireland
18%
14%
11%
10% 9%
8%
7%
7%
7%
4% 3% 2%
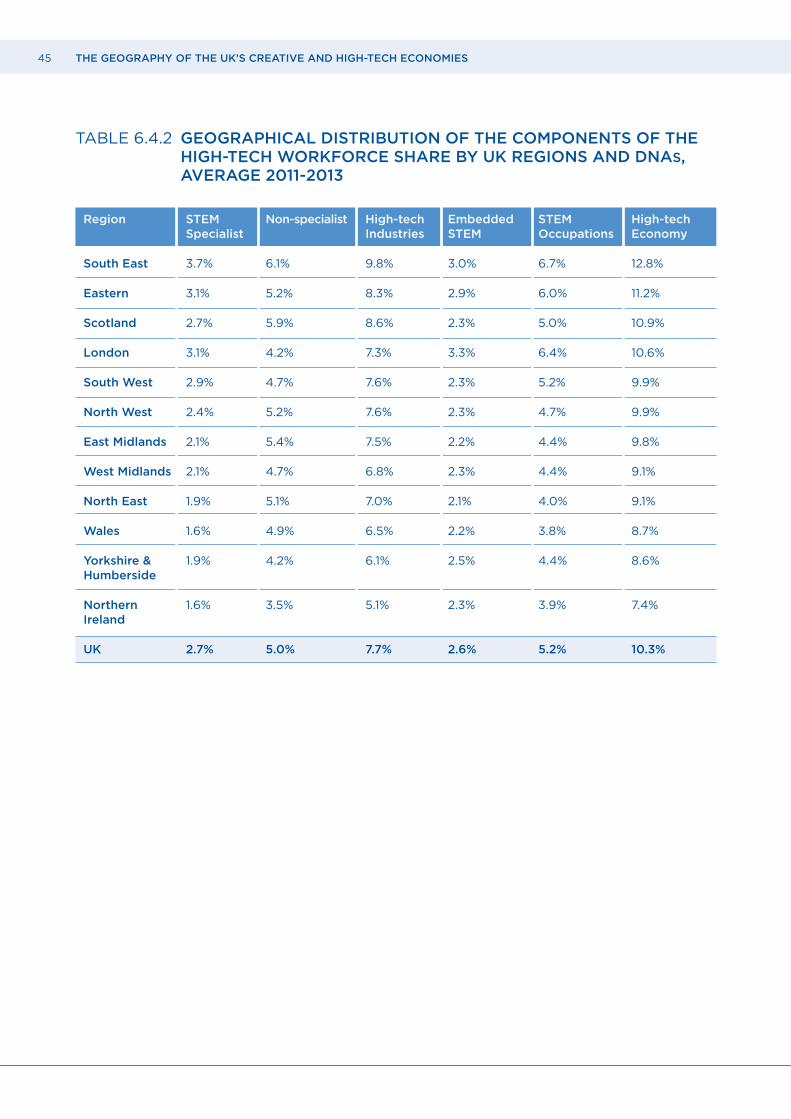
45 THE GEOGRAPHY OF THE UK’S CREATIVE AND HIGH-TECH ECONOMIES
TABLE 6.4.2 GEOGRAPHICAL DISTRIBUTION OF THE COMPONENTS OF THE HIGH-TECH WORKFORCE SHARE BY UK REGIONS AND DNAS, AVERAGE 2011-2013
Region STEM Non-specialist High-tech Embedded STEM High-tech Specialist Industries STEM Occupations Economy
South East 3.7% 6.1% 9.8% 3.0% 6.7% 12.8%
Eastern 3.1% 5.2% 8.3% 2.9% 6.0% 11.2%
Scotland 2.7% 5.9% 8.6% 2.3% 5.0% 10.9%
London 3.1% 4.2% 7.3% 3.3% 6.4% 10.6%
South West 2.9% 4.7% 7.6% 2.3% 5.2% 9.9%
North West 2.4% 5.2% 7.6% 2.3% 4.7% 9.9%
East Midlands 2.1% 5.4% 7.5% 2.2% 4.4% 9.8%
West Midlands 2.1% 4.7% 6.8% 2.3% 4.4% 9.1%
North East 1.9% 5.1% 7.0% 2.1% 4.0% 9.1%
Wales 1.6% 4.9% 6.5% 2.2% 3.8% 8.7%
Yorkshire & 1.9% 4.2% 6.1% 2.5% 4.4% 8.6% Humberside
Northern 1.6% 3.5% 5.1% 2.3% 3.9% 7.4% Ireland
UK 2.7% 5.0% 7.7% 2.6% 5.2% 10.3%
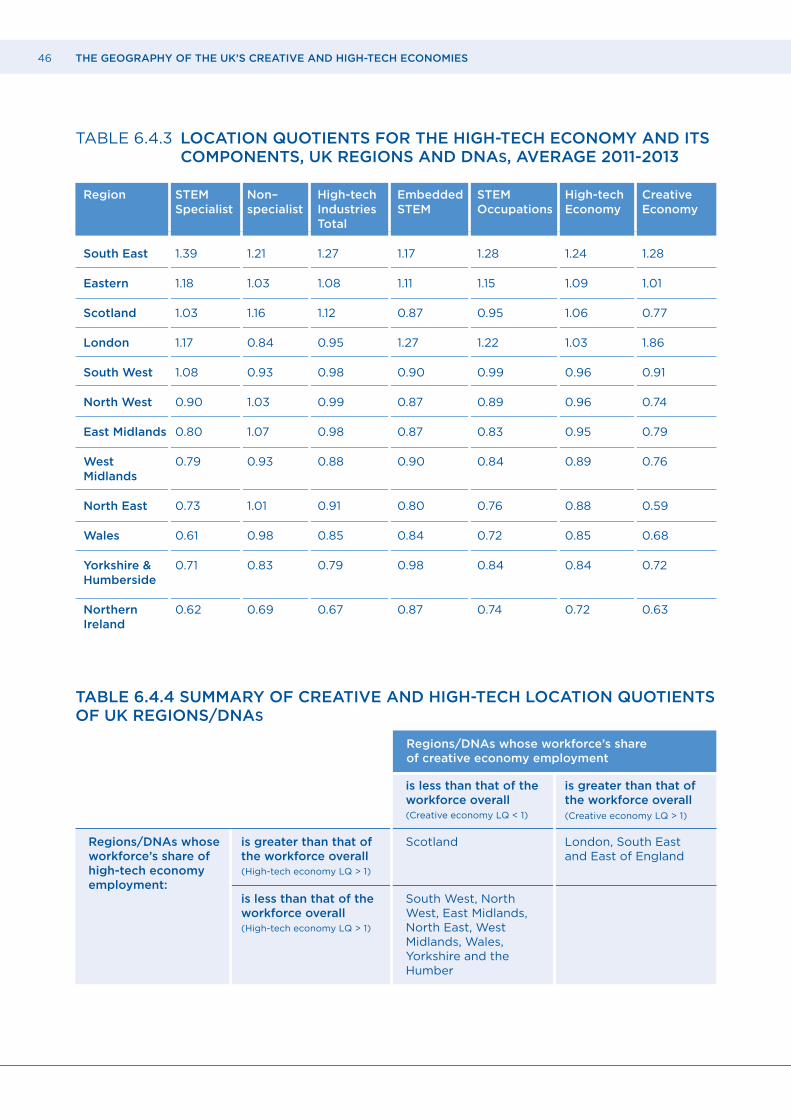
46 THE GEOGRAPHY OF THE UK’S CREATIVE AND HIGH-TECH ECONOMIES
TABLE 6.4.3 LOCATION QUOTIENTS FOR THE HIGH-TECH ECONOMY AND ITS COMPONENTS, UK REGIONS AND DNAS, AVERAGE 2011-2013
TABLE 6.4.4 SUMMARY OF CREATIVE AND HIGH-TECH LOCATION QUOTIENTS OF UK REGIONS/DNAS
Region STEM Non– High-tech Embedded STEM High-tech Creative Specialist specialist Industries STEM Occupations Economy Economy Total
South East 1.39 1.21 1.27 1.17 1.28 1.24 1.28
Eastern 1.18 1.03 1.08 1.11 1.15 1.09 1.01
Scotland 1.03 1.16 1.12 0.87 0.95 1.06 0.77
London 1.17 0.84 0.95 1.27 1.22 1.03 1.86
South West 1.08 0.93 0.98 0.90 0.99 0.96 0.91
North West 0.90 1.03 0.99 0.87 0.89 0.96 0.74
East Midlands 0.80 1.07 0.98 0.87 0.83 0.95 0.79
West 0.79 0.93 0.88 0.90 0.84 0.89 0.76 Midlands
North East 0.73 1.01 0.91 0.80 0.76 0.88 0.59
Wales 0.61 0.98 0.85 0.84 0.72 0.85 0.68
Yorkshire & 0.71 0.83 0.79 0.98 0.84 0.84 0.72 Humberside
Northern 0.62 0.69 0.67 0.87 0.74 0.72 0.63 Ireland
Regions/DNAs whose workforce’s share of high-tech economy employment:
is greater than that of the workforce overall (High-tech economy LQ > 1)
is less than that of the workforce overall (High-tech economy LQ > 1)
Scotland
is less than that of the workforce overall (Creative economy LQ < 1)
South West, North West, East Midlands, North East, West Midlands, Wales, Yorkshire and the Humber
London, South East and East of England
is greater than that of the workforce overall(Creative economy LQ > 1)
Regions/DNAs whose workforce’s share of creative economy employment
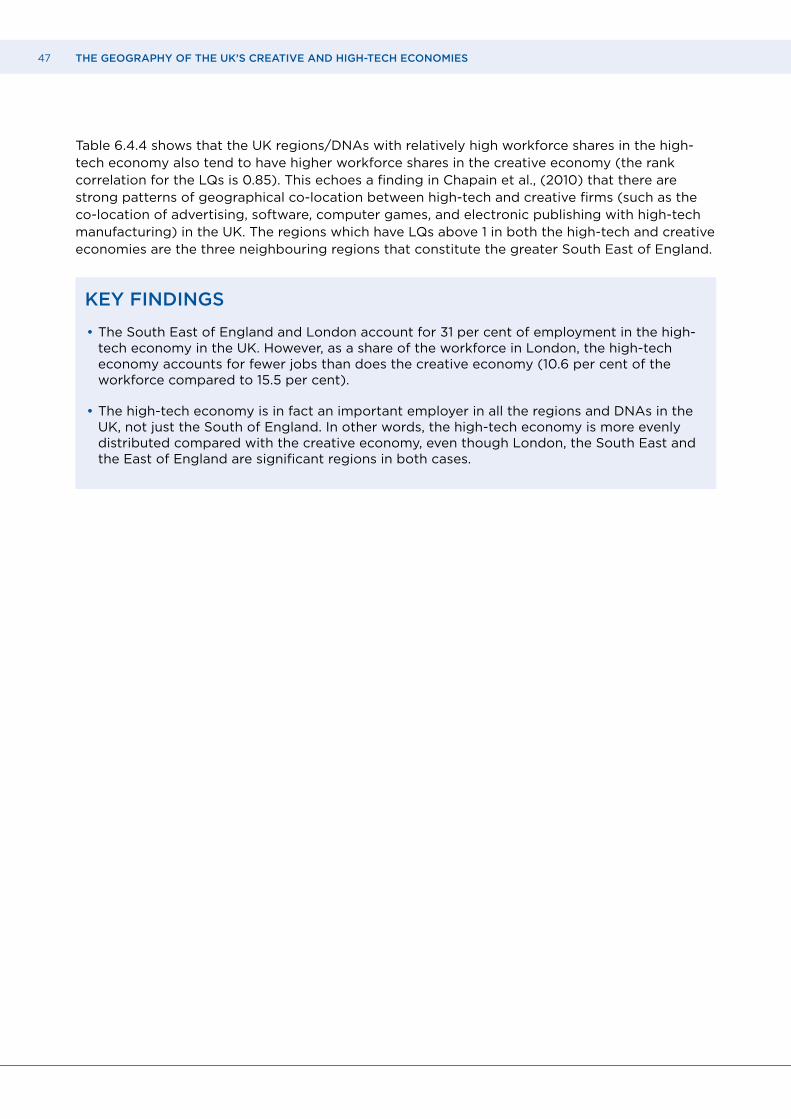
47 THE GEOGRAPHY OF THE UK’S CREATIVE AND HIGH-TECH ECONOMIES
Table 6.4.4 shows that the UK regions/DNAs with relatively high workforce shares in the high-tech economy also tend to have higher workforce shares in the creative economy (the rank correlation for the LQs is 0.85). This echoes a finding in Chapain et al., (2010) that there are strong patterns of geographical co-location between high-tech and creative firms (such as the co-location of advertising, software, computer games, and electronic publishing with high-tech manufacturing) in the UK. The regions which have LQs above 1 in both the high-tech and creative economies are the three neighbouring regions that constitute the greater South East of England.
KEY FINDINGS
• The South East of England and London account for 31 per cent of employment in the high-tech economy in the UK. However, as a share of the workforce in London, the high-tech economy accounts for fewer jobs than does the creative economy (10.6 per cent of the workforce compared to 15.5 per cent).
• The high-tech economy is in fact an important employer in all the regions and DNAs in the UK, not just the South of England. In other words, the high-tech economy is more evenly distributed compared with the creative economy, even though London, the South East and the East of England are significant regions in both cases.
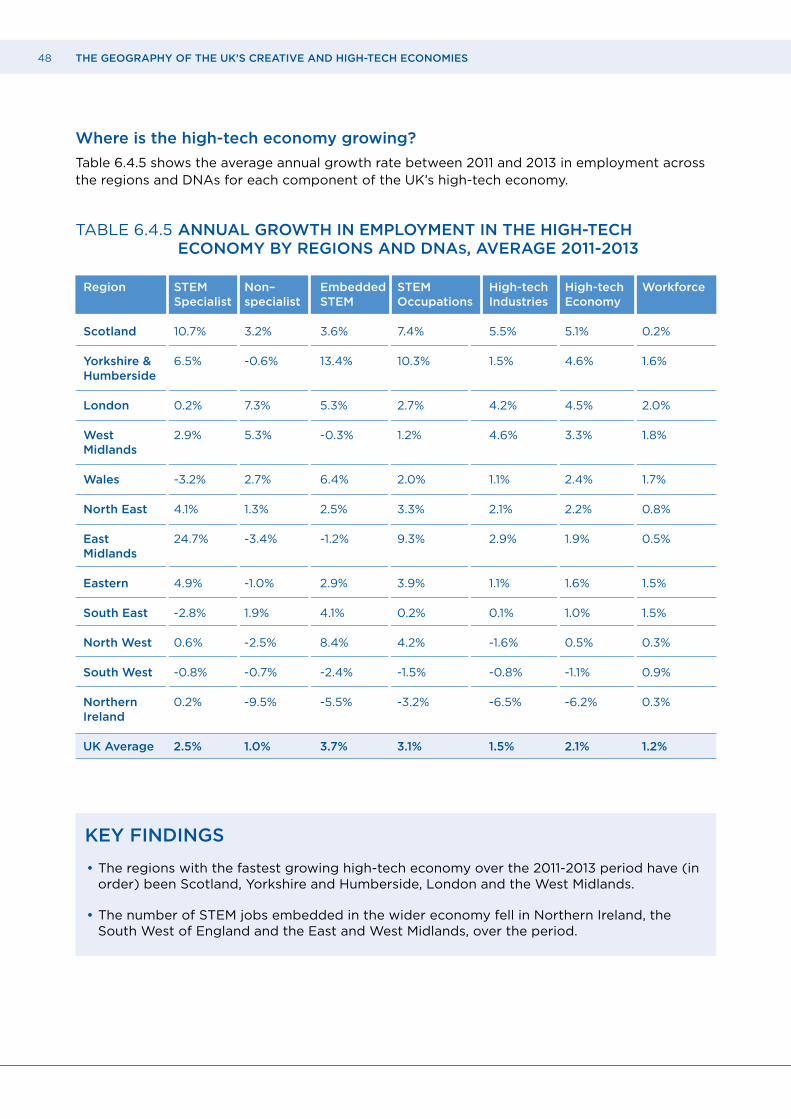
48 THE GEOGRAPHY OF THE UK’S CREATIVE AND HIGH-TECH ECONOMIES
Where is the high-tech economy growing?
Table 6.4.5 shows the average annual growth rate between 2011 and 2013 in employment across the regions and DNAs for each component of the UK’s high-tech economy.
TABLE 6.4.5 ANNUAL GROWTH IN EMPLOYMENT IN THE HIGH-TECH ECONOMY BY REGIONS AND DNAS, AVERAGE 2011-2013
KEY FINDINGS
• The regions with the fastest growing high-tech economy over the 2011-2013 period have (in order) been Scotland, Yorkshire and Humberside, London and the West Midlands.
• The number of STEM jobs embedded in the wider economy fell in Northern Ireland, the South West of England and the East and West Midlands, over the period.
Region STEM Non– Embedded STEM High-tech High-tech Workforce Specialist specialist STEM Occupations Industries Economy
Scotland 10.7% 3.2% 3.6% 7.4% 5.5% 5.1% 0.2%
Yorkshire & 6.5% -0.6% 13.4% 10.3% 1.5% 4.6% 1.6% Humberside
London 0.2% 7.3% 5.3% 2.7% 4.2% 4.5% 2.0%
West 2.9% 5.3% -0.3% 1.2% 4.6% 3.3% 1.8% Midlands
Wales -3.2% 2.7% 6.4% 2.0% 1.1% 2.4% 1.7%
North East 4.1% 1.3% 2.5% 3.3% 2.1% 2.2% 0.8%
East 24.7% -3.4% -1.2% 9.3% 2.9% 1.9% 0.5% Midlands
Eastern 4.9% -1.0% 2.9% 3.9% 1.1% 1.6% 1.5%
South East -2.8% 1.9% 4.1% 0.2% 0.1% 1.0% 1.5%
North West 0.6% -2.5% 8.4% 4.2% -1.6% 0.5% 0.3%
South West -0.8% -0.7% -2.4% -1.5% -0.8% -1.1% 0.9%
Northern 0.2% -9.5% -5.5% -3.2% -6.5% -6.2% 0.3% Ireland
UK Average 2.5% 1.0% 3.7% 3.1% 1.5% 2.1% 1.2%

49 THE GEOGRAPHY OF THE UK’S CREATIVE AND HIGH-TECH ECONOMIES
7 THE CREATIVE AND HIGH-TECH ECONOMIES COMPARED
How in an accounting sense do the creative and high-tech economies relate? To what extent do they intersect given the presence of occupational and industrial codes common to both of them? Are there any particular geographical patterns
to activities which are both creative and high-tech?
Table A1.3 (Appendix 1), summarises the relationship between creative and STEM occupations in our analysis. Of the 22 STEM and 30 creative occupations, there are four common SOC codes (Information technology and telecommunications directors (1136); IT business analysts, architects and systems designers (2135); Programmers and software development professional (2136), and Web design and development professionals (2137)).
Table A2.3 (Appendix 2) summarises the relationship between the creative and high-tech industries. Three of the 31 creative industry codes are also classified as high-tech in our definition (Other software publishing (5829), Computer programming activities (6201) and Computer consultancy activities (6202)).
The coinciding occupations and industries are all Information and Communication Technologies (ICT) related occupations and industries. Arguably, this reflects the fact that ICTs are an example of what economic historians call a general purpose technology, playing a role analogous to electricity in the late 19th century – transforming the nature of all production in the economy.74 Instead of just separating out ICT industries, therefore, it makes sense also to acknowledge that both high-tech and creative industries make extended and universal use of ICT (even if that may be in different and distinctive ways).75
Figure 7.1 plots the relationship in accounting terms between STEM and creative occupations, as we have classified them, on a Venn diagram. It shows that there were around 0.46 million jobs that were both STEM and creative (average 2011-2013). Although these are ICT jobs it should be noted that this number is significantly smaller than broader treatments of ICT work e.g., that used by e-Skills UK in its 2013 statistical release on the UK’s Information Economy which estimates that there are over one million people employed in ICT occupations in the UK.76
FIGURE 7.1 EMPLOYMENT OF CREATIVE AND STEM OCCUPATIONS, UK, AVERAGE 2011-2013
Creative occupations
1.74 million jobs
0.46million
jobs
STEM occupations
1.59 million jobs
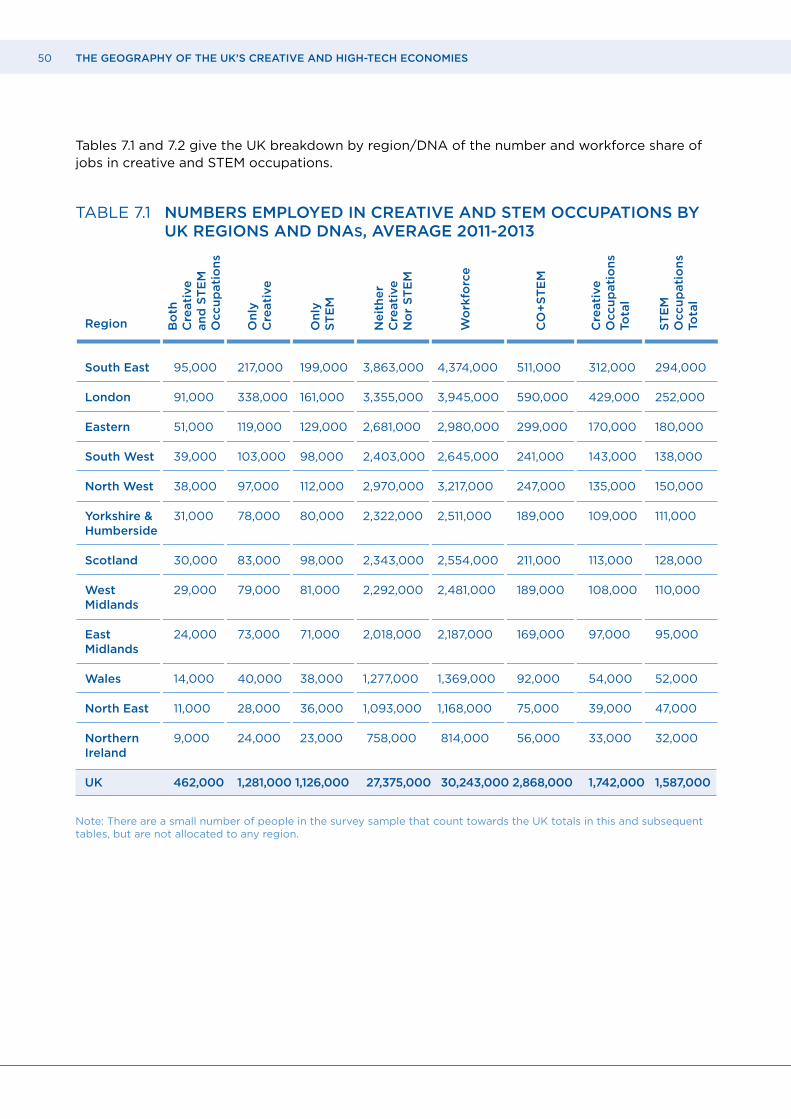
50 THE GEOGRAPHY OF THE UK’S CREATIVE AND HIGH-TECH ECONOMIES
Tables 7.1 and 7.2 give the UK breakdown by region/DNA of the number and workforce share of jobs in creative and STEM occupations.
TABLE 7.1 NUMBERS EMPLOYED IN CREATIVE AND STEM OCCUPATIONS BY UK REGIONS AND DNAS, AVERAGE 2011-2013
Note: There are a small number of people in the survey sample that count towards the UK totals in this and subsequent tables, but are not allocated to any region.
Bo
th
Cre
ati
ve
an
d S
TE
MO
ccu
pati
on
s
On
ly
Cre
ati
ve
On
ly
ST
EM
Ne
ith
er
Cre
ati
ve
N
or
ST
EM
Wo
rkfo
rce
CO
+S
TE
M
Cre
ati
ve
O
ccu
pati
on
s To
tal
ST
EM
O
ccu
pati
on
s To
tal
Region South East 95,000 217,000 199,000 3,863,000 4,374,000 511,000 312,000 294,000
London 91,000 338,000 161,000 3,355,000 3,945,000 590,000 429,000 252,000
Eastern 51,000 119,000 129,000 2,681,000 2,980,000 299,000 170,000 180,000
South West 39,000 103,000 98,000 2,403,000 2,645,000 241,000 143,000 138,000
North West 38,000 97,000 112,000 2,970,000 3,217,000 247,000 135,000 150,000
Yorkshire & 31,000 78,000 80,000 2,322,000 2,511,000 189,000 109,000 111,000 Humberside
Scotland 30,000 83,000 98,000 2,343,000 2,554,000 211,000 113,000 128,000
West 29,000 79,000 81,000 2,292,000 2,481,000 189,000 108,000 110,000 Midlands
East 24,000 73,000 71,000 2,018,000 2,187,000 169,000 97,000 95,000 Midlands
Wales 14,000 40,000 38,000 1,277,000 1,369,000 92,000 54,000 52,000
North East 11,000 28,000 36,000 1,093,000 1,168,000 75,000 39,000 47,000
Northern 9,000 24,000 23,000 758,000 814,000 56,000 33,000 32,000 Ireland
UK 462,000 1,281,000 1,126,000 27,375,000 30,243,000 2,868,000 1,742,000 1,587,000
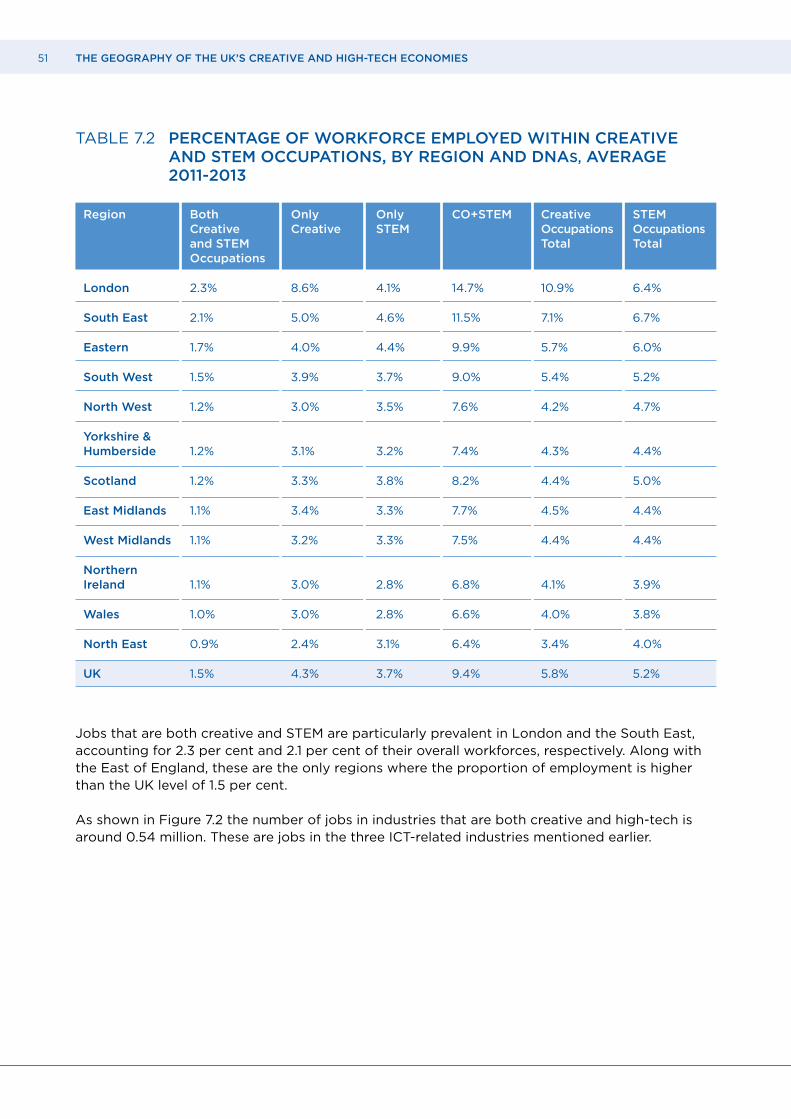
51 THE GEOGRAPHY OF THE UK’S CREATIVE AND HIGH-TECH ECONOMIES
TABLE 7.2 PERCENTAGE OF WORKFORCE EMPLOYED WITHIN CREATIVE AND STEM OCCUPATIONS, BY REGION AND DNAS, AVERAGE 2011-2013
Jobs that are both creative and STEM are particularly prevalent in London and the South East, accounting for 2.3 per cent and 2.1 per cent of their overall workforces, respectively. Along with the East of England, these are the only regions where the proportion of employment is higher than the UK level of 1.5 per cent.
As shown in Figure 7.2 the number of jobs in industries that are both creative and high-tech is around 0.54 million. These are jobs in the three ICT-related industries mentioned earlier.
Region Both Only Only CO+STEM Creative STEM Creative Creative STEM Occupations Occupations and STEM Total Total Occupations
London 2.3% 8.6% 4.1% 14.7% 10.9% 6.4%
South East 2.1% 5.0% 4.6% 11.5% 7.1% 6.7%
Eastern 1.7% 4.0% 4.4% 9.9% 5.7% 6.0%
South West 1.5% 3.9% 3.7% 9.0% 5.4% 5.2%
North West 1.2% 3.0% 3.5% 7.6% 4.2% 4.7%
Yorkshire & Humberside 1.2% 3.1% 3.2% 7.4% 4.3% 4.4%
Scotland 1.2% 3.3% 3.8% 8.2% 4.4% 5.0%
East Midlands 1.1% 3.4% 3.3% 7.7% 4.5% 4.4%
West Midlands 1.1% 3.2% 3.3% 7.5% 4.4% 4.4%
Northern Ireland 1.1% 3.0% 2.8% 6.8% 4.1% 3.9%
Wales 1.0% 3.0% 2.8% 6.6% 4.0% 3.8%
North East 0.9% 2.4% 3.1% 6.4% 3.4% 4.0%
UK 1.5% 4.3% 3.7% 9.4% 5.8% 5.2%
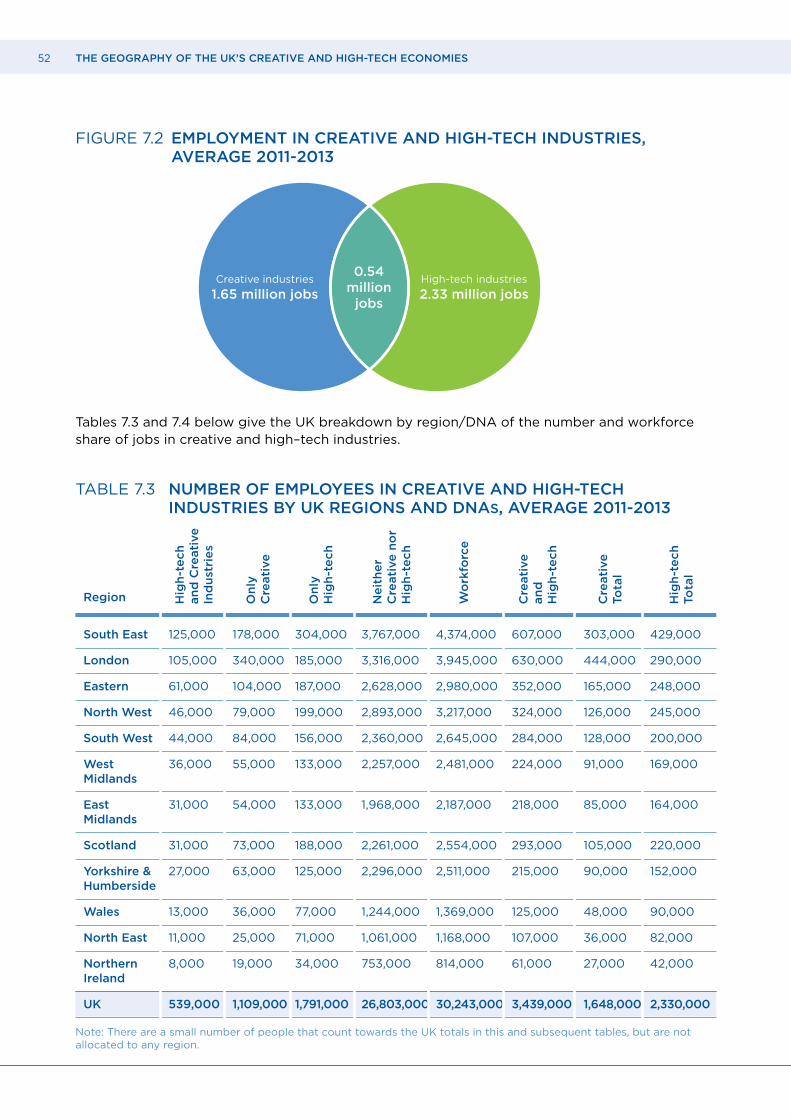
52 THE GEOGRAPHY OF THE UK’S CREATIVE AND HIGH-TECH ECONOMIES
FIGURE 7.2 EMPLOYMENT IN CREATIVE AND HIGH-TECH INDUSTRIES, AVERAGE 2011-2013
Tables 7.3 and 7.4 below give the UK breakdown by region/DNA of the number and workforce share of jobs in creative and high–tech industries.
TABLE 7.3 NUMBER OF EMPLOYEES IN CREATIVE AND HIGH-TECH INDUSTRIES BY UK REGIONS AND DNAS, AVERAGE 2011-2013
Note: There are a small number of people that count towards the UK totals in this and subsequent tables, but are not allocated to any region.
Creative industries
1.65 million jobs
0.54million
jobs
High-tech industries
2.33 million jobs
Hig
h-t
ech
an
d C
reati
ve
In
du
stri
es
On
ly
Cre
ati
ve
On
ly
Hig
h-t
ech
Ne
ith
er
C
reati
ve
no
r H
igh
-te
ch
Wo
rkfo
rce
Cre
ati
ve
an
d
Hig
h-t
ech
Cre
ati
ve
To
tal
Hig
h-t
ech
To
tal
Region South East 125,000 178,000 304,000 3,767,000 4,374,000 607,000 303,000 429,000
London 105,000 340,000 185,000 3,316,000 3,945,000 630,000 444,000 290,000
Eastern 61,000 104,000 187,000 2,628,000 2,980,000 352,000 165,000 248,000
North West 46,000 79,000 199,000 2,893,000 3,217,000 324,000 126,000 245,000
South West 44,000 84,000 156,000 2,360,000 2,645,000 284,000 128,000 200,000
West 36,000 55,000 133,000 2,257,000 2,481,000 224,000 91,000 169,000 Midlands
East 31,000 54,000 133,000 1,968,000 2,187,000 218,000 85,000 164,000 Midlands
Scotland 31,000 73,000 188,000 2,261,000 2,554,000 293,000 105,000 220,000
Yorkshire & 27,000 63,000 125,000 2,296,000 2,511,000 215,000 90,000 152,000 Humberside
Wales 13,000 36,000 77,000 1,244,000 1,369,000 125,000 48,000 90,000
North East 11,000 25,000 71,000 1,061,000 1,168,000 107,000 36,000 82,000
Northern 8,000 19,000 34,000 753,000 814,000 61,000 27,000 42,000 Ireland
UK 539,000 1,109,000 1,791,000 26,803,000 30,243,000 3,439,000 1,648,000 2,330,000
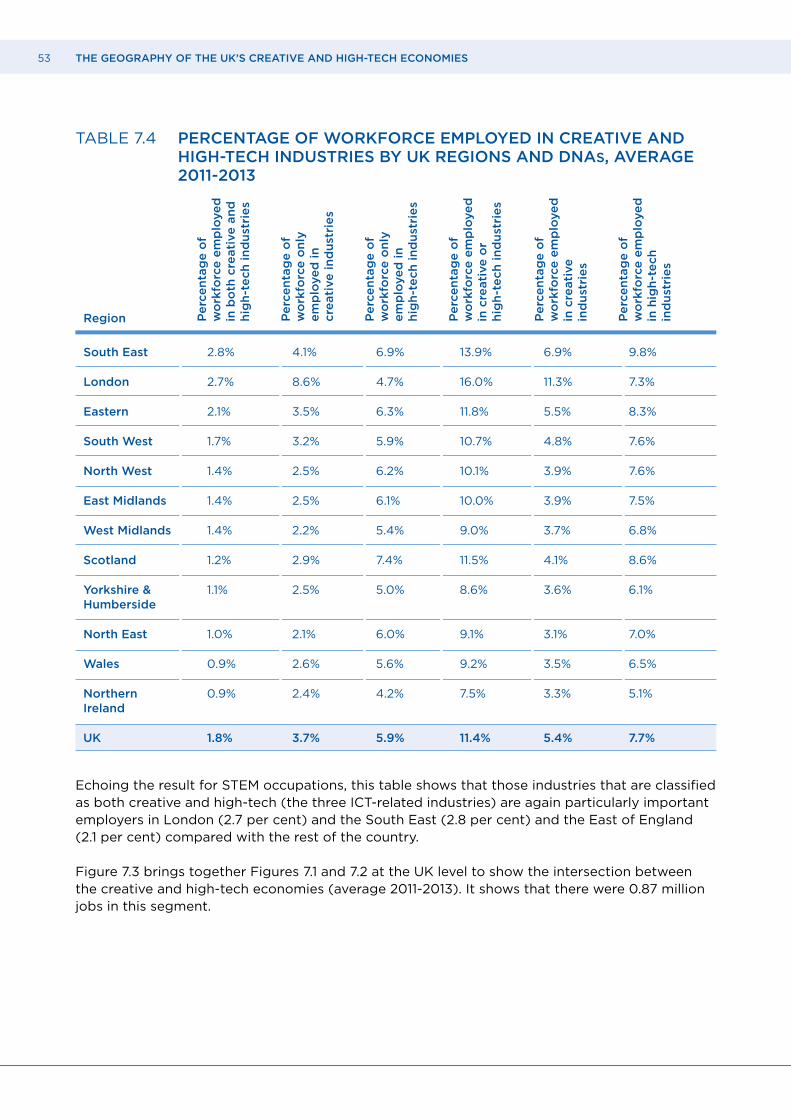
53 THE GEOGRAPHY OF THE UK’S CREATIVE AND HIGH-TECH ECONOMIES
Pe
rce
nta
ge
of
w
ork
forc
e e
mp
loye
d
in b
oth
cre
ati
ve
an
d
hig
h-t
ech
in
du
stri
es
Pe
rce
nta
ge
of
w
ork
forc
e o
nly
e
mp
loye
d in
cre
ati
ve
in
du
stri
es
Pe
rce
nta
ge
of
w
ork
forc
e o
nly
e
mp
loye
d in
h
igh
-te
ch
in
du
stri
es
Pe
rce
nta
ge
of
w
ork
forc
e e
mp
loye
d
in c
reati
ve
or
h
igh
-te
ch
in
du
stri
es
Pe
rce
nta
ge
of
w
ork
forc
e e
mp
loye
d
in c
reati
ve
in
du
stri
es
Pe
rce
nta
ge
of
w
ork
forc
e e
mp
loye
d
in h
igh
-te
ch
in
du
stri
es
Region
TABLE 7.4 PERCENTAGE OF WORKFORCE EMPLOYED IN CREATIVE AND HIGH-TECH INDUSTRIES BY UK REGIONS AND DNAS, AVERAGE 2011-2013
Echoing the result for STEM occupations, this table shows that those industries that are classified as both creative and high-tech (the three ICT-related industries) are again particularly important employers in London (2.7 per cent) and the South East (2.8 per cent) and the East of England (2.1 per cent) compared with the rest of the country.
Figure 7.3 brings together Figures 7.1 and 7.2 at the UK level to show the intersection between the creative and high-tech economies (average 2011-2013). It shows that there were 0.87 million jobs in this segment.
South East 2.8% 4.1% 6.9% 13.9% 6.9% 9.8%
London 2.7% 8.6% 4.7% 16.0% 11.3% 7.3%
Eastern 2.1% 3.5% 6.3% 11.8% 5.5% 8.3%
South West 1.7% 3.2% 5.9% 10.7% 4.8% 7.6%
North West 1.4% 2.5% 6.2% 10.1% 3.9% 7.6%
East Midlands 1.4% 2.5% 6.1% 10.0% 3.9% 7.5%
West Midlands 1.4% 2.2% 5.4% 9.0% 3.7% 6.8%
Scotland 1.2% 2.9% 7.4% 11.5% 4.1% 8.6%
Yorkshire & 1.1% 2.5% 5.0% 8.6% 3.6% 6.1% Humberside
North East 1.0% 2.1% 6.0% 9.1% 3.1% 7.0%
Wales 0.9% 2.6% 5.6% 9.2% 3.5% 6.5%
Northern 0.9% 2.4% 4.2% 7.5% 3.3% 5.1% Ireland
UK 1.8% 3.7% 5.9% 11.4% 5.4% 7.7%
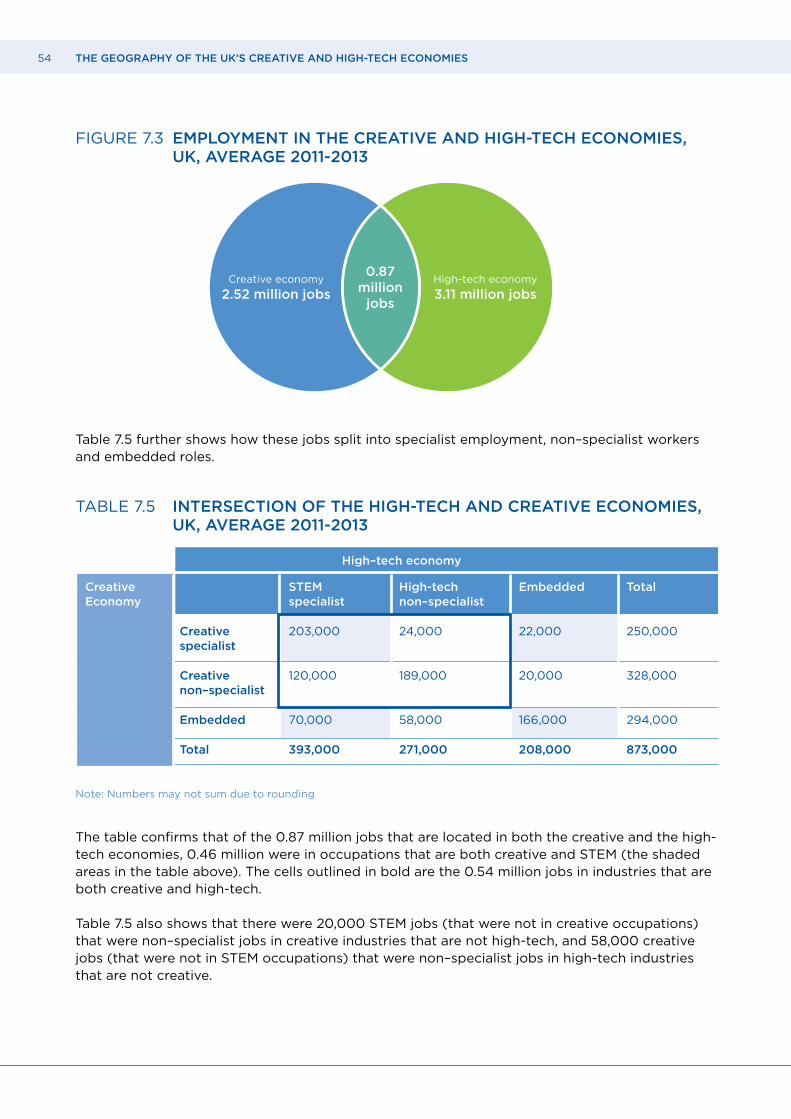
54 THE GEOGRAPHY OF THE UK’S CREATIVE AND HIGH-TECH ECONOMIES
Creative economy
2.52 million jobs
0.87million
jobs
High-tech economy
3.11 million jobs
FIGURE 7.3 EMPLOYMENT IN THE CREATIVE AND HIGH-TECH ECONOMIES, UK, AVERAGE 2011-2013
Table 7.5 further shows how these jobs split into specialist employment, non–specialist workers and embedded roles.
TABLE 7.5 INTERSECTION OF THE HIGH-TECH AND CREATIVE ECONOMIES, UK, AVERAGE 2011-2013
Note: Numbers may not sum due to rounding
The table confirms that of the 0.87 million jobs that are located in both the creative and the high-tech economies, 0.46 million were in occupations that are both creative and STEM (the shaded areas in the table above). The cells outlined in bold are the 0.54 million jobs in industries that are both creative and high-tech.
Table 7.5 also shows that there were 20,000 STEM jobs (that were not in creative occupations) that were non–specialist jobs in creative industries that are not high-tech, and 58,000 creative jobs (that were not in STEM occupations) that were non–specialist jobs in high-tech industries that are not creative.
Creative STEM High-tech Embedded Total Economy specialist non–specialist
Creative 203,000 24,000 22,000 250,000 specialist
Creative 120,000 189,000 20,000 328,000 non–specialist
Embedded 70,000 58,000 166,000 294,000
Total 393,000 271,000 208,000 873,000
High–tech economy
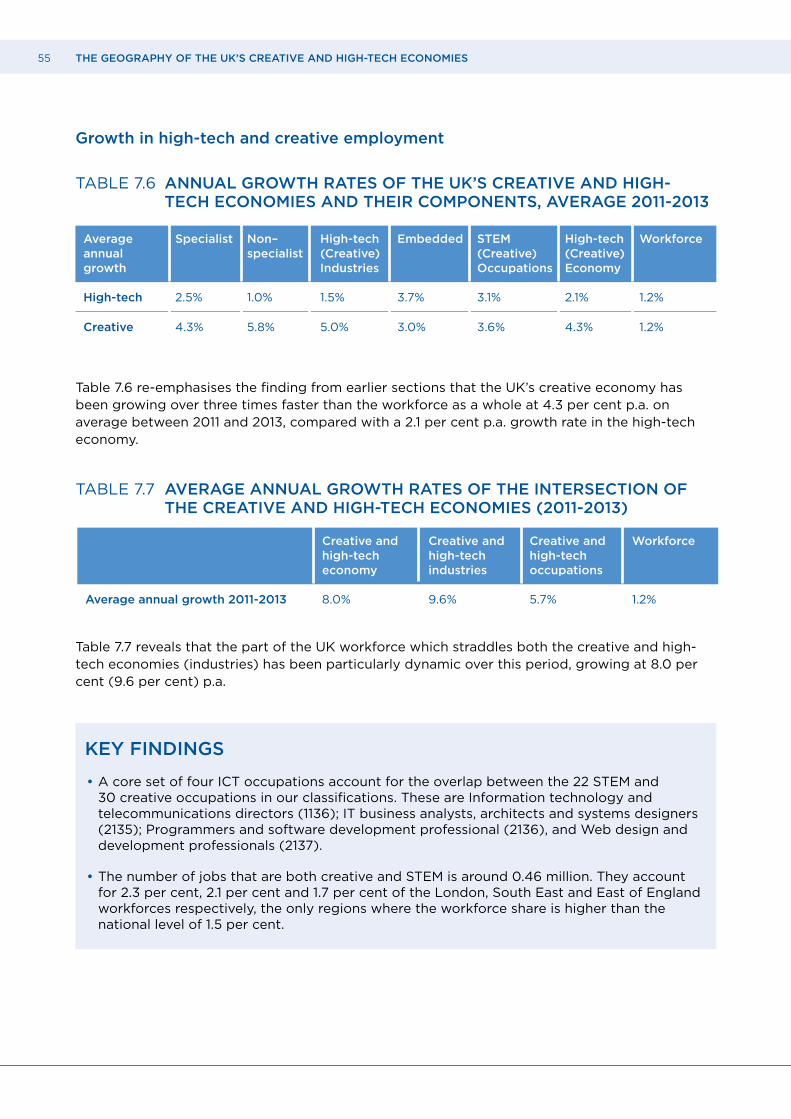
55 THE GEOGRAPHY OF THE UK’S CREATIVE AND HIGH-TECH ECONOMIES
Creative and Creative and Creative and Workforce high-tech high-tech high-tech economy industries occupations Average annual growth 2011-2013 8.0% 9.6% 5.7% 1.2%
Growth in high-tech and creative employment
TABLE 7.6 ANNUAL GROWTH RATES OF THE UK’S CREATIVE AND HIGH- TECH ECONOMIES AND THEIR COMPONENTS, AVERAGE 2011-2013
Table 7.6 re-emphasises the finding from earlier sections that the UK’s creative economy has been growing over three times faster than the workforce as a whole at 4.3 per cent p.a. on average between 2011 and 2013, compared with a 2.1 per cent p.a. growth rate in the high-tech economy.
TABLE 7.7 AVERAGE ANNUAL GROWTH RATES OF THE INTERSECTION OF THE CREATIVE AND HIGH-TECH ECONOMIES (2011-2013)
Table 7.7 reveals that the part of the UK workforce which straddles both the creative and high-tech economies (industries) has been particularly dynamic over this period, growing at 8.0 per cent (9.6 per cent) p.a.
KEY FINDINGS
• A core set of four ICT occupations account for the overlap between the 22 STEM and 30 creative occupations in our classifications. These are Information technology and telecommunications directors (1136); IT business analysts, architects and systems designers (2135); Programmers and software development professional (2136), and Web design and development professionals (2137).
• The number of jobs that are both creative and STEM is around 0.46 million. They account for 2.3 per cent, 2.1 per cent and 1.7 per cent of the London, South East and East of England workforces respectively, the only regions where the workforce share is higher than the national level of 1.5 per cent.
Average Specialist Non– High-tech Embedded STEM High-tech Workforce annual specialist (Creative) (Creative) (Creative) growth Industries Occupations Economy High-tech 2.5% 1.0% 1.5% 3.7% 3.1% 2.1% 1.2%
Creative 4.3% 5.8% 5.0% 3.0% 3.6% 4.3% 1.2%

56 THE GEOGRAPHY OF THE UK’S CREATIVE AND HIGH-TECH ECONOMIES
• Three of the 31 creative industry codes are also classified as high-tech in our definition: Other software publishing (5829), Computer programming activities (6201) and Computer consultancy activities (6202). Between them they account for 0.54 million jobs, although not all are in creative occupations.
• They account for 2.8 per cent, 2.7 per cent and 2.1 per cent of the South East, London and East of England workforces respectively, the only regions where the workforce share is higher than the national level of 1.8 per cent.
• 0.87 million people work in the intersection of the high-tech and creative economies i.e. either work in an occupation or industry that is in both the high-tech and creative economy.
• The part of the workforce which straddles both the creative and high–tech economies (industries) has been particularly dynamic over this period, growing at 8.0 per cent (9.6 per cent) p.a.
The next section examines the geography of the creative and high-tech economies at a sub-regional level.
57 THE GEOGRAPHY OF THE UK’S CREATIVE AND HIGH-TECH ECONOMIES
8 SUB-REGIONAL GEOGRAPHY OF THE UK’S CREATIVE AND HIGH- TECH ECONOMIES
To understand the geography of the creative and high-tech economies, and to formulate supportive policies, it is necessary to analyse it at a sub-regional level. Analysis at a higher degree of spatial resolution allows concentrations of particular
economic activity to be more accurately identified. Regions and DNAs can contain greater variations in economic characteristics within them (e.g. urban vs rural) than between them, so comparisons between regions/DNAs can potentially be misleading. Concentrations of creative and high-tech activity may also occur at small spatial scales, the visual effects industry cluster in London’s Soho, for example, so it is desirable to analyse the data at the smallest possible scale for which official data are available.77
There are, however, limitations to analysing the Annual Population Survey (APS), or indeed any survey, for small units of geography: the sample sizes become smaller so that inferences on the characteristics of individual localities become less robust. The statistical authorities also impose restrictions on reporting numbers due to them being potentially disclosive of survey participants’ identities.
In this report, we adopt the sub-regional geography of the European Union’s NUTS (Nomenclature of Territorial Units of Statistics) classification.78 This is the geographic system used by the European Union and has the benefit of allowing international comparisons.79 There are three spatial levels in the NUTS system: NUTS1 is the largest geography and corresponds to UK regions, NUTS2 is the second largest geography corresponding to counties or groups of counties, and NUTS3 is the geography with the smallest spatial scale. NUTS3 units can be aggregated to create NUTS2 and NUTS1 geographies and correspond to a mixture of UK counties and unitary authorities/urban areas. As the APS is based on place of residence, this means, however, that in some cases respondents will be working in an area different from where they live i.e. employment allocated to a given NUTS3 geography may be located elsewhere.
In the following set of maps we plot the location quotients i.e. the proportion of the area’s workforce in a given activity relative to the share of that activity in the UK workforce as a whole.80 This is undertaken for the creative economy and its components, followed by the high-tech economy. Areas that are more darkly shaded in the maps are those where there is a higher proportion of employment in creative and high-tech activity relative to the national level (i.e. those with a higher location quotient). As Northern Ireland is not coded at the NUTS3 level within the APS it is plotted at the NUTS1 level i.e. as Northern Ireland. This means concentrations of high-tech or creative activity at lower levels of spatial resolution in Northern Ireland will not be identified.
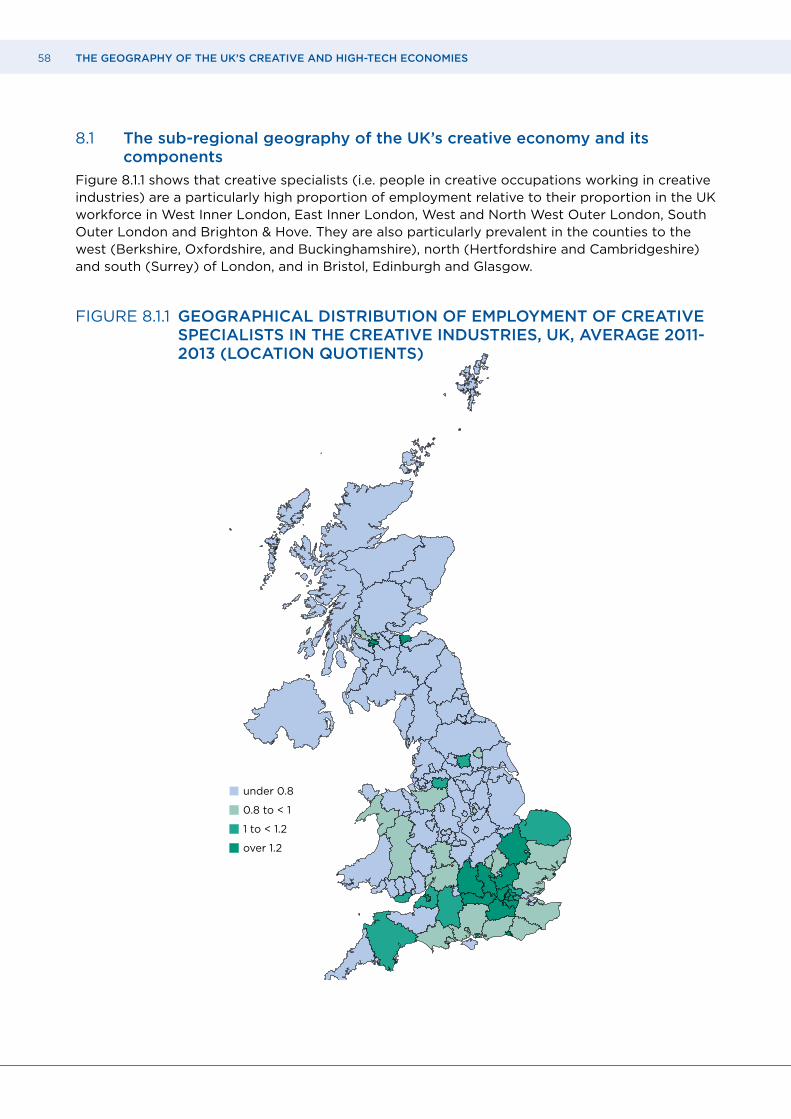
58 THE GEOGRAPHY OF THE UK’S CREATIVE AND HIGH-TECH ECONOMIES
8.1 The sub-regional geography of the UK’s creative economy and its components
Figure 8.1.1 shows that creative specialists (i.e. people in creative occupations working in creative industries) are a particularly high proportion of employment relative to their proportion in the UK workforce in West Inner London, East Inner London, West and North West Outer London, South Outer London and Brighton & Hove. They are also particularly prevalent in the counties to the west (Berkshire, Oxfordshire, and Buckinghamshire), north (Hertfordshire and Cambridgeshire) and south (Surrey) of London, and in Bristol, Edinburgh and Glasgow.
FIGURE 8.1.1 GEOGRAPHICAL DISTRIBUTION OF EMPLOYMENT OF CREATIVE SPECIALISTS IN THE CREATIVE INDUSTRIES, UK, AVERAGE 2011- 2013 (LOCATION QUOTIENTS)
under 0.8
0.8 to < 1
1 to < 1.2
over 1.2
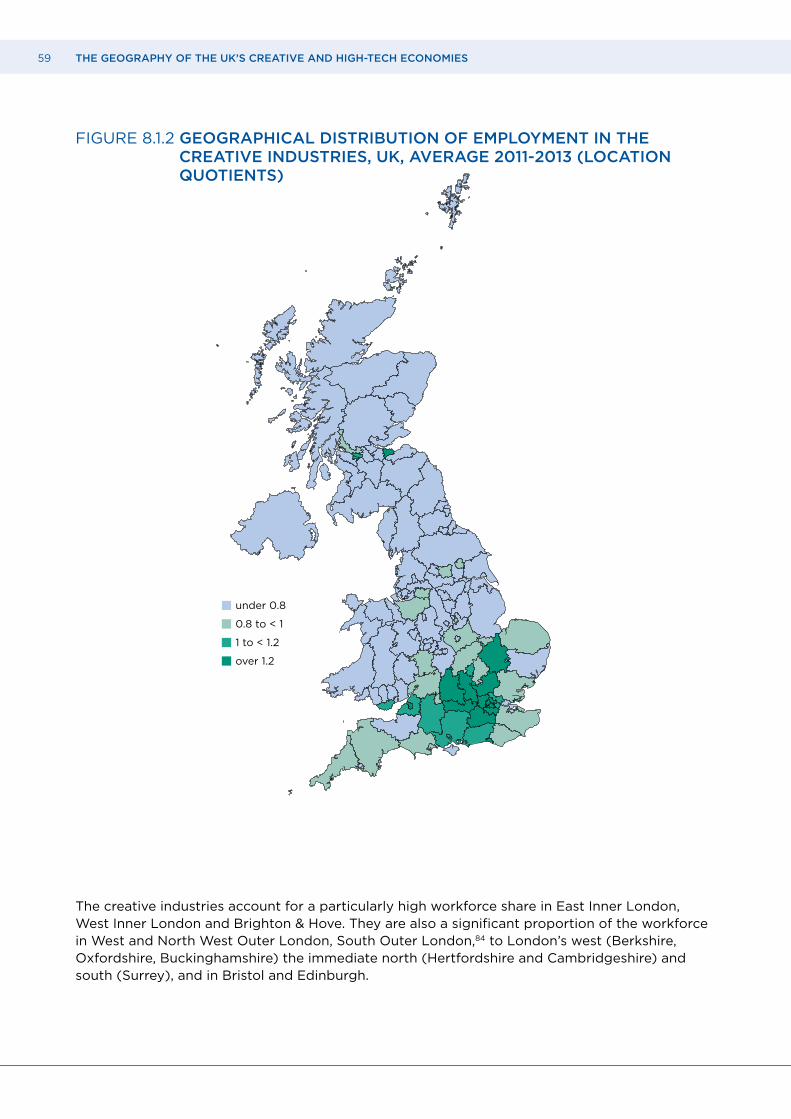
59 THE GEOGRAPHY OF THE UK’S CREATIVE AND HIGH-TECH ECONOMIES
FIGURE 8.1.2 GEOGRAPHICAL DISTRIBUTION OF EMPLOYMENT IN THE CREATIVE INDUSTRIES, UK, AVERAGE 2011-2013 (LOCATION QUOTIENTS)
The creative industries account for a particularly high workforce share in East Inner London, West Inner London and Brighton & Hove. They are also a significant proportion of the workforce in West and North West Outer London, South Outer London,84 to London’s west (Berkshire, Oxfordshire, Buckinghamshire) the immediate north (Hertfordshire and Cambridgeshire) and south (Surrey), and in Bristol and Edinburgh.
under 0.8
0.8 to < 1
1 to < 1.2
over 1.2

60 THE GEOGRAPHY OF THE UK’S CREATIVE AND HIGH-TECH ECONOMIES
FIGURE 8.1.3 GEOGRAPHICAL DISTRIBUTION OF EMPLOYMENT IN THE CREATIVE ECONOMY, UK, AVERAGE 2011-2013 (LOCATION QUOTIENTS)
The wider creative economy is a particularly significant employer as a proportion of the workforce in East Inner London, West Inner London, Surrey, Brighton & Hove and Outer London (West and North West, and South). It is also concentrated to the west (Berkshire, Oxfordshire, Buckinghamshire, Milton Keynes), the north (Hertfordshire and Cambridgeshire) and in Edinburgh and Bristol.
under 0.8
0.8 to < 1
1 to < 1.2
over 1.2

61 THE GEOGRAPHY OF THE UK’S CREATIVE AND HIGH-TECH ECONOMIES
8.2 The sub-regional geography of the UK’s high-tech economy and its components
FIGURE 8.2.1 GEOGRAPHICAL DISTRIBUTION OF EMPLOYMENT IN STEM OCCUPATIONS IN THE HIGH-TECH INDUSTRIES, UK, AVERAGE 2011-2013 (LOCATION QUOTIENTS)
Figure 8.2.1 shows that STEM occupations in high-tech industries account for a particularly high share of employment relative to their share of the UK workforce in Berkshire (largest towns: Reading and Slough) and in Cambridgeshire. They also account for a high proportion of the workforce in the counties to the north, west and south west of London, Outer London (West and North West) and Cheshire, Gloucestershire, North and North East Somerset, Aberdeen City & Aberdeenshire, Halton and Warrington and Bedfordshire. Urban areas with a particularly high proportion of STEM occupations working in high-tech industries in the workforce include: Glasgow, Bristol, Milton Keynes, Swindon, and Edinburgh.
under 0.8
0.8 to < 1
1 to < 1.2
over 1.2

62 THE GEOGRAPHY OF THE UK’S CREATIVE AND HIGH-TECH ECONOMIES
FIGURE 8.2.2 GEOGRAPHICAL DISTRIBUTION OF EMPLOYMENT IN THE HIGH- TECH INDUSTRIES, UK, AVERAGE 2011-2013 (LOCATION QUOTIENTS)
Employment in high-tech industries as a proportion of areas’ workforces is more evenly distributed, being also relatively prominent in West Cumbria, Flintshire and Wrexham, Derby, South and West Derbyshire, Caithness and Sutherland, Portsmouth, Hartlepool and Stockton-on-Tees, and Warwickshire.
Some of the agglomerations are likely to relate to the supply chains and employment of specific large-scale employers: for instance, Rolls Royce plc employs its largest concentration of aeronautic engineers in the UK in Derby.85 In West Cumbria, there are two major employers in the form of the Sellafield Nuclear site (the largest nuclear site in Europe86) and BAE systems’ submarine operations in Barrow-in-Furness.87 Aberdeen City and Aberdeenshire – the area with the highest LQ – is the centre of the UK’s North Sea oil industry. The pattern of concentrations
under 0.8
0.8 to < 1
1 to < 1.2
over 1.2
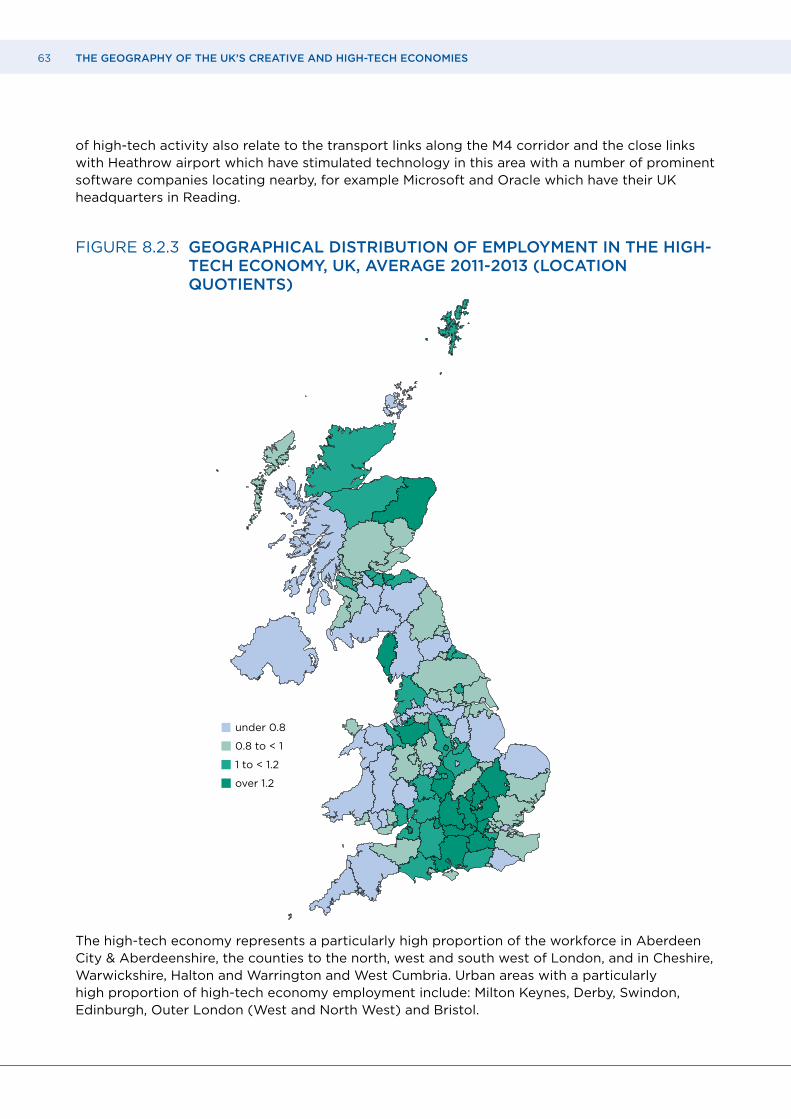
63 THE GEOGRAPHY OF THE UK’S CREATIVE AND HIGH-TECH ECONOMIES
of high-tech activity also relate to the transport links along the M4 corridor and the close links with Heathrow airport which have stimulated technology in this area with a number of prominent software companies locating nearby, for example Microsoft and Oracle which have their UK headquarters in Reading.
FIGURE 8.2.3 GEOGRAPHICAL DISTRIBUTION OF EMPLOYMENT IN THE HIGH- TECH ECONOMY, UK, AVERAGE 2011-2013 (LOCATION QUOTIENTS)
The high-tech economy represents a particularly high proportion of the workforce in Aberdeen City & Aberdeenshire, the counties to the north, west and south west of London, and in Cheshire, Warwickshire, Halton and Warrington and West Cumbria. Urban areas with a particularly high proportion of high-tech economy employment include: Milton Keynes, Derby, Swindon, Edinburgh, Outer London (West and North West) and Bristol.
under 0.8
0.8 to < 1
1 to < 1.2
over 1.2

64 THE GEOGRAPHY OF THE UK’S CREATIVE AND HIGH-TECH ECONOMIES
The lower intensity threshold (15 per cent as opposed to 30 per cent in the case of the creative industries) for being in a high-tech industry has the consequence that non-specialist/support workers account for a larger proportion of the workforce than in the case of the creative industries, so the change in geographical distributions when comparing STEM employment in the high-tech industries with high-tech industry employment may, depending on the industries involved, be larger than in the case of the creative industries. This helps to explain the more marked differences between the high-tech economy and high-tech industries maps compared with the differences between the creative economy and creative industries maps.
8.3 How the sub-regional distributions of the creative and high-tech economies compare
Tables 8.3.1 and 8.3.2 show the location quotients for the high-tech and creative economies and their components sorted by the 20 NUTS3 areas with the largest creative and high-tech economy location quotients respectively.
TABLE 8.3.1 LOCATION QUOTIENTS FOR THE CREATIVE ECONOMY AND ITS COMPONENTS SORTED BY THE TOP 20 AREAS WITH THE HIGHEST CREATIVE ECONOMY LOCATION QUOTIENTS, UK, AVERAGE 2011-2013
NUTS3 Area Creative Creative Creative specialists industry economy Inner London – East 3.4 2.8 2.5
Inner London – West 3.3 2.6 2.5
Surrey 1.5 1.7 1.7
Brighton and Hove 2.2 1.8 1.7
Outer London - West and North West 1.9 1.9 1.7
Oxfordshire 1.7 1.7 1.7
Buckinghamshire CC 1.5 1.7 1.7
Berkshire 1.2 1.6 1.6
Outer London – South 1.6 1.7 1.6
Edinburgh 1.6 1.4 1.3
Hertfordshire 1.3 1.4 1.3
Bristol 1.6 1.4 1.3
Milton Keynes 1.0 1.1 1.3
Cambridgeshire CC 1.3 1.2 1.2
Hampshire CC 1.0 1.1 1.2
West Sussex 0.9 1.0 1.1
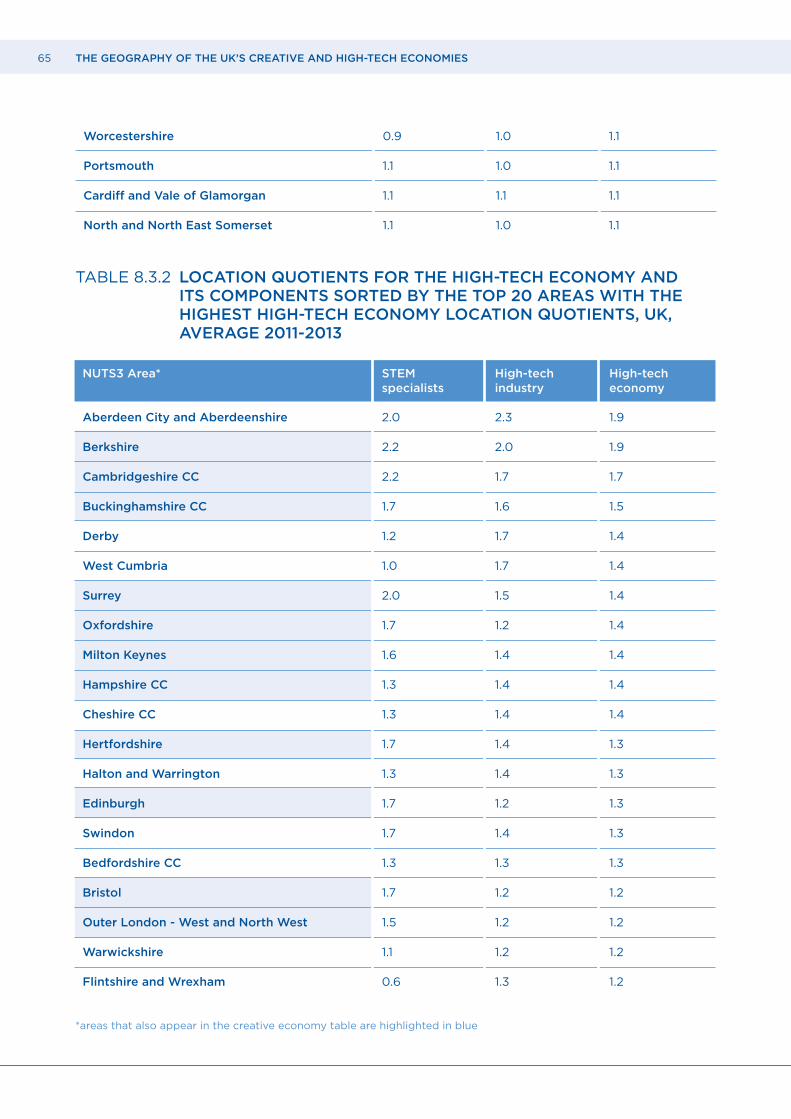
65 THE GEOGRAPHY OF THE UK’S CREATIVE AND HIGH-TECH ECONOMIES
Worcestershire 0.9 1.0 1.1
Portsmouth 1.1 1.0 1.1
Cardiff and Vale of Glamorgan 1.1 1.1 1.1
North and North East Somerset 1.1 1.0 1.1
TABLE 8.3.2 LOCATION QUOTIENTS FOR THE HIGH-TECH ECONOMY AND ITS COMPONENTS SORTED BY THE TOP 20 AREAS WITH THE HIGHEST HIGH-TECH ECONOMY LOCATION QUOTIENTS, UK, AVERAGE 2011-2013
*areas that also appear in the creative economy table are highlighted in blue
NUTS3 Area* STEM High-tech High-tech specialists industry economy Aberdeen City and Aberdeenshire 2.0 2.3 1.9
Berkshire 2.2 2.0 1.9
Cambridgeshire CC 2.2 1.7 1.7
Buckinghamshire CC 1.7 1.6 1.5
Derby 1.2 1.7 1.4
West Cumbria 1.0 1.7 1.4
Surrey 2.0 1.5 1.4
Oxfordshire 1.7 1.2 1.4
Milton Keynes 1.6 1.4 1.4
Hampshire CC 1.3 1.4 1.4
Cheshire CC 1.3 1.4 1.4
Hertfordshire 1.7 1.4 1.3
Halton and Warrington 1.3 1.4 1.3
Edinburgh 1.7 1.2 1.3
Swindon 1.7 1.4 1.3
Bedfordshire CC 1.3 1.3 1.3
Bristol 1.7 1.2 1.2
Outer London - West and North West 1.5 1.2 1.2
Warwickshire 1.1 1.2 1.2
Flintshire and Wrexham 0.6 1.3 1.2

66 THE GEOGRAPHY OF THE UK’S CREATIVE AND HIGH-TECH ECONOMIES
It is immediately apparent from these tables that the creative economy is especially highly concentrated in Inner London in a way that the high-tech economy is not (in fact, Inner London does not even feature in the top 20 location quotients for high-tech).
We might reasonably speculate that this pattern is explained by the fact that high-tech manufacturing industries are in the main more capital-intensive than creative industries, and therefore require more space to operate than is economical in central London. This is less likely to be the case for many digital media and software businesses which are at the nexus of the high-tech and creative economies, such as those that have amassed in Tech City.88 Indeed, it has been argued that such firms are increasingly locating in city centres due to their attractiveness of those locations to the talent they employ, the need to draw on the range of different skills that cities offer, and technological developments, such as cheap cloud storage, which is allowing companies to operate with smaller footprints.89 If we examine the LQs of the intersection of the high-tech and creative economy then the LQ for Inner London East becomes much higher at 1.5, which is consistent with this (although this is not the highest LQ in London). A recent study (KPMG Data Monitor, 2013) using Annual Business Register and Employment Survey (BRES) data, at a lower spatial of resolution (the London borough level) also did not find the tech-cluster in the Old Street area to be that pronounced relative to others in London.90 That study explained this as being due to the London boroughs of Hackney and Islington, having substantial and diverse economies containing many multinational companies, particularly in the financial services, advertising and market research industries. In the case of that study it also considered that the BRES data was likely to under-record start-up activity as it is based on VAT registrations that will omit smaller companies. In the case of the current study the use of APS data, which is based on where workers reside, may also be making it harder to distinguish the existence of the East London tech cluster.
Another location that one might expect to appear in the above list, but which is absent is Manchester (the relevant NUTS3 geographies in this case being Greater Manchester – North, and Greater Manchester – South). These employ a large number of people in the creative economy, with both areas in the top quartile of NUTS3 areas in employment terms. Their absence is partly explained by the fact that London is so prominent in the creative economy thus having a substantive effect on the proportion of those employed in the creative economy in the UK. If London is excluded from the calculation of location quotients, then the LQs of some of the Manchester areas become larger i.e. there is a high proportion of creative employment relative to the rest of the UK, but this is partly hidden by the amount of creative employment in London.
As many as 15 of the 20 areas with the highest location quotients for the creative economy are in London and the South East/East of England area, with the equivalent number for the high-tech economy being ten.
11 of the areas make both top-20 lists: Berkshire, Cambridgeshire, Oxfordshire, Buckinghamshire, Milton Keynes, Surrey, Hertfordshire, Hampshire, and Outer London (West and North-West), and outside the South East of England, Edinburgh and Bristol.
Table 8.3.3 provides further detail on the specialisation profile of different areas, showing areas with high-tech or creative economy LQs greater than 1.2 in one or both of the categories.

67 THE GEOGRAPHY OF THE UK’S CREATIVE AND HIGH-TECH ECONOMIES
TABLE 8.3.3 AREAS WITH CONCENTRATIONS OF EMPLOYMENT IN THE CREATIVE AND HIGH-TECH ECONOMY, UK, AVERAGE 2011-2013
From this we can see a number of areas where there are particularly high concentrations of creative and high–tech employment as a proportion of an area’s workforce relative to their respective shares of the UK workforce:
Of high-tech and creative activity: Berkshire, Cambridgeshire, Oxfordshire, Buckinghamshire, Surrey, Hertfordshire, Milton Keynes and Edinburgh, Bristol, West and North West Outer London.
NUTS3 High-tech only Creative only Creative and High-tech (Creative LQ, High-tech LQ) Surrey 1.68 , 1.43
Oxfordshire 1.66 , 1.40
Outer London - West and North West 1.66 , 1.21
Buckinghamshire CC 1.65 , 1.49
Berkshire 1.57 , 1.87
Hertfordshire 1.32 , 1.33
Edinburgh 1.32 , 1.31
Bristol 1.27 , 1.24
Cambridgeshire CC 1.25 , 1.66
Milton Keynes 1.25 , 1.38
Inner London - East 2.49
Inner London - West 2.45
Brighton and Hove 1.67
Outer London - South 1.55
Aberdeen City & Aberdeenshire 1.88
Derby 1.45
West Cumbria 1.44
Hampshire CC 1.37
Cheshire CC 1.35
Halton and Warrington 1.31
Swindon 1.29
Bedfordshire CC 1.29
Warwickshire 1.21
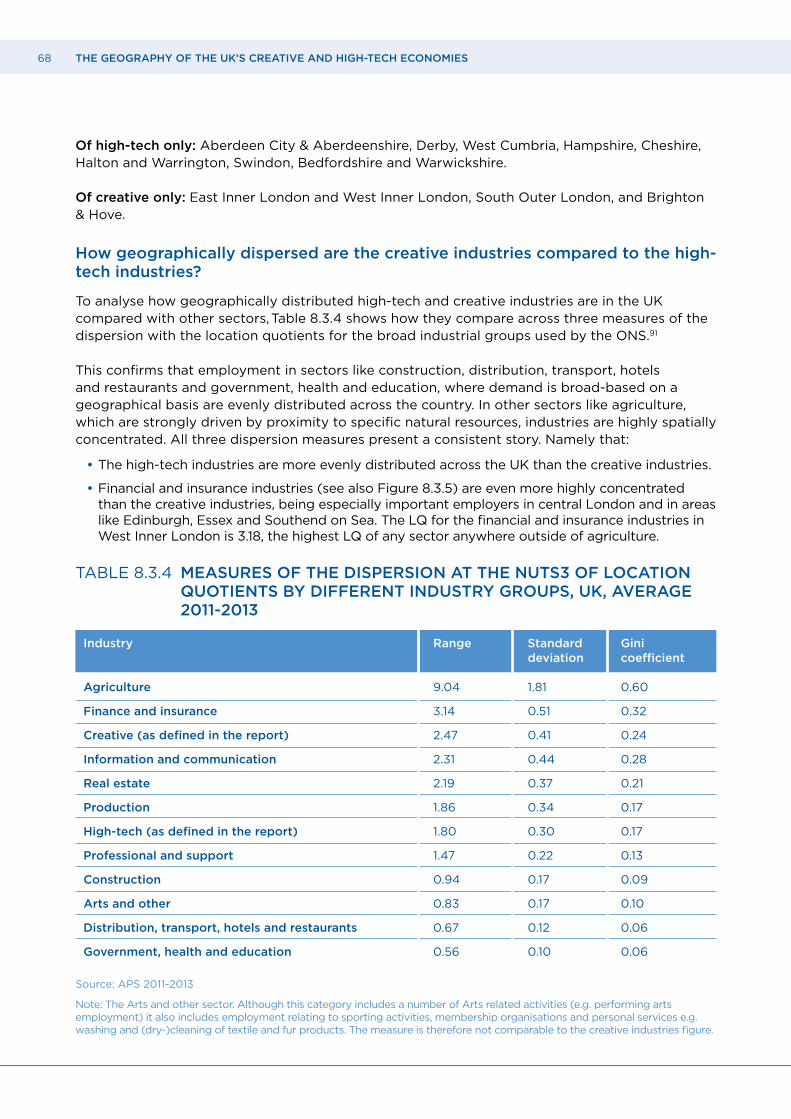
68 THE GEOGRAPHY OF THE UK’S CREATIVE AND HIGH-TECH ECONOMIES
Of high-tech only: Aberdeen City & Aberdeenshire, Derby, West Cumbria, Hampshire, Cheshire, Halton and Warrington, Swindon, Bedfordshire and Warwickshire.
Of creative only: East Inner London and West Inner London, South Outer London, and Brighton & Hove.
How geographically dispersed are the creative industries compared to the high-tech industries?
To analyse how geographically distributed high-tech and creative industries are in the UK compared with other sectors, Table 8.3.4 shows how they compare across three measures of the dispersion with the location quotients for the broad industrial groups used by the ONS.91
This confirms that employment in sectors like construction, distribution, transport, hotels and restaurants and government, health and education, where demand is broad-based on a geographical basis are evenly distributed across the country. In other sectors like agriculture, which are strongly driven by proximity to specific natural resources, industries are highly spatially concentrated. All three dispersion measures present a consistent story. Namely that:
• The high-tech industries are more evenly distributed across the UK than the creative industries.
• Financial and insurance industries (see also Figure 8.3.5) are even more highly concentrated than the creative industries, being especially important employers in central London and in areas like Edinburgh, Essex and Southend on Sea. The LQ for the financial and insurance industries in West Inner London is 3.18, the highest LQ of any sector anywhere outside of agriculture.
TABLE 8.3.4 MEASURES OF THE DISPERSION AT THE NUTS3 OF LOCATION QUOTIENTS BY DIFFERENT INDUSTRY GROUPS, UK, AVERAGE 2011-2013
Source: APS 2011-2013
Note: The Arts and other sector. Although this category includes a number of Arts related activities (e.g. performing arts employment) it also includes employment relating to sporting activities, membership organisations and personal services e.g. washing and (dry-)cleaning of textile and fur products. The measure is therefore not comparable to the creative industries figure.
Industry Range Standard Gini deviation coefficient Agriculture 9.04 1.81 0.60
Finance and insurance 3.14 0.51 0.32
Creative (as defined in the report) 2.47 0.41 0.24
Information and communication 2.31 0.44 0.28
Real estate 2.19 0.37 0.21
Production 1.86 0.34 0.17
High-tech (as defined in the report) 1.80 0.30 0.17
Professional and support 1.47 0.22 0.13
Construction 0.94 0.17 0.09
Arts and other 0.83 0.17 0.10
Distribution, transport, hotels and restaurants 0.67 0.12 0.06
Government, health and education 0.56 0.10 0.06

69 THE GEOGRAPHY OF THE UK’S CREATIVE AND HIGH-TECH ECONOMIES
FIGURE 8.3.5 GEOGRAPHICAL DISTRIBUTION OF EMPLOYMENT IN THE FINANCE AND INSURANCE INDUSTRIES (LOCATION QUOTIENTS)
under 0.8
0.8 to < 1
1 to < 1.2
over 1.2

70 THE GEOGRAPHY OF THE UK’S CREATIVE AND HIGH-TECH ECONOMIES
KEY FINDINGS
• The creative economy is an especially important employer in Inner London and in the counties surrounding London. While the creative industries are relatively geographically concentrated across the UK compared with many other sectors, they are less concentrated than sectors like financial and insurance services, and agriculture.
• The high-tech economy, although found in many of the same areas as the UK’s creative economy, is more evenly distributed around the country. This partly reflects the fact that it contains a number of industries that are centred outside London and the South East.
• The colocation of the creative and high-tech economies and its concentration in the South East of England is not wholly explained by the ICT-related occupations and industries that commonly make them up. It also reflects a tendency for creative activities and high-tech activities more generally to collocate (echoing the earlier finding by Chapain et al, 2010).
• In the European NUTS3 sub-regional geography:
1. Counties identified as being those where the creative and high-tech economies account for a particularly high proportion of jobs are:
• High-tech and creative: Berkshire, Cambridgeshire, Oxfordshire, Buckinghamshire, Hertfordshire and Surrey.
• High-tech only: Aberdeenshire & Aberdeen City, Cheshire, Hampshire, West Cumbria and Bedfordshire and Warwickshire.
2. Unitary authorities/Urban areas identified as being where the creative and high-tech economies both account for a particularly high proportion of jobs are:
• High-tech and creative: Bristol, Edinburgh, Outer London (West and North West) and Milton Keynes.
• High-tech only: Derby, Swindon, Halton and Warrington.
• Creative only: Inner London, South Outer London and Brighton & Hove.

71 THE GEOGRAPHY OF THE UK’S CREATIVE AND HIGH-TECH ECONOMIES
9 CONCLUSIONS AND NEXT STEPS
CONCLUSIONS
Size of the creative and high-tech economies • Creative There were 2.6 million jobs in the UK’s creative economy in 2013. This consisted
of 1.71 million jobs in the creative industries (890,000 in creative occupations and 818,000 working in other roles) and 907,000 jobs in creative occupations outside of the creative industries.
• High-tech There were 3.2 million jobs in the UK’s high-tech economy in 2013. This consisted of around 2.4 million jobs in high-tech industries (825,000 in STEM (Science, Technology, Engineering and Mathematics) occupations and approximately 1.6 million in other roles) and 806,000 jobs in STEM occupations outside of the high-tech industries.
Growth of the creative and high-tech economies• Creative Employment in the creative economy on average grew at 4.3 per cent p.a. 3.6 times
faster than the workforce as a whole (1.2 per cent p.a.) between 2011 and 2013. Employment in creative industries grew faster still, at over four times the rate of the workforce. This was driven by strong growth in both creative occupations employed in creative industries (4.3 per cent p.a.) and in those employed in other occupations in creative industries (5.8 per cent p.a.).
• High-tech At 2.1 per cent p.a., employment in the high-tech economy also grew faster than the workforce as a whole between 2011 and 2013. High-tech industry employment grew on average by 1.5 per cent p.a., more slowly than the rate of growth in STEM occupations of 3.1 per cent p.a. (Within this the rate of growth of STEM occupations outside the high-tech industries (3.7 per cent p.a.) was faster than that for those employed in high-tech industries (2.5 per cent p.a.)).
The intersection of the creative and high-tech economies
The figures below are the average of 2011-2013 data
• There were on average 0.46 million jobs in dual creative-STEM occupations in 2011-2013, accounting for 2.3 per cent of London’s workforce, 2.1 per cent of the workforce in the South-East, and 1.7 per cent of the workforce in the East of England respectively. These were the only regions where the proportion of employment was higher than the level in the UK as a whole of 1.5 per cent.
• There were 0.54 million jobs in industries that were both creative and high-tech. They accounted for 2.8 per cent of the workforce in the South East of England, 2.7 per cent of the workforce in London and 2.1 per cent of the workforce in the East of England.
• 0.87 million jobs fell within both the high-tech and creative economies.
• This part of the workforce has been particularly fast-growing, at 8.0 per cent p.a. on average over the period 2011-2013. Within this, those ICT-related industries that can be considered as both creative and high-tech were particularly dynamic, growing at 9.6 per cent p.a.

72 THE GEOGRAPHY OF THE UK’S CREATIVE AND HIGH-TECH ECONOMIES
Regional geography of the creative and high-tech economies
The high-tech and creative economies are disproportionately important employers in the Greater South East of England (London, East of England and South East) relative to the share that these sectors are of the UK workforce. The significance of London is even more pronounced in the case of the UK’s creative economy than it is in the high-tech economy.
Interestingly, in recent years the creative economy employment has – Scotland’s aside – been growing faster in regions outside London than it has in the capital itself.
Creative• London and the South East of England account for 43 per cent of employment in the UK’s
creative economy.
• The creative economy employs 15.5 per cent of London’s workforce, 10.7 per cent of the South East’s workforce, and 8.4 per cent of the East of England workforce. Previous research suggests that the prominence of London is likely explained by strong agglomeration effects associated with London’s size and with its status as a world city.
• The creative economy has been growing most rapidly in areas outside London between 2011-2013, particularly in the East of England, West Midlands, North East, and Yorkshire and the Humberside. Scotland is the only area where the creative economy has shrunk.
High-tech • The South East of England and London account for 31 per cent of employment in the UK’s
high-tech economy.
• The high-tech economy employs 12.8 per cent of the South East’s workforce and 11.2 per cent of the East of England’s workforce. In contrast to the creative economy, this measure of the importance of high-tech to London’s workforce is slightly behind Scotland, at 10.6 per cent compared with 10.9 per cent respectively.
• The regions/DNAs with the fastest growing employment in the high-tech economy over the 2011-2013 periods are: Scotland, Yorkshire and Humberside, London and the West Midlands.
Sub-regional geography of the high-tech and creative economy
In the European NUTS3 sub-regional geography:
• Counties identified as being those where the high-tech and creative economies are particularly important employers as a proportion of the geographies’ workforce are:
• High-tech and creative: Berkshire, Cambridgeshire, Oxfordshire, Buckinghamshire, Hertfordshire and Surrey.
• High-tech only: Aberdeenshire & Aberdeen City, Cheshire, Hampshire, West Cumbria, Bedfordshire and Warwickshire
• Unitary authorities/Urban areas identified as being where the high-tech and creative economies are particularly important employers as a proportion of the geographies’ workforce are:
• High-tech and creative: Bristol, Edinburgh, Outer London (West and North West) and Milton Keynes.
• High-tech only: Derby, Swindon and Halton & Warrington.
• Creative only: Inner London (East and West), South Outer London, Brighton & Hove.
73 THE GEOGRAPHY OF THE UK’S CREATIVE AND HIGH-TECH ECONOMIES
DISCUSSION AND NEXT STEPS
• The creative and high-tech industries have captured the imagination of policymakers in describing segments of the economy which are believed to display high levels of job creation, innovation and economic growth. However, conceptual ambiguities and the insufficient regard to transparent classifications that has beset these areas have hindered the design and evaluation of effective policies. Policymakers have been seemingly happy to use the terms ‘industries’ and ‘economy’ interchangeably, and employ inconsistent classifications that have made it impossible to track progress across key parts of the economy and over time.
• The definitional uncertainties are great, meaning that sensitivity analysis is critical,92 but in the baseline classifications adopted in this report employment in both the creative and high-tech economies since 2010 has been rapid, and much faster than in the UK workforce as a whole. Classification changes from SOC2000 to SOC2010 in the occupational codes precluded a historical analysis going back further in time during the writing of this report. The Office for National Statistics should give greater attention to how longer time-series for industrial and occupational analysis can be constructed when classification systems change (ideally this would include back coding a sample of individual survey responses using revised codes).
• The APS data we have employed in this study has enabled us to reveal the size, growth and geography of the UK’s creative and high-tech economies. In further research we are using the data to investigate the extent of possible knowledge spillovers from creative/high-tech activities on those working in other fields.93 Insofar as knowledge spillovers are associated with sub-optimally low levels of investment in knowledge – that is, they give rise to a market or systems failure – this may justify some form of policy intervention.
• Despite its large sample size, the APS is however a sample survey which limits its use at microspatial units of geography. The Household Census in principle provides a solution to this problem, but in practice is of limited use for our analysis. First, because the data is only available for 200 industry sectors at a mixture of 2-, 3- and 4-digit levels (this compares with the SIC07 standard of 617 codes available at 4 digits, of which 603 are used in the APS), which places major constraints on the ability of researchers to identify creative and high-tech industries in the Census data. Second, we cannot undertake regional analysis on Census data as the ONS has not released 4-digit occupational data within the 3-digit industry employment tables released at regional or sub-regional level. These restrictions severely limit the use of Census data for industrial policy analysis (a marked contrast with the US where the Household Census has been used in a multitude of influential studies of occupation and industry dynamics), and should be addressed by the ONS in its future work on the Census.
74 THE GEOGRAPHY OF THE UK’S CREATIVE AND HIGH-TECH ECONOMIES
10 GLOSSARY
Creative Economy Those employed in creative industries (either in creative occupations or other roles) and those employed in creative occupations outside the creative industries.
Creative Industries Industries defined as creative under the Department for Culture Media and Sport (DCMS) definitions. These are set out in Appendix 2 (Table A2.1).
Creative Non-specialist Someone employed in the creative industries in an occupation which is not creative on the definition below.
Creative Occupations Occupations defined as being creative under the set of SOC codes in the Department for Culture Media and Sport definition set out in Appendix 1 (Table A1.1).
Creative Specialist Someone employed in a creative industry in a creative occupation.
Crosswalk A mapping between a set of occupational (or industrial classifications) done on a different basis e.g. SIC2007 and SIC2003.
DM, Dynamic Mapping The report which introduced the Dynamic Mapping approach. Bakhshi, H., Freeman, A. and Higgs, P. (2013) ‘A Dynamic Mapping of the UK’s Creative Industries.’ London: Nesta.
Embedded Creative Someone employed in a creative occupation outside of the creative industries.
Embedded STEM worker Someone employed in a STEM occupation outside of the high-tech industries. STEM occupations being defined below.
High-tech Economy Those employed in high-tech industries (either in STEM occupations or other roles) and those employed in STEM occupations outside of the high-tech industries.
High-tech Industries Industries which have a STEM occupation intensity in excess of a threshold of 15 per cent, subject to passing the 4,000 employment robustness test (in our baseline classification). Set out in Appendix 2 (Table A2.2.).
High-tech Non-specialist Someone employed in a high-tech industry who is not in a STEM occupation.

75 THE GEOGRAPHY OF THE UK’S CREATIVE AND HIGH-TECH ECONOMIES
Microspatial Clustering Small-scale clusters that form at spatial levels that may be below existing standardised geographies, for example a block of streets.
The Standard Industrial Classification (SIC) This is a means of classifying businesses according to the type of economic activity that they are engaged in. The latest version of SIC codes in the UK is SIC 2007, which superseded SIC 2003.
The Standard Occupational Classification (SOC) This is a means of classifying the occupation of a person according to the work they do and the skill level required.
STEM occupation An occupation that involves the use of Science, Technology, Engineering and Mathematics (STEM). The STEM occupational definition used in this report are set out in Appendix 1 (Table A1.2).
STEM Specialist Someone who is working in a STEM occupation in a high-tech industry.
Creative/STEM intensity The proportion of industry employment that is in the set of occupations considered as creative or STEM.

76 THE GEOGRAPHY OF THE UK’S CREATIVE AND HIGH-TECH ECONOMIES
11 REFERENCES
Autor, D., Levy, F. and Murnane, R.J. (2003) The skill content of recent technological change: an empirical exploration. ‘Quarterly Journal of Economics.’ 118(4), November 2003.
Bakhshi, H., Freeman, A. and Higgs, P. (2013) ‘A Dynamic Mapping of the UK’s Creative Industries’ London: Nesta.
Bakhshi, H., Hargreaves, I. and Mateos-Garcia, J. (2013) ‘A Manifesto for the Creative Economy.’ London: Nesta.
Bakhshi, H., Lee, N. and Mateos-Garcia, J. (2013) ‘Capital of Culture? An econometric analysis of the relationship between arts and cultural clusters, wages and the creative economy in English cities.’ In Rushton (ed.) ‘Creative Communities: Art Works in Economic Development.’ Washington DC: Brookings Institution Press.
Bay Area Council Economic Institute Report (2012) ‘Technology Works: High-Tech Employment and Wages in the United States.’ San Francisco CA: Bay Area Council Economic Institute.
Beaverstock, J.V., Smith, R.G. and Taylor, P.J. (1999) A Roster of World Cities. ‘Cities.’ Vol. 16, Number 6, December 1999, pp. 445-458(14). Elsevier.
BIS (2012) ‘BIS industrial strategy: UK Sector analysis.’ London: BIS.
BIS (2011) ‘STEM graduates in non-STEM jobs.’ London: BIS.
BLS (2010) ‘Options for defining STEM (Science, Technology, Engineering, and Mathematics) occupations under the 2010 Standard Occupational Classification (SOC) system: SOC Policy Committee recommendation to the Office of Management and Budget (OMB).’ Washington DC: Bureau of Labor Statistics.
BOP (2014) ‘World Cities Culture Report.’ London: Burns Owen Partnership.
Brinkley, I. (2006) ‘Defining the knowledge economy.’ London: The Work Foundation.
Caves, R. E. (2002) ‘Creative Industries: Contracts Between Art and Commerce.’ Cambridge, MA: Harvard University Press.
Chapain et al., (2010) ‘Creative clusters and innovation.’ London: NESTA.
Chapple, K., Markusen, A., Schrock, G. and Yamamoto, Y. (2004) Gauging metropolitan “high-tech” and “I-tech” activity. ‘Economic Development Quarterly.’ 18 (1).
Cox, G. (2005) ‘The Cox Review of Creativity in Business: Building on the UK’s Strengths.’ HM Treasury e-Comms Team.

77 THE GEOGRAPHY OF THE UK’S CREATIVE AND HIGH-TECH ECONOMIES
Cunningham, S. (2014) ‘Creative Labour, Creative Services, and Embedded Creatives.’ In Hearn, G., Bridgstock, R., Goldsmith, B. and Rodgers, J. (2014) ‘Creative Work beyond the Creative Industries: Innovation, Employment, and Education.’ Cheltenham: Edward Elgar.
Currid, E. and Stolarick, K. (2010) ‘The Occupation-Industry Mismatch: New Trajectories for Regional Cluster Analysis and Implications for Economic Development. ‘Urban Studies.’ 47(2).
DCMS (1998) ‘Creative Industries Mapping Document 1998.’ London: DCMS.
DCMS (2001) ‘Creative Industries Mapping Document 1998.’ London: DCMS.
DCMS (2010) ‘December 2011 Creative Industries Economic Estimates (Experimental).’ London: DCMS.
DCMS (2011) ‘December 2011 Creative Industries Economic Estimates.’ London: DCMS.
DCMS (2014) ‘Creative Industries Economic Estimates, January’, London: DCMS.
DCMS (2015) ‘Creative Industries Economic Estimates, January’, London: DCMS.
Deroin, V. (2011) ‘European Statistical Works on Culture: ESSnet-Culture Final report, 2009-2011.’
DFES (2006) ‘The Supply And Demand for Science, Technology, Engineering And Mathematics Skills In The UK Economy.’ London: DFES.
DIUS (2009) ‘The Demand for Science, Technology, Engineering and Mathematics (STEM) Skills.’ London: Department for Innovation Universities and Skills.
DTI (2006) ‘Science, Engineering and Technology skills in the UK.’ London: DTI.
Dyson, J. (2010) ‘Ingenious Britain. Making the UK the leading High-tech exporter in Europe.’
Echeverri-Carroll, E. and Ayala, S. (2009) Wage differentials and the spatial concentration of high-technology industries. ‘Papers in Regional Science.’ Vol. 88, Issue 3, pages 623-641.
e-Skills UK, Intellect, BCS (2013) ‘Information Economy Economic estimates 2013’.
Eurostat, Aggregations of manufacturing and services based on NACE Rev 1.1.
Falk, R., Bakhshi, H., Falk, M., Geiger, W., Karr, S., Keppel, C., Leo, H. and Spitzlinger, R. (2011) ‘Innovation and Competitiveness of the Creative Industries.’ Vienna: Austrian Institute of Economic Research.
Florida, R. (2002) ‘The Rise of the Creative Class.’ New York: Basic Books.
Freeman, A. (2004) ‘London’s Creative Sector. 2004 Update.’ London: Greater London Authority.
Freeman, A. (2008a) ‘Culture, Creativity and Innovation in the Internet Age.’ Presented to the conference on IPR, Birkbeck College, May 2008.
78 THE GEOGRAPHY OF THE UK’S CREATIVE AND HIGH-TECH ECONOMIES
Freeman, A. (2008b) ‘Benchmarking and Understanding London’s Cultural and Creative Industries.’ Presented to the conference of the Canadian Conference Board on Creative Industries, March 2008.
Freeman, A. (2009) ‘Creative Industries 2009 Update.’ London: Greater London Authority.
Freeman, A. and Cheshire, P. (2006) ‘Defining and Measuring Metropolitan Regions: a rationale.’ Paris: OECD.
Freeman, A. and Urwin, P. (2003) ‘The GLA’s London Workforce Employment Series.’ London: Greater London Authority.
Frey, C. B. and Osborne, M.A. (2013) ‘The Future of Employment: How Susceptible Are Jobs To Computerisation?’ Oxford: Oxford Martin School, Programme on the Impacts of Future Technology, University of Oxford.
Garnham, N. (2005) From Cultural to Creative Industries: An analysis of the implications of the “creative industries” approach to arts and media policymaking in the United Kingdom. ‘International Journal of Cultural Policy.’ 11(1).
Gibbon, C. (2011) ‘How much can the creative industries contribute to regional development in Britain?’ London: Burns Owen Partnership.
Goodridge, P., Haskel, J. and Wallis, G. (2012), ‘UK Innovation Index: Productivity and Growth in UK Industries.’ Nesta Working Paper 12/09. London: Nesta.
Gordon, J. C. and Beilby-Orrin, H. (2001) ‘International Measurement of the Economic and Social Importance of Culture.’ Paris: Statistics Directorate, OECD.
Government Office for Science (2010) ‘Technology and Innovation Futures: UK Growth Opportunities for the 2020s’. London: Government Office for Science.
Growth Analysis (2009) ‘Cultural industries in Swedish statistics: proposal on delimitation for future mappings.’ Ostersund: Growth Analysis.
Greenwood, C., Harrison, M. and Vignoles, A. (2011) ‘The labour market value of STEM qualifications and occupations.’ London: Institute of Education.
Hadlock, P., Hecker, D. and Gannon, J. (1991) High technology employment: another view. ‘Monthly Labor Review.’ July 1991, pp. 26–30.
Hecker, D.E. (2005) High-technology employment: a NAICS-based update. ‘Monthly Labour Review.’ U.S. Bureau of Labor Statistics.
Hecker, D.E. (1999) High-technology employment: a broader view. ‘Monthly Labor Review.’ June 1999, pp. 18–28. U.S. Bureau of Labor Statistics.
Higgs, P., Cunningham, S. and Bakhshi, H. (2008) ‘Beyond the Creative Industries: Mapping the Creative Economy in the United Kingdom.’ London: NESTA.

79 THE GEOGRAPHY OF THE UK’S CREATIVE AND HIGH-TECH ECONOMIES
Higgs, P., Cunningham, S., Hearn, G., Adkins, B. and Barnett, K. (2005) ‘The Ecology of Queensland Design.’ Technical Report, CIRAC. Brisbane: Queensland University of Technology.
HM Treasury and BIS (2011) ‘The plan for growth’. London: HM Treasury and BIS.
HM Government (2013) ‘Information Economy Strategy’. London: HM Government.
ISIC (2002) ‘International Standard Industrial Classification of All Economic Activities (ISIC) Revision 3.1.’ New York: United Nations.
KPMG and Tech Monitor UK (2013) ‘Understanding tech clusters and tracking the UK tech sector’s outlook for employment and growth.’
Luker, W. and Lyons, D. (1997) Employment shifts in high-technology industries, 1988–96. ‘Monthly Labor Review.’ June 1997, pp. 12–25.
Mateos-Garcia, J., Bakhshi, H. and Lenel, M. (2014) ‘A Map of the UK Games Indusrty.’ London: Nesta and Ukie.
McLuhan, M. (1964) ‘Understanding Media: The Extensions of Man.’ New York NY: McGraw-Hill.
Moretti, E. (2013) ‘The New Geography of Jobs.’ Boston MA: Mariner.
Nathan, M. and Vandore, E. (2014) Here Be Startups: Exploring a young digital cluster in Inner East London. Forthcoming in ‘Environment and Planning.’
NSF (1988) ‘Science and Technology Resources in U.S. Industry, special report.’ Arlington, VA: National Science Foundation. pp. 88-231.
OECD (1996) ‘The Knowledge-based Economy.’ Paris: OECD.
OECD (2002) ‘Frascati Manual: Proposed Standard Practice for Surveys on Research and Experimental Development.’ Paris: OECD.
OECD (2005) ‘Oslo Manual: The Measurement of Science and Technological Activities, Proposed Guidelines for Collecting and Interpreting Technological Innovation Data.’ Paris: OECD.
OECD Directorate for Science, Technology and Industry (2011) ‘ISIC rev.3 Technology intensity definition.’ Paris: OECD.
OHIM (2013) ‘Intellectual property rights intensive industries: contribution to economic performance and employment in the European Union. Industry-Level Analysis Report.’ Brussels: Office for Harmonization in the Internal Market.
Office of Technology Policy (2000) ‘The Dynamics of Technology-Based Economic Development, State Science and Technology Indicators.’ 4th ed. Washington DC: U.S. Department of Commerce.
ONS (2007) ‘The Standard Industrial Classification 2007.’ (UK SIC 2007). Newport: ONS.
ONS (2010) ‘Standard Occupational Classification 2010.’ (UK SOC 2010). Newport: ONS.
80 THE GEOGRAPHY OF THE UK’S CREATIVE AND HIGH-TECH ECONOMIES
ONS (2011) ‘Labour Force Survey User Guide volume 1 – LFS background and methodology’. Newport: ONS.
Perez, C. (2010) ‘Technological Revolutions and Financial Capital: The Dynamics of Bubbles and Golden Ages.’ Cheltenham: Edward Elgar.
Riche, R. W., Hecker, D.E. and Burgan, J.U. (1983) High technology today and tomorrow: a small slice of the employment pie. ‘Monthly Labor Review.’ November, 1983, pp. 50–58.
Rothwell, J. (2013) ‘The hidden STEM economy.’ Washington DC: Brooking Institution Metropolitan Program.
Santos Cruz, S. and Teixeira, A. (2012) ‘Methodological approaches for measuring the creative employment: a critical appraisal with an application to Portugal.’ FEP Working Papers No. 455.
Stoneman, P. (2010) ‘Soft Innovation: Economics, Product Aesthetics, and the Creative Industries.’ Oxford: Oxford University Press.
UKCES (2011) ‘The Supply of and demand for High-Level STEM skills.’ and UKCES (2013) ‘Supply of and demand for High-Level STEM skills.’ London: UKCES.
UKCES (2013) ‘Supply of and demand for High-Level STEM skills.’ London: UKCES.
UNESCO (2009) ‘Framework for Cultural Statistics.’ UNESCO Institute for Statistics. Paris: UNESCO.
United Nations (2010) ‘Creative Economy Report 2010.’ Geneva: United Nations.
U.S. Congress, Office of Technology Assessment (1982) ‘Technology, Innovation, and Regional Economic Development.’ Washington DC: U.S. Congress, Office of Technology Assessment.
USPTO (2012) ‘Intellectual Property and the U.S. Economy: Industries in Focus.’ Alexandria VA: USPTO.
Westlake, S. (2013) Rebalancing Act: Rationales and Policies for Sectoral Economic Rebalancing. ‘Oxford Review of Economic Policy.’
Willets, D. (2012) ‘Our High-tech future.’ speech.
Willets, D. (2013) ‘Eight great technologies.’ Speech at Policy Exchange.
WIPO (2003) Guide on Surveying the Economic Contribution of the Copyright-Based Industries. Geneva: WIPO.
WIPO (2004) ‘The Economic Contribution of Copyright-Based Industries in the USA.’ Creative Industries Series No. 1. Geneva: WIPO.
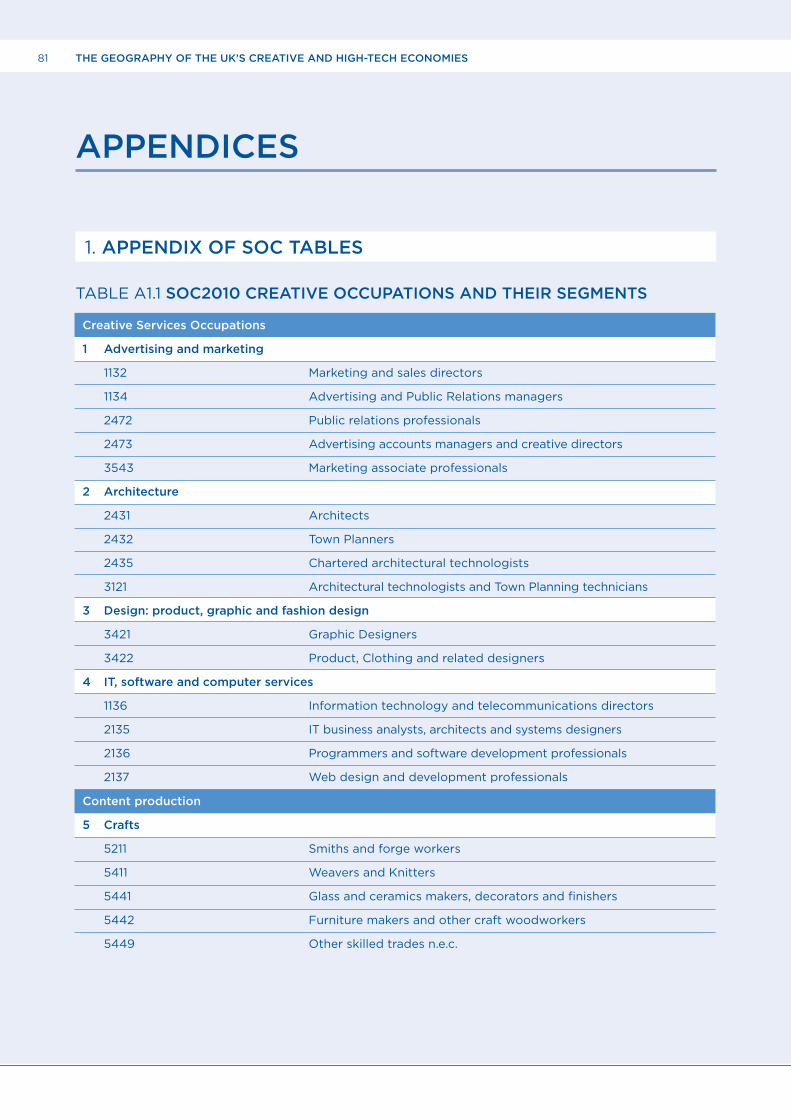
81 THE GEOGRAPHY OF THE UK’S CREATIVE AND HIGH-TECH ECONOMIES
APPENDICES
1. APPENDIX OF SOC TABLES
TABLE A1.1 SOC2010 CREATIVE OCCUPATIONS AND THEIR SEGMENTS
Creative Services Occupations
1 Advertising and marketing
1132 Marketing and sales directors
1134 Advertising and Public Relations managers
2472 Public relations professionals
2473 Advertising accounts managers and creative directors
3543 Marketing associate professionals
2 Architecture
2431 Architects
2432 Town Planners
2435 Chartered architectural technologists
3121 Architectural technologists and Town Planning technicians
3 Design: product, graphic and fashion design
3421 Graphic Designers
3422 Product, Clothing and related designers
4 IT, software and computer services
1136 Information technology and telecommunications directors
2135 IT business analysts, architects and systems designers
2136 Programmers and software development professionals
2137 Web design and development professionals
Content production
5 Crafts
5211 Smiths and forge workers
5411 Weavers and Knitters
5441 Glass and ceramics makers, decorators and finishers
5442 Furniture makers and other craft woodworkers
5449 Other skilled trades n.e.c.

82 THE GEOGRAPHY OF THE UK’S CREATIVE AND HIGH-TECH ECONOMIES
6 Film, TV, video, radio and photography
3416 Arts officers, producers and directors
3417 Photographers, audio-visual and broadcasting equipment operators
7 Publishing
2471 Journalists, newspaper and periodical editors
3412 Authors, Writers
8 Museums, galleries and libraries
2451 Librarians
2452 Archivists and curators
9 Music, performing and visual arts
3411 Artists
3413 Actors, Entertainers
3414 Dancers and Choreographers
3415 Musicians
TABLE A1.2 SOC2010 STEM OCCUPATIONS
Code Description
Engineering Occupations
2121 Civil engineers
2122 Mechanical engineers
2123 Electrical engineers
2124 Electronics engineers
2126 Design and Development engineers
2127 Production and process engineers
2129 Engineering professionals n.e.c.
2434 Chartered surveyors
IT Occupations
1136 Information technology and telecommunications directors
2133 IT specialist managers
2135 IT business analysts, architects and systems designers
2136 Programmers and software development professionals
2137 Web design and development professionals
2139 Information technology and telecommunications professionals
Science Occupations
2111 Chemical scientists
2112 Biological scientists and biochemists
2113 Physical scientists

83 THE GEOGRAPHY OF THE UK’S CREATIVE AND HIGH-TECH ECONOMIES
2119 Natural and social science professionals n.e.c.
2141 Conservation professionals
2142 Environment professionals
2150 Research and development managers
2425 Actuaries, economists and statisticians (includes mathematicians)
TABLE A1.3 RELATIONSHIP BETWEEN CREATIVE AND STEM OCCUPATIONS
Code Description STEM also?
CREATIVE OCCUPATIONS
Creative Services Occupations
1 Advertising and marketing
1132 Marketing and sales directors No
1134 Advertising and Public Relations managers No
2472 Public relations professionals No
2473 Advertising accounts managers and creative directors No
3543 Marketing associate professionals No
2 Architecture
2431 Architects No
2432 Town Planners No
2435 Chartered architectural technologists No
3121 Architectural technologists and Town Planning No technicians
3 Design: product, graphic and fashion design
3421 Graphic Designers No
3422 Product, Clothing and related designers No
4 IT, software and computer services
1136 Information technology and telecommunications Yes directors
2135 IT business analysts, architects and systems designers Yes
2136 Programmers and software development professionals Yes
2137 Web design and development professionals Yes
Content production
5 Crafts
5211 Smiths and forge workers No
5411 Weavers and Knitters No
5441 Glass and ceramics makers, decorators and finishers No
5442 Furniture makers and other craft woodworkers No
5449 Other skilled trades n.e.c. No
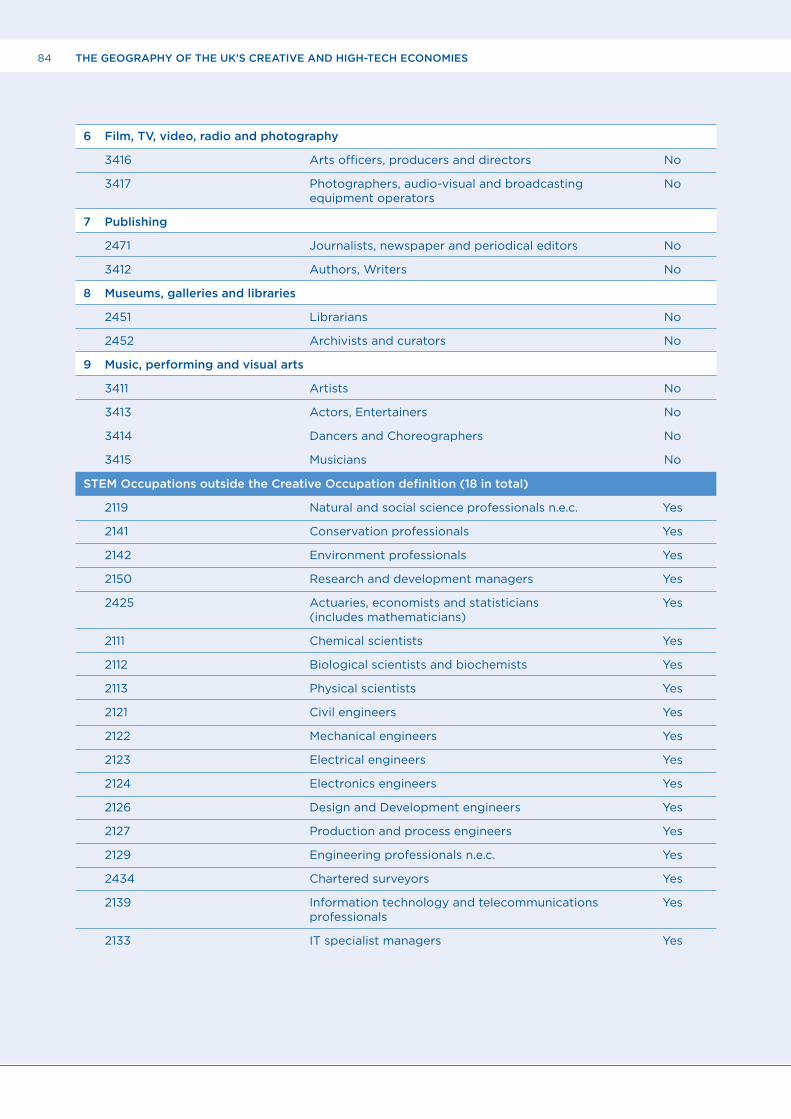
84 THE GEOGRAPHY OF THE UK’S CREATIVE AND HIGH-TECH ECONOMIES
6 Film, TV, video, radio and photography
3416 Arts officers, producers and directors No
3417 Photographers, audio-visual and broadcasting No equipment operators
7 Publishing
2471 Journalists, newspaper and periodical editors No
3412 Authors, Writers No
8 Museums, galleries and libraries
2451 Librarians No
2452 Archivists and curators No
9 Music, performing and visual arts
3411 Artists No
3413 Actors, Entertainers No
3414 Dancers and Choreographers No
3415 Musicians No
STEM Occupations outside the Creative Occupation definition (18 in total)
2119 Natural and social science professionals n.e.c. Yes
2141 Conservation professionals Yes
2142 Environment professionals Yes
2150 Research and development managers Yes
2425 Actuaries, economists and statisticians Yes (includes mathematicians)
2111 Chemical scientists Yes
2112 Biological scientists and biochemists Yes
2113 Physical scientists Yes
2121 Civil engineers Yes
2122 Mechanical engineers Yes
2123 Electrical engineers Yes
2124 Electronics engineers Yes
2126 Design and Development engineers Yes
2127 Production and process engineers Yes
2129 Engineering professionals n.e.c. Yes
2434 Chartered surveyors Yes
2139 Information technology and telecommunications Yes professionals
2133 IT specialist managers Yes
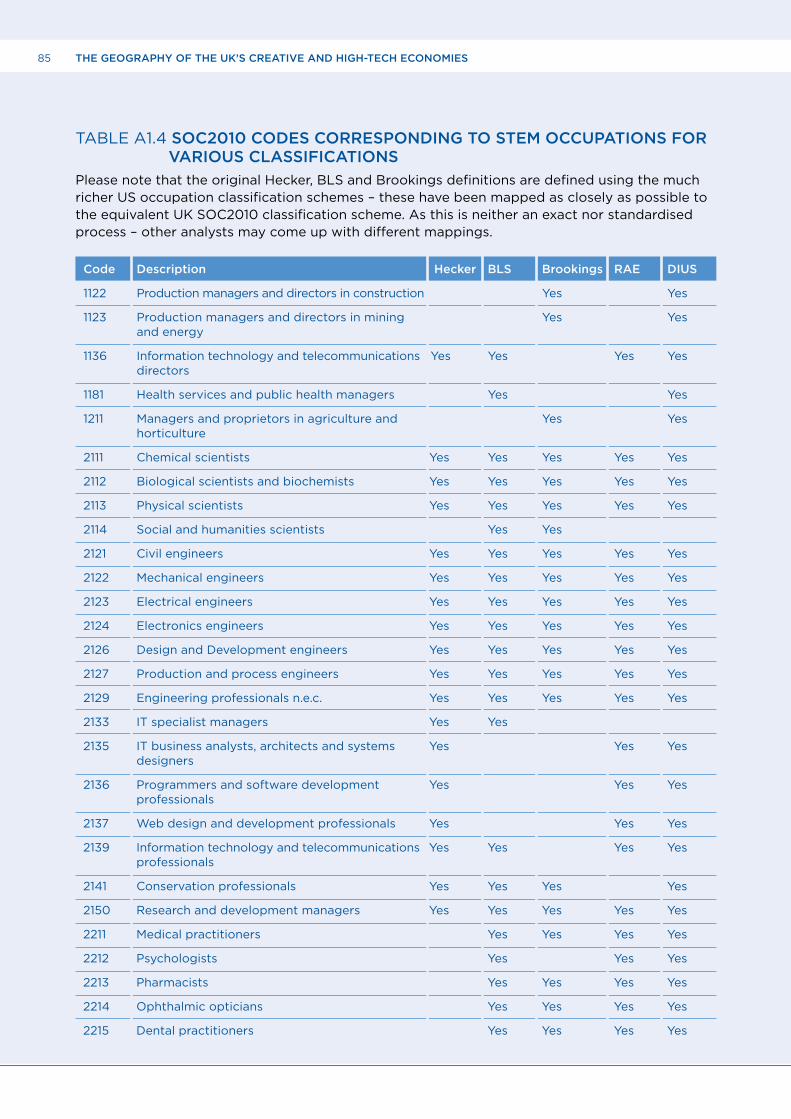
85 THE GEOGRAPHY OF THE UK’S CREATIVE AND HIGH-TECH ECONOMIES
TABLE A1.4 SOC2010 CODES CORRESPONDING TO STEM OCCUPATIONS FOR VARIOUS CLASSIFICATIONS
Please note that the original Hecker, BLS and Brookings definitions are defined using the much richer US occupation classification schemes – these have been mapped as closely as possible to the equivalent UK SOC2010 classification scheme. As this is neither an exact nor standardised process – other analysts may come up with different mappings.
Code Description Hecker BLS Brookings RAE DIUS
1122 Production managers and directors in construction Yes Yes
1123 Production managers and directors in mining Yes Yes and energy
1136 Information technology and telecommunications Yes Yes Yes Yes directors
1181 Health services and public health managers Yes Yes
1211 Managers and proprietors in agriculture and Yes Yes horticulture
2111 Chemical scientists Yes Yes Yes Yes Yes
2112 Biological scientists and biochemists Yes Yes Yes Yes Yes
2113 Physical scientists Yes Yes Yes Yes Yes
2114 Social and humanities scientists Yes Yes
2121 Civil engineers Yes Yes Yes Yes Yes
2122 Mechanical engineers Yes Yes Yes Yes Yes
2123 Electrical engineers Yes Yes Yes Yes Yes
2124 Electronics engineers Yes Yes Yes Yes Yes
2126 Design and Development engineers Yes Yes Yes Yes Yes
2127 Production and process engineers Yes Yes Yes Yes Yes
2129 Engineering professionals n.e.c. Yes Yes Yes Yes Yes
2133 IT specialist managers Yes Yes
2135 IT business analysts, architects and systems Yes Yes Yes designers
2136 Programmers and software development Yes Yes Yes professionals
2137 Web design and development professionals Yes Yes Yes
2139 Information technology and telecommunications Yes Yes Yes Yes professionals
2141 Conservation professionals Yes Yes Yes Yes
2150 Research and development managers Yes Yes Yes Yes Yes
2211 Medical practitioners Yes Yes Yes Yes
2212 Psychologists Yes Yes Yes
2213 Pharmacists Yes Yes Yes Yes
2214 Ophthalmic opticians Yes Yes Yes Yes
2215 Dental practitioners Yes Yes Yes Yes

86 THE GEOGRAPHY OF THE UK’S CREATIVE AND HIGH-TECH ECONOMIES
2216 Veterinarians Yes Yes Yes Yes
2217 Medical radiographers Yes Yes Yes Yes
2218 Podiatrists Yes Yes Yes Yes
2219 Health professionals n.e.c. Yes Yes
2221 Physiotherapists Yes Yes Yes Yes
2223 Speech and language therapists Yes Yes Yes
2231 Nurses Yes
2311 Higher education teaching professionals Yes Yes
2312 Further education teaching professionals Yes
2423 Management consultants and business analysts Yes Yes Yes
2425 Actuaries, economists and statisticians Yes Yes
2431 Architects Yes Yes Yes
2432 Town Planners Yes
2433 Quantity surveyors Yes
2434 Chartered surveyors Yes Yes Yes
3111 Laboratory technicians Yes Yes Yes Yes Yes
3112 Electrical and electronics technicians Yes Yes Yes Yes Yes
3113 Engineering technicians Yes Yes Yes Yes Yes
3114 Building and civil engineering technicians Yes Yes Yes Yes Yes
3115 Quality assurance technicians Yes Yes Yes Yes
3116 Planning, process and production technicians Yes
3122 Draughtspersons Yes Yes Yes
3132 IT user support technicians Yes Yes
3213 Paramedics Yes Yes
3216 Dispensing opticians Yes Yes Yes
3217 Pharmaceutical technicians Yes Yes Yes
3218 Medical and dental technicians Yes Yes Yes Yes
3219 Health associate professionals n.e.c Yes Yes
3319 Protective service associate professionals n.e.c. Yes
3422 Product, Clothing and related designers Yes
3443 Fitness instructors Yes
3512 Aircraft pilots and flight engineers Yes
3513 Ship and hovercraft officers Yes
3539 Business and related associate professionals n.e.c. Yes Yes
3542 Business sales executives Yes Yes
3545 Sales accounts and business development Yes managers
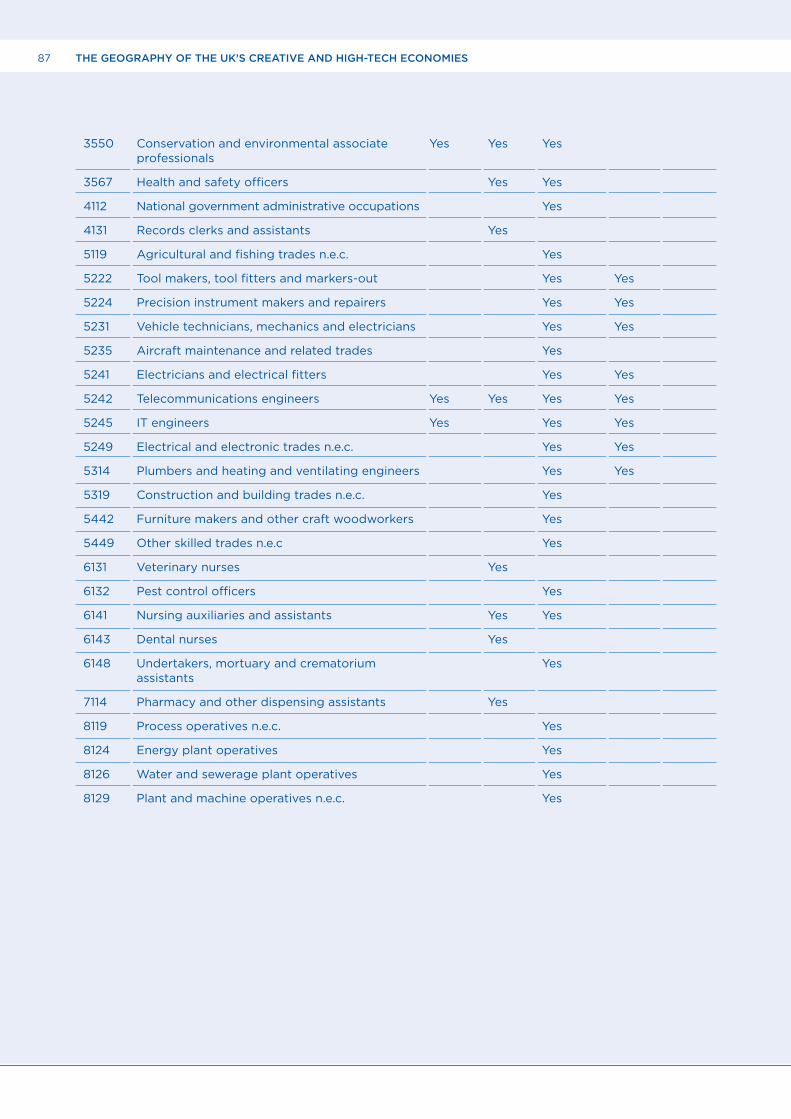
87 THE GEOGRAPHY OF THE UK’S CREATIVE AND HIGH-TECH ECONOMIES
3550 Conservation and environmental associate Yes Yes Yes professionals
3567 Health and safety officers Yes Yes
4112 National government administrative occupations Yes
4131 Records clerks and assistants Yes
5119 Agricultural and fishing trades n.e.c. Yes
5222 Tool makers, tool fitters and markers-out Yes Yes
5224 Precision instrument makers and repairers Yes Yes
5231 Vehicle technicians, mechanics and electricians Yes Yes
5235 Aircraft maintenance and related trades Yes
5241 Electricians and electrical fitters Yes Yes
5242 Telecommunications engineers Yes Yes Yes Yes
5245 IT engineers Yes Yes Yes
5249 Electrical and electronic trades n.e.c. Yes Yes
5314 Plumbers and heating and ventilating engineers Yes Yes
5319 Construction and building trades n.e.c. Yes
5442 Furniture makers and other craft woodworkers Yes
5449 Other skilled trades n.e.c Yes
6131 Veterinary nurses Yes
6132 Pest control officers Yes
6141 Nursing auxiliaries and assistants Yes Yes
6143 Dental nurses Yes
6148 Undertakers, mortuary and crematorium Yes assistants
7114 Pharmacy and other dispensing assistants Yes
8119 Process operatives n.e.c. Yes
8124 Energy plant operatives Yes
8126 Water and sewerage plant operatives Yes
8129 Plant and machine operatives n.e.c. Yes
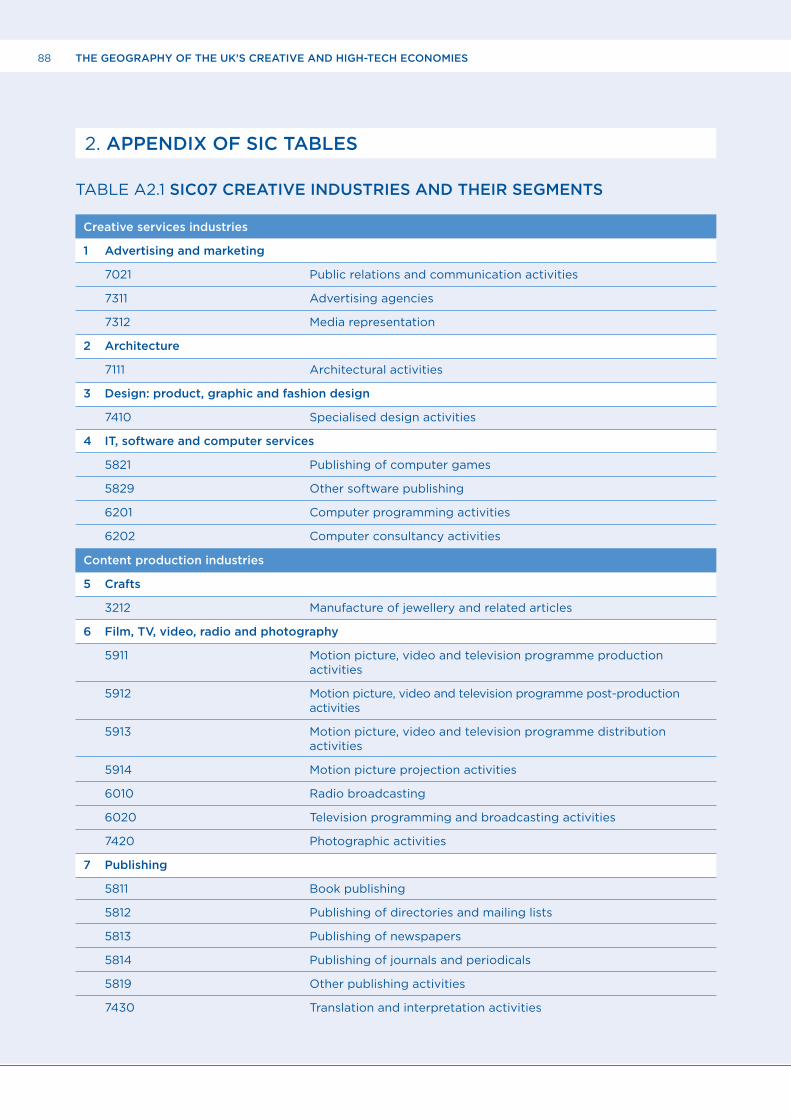
88 THE GEOGRAPHY OF THE UK’S CREATIVE AND HIGH-TECH ECONOMIES
2. APPENDIX OF SIC TABLES
TABLE A2.1 SIC07 CREATIVE INDUSTRIES AND THEIR SEGMENTS
Creative services industries
1 Advertising and marketing
7021 Public relations and communication activities
7311 Advertising agencies
7312 Media representation
2 Architecture
7111 Architectural activities
3 Design: product, graphic and fashion design
7410 Specialised design activities
4 IT, software and computer services
5821 Publishing of computer games
5829 Other software publishing
6201 Computer programming activities
6202 Computer consultancy activities
Content production industries
5 Crafts
3212 Manufacture of jewellery and related articles
6 Film, TV, video, radio and photography
5911 Motion picture, video and television programme production activities
5912 Motion picture, video and television programme post-production activities
5913 Motion picture, video and television programme distribution activities
5914 Motion picture projection activities
6010 Radio broadcasting
6020 Television programming and broadcasting activities
7420 Photographic activities
7 Publishing
5811 Book publishing
5812 Publishing of directories and mailing lists
5813 Publishing of newspapers
5814 Publishing of journals and periodicals
5819 Other publishing activities
7430 Translation and interpretation activities

89 THE GEOGRAPHY OF THE UK’S CREATIVE AND HIGH-TECH ECONOMIES
8 Museums, galleries and libraries
9101 Library and archive activities
9102 Museum activities
9 Music, performing and visual arts
5920 Sound recording and music publishing activities
8552 Cultural education
9001 Performing arts
9002 Support activities to performing arts
9003 Artistic creation
9004 Operation of arts facilities
TABLE A2.2 SIC07 HIGH-TECH INDUSTRIES
SIC07 code High-Tech industries Average Average intensity % employment (2011-2013) (2011-2013
610 Extraction of crude petroleum 26.73 16,820
910 Support activities for petroleum and natural gas 22.99 62,370 extraction
1820 Reproduction of recorded media 22.33 7,317
1920 Manufacture of refined petroleum products 19.79 29,777
2013 Manufacture of other inorganic basic chemicals 17.59 15,517
2059 Manufacture of other chemical products n.e.c. 17.29 8,797
2110 Manufacture of basic pharmaceutical products 21.41 44,198
2120 Manufacture of pharmaceutical preparations 21.04 65,787
2452 Casting of steel 21.51 5,210
2611 Manufacture of electronic components 17.85 39,584
2620 Manufacture of computers and peripheral equipment 34.83 47,313
2630 Manufacture of communication equipment 21.16 21,752
2640 Manufacture of consumer electronics 15.08 7,652
2651 Manufacture of instruments and appliances for 16.37 44,428 measuring, testing and navigation
2660 Manufacture of irradiation, electromedical and 20.89 11,082 electrotherapeutic equipment
2670 Manufacture of optical instruments and photographic 24.29 8,205 equipment
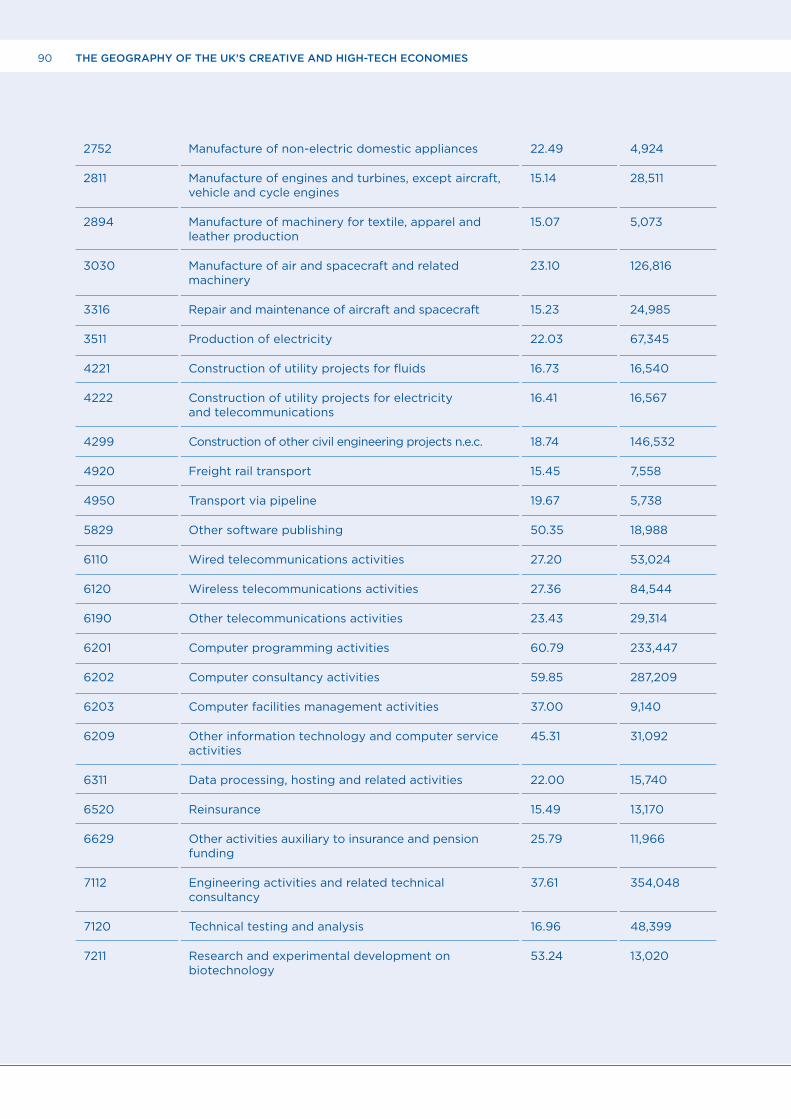
90 THE GEOGRAPHY OF THE UK’S CREATIVE AND HIGH-TECH ECONOMIES
2752 Manufacture of non-electric domestic appliances 22.49 4,924
2811 Manufacture of engines and turbines, except aircraft, 15.14 28,511 vehicle and cycle engines
2894 Manufacture of machinery for textile, apparel and 15.07 5,073 leather production
3030 Manufacture of air and spacecraft and related 23.10 126,816 machinery
3316 Repair and maintenance of aircraft and spacecraft 15.23 24,985
3511 Production of electricity 22.03 67,345
4221 Construction of utility projects for fluids 16.73 16,540
4222 Construction of utility projects for electricity 16.41 16,567 and telecommunications
4299 Construction of other civil engineering projects n.e.c. 18.74 146,532
4920 Freight rail transport 15.45 7,558
4950 Transport via pipeline 19.67 5,738
5829 Other software publishing 50.35 18,988
6110 Wired telecommunications activities 27.20 53,024
6120 Wireless telecommunications activities 27.36 84,544
6190 Other telecommunications activities 23.43 29,314
6201 Computer programming activities 60.79 233,447
6202 Computer consultancy activities 59.85 287,209
6203 Computer facilities management activities 37.00 9,140
6209 Other information technology and computer service 45.31 31,092 activities
6311 Data processing, hosting and related activities 22.00 15,740
6520 Reinsurance 15.49 13,170
6629 Other activities auxiliary to insurance and pension 25.79 11,966 funding
7112 Engineering activities and related technical 37.61 354,048 consultancy
7120 Technical testing and analysis 16.96 48,399
7211 Research and experimental development on 53.24 13,020 biotechnology

91 THE GEOGRAPHY OF THE UK’S CREATIVE AND HIGH-TECH ECONOMIES
7219 Other research and experimental development 47.91 83,594 on natural sciences and engineering
7220 Research and experimental development on 18.61 11,506 social sciences and humanities
7490 Other professional, scientific and technical 23.85 73,316 activities n.e.c.
9104 Botanical and zoological gardens and nature 20.11 12,387 reserve activities
9511 Repair of computers and peripheral equipment 32.63 31,902
9512 Repair of communication equipment 16.09 7,520
TABLE A2.3 HIGH-TECH AND CREATIVE INDUSTRY CODES COMPARED (SIC07)
Segment and Code
Creative services industries High–tech also?
1 Advertising and marketing
7021 Public relations and communication activities
7311 Advertising agencies
7312 Media representation
2 Architecture
7111 Architectural activities
3 Design: product, graphic and fashion design
7410 Specialised design activities
4 IT, software and computer services
5821 Publishing of computer games
5829 Other software publishing Yes
6201 Computer programming activities Yes
6202 Computer consultancy activities Yes
Content production industries
5 Crafts
3212 Manufacture of jewellery and related articles
6 Film, TV, video, radio and photography
5911 Motion picture, video and television programme production activities
5912 Motion picture, video and television programme post-production activities
5913 Motion picture, video and television programme distribution activities
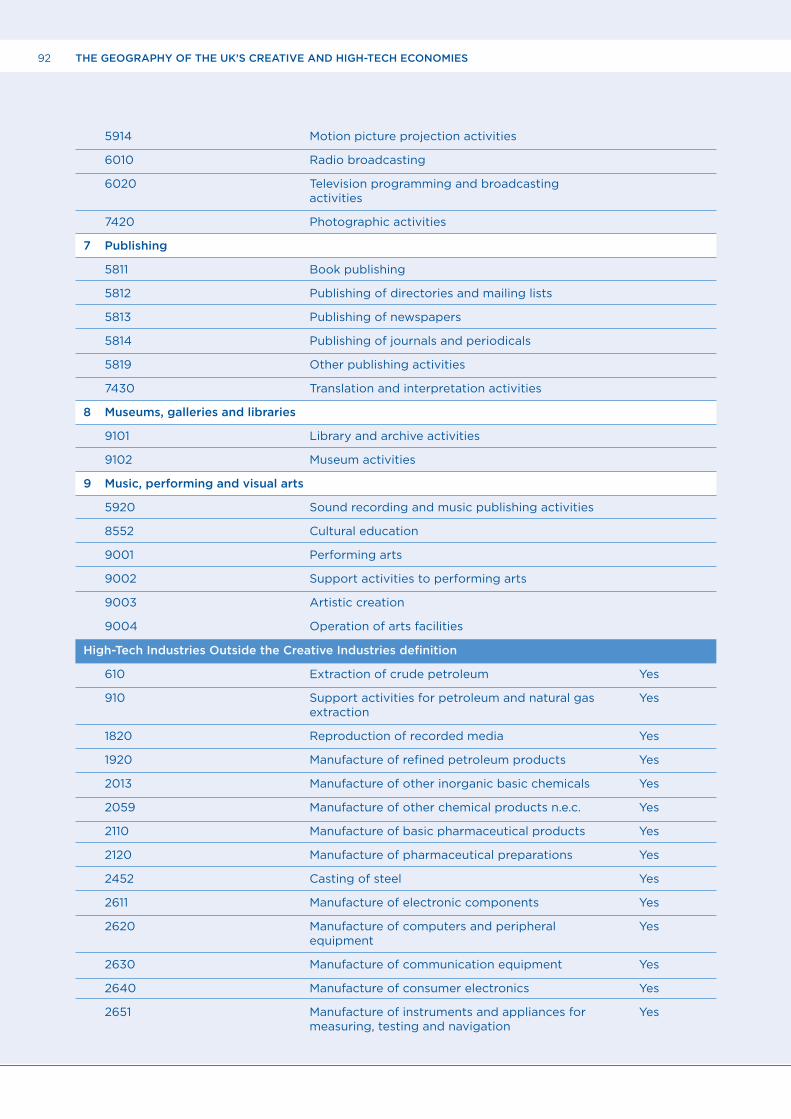
92 THE GEOGRAPHY OF THE UK’S CREATIVE AND HIGH-TECH ECONOMIES
5914 Motion picture projection activities
6010 Radio broadcasting
6020 Television programming and broadcasting activities
7420 Photographic activities
7 Publishing
5811 Book publishing
5812 Publishing of directories and mailing lists
5813 Publishing of newspapers
5814 Publishing of journals and periodicals
5819 Other publishing activities
7430 Translation and interpretation activities
8 Museums, galleries and libraries
9101 Library and archive activities
9102 Museum activities
9 Music, performing and visual arts
5920 Sound recording and music publishing activities
8552 Cultural education
9001 Performing arts
9002 Support activities to performing arts
9003 Artistic creation
9004 Operation of arts facilities
High-Tech Industries Outside the Creative Industries definition
610 Extraction of crude petroleum Yes
910 Support activities for petroleum and natural gas Yes extraction
1820 Reproduction of recorded media Yes
1920 Manufacture of refined petroleum products Yes
2013 Manufacture of other inorganic basic chemicals Yes
2059 Manufacture of other chemical products n.e.c. Yes
2110 Manufacture of basic pharmaceutical products Yes
2120 Manufacture of pharmaceutical preparations Yes
2452 Casting of steel Yes
2611 Manufacture of electronic components Yes
2620 Manufacture of computers and peripheral Yes equipment
2630 Manufacture of communication equipment Yes
2640 Manufacture of consumer electronics Yes
2651 Manufacture of instruments and appliances for Yes measuring, testing and navigation

93 THE GEOGRAPHY OF THE UK’S CREATIVE AND HIGH-TECH ECONOMIES
2660 Manufacture of irradiation, electromedical and Yes electrotherapeutic equipment
2670 Manufacture of optical instruments and Yes photographic equipment
2752 Manufacture of non-electric domestic appliances Yes
2811 Manufacture of engines and turbines, except Yes aircraft, vehicle and cycle engines
2894 Manufacture of machinery for textile, apparel and Yes leather production
3030 Manufacture of air and spacecraft and related Yes machinery
3316 Repair and maintenance of aircraft and spacecraft Yes
3511 Production of electricity Yes
4221 Construction of utility projects for fluids Yes
4222 Construction of utility projects for electricity and Yes telecommunications
4299 Construction of other civil engineering projects Yes n.e.c.
4920 Freight rail transport Yes
4950 Transport via pipeline Yes
6110 Wired telecommunications activities Yes
6120 Wireless telecommunications activities Yes
6190 Other telecommunications activities Yes
6203 Computer facilities management activities Yes
6209 Other information technology and computer Yes service activities
6311 Data processing, hosting and related activities Yes
6520 Reinsurance Yes
6629 Other activities auxiliary to insurance and Yes pension funding
7112 Engineering activities and related technical Yes consultancy
7120 Technical testing and analysis Yes
7211 Research and experimental development on Yes biotechnology
7219 Other research and experimental development Yes on natural sciences and engineering
7220 Research and experimental development on social Yes sciences and humanities
7490 Other professional, scientific and technical Yes activities n.e.c.
9104 Botanical and zoological gardens and nature Yes reserve activities
9511 Repair of computers and peripheral equipment Yes
9512 Repair of communication equipment Yes

94 THE GEOGRAPHY OF THE UK’S CREATIVE AND HIGH-TECH ECONOMIES
3. APPENDIX ON EMPLOYMENT INTENSITY DISTRIBUTIONS
TABLE A3.1 INTENSITY DISTRIBUTION OF EMPLOYMENT CORRESPONDING TO THE OCCUPATION CLASSIFICATIONS CONSIDERED IN THIS REPORT (AVERAGE OF 2011 TO 2013)
Note: The figure in the leftmost column gives a range of intensities or share of employment within industries. The figures in the remaining columns specify how much STEM employment is to be found in industries whose intensity falls in the given range of frequencies. – = sample too small to disclose
Intensity Brookings DIUS Hecker RAE
0<5 253,000 275,000 355,000 281,000
5-10 318,000 286,000 340,000 243,000
10-15 240,000 265,000 259,000 259,000
15-20 232,000 234,000 140,000 101,000
20-25 542,000 454,000 126,000 573,000
25-30 395,000 256,000 92,000 150,000
30-35 675,000 282,000 66,000 244,000
35-40 508,000 77,000 33,000 274,000
40-45 441,000 8,000 205,000 75,000
45-50 405,000 40,000 68,000 183,000
50-55 65,000 158,000 5,000 -
55-60 18,000 138,000 28,000 318,000
60-65 171,000 - 160,000 170,000
65-70 170,000 - 210,000 156,000
70-75 - - - 2,000
75-80 - - - -
80-85 - - - -
85-90 3,000 - - -
90-95 - - - -
95-100 - - - -

95 THE GEOGRAPHY OF THE UK’S CREATIVE AND HIGH-TECH ECONOMIES
4. APPENDIX ON USING INTENSITY AS A DISCRIMINATOR BETWEEN INDUSTRIES
When intensity (or any other continuous indicator) is used to separate industries into two groups A and B, it is implicitly assumed that the industries in each group form a distinct statistical distribution. The intensity of any given industry is then a function of the group to which it belongs, together with other factors which are not entirely known. If the two groups have widely-differing means, and small standard deviations compared to the differences between the two means, and if both parameters are known, this offers an intuitive method of determining which group any given industry belongs to. Suppose that group A has a low average intensity, μ(A) and group B a high average intensity, μ(B). A ‘threshold’ frequency f* can then be set, with μ(A) < f* < μ(B) such that any industry with an intensity less than f* will be assigned to group A, and any industry with an intensity greater than f* will be assigned to group B.
Difficulties arise if the distribution of intensities within the two groups is not known and in particular if μ(A) and μ(B) and the associated standard deviations are not known. In the case of the creative industries, the frequency distribution of employment as a function of intensity seems more clearly bimodal, and estimates of the population parameters of the creative and non-creative industries can be established, as was done in Dynamic Mapping by establishing a ‘most likely’ threshold between the two modes, so that statistical estimates of the population parameters, and the equiprobable separation between them, are established at the same time.
When studying the relation between STEM occupations and high-tech industries, this method cannot be used because the distributions are less clearly bimodal. In this situation, we must make use of additional information to inform industry classifications.

96 THE GEOGRAPHY OF THE UK’S CREATIVE AND HIGH-TECH ECONOMIES
5. APPENDIX ON INDUSTRIES WITH A STEM INTENSITY OF MORE THAN 15 PER CENT(WITH MORE THAN 4000 EMPLOYEES) THAT DO NOT FALL WITHIN THE EUROSTAT HIGH-TECH DEFINITION
TABLE A5.1 NON-EHT INDUSTRIES WITH HIGH STEM INTENSITY
SIC07 code Industry name Workforce STEM Employment intensity Average Average (2011-2013) (2011-2013
7112 Engineering activities and related technical 354,048 37.6 consultancy
4299 Construction of other civil engineering projects n.e.c. 146,532 18.7
7490 Other professional, scientific and technical 73,316 23.8 activities n.e.c.
3511 Production of electricity 67,345 22.0
910 Support activities for petroleum and natural gas 62,370 23.0 extraction
7120 Technical testing and analysis 48,399 17.0
1920 Manufacture of refined petroleum products 29,777 19.8
2811 Manufacture of engines and turbines, except aircraft, 28,511 15.1 vehicle and cycle engines
610 Extraction of crude petroleum 16,820 26.7
4222 Construction of utility projects for electricity and 16,567 16.4 telecommunications
4221 Construction of utility projects for fluids 16,540 16.7
2013 Manufacture of other inorganic basic chemic 15,517 17.6
6520 Reinsurance 13,170 15.5
9104 Botanical and zoological gardens and nature reserve 12,387 20.1 activities
6629 Other activities auxiliary to insurance and pension 11,966 25.8 funding
6203 Computer facilities management activities 9,140 37.0
2059 Manufacture of other chemical products n.e.c. 8,797 17.3
4920 Freight rail transport 7,558 15.4
9512 Repair of communication equipment 7,520 16.1
1820 Reproduction of recorded media 7,317 22.3

97 THE GEOGRAPHY OF THE UK’S CREATIVE AND HIGH-TECH ECONOMIES
4950 Transport via pipeline 5,738 19.7
2452 Casting of steel 5,210 21.5
2894 Manufacture of machinery for textile, apparel 5,073 15.1 and leather production
2752 Manufacture of non-electric domestic appliances 4,924 22.5

98 THE GEOGRAPHY OF THE UK’S CREATIVE AND HIGH-TECH ECONOMIES
ENDNOTES
1. This is on the basis of employment in both first and second jobs. That is, an individual who holds down two separate jobs in the creative industries is counted twice.
2. Chapain, C., Cooke, P., De Propris, L., MacNeill, S. and Mateos-Garcia, J. (2010) ‘Creative Clusters and Innovation: Putting Creativity on the Map.’ London: NESTA.
3. Higgs, P., Cunningham, S. and Bakhshi, H. (2008) ‘Beyond the Creative Industries: Mapping the UK’s Creative Economy.’ London: NESTA.
4. A concentration being defined here as an area where the proportion of the workforce employed in the creative (high-tech) economy is more than 1.2 times the proportion that the creative (high-tech) economy constitutes of the UK workforce.
5. Brinkley, I. (2006) ‘Defining the knowledge economy.’ London: The Work Foundation.
6. HM Government (2013) ‘Information Economy Strategy’. London: BIS.
7. Bakhshi, H., Freeman, A. and Higgs, P. (2013), ‘A Dynamic Mapping of the UK’s Creative Industries.’ London: Nesta.
8. HM Treasury and BIS (2011) ‘The plan for growth.’ London: HM Treasury and BIS. p3.
9. Bakhshi, H., Hargreaves, I. and Mateos-Garcia, J. (2013) ‘A Manifesto for the Creative Economy.’ London: Nesta. Osborne, M.A. and Frey, C.B. (2013) ‘The future of employment: How susceptible are jobs to Computerisation?’ Oxford: Oxford Martin School, University of Oxford.
10. DCMS (1998) ‘Creative Industries Mapping document.’ London: DCMS.
11. U.S. Congress, Office of Technology Assessment (1982) ‘Technology, Innovation, and Regional Economic Development.’ Washington DC: U.S. Government Printing Office.
12. This report (Bakhshi, Freeman, and Higgs 2013) is frequently mentioned, and so for ease of reading we refer to it henceforth as ‘Dynamic Mapping’.
13. Hecker, D. (2005) High-technology employment: a NAICS -based update. ‘Bureau of Labor Statistics, Monthly Labour Review.’ Washington DC: Bureau of Labor Statistics.
14. Since the publication of ‘Dynamic Mapping’ the DCMS has adopted the methodology in the production of the official DCMS creative industries economic estimates. There are, however, some small differences in the assessment of which occupations are creative, and in the case of libraries and museums, for example, the DCMS has included industrial codes whose creative intensity is below the ‘threshold’ adopted in the ‘Dynamic Mapping’. For consistency with the published official statistics we use the DCMS classifications in this report. See DCMS (2015) for the latest official creative employment estimates.
15. R&D intensity in manufacturing is measured by the ratio of an industry’s R&D expenditure to value added, and knowledge intensity in services is measured by its share of tertiary educated persons at NACE 2-digit level. Only services labelled ‘high-tech’ by Eurostat are considered in our analysis.
16. DCMS (1998 and 2001) ‘Creative Industries Mapping Documents.’ London: DCMS.
17. Garnham, N. (2005) From cultural to creative industries. ‘International Journal of Cultural Policy.’
18. Smith, C. (1998) ‘Creative Britain.’ London: Faber & Faber.
19. Bakhshi, H., Hargreaves, I. and Mateos-Garcia, J. (2013) ‘A Manifesto for the Creative Economy.’ London: Nesta.
20. Previous studies that have emphasised the importance of understanding the occupation-industry mix of economies include Currid and Stolarick (2010) The Occupation-Industry Mismatch: New Trajectories for Regional Cluster Analysis and Implications for Economic Development. ‘Urban Studies.’ 47(2); and Mellander, Stolarick and King (2011) ‘What You Do, Not Who You Work For: A Comparison on the Occupational Industry Structures of the US, Canada and Sweden.’ Martin Prosperity Institute Working Paper, University of Toronto.
21. DCMS (2014) ‘Creative Industries Economic Estimates’. London: DCMS.
22. HM Treasury and BIS (2011) ‘The plan for growth.’ London: HM Treasury and BIS. p3.
23. Westlake, S. (2013) Rebalancing Act: Rationales and Policies for Sectoral Economic Rebalancing. ‘Oxford Review of Economic Policy.’
24. Speech by Rt Hon David Willets MP (2012) ‘Our High-tech future’.
25. Government Office for Science (2012) ‘Technology and Innovation Futures: UK Growth Opportunities for the 2020s.’ London: Government Office for Science.
26. Rt Hon David Willets MP (2013) ‘Eight Great Technologies.’ Speech at Policy Exchange.
27. Dyson, J. (2010) ‘Ingenious Britain. Making the UK the leading High-tech exporter in Europe.’
28. DTI (2006) ‘Science, Engineering and Technology skills in the UK.’ London: DTI.
29. DFES (2006) ‘The Supply And Demand for Science, Technology, Engineering And Mathematics Skills In The UK Economy.’ London: DFES.
30. DIUS (2009) ‘The Demand for Science, Technology, Engineering and Mathematics (STEM) Skills.’ London: DIUS.
31. BIS (2011) ‘STEM graduates in non-STEM jobs’. London: BIS.
32. UKCES (2011) ‘The Supply of and demand for High-Level STEM skills.’ See also UKCES (2013) ‘Supply of and demand for High-Level STEM skills.’
33. UKCES (2011), op. cit., p4.
34. UKCES (2013), op. cit. http://www.ukces.org.uk/publications/er77-high-level-stem-skills-supply-and-demand
35. KPMG and Tech Monitor UK (2013) ‘Understanding tech clusters and tracking the UK tech sector’s outlook for employment and growth.’
36. BIS (2012) ‘BIS industrial strategy: UK Sector analysis.’ London: BIS.
37. BIS (2012) ‘BIS industrial strategy: UK Sector analysis.’ p9, Box 2. London: BIS.
38. Bakhshi, H., Freeman, A. and Higgs, P. (2013) ‘A Dynamic Mapping of the UK’s Creative Industries.’ London: Nesta.
39. See ONS (2010) ‘Standard Occupational Classification 2010.’ Newport: ONS.
40. These are whether the occupation: 1. Involves a novel process, 2. Is mechanisation resistant 3. Is non-repetitive or performs a non-uniform function 4. Involves a ‘creative’ contribution to the value chain irrespective of context and 5. Involves interpretation, and not mere transformation. Different occupational codes at the four-digit level are assessed against these criteria, based on the detailed list of sub-occupations (the ‘coding index’) published by the ONS (ONS, 2010).

99 THE GEOGRAPHY OF THE UK’S CREATIVE AND HIGH-TECH ECONOMIES
41. In a forthcoming report we use machine learning-based techniques to identify ‘creative occupations’ from the official codes. Almost all of the occupations scored as creative in ‘Dynamic Mapping’ also turn out to be creative using this approach, although a relatively large number of occupations not classified as creative in ‘Dynamic Mapping’ also turn out to be creative.
42. Hecker, D. (2005) High-technology employment: a NAICS-based update. ‘Monthly Labour Review.’ U.S. Bureau of Labour Statistics.
43. Bay Area Council Economic Institute Report (2012) ‘Technology Works: High-Tech Employment and Wages in the United States.’ San Francisco CA: Bay Area Council Economic Institute.
44. Echeverri-Carroll, E. and Ayala, S. (2009) Wage differentials and the spatial concentration of high-technology industries. ‘Papers in Regional Science.’ Vol. 88, Issue 3, pp.623-641. Note other studies in this area include Markusen, A., Chapple, K., Schrock, G., Yamamoto, D. and Yu, P. (2001) ’Gauging Metropolitan “High-Tech” and “I-Tech” Activity.’ which uses a different threshold of three times the national average.
45. Rothwell, J. (2013) ‘The hidden STEM economy.’ Washington DC: Brooking Institution Metropolitan Program. The O*Net data is part of an ongoing project funded by the Department of Labor’s Employment and Training Administration to provide detailed information about every occupation in the US economy.
46. We had originally hoped that the analysis could be expanded to include data from the 2011 Household Census as this also provides occupational and industry data and, in principle, covers the whole population so is not subject to sampling biases. In practice, however, the UK Census has no benefit for our research over the APS/LFS. First, because the Census utilises only 200 industry classifications at a mixture of 2-, 3- and 4-digit level of detail out of the SIC07 standard of 617 codes available at 4 digits of which 603 are used in the APS. In the Census only 21 4-digit industry codes used, and mostly relate to public and government activities. As a result, the ability to discriminate creative from other industries is significantly reduced from 30 industries under the APS to just 15 industries in the Census. Second, we cannot undertake regional analysis on census data as there appears to be no 4-digit occupation within the 3-digit industry employment tables released at the regional or sub-regional level. And third, because the Census is conducted only once every ten years it is unsuitable for time series analysis for anything other than long-term trends.
47. ONS (2011) ‘Labour Force Survey. User Guide, Volume 1.’ p7. Newport: ONS.
48. DCMS (2014a) ‘Creative Industries Economic Estimates.’ London: DCMS.
49. Note that these differ from those published in DCMS (2014a) which are based on 2011 and 2012 averages.
50. For consistency with the published DCMS statistics, all estimates of creative and high-tech employment in this report include the total of main and second jobs.
51. The equivalent table in the previous ‘Dynamic Mapping’ report is Table 10.2.
52. DCMS (2014a)’Creative Industries Economics Estimates, January.’ London: DCMS.
53. The rationale for segmentation, given in Cunningham (2014) arises from work on Australian Census data at the most detailed level of industry and occupation classifications that are possible. CCI found correlations in their characteristics sufficient to allow them to be gathered into these two distinct sub-categories. In the UK context a similar distinction was also made in Nesta’s (2006) ‘Creating Growth’ report, Appendix 3 – A refined model of the creative industries pp53-55.
54. See also Bakhshi, H., Freeman, A. and Higgs, P. (2013) ‘A Dynamic Mapping of the UK’s Creative Industries.’ London: Nesta. Table 2.4, p13.
55. Ibid, p54.
56. The geography analysed in this sub-section is the European NUTS1 geography, which corresponds to Government Office Regions (GORs) in England and to the devolved administrations elsewhere in the UK. Location is measured on place of residence as opposed to place of work, so in some cases people may be working in one region and living in another, for example London and the South East of England. For more information see: http://www.ons.gov.uk/ons/guide-method/geography/beginner-s-guide/eurostat/relationship-of-nuts-to-uk-administrative-geographies.html
57. Freeman, A. (2009) ‘London’s creative workforce: 2009 update.’ London: Greater London Authority.
58. Freeman, A. (2009) uses the term microspatial clustering. This work, based on IDBR data, calculated an index of geographical concentration at the level of the ONS’s Medium Super-Output areas – approximately the size of electoral wards. Chapain et al., (2010) describe the ‘dartboard effect’ of microspatial clusters peppered across the UK that are hidden in the analysis of agglomeration economies at higher levels of aggregation.
59. The combined population of Manchester and Merseyside was 4.6 million according to mid-year estimates released by ONS on 17 May 2011. The population of the West Midlands was 5.6 million on March 27 2011, census day (http://www.ons.gov.uk/ons/rel/mro/news-release/census-shows-increase-in-population-of-the-west-midlands/censuswestmidlandnr0712.html). The population living within the Greater London Authority area was 7,825,200 on census day. A better comparison may be afforded by the population of the Greater London Functional Urban Region (Freeman and Cheshire 2006:5) of which the best available estimate is 12,255,000. This is still less than three times the population of Manchester and Merseyside and barely double that of the West Midlands.
60. For a discussion of the role of culture in world cities see BOP (2014) ‘World Cities Culture Report’. London: BOP Consulting.
61. Hecker, D. (2005) High-technology employment: a NAICS -based update. ‘Bureau of Labor Statistics, Monthly Labour Review.’ Washington DC: Bureau of Labor Statistics.
62. DIUS (2009) ‘The Demand for Science, Technology, Engineering and Mathematics (STEM) Skills’. London: DIUS.
63. BLS (2010) ‘Options for defining STEM (Science, Technology, Engineering, and Mathematics) occupations under the 2010 Standard Occupational Classification (SOC) system: SOC Policy Committee recommendation to the Office of Management and Budget (OMB).’ Washington DC: Bureau of Labor Statistics.
64. Greenwood, C., Harrison, M. and Vignoles, A. (2011) ‘The labour market value of STEM qualifications and occupations.’ Report prepared by the Institute of Education for the Royal Academy of Engineering.
65. Rothwell, J. (2013) ‘The hidden STEM economy.’ Washington DC: Brookings Institution Metropolitan Program.
66. These codes were mapped to the UK equivalent using a combination of techniques. Approximately half of the occupation codes were able to be mapped using a two-step process using the US SOC to ISCO 08 (International Standard Classification of Occupations 2008) cross walk as the first step and then using the ONS-supplied ISCO to UK SOC2010 crosswalk file as the second step. The balance of occupation codes were mapped using a manual process of matching the main job description for each occupation and identifying the most equivalent occupation title in the ONS’s coding index of UK occupations.
67. Eurostat ‘Aggregations of manufacturing and services based on NACE Rev 1.1.’
68. High-tech in manufacturing is defined using the intensity of expenditure in R&D and knowledge intensity is defined using the industries’ employment share of tertiary educated people. It should be noted that most are 2-digit codes, as a result of which all the underlying 4-digit codes are included in our initial Eurostat High-Tech list.
69. OECD Directorate for Science, Technology and Industry (2011) ‘ISIC rev.3 Technology intensity definition.’ Paris: OECD.
70. Each 2-digit or 3-digit NACE industry was expanded to the SIC03 industry at the 4-digit level of detail. The UK industry coding index was then used to map the SIC03 industry activities to the most relevant SIC07 industry.

100 THE GEOGRAPHY OF THE UK’S CREATIVE AND HIGH-TECH ECONOMIES
71. Industries with intensities above 15 per cent that were not classified within the Eurostat definition and have over 4,000 employees are included in Appendix 5.
72. In order to be included the industry had, in addition to passing the intensity test, had to have a workforce sample size that was greater than 4,000 for the average of 2011-2013.
73. Chapain et al., (2010) ‘Creative clusters and innovation.’ NESTA.
74. Helpman, E. and Trajtenberg, M. (1996) ‘Diffusion of General Purpose Technologies.’ Cambridge MA: NBER Working Paper No. 5773; Rincon, Vecchi and Venturini (2013) ‘ICT as a General Purpose Technology: Spillovers, Absorptive Capacity and Productivity Performance.’ NIESR discussion paper 416. London: NIESR.
75. In ongoing research we are exploring the use workforce intensity of ICT occupations to identify Information Economy industries.
76. e-skills UK, Intellect and BCS (2013) ‘Information Economy Economic estimates 2013.’ London: e-skills UK, Intellect and BCS.
77. In other research we have used data sourced from public online sources, as opposed to official survey data, to map the location of the video games industry at the hyperlocal level (Mateos-Garcia, Bakhshi and Lenel, 2014).
78. http://epp.eurostat.ec.europa.eu/portal/page/portal/nuts_nomenclature/introduction
79. In new research we are applying the ‘Dynamic Mapping’ approach to EU and North American countries.
80. The location quotients are calculated based on employment figures for main and second jobs in UK NUTS3 areas 2003 geographies (mapped using the 2006 geographies available from the Eurostat website).
81. West Inner London is made up of City of London, Camden, Hammersmith and Fulham, Kensington and Chelsea, Wandsworth and Westminster.
82. East Inner London is made up of Hackney, Haringey, Islington, Lambeth, Lewisham, Newham, Southwark and Tower Hamlets.
83. West and North West Outer London is made up of Barnet, Brent, Ealing, Harrow, Hillingdon, Hounslow and Richmond upon Thames.
84. South Outer London is made up of Bromley, Croydon, Kingston upon Thames, Merton and Sutton.
85. Source Rolls Royce website.
86. Source Sellafield website
87. Midlands Aerospace Alliance ‘Mobilising the Midlands aerospace cluster.’ Coventry: Midlands Aerospace Alliance.
88. Nathan, M. and Vandore, E. (2014) Here Be Startups: Exploring a young digital cluster in Inner East London. Forthcoming in ‘Environment and Planning.’
89. Florida, R. (2012) The Joys of Urban Tech. ‘The Wall Street Journal.’ 31 August 2012.
90. KPMG and Tech Monitor UK (2013) ‘Understanding tech clusters and tracking the UK tech sector’s outlook for employment and growth.’ p9.
91. The range is the difference between the largest and the smallest LQ for an industry grouping across the NUTS3 geographies. Standard deviation is a measure of dispersion which is based on the square of deviations from the mean. The Gini coefficient is a measure of equality among the LQs, which is bounded between 0 (all LQs are the same) and 1 (Complete inequality, only one NUTS3 area has a positive LQ).
92. Bakhshi, H., Freeman,A. and Higgs, P. (2013) ‘A Dynamic Mapping of the UK’s Creative Industries.’ London: Nesta.
93. Bakhshi, H., Lee, N. and Mateos-Garcia, J. (2013) represents an attempt to do this using earlier classifications for creative occupations and industries.

101 THE GEOGRAPHY OF THE UK’S CREATIVE AND HIGH-TECH ECONOMIES
Nesta1 Plough Place London EC4A 1DE
@nesta_uk
www.facebook.com/nesta.uk
www.nesta.org.uk
Nesta is a registered charity in England and Wales with company number 7706036 and charity number 1144091. Registered as a charity in Scotland number SCO42833. Registered office: 1 Plough Place, London, EC4A 1DE.


