33
The Geopolitics of Natural Gas Charting China’s Natural Gas Future Harvard University’s Belfer Center and Rice University’s Baker Institute Center for Energy Studies October 2013

The Geopolitics of Natural GasCharting China’s Natural Gas Future
Harvard University’s Belfer Center and Rice University’s Baker Institute Center for Energy Studies
October 2013

JAMES A. BAKER III INSTITUTE FOR PUBLIC POLICY
RICE UNIVERSITY
CHARTING CHINA’S NATURAL GAS FUTURE
BY
TREVOR HOUSER
PARTNER RHODIUM GROUP
AND VISITING FELLOW
THE PETERSON INSTITUTE OF INTERNATIONAL ECONOMICS
AND
BEIBEI BAO
CHINA ANALYST RHODIUM GROUP
OCTOBER 31, 2013

Charting China’s Natural Gas Future
2
THESE PAPERS WERE WRITTEN BY A RESEARCHER (OR RESEARCHERS) WHO PARTICIPATED IN A
BAKER INSTITUTE RESEARCH PROJECT. WHEREVER FEASIBLE, THESE PAPERS ARE REVIEWED BY
OUTSIDE EXPERTS BEFORE THEY ARE RELEASED. HOWEVER, THE RESEARCH AND VIEWS
EXPRESSED IN THESE PAPERS ARE THOSE OF THE INDIVIDUAL RESEARCHER(S), AND DO NOT
NECESSARILY REPRESENT THE VIEWS OF THE JAMES A. BAKER III INSTITUTE FOR PUBLIC POLICY.
© 2013 BY THE JAMES A. BAKER III INSTITUTE FOR PUBLIC POLICY OF RICE UNIVERSITY
THIS MATERIAL MAY BE QUOTED OR REPRODUCED WITHOUT PRIOR PERMISSION, PROVIDED APPROPRIATE CREDIT IS GIVEN TO THE AUTHOR AND
THE JAMES A. BAKER III INSTITUTE FOR PUBLIC POLICY.

Charting China’s Natural Gas Future
3
Acknowledgments The Center for Energy Studies of Rice University’s Baker Institute would like to thank
ConocoPhillips and the sponsors of the Baker Institute Center for Energy Studies for their
generous support of this program. The Center for Energy Studies further acknowledges the
contributions by study researchers and writers.
Energy Forum Members Advisory Board Accenture The Honorable & Mrs. Hushang Ansary Baker Botts L.L.P. Baker Hughes Incorporated BP California Energy Commission Cheniere Energy, Inc. Chevron Corporation ConocoPhillips Deloitte EDP Renewables North America, LLC Energy Future Holdings Corporation ExxonMobil Corporation The Institute of Energy Economics, Japan (IEEJ) Marathon Oil Corporation Saudi Aramco Schlumberger Shell Oil Company Shell Exploration & Production Co. Trinity Industries, Inc. Wallace S. Wilson
Associate Members Direct Energy Hess Corporation Tudor, Pickering, Holt & Co. LLC Members Afren Resources USA Air Products and Chemicals, Inc. American Air Liquide Holdings, Inc. Apache Corporation Aramco Services Company IPR - GDF SUEZ North America Pioneer Natural Resources USA Inc. Rockwater Energy Solutions, Inc. TOTAL E&P New Ventures, Inc. TOTAL E&P USA, Inc. VAALCO Energy Supporting Members Deloitte MarketPoint LLC Energy Intelligence

Charting China’s Natural Gas Future
4
Acknowledgments
The Geopolitics of Energy Project at Harvard University’s Kennedy School is grateful for the
support it receives from BP, as well as the Belfer Center for Science and International Affairs. It
also appreciates the work and contributions provided by the scholars who have participated in
this program.

Charting China’s Natural Gas Future
5
About the Study
Some of the most dramatic energy developments of recent years have been in the realm of
natural gas. Huge quantities of unconventional U.S. shale gas are now commercially viable,
changing the strategic picture for the United States by making it self-sufficient in natural gas for
the foreseeable future. This development alone has reverberated throughout the globe, causing
shifts in patterns of trade and leading other countries in Europe and Asia to explore their own
shale gas potential. Such developments are putting pressure on longstanding arrangements, such
as oil-linked gas contracts and the separate nature of North American, European, and Asian gas
markets, and may lead to strategic shifts, such as the weakening of Russia’s dominance in the
European gas market.
Against this backdrop, the Center for Energy Studies of Rice University’s Baker Institute and the
Belfer Center for Science and International Affairs of Harvard University’s Kennedy School
launched a two-year study on the geopolitical implications of natural gas. The project brought
together experts from academia and industry to explore the potential for new quantities of
conventional and unconventional natural gas reaching global markets in the years ahead. The effort
drew on more than 15 country experts of producer and consumer countries who assessed the
prospects for gas consumption and production in the country in question, based on anticipated
political, economic, and policy trends. Building on these case studies, the project formulates
different scenarios and uses the Rice World Gas Trade Model to assess the cumulative impact of
country-specific changes on the global gas market and geopolitics more broadly.
Study Authors
Rawi Abdelal Luay Al Khatteeb Govinda Avasarala Beibei Bao Soner Cagaptay Charles Ebinger Jareer Elass Andreas Goldthau Simon Henderson
Trevor Houser Amy Myers Jaffe Robert Johnston Ken Koyama Azzedine Layachi Michael Levi Steven Lewis Suzanne Maloney David Mares
Kenneth B. Medlock Keily Miller Tatiana Mitrova Isidro Morales Martha Brill Olcott Meghan O’Sullivan Ronald Ripple

Charting China’s Natural Gas Future
6
Introduction
China’s rise has reshaped international energy and commodity markets. Over the past decade,
China has accounted for more than half of global energy demand growth and today consumes
more than half of the iron ore, cement, copper, and a host of other commodities produced around
the world. Natural gas markets, however, have been less impacted by this China-led boom.
Natural gas accounts for only 4% of energy demand in the coal-rich Middle Kingdom, compared
to more than 20% globally. And until recently China produced as much natural gas as it
consumed.
That’s beginning to change. Natural gas is economically competitive in China as a fuel source
for heating and cooking in the residential and commercial sectors and is increasingly being used
as an oil alternative in taxis and other fleet vehicles. Gas is used as both a feedstock and fuel in
the manufacturing sector and as a source of power generation in a few parts of the country.
Natural gas demand has grown twice as fast as energy demand overall in China over the past
decade and is now large enough to have global market significance. In 2009, China surpassed
Japan to become the world’s third largest natural gas consumer and the fact that gas is still such a
small share of overall Chinese energy consumption raises the prospect of considerable growth in
the years ahead. Urbanization will continue to drive demand for fuel in the residential,
commercial, and transportation sectors. And as urban China gets richer, the desire for cleaner air
and demand for “peaking power” (electricity generation that can be easily switched on during
periods of high demand) will grow.
As a relatively clean and flexible source of energy, natural gas is well positioned to benefit from
these trends. But unlocking that potential will require policy action. Increasing the penetration of
natural gas as a source of fuel for urban heating and cooking requires natural gas price reform.
Moving beyond fleet vehicles to private natural gas cars will require new fueling infrastructure.
And switching from coal to gas in the power sector will require new and more strongly enforced
environmental regulations and a change in the way electricity is sold.

Charting China’s Natural Gas Future
7
Beijing has indicated strong support for natural gas and introduced a range of pro-gas policies
over the past few years. The effectiveness of these policies remains to be seen and forecasts for
future Chinese natural gas demand are all over the map. Government and private sector
projections for 2020, for example, range from 220 billion cubic meters (bcm) to 500 bcm, up
from 147 bcm in 2012. At those numbers, China could account for anywhere between 15% and
50% of projected global demand growth over the next eight years. And the uncertainty only
grows beyond that.
Perhaps the most important factor in determining how far Chinese policymakers push natural gas
demand is the cost of supply and the outlook for domestic production. Until 2006, growth in
Chinese consumption was fed entirely by relatively low-cost domestic supply. In recent years,
however, the country has increasingly turned to imports, the cost of which has risen considerably
alongside the price of oil. Chinese companies’ willingness to import, and Chinese consumers’
willingness to buy natural gas is of course price-dependent, but so too is Chinese policymakers’
willingness to push pro-gas policies given persistent concerns about inflation and political
discontent. In addition, given the rapid growth in Chinese oil imports, many in Beijing are
nervous about the strategic and security implications of becoming overly dependent on foreign
supply of an additional energy source.
The prospects for continued growth in domestic output are promising. China is already the
world’s eighth largest natural gas producer, with a decent conventional resource base and a well-
established oil and gas industry. There has been promising growth in unconventional gas
production as well in recent years in the form of tight gas, coal-bed methane (CBM), and coal-to-
gas (CTG) conversion. And recent estimates suggest China possesses shale gas reserves
comparable in scale to the United States. How successful China is in developing these resources
also depends on policy choices Beijing makes—from pricing policy to competition policy. As
such, the supply side of the Chinese natural gas equation is just as uncertain as the demand side,
and of equal international significance.

Charting China’s Natural Gas Future
8
In this paper we provide an overview of the drivers of Chinese natural gas demand, sources of
domestic and international supply, and the economic, commercial and political factors that will
shape how both develop in the years ahead.
China’s Growing Appetite for Natural Gas
China’s emergence as a global economic power has been one of the defining events of the 21st
century, and the impact of China’s rise has arguably been most pronounced in global energy and
commodity markets. China’s economy has been growing rapidly for more than three decades,
beginning with the market reforms introduced by China’s then de facto paramount leader Deng
Xiaoping in 1978 (Naughton 2007). But it wasn’t until the last decade that it had meaningful
international energy and commodity market consequences. In part that’s because of the very low
base from which the take-off began. But the nature of the reforms introduced by Deng and
expanded by his successors changed the structure of the Chinese economy, reduced the energy-
intensity of economic growth considerably (Rosen and Houser 2007). As a result, while GDP
grew by 9.6% a year on average between 1978 and 2001, energy demand grew at half that rate
(National Bureau of Statistics 2013).
As the new century got underway, the relationship between economic growth and energy
demand began to change. As millions of Chinese citizens moved to the cities or saw cities built
up in what used to be farmland, demand for building materials like steel, cement, aluminum, and
glass exploded. China quickly became the leading consumer of these products, as well as the
minerals used to make them, like iron ore for steel and bauxite for aluminum. As production of
building materials is extremely energy intensive, Chinese energy demand surged as well.
Between 2002 and 2008, Chinese economic growth accelerated to an annual average rate of
11.3%, and energy demand grew by 10.6% (National Bureau of Statistics 2013). This surge in
demand caught markets by surprise (Figure 1) and touched off a global commodities boom large
enough to be considered a “super cycle” by many analysts.1
1 A “super cycle” is a period of sustained high demand extending beyond a normal business cycle. The commodities market experienced two such cycles during the 20th century—the first during the US industrial boom in the early 1900s and the second during post-World War II reconstruction.

Charting China’s Natural Gas Future
9
Figure 1. Upside Surprise in Chinese Energy Demand Total primary energy demand, past and projected, million tons of oil equivalent. Projections are from the
International Energy Agency’s (IEA) 2012 World Energy Outlook. For China, the IEA’s 2006 and 2002 projections
are included for reference.
Source: IEA, 2002, 2006, 2012a, 2013a
The financial crisis took some of the steam out of the country’s breakneck energy demand
growth—but China fared much better than the rest of the world. As a result, its weight in global
markets only increased. By 2012, China accounted for more than half of global consumption of
coal, iron ore, cement, and a range of other commodities (Figure 2). While China only accounted
for 11% of global oil demand in 2012, it was responsible for 44% of the growth in demand over
the previous decade (BP 2013). Most of this was met by foreign supply, with China surpassing
Japan in 2010 to become the world’s largest oil importer.
This surge in Chinese oil demand had important consequences for international natural gas
markets. Nearly all LNG and a large portion of pipeline gas trade are indexed to the price of oil.
As the upside surprise in Chinese oil consumption between 2002 and 2008 strained global
production capacity and pushed up global crude prices, natural gas prices in Asia and much of
Europe increased as well. But China has had relatively little impact on global gas trade directly.
CHINA
US
EU
RUSSIA
BRAZIL
INDIA
JAPAN
WEO2012
CHINA WEO2006
CHINA WEO2002

Charting China’s Natural Gas Future
10
The Middle Kingdom accounted for only 4.3% of global gas demand in 2012 (Figure 2) and until
recently has met nearly all that demand with domestic production.
Figure 2. China's Share of Global Demand, 2012
Source: BP, 2013; NBS, 2013; UN Statistics Division, 2013; USGS, 2013
Natural gas penetration has historically been quite low in China (4% of total energy demand
compared to a global average of more than 20% in 2010—see Table 1) thanks to the availability
of domestic coal and the structure of the economy. China has been the world’s largest coal
producer since 1985 (BP 2013) with domestic supply meeting three-quarters of the country’s
total energy needs during the 1980s and 1990s. And when China’s energy consumption surged at
the turn of the century, it was really only the country’s coal miners and coal-fired power plant
equipment manufacturers that had the ability to rapidly scale-up. China added nearly 800
gigawatts (GW) of new electricity generation capacity between 2002 and 2012, more than the
total installed base in Germany, Japan, India, and the UK combined (NBS 2013). Two thirds of
this capacity was coal-fired power. Chinese equipment manufacturers had licensed localized
European and Japanese coal-fired generation technology during the 1980s and 1990s and could
meet surging electricity demand faster and quicker any other source of energy supply save
hydropower, where Chinese companies had also achieved unique economies of scale. And
Chinese miners were able to ramp up production rapidly as well, though often at the expense of

Charting China’s Natural Gas Future
11
workplace safety, efficient resource management, or environmental protection. China accounted
for nearly 90% of global coal demand growth between 2002 and 2012, and China now produces
nearly as much coal as the rest of the world combined (BP 2013)
Table 1. Total Primary Energy Supply by Source Share of total, 2010
Coal Petroleum Natural
Gas Nuclear Hydro
Other
Renewables
OECD 20.1% 36.3% 24.4% 11.0% 2.1% 6.0%
US 22.7% 36.3% 25.1% 9.9% 1.0% 4.9%
Europe 16.5% 33.2% 25.6% 13.2% 2.6% 8.8%
Japan 23.1% 40.9% 17.3% 15.1% 1.4% 2.2%
Non-OECD 34.7% 25.6% 20.2% 1.7% 2.6% 15.2%
Russia 16.4% 19.8% 54.5% 6.4% 2.0% 1.1%
China 66.7% 17.5% 3.6% 0.8% 2.5% 9.0%
India 41.6% 23.4% 7.6% 1.0% 1.4% 24.9%
Other Asia 18.0% 33.5% 21.5% 1.4% 1.5% 24.0%
Middle East 0.4% 47.9% 51.4% 0.0% 0.2% 0.1%
Africa 15.9% 21.0% 12.7% 0.5% 1.3% 48.3%
Latin America 3.6% 43.8% 21.4% 1.0% 9.9% 20.3%
Total 27.6% 32.2% 21.4% 5.6% 2.3% 10.9% Source: IEA, 2013a
The fact that Chinese economic growth and energy demand has been industry-driven has also
favored coal. Industrial electricity consumption is relatively constant throughout the day, which
works well for base-load sources of generation like coal that are difficult to quickly ramp up or
down in response to changes in demand. In mature economies, where electricity demand is
driven more by the residential and commercial sectors, there is a need for “peakers”—power
plants that can be cycled on and off quickly to accommodate the fluctuations in electricity
demand used for home and office heating, cooling, and lighting. Natural gas often used for

Charting China’s Natural Gas Future
12
peaking generation and is part of the reason why 25% of electricity was generated with gas in the
United States in 2011, compared to less than 3% in China.
Despite the minor role it has played in China’s energy mix in the past, a combination of
economic, commercial, and policy developments are now making natural gas more attractive and
competitive. Urbanization is driving demand for cooking and heating in China’s rapidly growing
cities. The liquefied petroleum gas (LPG) often used to meet this demand in the past has grown
increasingly expensive thanks to high global oil prices and natural gas is filling the gap. Demand
for gas in the residential sector grew four-fold in China between 2005 and 2011 (Figure 3) and
now has a greater market share than LPG.
The transportation sector has been another major source of natural gas demand growth in China
thanks to the rapid deployment of compressed natural gas (CNG) and liquefied natural gas
(LNG) vehicles. There were roughly 1.5 million natural gas vehicles on the road in China at the
end of 2012, 10 times as many as in the United States. While natural gas prices are considerably
higher in China than in the US, the cost premium for natural gas vehicles is considerably lower.
As of mid-year 2013, buyers could recoup the additional cost of a new CNG car through lower
fuel costs in two months, and recoup the additional cost of a new LNG truck in 10 months
(Morse et al. 2013). Provincial governments have been strongly supportive of natural gas vehicle
deployment as way to reduce urban air pollution. Local natural gas distribution companies (often
owned by provincial or local governments) have pushed natural gas vehicle sales as well because
they are allowed to charge transportation sector consumers a higher price for gas than residential
users.
Finally, natural gas has started to make inroads in electricity generation. Over the past decade,
transportation bottlenecks have emerged between large coal production basins in the northwest
of the country and coal-fired power plants in the east and south and raised the cost of delivered
coal in coastal China considerably. As a result, coastal plants have started looking abroad for
fuel, which has put upward pressure on seaborne coal prices, not only in Asia but other parts of
the world as well. China became a net coal importer in 2009 and is now one of the largest coal
importers in the world (though imports still account for only 5% of total Chinese consumption).

Charting China’s Natural Gas Future
13
This has opened opportunities for natural gas to start competing in the power sector in select
parts of the country. Natural gas is increasingly being used for combined heat and power in
northeast China, and natural gas-fired power plants have been built near LNG receiving
terminals in the Yangze River Delta (YRD) in the east and Pearl River Delta (PRD) in the south.
Growing public concern about urban air quality is also supporting this trend.
Figure 3. Chinese Natural Gas Demand by Sector
Source: EIA, 2013a; NBS, 2013
The Outlook for Chinese Natural Gas Demand
These emerging drivers of natural gas demand in China have made it one of the fastest growing
energy sources, second only to wind and solar (NBS 2013). While that rapid growth is off a very
low base, China is starting to consume enough gas to matter from a global market standpoint.
China surpassed Japan to become the world’s third largest gas consumer in 2009 and Beijing has
set a goal under the 12th Five Year Plan of expanding natural gas from 4% to 7.5% of total
energy supply by 2015 (State Council 2013). China’s National Development and Reform
Commission (NDRC), the entity responsible for economic planning, energy project approval,
and energy price setting, and National Energy Administration (NEA) estimate the 7.5% target
will translate into 230 bcm of demand (Table 2). Recent private sector estimates of Chinese
consumption in 2015 are as high as 260 bcm, nearly twice current levels. Medium- and long-

Charting China’s Natural Gas Future
14
term projections for Chinese demand are all over the map, ranging from 220 to 500 bcm in 2020
and 345 to 600 bcm in 2030.
Table 2. China Natural Gas Demand Projections Billion cubic meters Organization/Individual Report/Source 2015 2020 2025 2030 2035 2040
National Development and
Reform Commission,
National Energy
Administration
12th Five Year Plan for
Natural Gas
230
Pan Jiping, Ministry of Land
and Resources Xinhua News
350-
380
550-
600
Lin Boqiang, Energy
Economics Research Center Nanfang Daily
236 496
International Energy Agency
World Energy Outlook 2012
- Current Policies 303 453 533
World Energy Outlook 2012
- New Policies 195 304 390 469 544
World Energy Outlook 2012
- 450 304 467 537
Energy Information
Administration
International Energy
Outlook 2013 - Reference 159 220 291 369 443 495
International Energy
Outlook 2013 - High GDP 159 226 313 419 528 615
International Energy
Outlook 2013 - Low GDP 159 216 280 345 401 428
Institute of Energy
Economics, Japan
Asia/World Energy Outlook
2012 - Reference 311 531 600
Asia/World Energy Outlook
2012 - Adv. Tech. 282 443 471
Citigroup Natural Gas: A Bumpy 193 287

Charting China’s Natural Gas Future
15
Road to Global Markets
Barclays China Oilfield Services 250 450
BNP Paribas Oil Above Water 230 370
Goldman Sachs China: Energy: Gas: Price
reform implications 260
UBS Accelerating Growth
Outlook 246 396 Source: Chen, Sinha, West, and Pickup, 2013; EIA, 2013b; Gastreich et al., 2013; He, Cheung, Ye, and Lu, 2012; IEA, 2012b; IEEJ, 2013; NEA, 2012; Por, 2013; Yuen et al., 2012; “国土资源部:天然气价格改革两年内扩至全国,” 2013, “林伯强:由煤到油到气符合能源大趋势,” 2013)
To put those numbers in context, current natural gas demand in all of Asia is just over 600 bcm
(BP 2013). The Energy Information Administration (EIA) projects that under current policy,
global natural gas demand excluding China will grow by a little over 200 bcm between 2012 and
2020 (EIA 2013b). The International Energy Agency (IEA) is more bullish, with a forecast of
560 bcm (IEA 2012b). And the Institute of Energy Economics, Japan (IEEJ) is looking for an
additional 670 bcm on non-Chinese demand (IEEJ 2013). Against this backdrop, China could
account for anywhere between 15% and 50% of global demand growth between 2012 and 2020,
based on the forecasts listed in Table 2. Beyond 2020, the uncertainty in China’s demand
outlook, as well as its global significance, only grows.
There are a number of economic, commercial, and political variables that will determine which
natural has demand future comes to pass. The most basic is what happens to the economy
overall. After a decade of greater than 10% average annual growth, the Chinese economy is
beginning to slow. GDP expanded by 9.2% in 2011, 7.7% in 2012, and 7.6% during the first half
of 2013. China is entering a treacherous stage of economic development, a point where other
countries have fallen into what’s often referred to in the development literature as the “middle
income trap” (Eichengreen, Park and Shin 2013). As a result, there is considerable uncertainty
about the rate of economic growth going forward. Much will depend on how successful Beijing
is in adopting urgently needed economic reforms to shift the economy away from investment,
industry, and exports toward domestic consumption, service sector activities, and greater
government spending on essential social services. The World Bank, in cooperation with the

Charting China’s Natural Gas Future
16
Development Research Center (DRC)—the official think tank of China’s State Council—
recently published a roadmap of what such a pro-reform pathway for China could look like
(World Bank and Development Research Center of the State Council 2013). In their assessment,
the Chinese economy has the potential to grow at an average annual rate of 8.6% between 2011
and 2015, 7% between 2016 and 2020, 5.9% between 2021 and 2025, and 5% between 2026 and
2030. But that will require a sustained commitment by Chinese leadership to politically difficult
reforms. If Beijing falters, economic growth could be considerably lower.
Even if the World Bank/DRC’s relatively optimistic growth outlook comes to pass, the structure
of the Chinese economy will be far less energy-intensive going forward than it has been in the
past. The heavy industrial production that feeds property and infrastructure investment requires a
great deal more energy than the domestic consumption and service sector activity that are
increasingly important drivers of growth. This is bad news for coal, iron ore, copper, cement, and
the other resources that have fed the urbanization-led resource boom in China over the past
decade. For these commodities, the China “super cycle” is likely coming to a close. For oil, the
impact is mixed as increased demand for vehicles by an increasingly affluent and consumer-
oriented Chinese middle class will make up for some of the deceleration in industrial demand.
For natural gas, however, economic reform could be a good news story. A shift from an
investment-led to consumption-led Chinese economy has the potential to give natural gas a leg
up on other energy sources, even if overall energy demand growth slows. And given how low
natural gas penetration currently is in China, even modest amounts of fuel switching could lead
to significant natural gas consumption growth in the years ahead. But it won’t happen
automatically—policy is required. The wide range in China demand forecasts outlined in Table 2
reflect in large part uncertainty that such policy will come to pass.
Three areas of policy stand out as particularly important in unlocking future Chinese natural gas
demand—environmental regulation, electricity reform, and natural gas pricing. As people get
richer and able to meet their “bread and butter” needs, they start demanding other services from
their governments, such as the provision of clean air and water. This is happening in large swaths
of urban China today, particularly in and around Beijing, which endured historically bad air
during the first half of 2013 (Wong 2013). The “airpocolypse,” as it’s come to be called, has

Charting China’s Natural Gas Future
17
prompted unusual levels of public criticism of both the central government and local officials
and forced Chinese policymakers to announce a rash of new pollution fighting measures. The
most recent, as of this writing, was an “Air Pollution Prevention and Control Action Plan”
announced by the State Council on September 10, 2013, (“中国大气污染防治行动计划” 2013).
The plan seeks to reduce coal’s share of overall energy consumption in China from 67.1% in
2012 to below 65% by 2017 and to reduce coal consumption in the Beijing-Tianjin-Hebei region
(BTH), as well as the YRD and PRD in absolute terms over the same period. To achieve this, the
plan calls for the closure of essentially all small coal-fired boilers in these areas, bans the
approval of new coal-fired power plants, except for those used for combined heat and power, and
calls for the construction of more than 150 bcm of new natural gas pipeline capacity to enable
diversification away from coal.
These administrative measures will facilitate greater use of natural gas for distributed generation
and combined heat and power in BTH, YRD, and PRD, but are unlikely to result in a major shift
from coal to natural gas as a source of centrally located base-load power generation. In most of
the country, the cost of coal would need to be significantly increased through environmental
taxation or regulation to make natural gas competitive for base-load power. Given current fuel
prices and regulations, the most logical response to the State Council’s Air Pollution Prevention
and Control Action Plan is to build new coal-fired power plants close to mines in the interior of
the country, so as to avoid coal transportation bottlenecks, and ship electricity over high voltage
transmission lines to the BTH, YRD, and PRD regions. This would reduce air pollution along the
coast, but increase it elsewhere and do nothing to address carbon dioxide emissions. Indeed the
State Council’s plan calls for limiting natural gas’s role in base-load power, presumably to leave
more gas available for the distributed generation that can’t be moved out of key cities or
combined heat and power where natural gas has a considerable efficiency advantage.
As urban China becomes both more affluent, however, and the residential and commercial
sectors account for a greater share of total demand, natural gas should become increasingly
attractive as a source of peaking generation. The State Council’s plan encourages the “orderly
development” of natural gas peakers, but the pace and scale of that development will depend on
how electricity market regulation evolves in China in the years ahead. Researchers from the

Charting China’s Natural Gas Future
18
Northern China Electric Power University, the China Society for Economic Reform, and the US-
based Energy and Environmental Economics Inc. find that that natural gas peakers are already
cost competitive in much of China today, but that deployment is hindered by the way electricity
is planned, priced, and dispatched (Hu et al. 2013). Regulatory reform will be required to take
advantage of natural gas’s flexibility as source of generation.
Natural gas price reform will also play an important role in determining future demand.
Traditionally, natural gas prices have been set at the wellhead by the NDRC for different
categories of users (residential, commercial, industrial, transportation, and power generation).
The NDRC also sets pipeline tariffs, which, when combined with the wellhead price, determine
the price of natural gas delivered to the city gate. In most countries residential consumers pay far
more for natural gas than their industrial peers, but China cross-subsidizes residential consumers
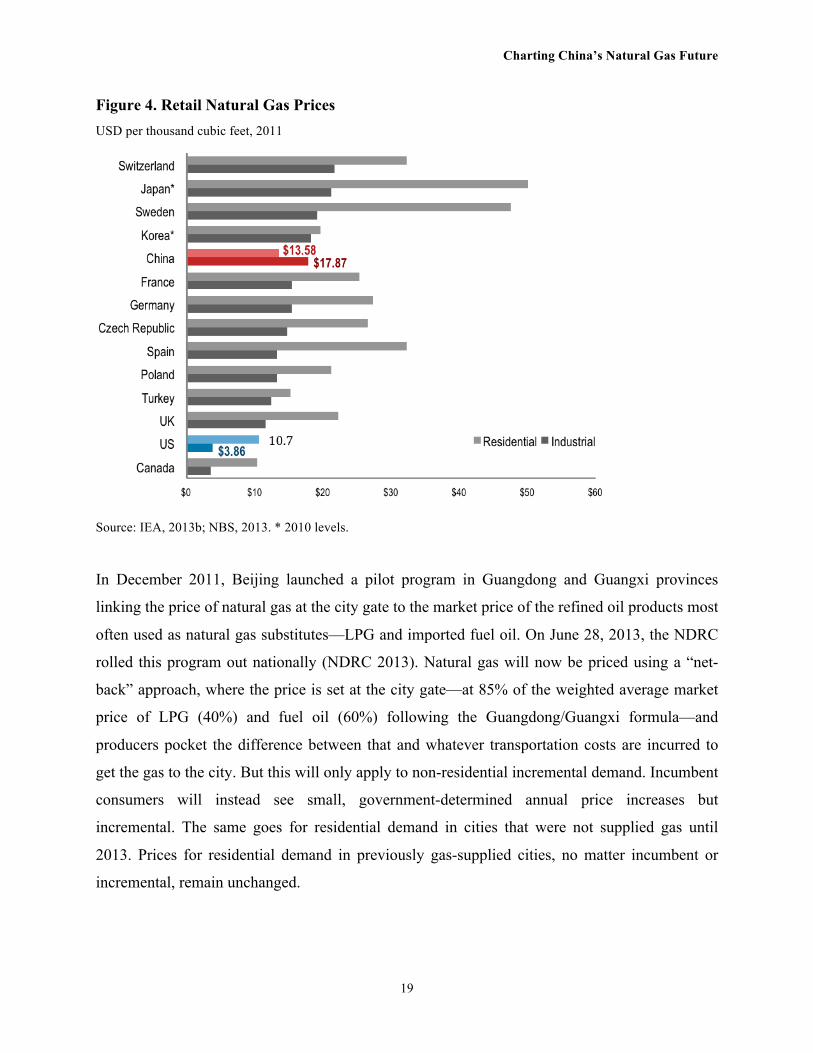
through higher industrial, commercial, and transportation prices (Figure 4).
This is a workable system when each city is served by one or two sources of supply and
residential demand is relatively small compared to other sectors. Over the past few years,
however, China has developed an increasingly interconnected domestic pipeline network and
begun relying more on imported pipeline gas and LNG. And residential demand is now more
than 20% of total consumption. City gate prices are too low to incentivize sufficient new sources
of supply, either foreign or domestic. Many consumers currently using oil for heating, cooking,
and transportation would still find natural gas attractive even if the NDRC raised prices, but
incumbent gas consumers are loath to see their own costs go up, and as a result the market
remains supply-constrained.
Charting China’s Natural Gas Future
19
Figure 4. Retail Natural Gas Prices USD per thousand cubic feet, 2011
Source: IEA, 2013b; NBS, 2013. * 2010 levels.
In December 2011, Beijing launched a pilot program in Guangdong and Guangxi provinces
linking the price of natural gas at the city gate to the market price of the refined oil products most
often used as natural gas substitutes—LPG and imported fuel oil. On June 28, 2013, the NDRC
rolled this program out nationally (NDRC 2013). Natural gas will now be priced using a “net-
back” approach, where the price is set at the city gate—at 85% of the weighted average market
price of LPG (40%) and fuel oil (60%) following the Guangdong/Guangxi formula—and
producers pocket the difference between that and whatever transportation costs are incurred to
get the gas to the city. But this will only apply to non-residential incremental demand. Incumbent
consumers will instead see small, government-determined annual price increases but
incremental. The same goes for residential demand in cities that were not supplied gas until
2013. Prices for residential demand in previously gas-supplied cities, no matter incumbent or
incremental, remain unchanged.

Charting China’s Natural Gas Future
20
All else equal, higher prices for power, industry, and transportation should depress demand for
consumers in those sectors. Indeed in the industrial sector, we expect to see demand growth
slowing in response to higher costs. In the power sector, however, recently announced pollution
control measures should offset the demand impact of the price increase. Electricity reform done
right could lead to greater national gas demand and lower electricity costs, even at higher natural
gas prices. In the transportation sector, natural gas is still competitive with gasoline and diesel at
current oil prices (He, Cheung, and Ye 2013). But significant investment in refueling
infrastructure will be required for natural gas to move beyond taxis and other fleet vehicles and
penetrate the private passenger vehicle market. Most importantly, higher prices should
incentivize additional domestic gas production, which will make Chinese policymakers more
comfortable adopting additional pro-gas policies in the future.
In Search of Supply
Unlike other large Asian gas consumers such as Japan and Korea, China has a decent-sized
domestic resource endowment. China is the eighth largest gas producer in the world and has a
proven reserve/production ratio more than twice as high as the United States (Figure 5). China’s
Ministry of Land and Resources estimates the country possesses 21.8 trillion cubic meters (tcm)
of technically recoverable conventional gas reserves (Gastreich et al. 2013). That’s close to the
28.6 tcm the EIA estimates exists in the US (EIA 2012). Chinese natural gas production grew at
an average annual rate of 13% between 2002 and 2012, though from a low base (NBS 2013). Yet
despite this growth, domestic supply hasn’t been able to keep pace with demand. The wellhead
prices set by the NDRC have been too low to incentivize the development of higher cost
resources, and the country has had to turn to imports to fill the gap.

Charting China’s Natural Gas Future
21
Figure 5. Natural Gas Production and Proven Reserves Share of global total, 2012
Source: BP 2013
The China National Offshore Oil Corporation (CNOOC), one of China’s three major state-
owned oil companies, signed a 25-year LNG supply contract with a consortium of companies
developing Australia’s Northwest Shelf in 2004, and the first shipment was delivered to a 5 bcm
regasification terminal in Shenzhen in 2006. CNOOC signed a second contract for 3.5 bcm of
Indonesian LNG for delivery to a regasification terminal in Fujian that came online in 2009
(Gastreich et al. 2013). A third terminal was built in Shanghai to take Malaysian LNG. As of
mid-year 2013, China had six operating LNG terminals with 29.3 bcm of combined capacity and
another eight terminals with 31.8 bcm of combined capacity under construction (IEA 2013c).
China has started importing natural gas by pipeline as well. A pipeline from Turkmenistan came
online in 2010 and supplied 22 bcm of gas in 2012 (Cunningham and Huang 2013). China has
the ability to import up to 30 bcm of gas from Turkmenistan with current pipeline capacity, and
there are plans to expand this to 65 bcm in the years ahead (IEA 2013c). A 12-bcm pipeline from
Myanmar started operating in 2013 but is only expected to supply 2-4 bcm annually for the next
few years (Cunningham and Huang 2013). There are ongoing discussions between Beijing and
Moscow about building one or more Russia-China gas pipelines.

Charting China’s Natural Gas Future
22
Figure 6. China’s Natural Gas Balance Billion cubic meters
Source: BP 2013
Between LNG and pipeline gas, imports reached 25% of total Chinese natural gas consumption
in 2012 (Figure 6). China’s first two LNG contracts were negotiated when Asian LNG prices
were relatively low. Subsequent LNG contracts, as well as the Turkmenistan and Myanmar
deals, have been considerably more expensive. City gate prices have not kept up with import
costs, and as a result Chinese oil and gas companies have taken large losses on the gas they buy
from abroad. For example, the China National Petroleum Corporation (CNPC), the country’s
largest oil and gas company, lost 42 billion RMB ($6.5 billion) importing natural gas in 2012
(Cunningham and Huang 2013). Many Chinese policymakers are also nervous about becoming
dependent on imports of yet another energy commodity, given the geopolitical and security
implications of the country’s growing trade deficit in oil. Beijing would not allow Chinese
companies to sign new LNG contracts after prices spiked in the mid-2000s. The government
ultimately relented, realizing domestic supply wouldn’t be able to keep up with demand, but has
continued to approach imports with caution.
The recent increase in city gate prices will help alleviate the commercial losses of imported
natural gas. More importantly, it will incentivize new sources of domestic natural gas supply.

Charting China’s Natural Gas Future
23
Conventional onshore gas production will continue to grow, but the real upside potential is in
unconventional gas and offshore supply. China has 12 tcm of technically recoverable tight gas
resources (Gastreich et al. 2012), and tight gas production now accounts for one-quarter of
CNPC’s total output. After years of false starts, coal bed methane (CBM) production has taken
off as well. China has 11 tcm of technically recoverable CBM resources and produced 12.5 bcm
of CBM in 2012 (though only 5.2 bcm of this was utilized—the rest was flared). Chinese
companies have also made large-scale investments in coal-to-gas (CTG) projects, taking
advantage of the relatively low cost of coal at the mine mouth to produce higher value-added
synthetic gas. The 12th Five Year Plan includes 2015 production targets of 16 bcm of (utilized)
CBM and 15-18 bcm of CTG (tight gas is classified as conventional gas by the Chinese
government). These unconventional projects are generally at higher cost than conventional
onshore gas, and the recent price reforms improve the odds of achieving the government’s
production targets. Offshore China holds promise as well. CNOOC and Husky Energy
announced China’s first deep-water natural gas discovery in 2006 in the Liwan 3-1 field in the
South China Sea. The project is slated to begin production in 2014 and anticipated to deliver
more than 5 bcm of gas a year to the Chinese market (Williams 2013). The South China Sea is
home to some of the world’s most volatile territorial disputes, but the EIA estimates that most of
the region’s oil and gas resources are in undisputed areas (EIA 2013c).
Shale to the Rescue?
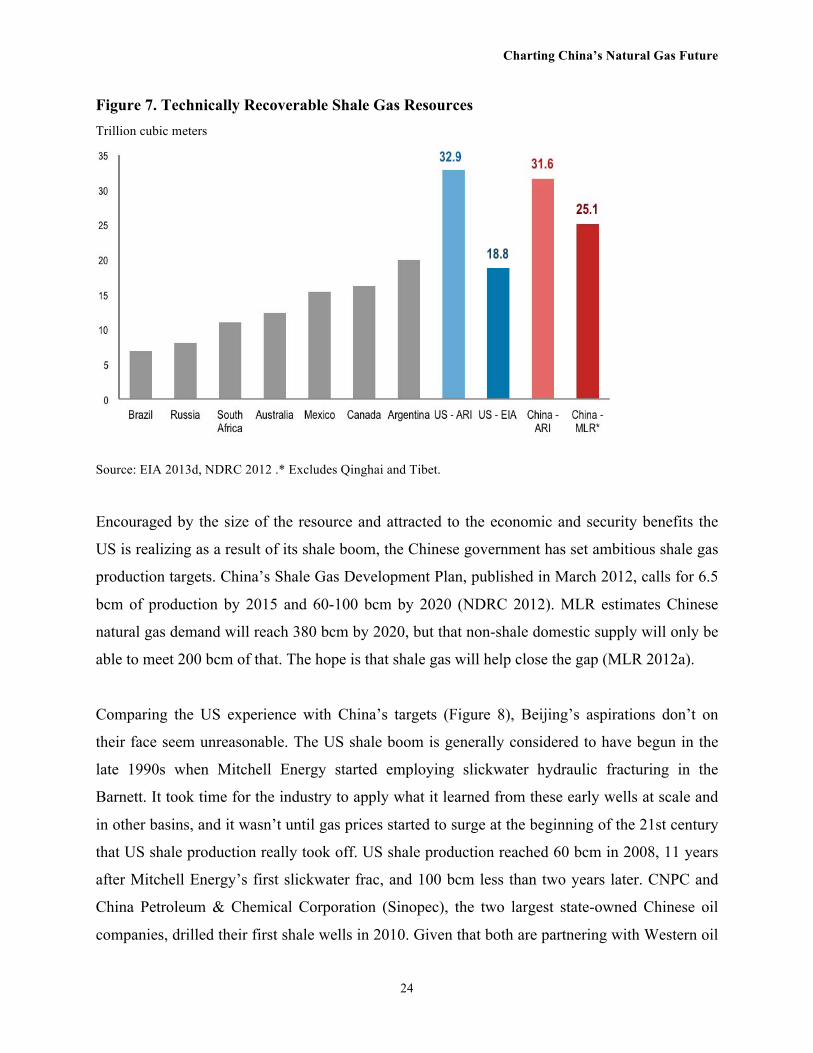
The big question is whether China will be able to replicate the shale gas boom currently taking
place in the United States. A 2011 study by Advanced Resources International (ARI)
commissioned by the EIA made headlines with its estimate that China possesses 36 tcm of
technically recoverable shale gas resources, higher than the 24 tcm of technically recoverable
shale in the United States (EIA 2011). In a 2013 update, ARI lowered their estimates for China
to 31.6 tcm and raised their US estimates to 32.9 tcm (Figure 7). These US figures are higher
than those from the EIA but on par with recent estimates from the Potential Gas Committee
(2012). China’s Ministry of Land and Resources (MLR), which overseas oil and gas leasing, puts
the country’s technically recoverable shale—excluding the Tibet-Qinghai province region—at 25
tcm, a bit lower than the ARI numbers, but still the second largest resource base in the world.
Charting China’s Natural Gas Future
24
Figure 7. Technically Recoverable Shale Gas Resources Trillion cubic meters
Source: EIA 2013d, NDRC 2012 .* Excludes Qinghai and Tibet.
Encouraged by the size of the resource and attracted to the economic and security benefits the
US is realizing as a result of its shale boom, the Chinese government has set ambitious shale gas
production targets. China’s Shale Gas Development Plan, published in March 2012, calls for 6.5
bcm of production by 2015 and 60-100 bcm by 2020 (NDRC 2012). MLR estimates Chinese
natural gas demand will reach 380 bcm by 2020, but that non-shale domestic supply will only be
able to meet 200 bcm of that. The hope is that shale gas will help close the gap (MLR 2012a).
Comparing the US experience with China’s targets (Figure 8), Beijing’s aspirations don’t on
their face seem unreasonable. The US shale boom is generally considered to have begun in the
late 1990s when Mitchell Energy started employing slickwater hydraulic fracturing in the
Barnett. It took time for the industry to apply what it learned from these early wells at scale and
in other basins, and it wasn’t until gas prices started to surge at the beginning of the 21st century
that US shale production really took off. US shale production reached 60 bcm in 2008, 11 years
after Mitchell Energy’s first slickwater frac, and 100 bcm less than two years later. CNPC and
China Petroleum & Chemical Corporation (Sinopec), the two largest state-owned Chinese oil
companies, drilled their first shale wells in 2010. Given that both are partnering with Western oil

Charting China’s Natural Gas Future
25
and gas majors and service companies that now have extensive shale expertise, it’s not
outlandish to think China could ramp up production to 60-100 bcm a year or two quicker than in
the US. Yet despite Beijing’s enthusiasm for shale development, there is good reason for
skepticism that these targets will be achieved.
Figure 8. US Shale Experience vs. Chinese Targets Billion cubic meters of production
Source: EIA 2013e, NDRC 2012
First, based on the limited information currently available, it appears the shale resource base in
China may be less commercially attractive than in the US. For example, ARI notes in its most
recent assessment that “most Chinese shale basins are tectonically complex with numerous
faults—some seismically active—which is not conducive to shale development” (EIA 2013d).
Differences between US and Chinese shales also mean the technical and operational experience
of American companies, or Chinese companies that have invested in US shale plays over the past
few years, is not fully portable to China.
Second, early US shale production took place in relatively sparsely populated parts of the
country with good existing pipeline, road, and water infrastructure. The southern Sichuan
province and the city of Chonqing, the largest shale basin in China, have good infrastructure but

Charting China’s Natural Gas Future
26
are also densely populated. Much of the natural gas in the region is also high-sulfur. This proved
a deadly combination in 2003 when a high-sulfur gas well explosion in Chongqing killed 243
people and poisoned more than 2,000 (People’s Daily 2003). Companies are now much more
cautious, often relocating whole villages before production commences. This can slow the pace
of development considerably. For example, Chevron signed a production-sharing contract with
CNPC in 2007 to develop high-sulfur tight gas in the Chuandongbei area of Sichuan province.2
That field did not go into production until 2013. The Tarim and Junggar basins in Xinjiang
province are scarcely populated but also lack good pipeline, road, or water infrastructure. And
water allocation rights can become a major stumbling block even in areas with adequate water
resources overall.
The most important difference between the United States and China, however, is the oil and gas
market structure. In the US, the vast majority of shale development has occurred on private
lands. Dozens of oil and gas companies competed with each other for the right to lease land from
private owners. Even relatively small firms were able to secure enough investment to lease and
develop shale acreage thanks to liquid capital markets and natural gas futures traded on the New
York Mercantile Exchange (NYMEX). Robust competition among producers drove the dramatic
increase in production and sharp decline in prices in the US over the past few years.
By contrast, in China, conventional oil and gas production is legally restricted to three central
government-owned companies—CNPC, Sinopec, and CNOOC—and one provincially owned
company—Shaanxi Yanchang Petroleum Group. That means the pace of oil and gas
development has traditionally been dictated by the commercial incentives and capital budgeting
of these four companies. And at past well-head natural gas prices, the incentive for investing in
new natural gas production (particularly if it comes at the expense of relatively profitable oil
production investment) hasn’t been that high.
In an effort to increase competition and accelerate production, the MLR classified shale gas as a
new mineral (the 172nd mineral discovered in China) in December 2011, which opened up
2 “Chevron to Partner With CNPC on Major Gas Project in China,” Chevron press release, Dec. 18, 2007, http://www.chevron.com/news/press/release/?id=2007-12-18.

Charting China’s Natural Gas Future
27
production rights to all Chinese companies (MLR 2012b). The problem is that the majority of the
attractive shale acreage is in areas already leased by CNPC, Sinopec, and Yanchang for
conventional production (MLR 2012a). And when MLR announced their first tender for 11,000
square km of the remaining shale acreage, they limited participation to these three plus CNOOC
and two CBM producers.
For its second tender in October 2012, however, MLR invited all “qualified” Chinese companies
to bid on 20 blocks covering roughly 20,000 square km.3 On September 14, 2012, MLR
announced that 91 tenderers had passed the first round including 52 SOEs, five Chinese-foreign
JVs (including HK, Macau, and Taiwanese JVs), and 34 private companies. Of these, 83 filed
tenders on October 25, 2012, including 55 SOEs, 26 private companies, and two Chinese-foreign
JVs. Leases for 19 blocks were awarded to 16 different companies including two private firms.
One of the blocks did not receive the required three bid minimum and was thus not leased.
The success of these companies in developing their newly acquired acreage remains to be seen.
None have shale gas development experience and will need to partner with Chinese and foreign
service providers. Under the best case scenario these blocks will make only a modest
contribution to the country’s shale gas production target, given the quality and scale of the
resource covered by the tender. And there have been news reports that some of the winning
bidders have, upon further examination, have found the resource to be even less attractive than
expected and in some cases are seeking to transfer their leases to other entities.
The price reforms introduced in 2013 increase the incentive for CNPC, Sinopec, CNOOC, and
Yanchang to scale up shale gas production. Based on our review of the investment plans of those
companies, however, we do not believe the 2015 production target of 6.5 bcm will be reached.
And meeting Beijing’s 2020 target of 60-100 bcm will be extremely difficult. Shale gas does,
however, have a potentially bright future in China beyond 2020. But the pace of development
will hinge on the government’s willingness to allow other Chinese companies (and even, 3 Bidders were required to meet three criteria to qualify: 1) be a domestically registered Chinese enterprise or Sino-foreign joint enterprise controlled by Chinese stakeholders with minimum registration capital of RMB 300 million, healthy financial conditions and accounting systems, and the ability to assume civil responsibilities independently; 2) have petroleum/natural gas or other gas mineral exploration qualifications, or enter into a cooperative relationship with another institution with such qualifications; and 3) be an independent legal entity, not a joint bidding group.

Charting China’s Natural Gas Future
28
potentially, foreign companies) to compete for the right to develop the acreage currently held by,
and sell gas into a pipeline network owned and operated by, CNPC and Sinopec. Given the
political influence of these two companies (their chairmen have ministerial rank in the Chinese
government) such a move will be challenging, to say the least. Past efforts to limit their power
have often fallen flat.
Recent events, however, suggest that the Xi-Li administration might have more appetite for
taking on the oil majors than their predecessors. In August of this year the CCP’s Central
Discipline and Inspection Committee (CDIC) launched a corruption investigation into CNPC,
implicating Jiang Jiemin, the former head of CNPC who was moved over to run the State-Owned
Assets Supervision and Administration Commission (SASAC) shortly after. Jiang has since been
sacked, along with four senior executives at CNPC. There is considerable speculation about
whether this is part of a broader anti-corruption drive or whether it’s a political campaign
targeted at Zhou Yongkong, a former CNPC executive and Xi Jinping rival who recently retired
from the Politburo Standing Committee.4 Under either hypothesis, CNPC could have less
political influence going forward than it has had in the past, opening the door for increased
competition in upstream oil and gas production.
Conclusion
How China’s natural gas market evolves over the coming decades will have significant global
consequences. If Beijing adopts the suite of reforms discussed above—in environmental
regulation, electricity policy, natural gas pricing, and competition policy—natural gas demand
could expand considerably, but so too could domestic supply. These reforms won’t be easy.
Inflation concerns and consumer pressure will continue to serve as a gating factor on efforts to
strengthen environmental regulation and raise natural gas prices. Powerful vested interests will
likely push back against efforts to change the way electricity is planned, priced, and dispatched.
And the oil majors will resist efforts to increase competition in onshore natural gas production.
But if Chinese policymakers balk in the face of these pressures, they will face a host of other
challenges—increased reliance on imported natural gas, higher coal demand, and dirtier air.
4 See, for example, http://www.brookings.edu/blogs/up-front/posts/2013/09/11-tiger-hunt-china-oil-patch-downs.
Charting China’s Natural Gas Future
29
References
BP. 2013. Statistical Review of World Energy. London: BP plc.
Chen, C., Sinha, S., West, J. C., and Pickup, M. 2013. China Oilfield Services. Hong Kong: Barclays.
Cunningham, G., and Huang, D. 2013. PetroChina (0857.HK) Downgrade to Sell on Falling Recurring Earnings. Hong Konh: Citigroup.
EIA. 2011. World Shale Gas Resources: An Initial Assessment of 14 Regions Outside the United States. Washington, D.C.: Energy Information Administration.
EIA. 2012. Annual Energy Review. Washington, D.C.: Energy Information Administration. Retrieved from http://www.eia.gov/totalenergy/data/annual/index.cfm
EIA. 2013a. Monthly Energy Review. Washington, D.C.: Energy Information Administration, U.S. Department of Energy.
EIA. 2013b. International Energy Outlook. Washington, D.C.: Energy Information Administration.
EIA. 2013c. South China Sea. Washington, D.C.: Energy Information Administration. Retrieved from http://www.eia.gov/countries/regions-topics.cfm?fips=SCS
EIA. 2013d. Technically Recoverable Shale Oil and Shale Gas Resources: An Assessment of 137 Shale Formations in 41 Countries Outside the United States (Vol. 2013). Washington, D.C.: Energy Information Administration.
EIA. 2013e. Natural Gas Data. Retrieved September 07, 2012, from http://www.eia.gov/naturalgas/data.cfm
Eichengreen, B., Park, D., and Shin, K. 2013. Growth Slowdowns Redux: New Evidence on the Middle-Income Trap. Cambridge. Retrieved from http://www.nber.org/papers/w18673
Gastreich, P., Li, B., Chen, B., Wong, A., and Sedita, A. 2012. Will oilfield services and equipment evolve to meet onshore production challenges? Hong Kong: UBS.
Gastreich, P., Oldfield, S., Peng, Y., Chen, B., Ramsay, G., Li, B., and Liu, K. 2013. China Integrated Natural Gas: Accelerated Growth Outlook. Hong Kong: UBS Investment Research.
He, F., Cheung, S., and Ye, A. 2013. Gas Stress testing earnings and valuation risk on city gate price hikes. Hong Kong: Goldman Sachs.

Charting China’s Natural Gas Future
30
He, F., Cheung, S., Ye, A., and Lu, J. 2012. China: Energy: Gas Pricing reform implications, focus on returns. Hong Kong: Goldman Sachs.
Hu, J., Kwok, G., Xuan, W., Williams, J. H., and Kahrl, F. 2013. Using natural gas generation to improve power system efficiency in China. Energy Policy, 60(2), 116–121. doi:10.1016/j.enpol.2013.04.066
IEA. 2002. World Energy Outlook. Paris: International Energy Agency. Retrieved from http://www.worldenergyoutlook.org/docs/weo2002_part1.pdf
IEA. 2006. World Energy Outlook. Paris: International Energy Agency.
IEA. 2012a. World Energy Outlook. Paris: International Energy Agency.
IEA. 2012b. World Energy Outlook. Paris: International Energy Agency.
IEA. 2013a. World Energy Balances. Paris: OECD/IEA.
IEA. 2013b. Energy Prices and Taxes Statistics. Paris: International Energy Agency.
IEA. 2013c. Medium-Term Gas Market Report 2013. International Energy Agency. doi:10.1787/gas_market-2013-en
IEEJ. 2013. Asia/World Energy Outlook 2012. Tokyo: The Institute of Energy Economics, Japan.
MLR. 2012a. 全国页岩气资源潜力调查评价及有利区优选. Beijing: Ministry of Land and Resources of the People’s Republic of China. Retrieved from http://www.mlr.gov.cn/xwdt/jrxw/201203/t20120302_1069466.htm
MLR. 2012b. 页岩气获批为新独立矿种 大规模开发即将启动. Beijing: Ministry of Land and Resources of the People’s Republic of China. Retrieved from http://www.mlr.gov.cn/xwdt/kyxw/201201/t20120104_1054777.htm
Morse, E. L., Yuen, A., Kleinman, S. M., Wetherbee, C., Thein, T., Michaeli, I., … Smith, R. P. 2013. Energy 2020: Trucks Trains and Automobiles. New York: Citigroup.
Naughton, B. 2007. The Chinese Economy: Transitions and Growth. Cambridge: Massachusettes Institute of Technology Press.
National Bureau of Statistics. 2013. China Statistical Yearbook. New York: CEIC China Premium Database.
NDRC. 2012. 页岩气发展规划(2011-2015 年. Beijing: National Development and Reform Commission of China. Retrieved from http://www.ndrc.gov.cn/zcfb/zcfbtz/2012tz/W020120316370486643634.pdf

Charting China’s Natural Gas Future
31
NDRC. 2013. 国家发展改革委关于调整天然气价格的通知. Beijing: National Development and Reform Commission of China. Retrieved from http://www.ndrc.gov.cn/zcfb/zcfbtz/2013tz/t20130628_547850.htm
NEA. 2012. 天然气发展“十二五”规划. Beijing: National Energy Administration, National Development Reform Commission. Retrieved from http://zfxxgk.nea.gov.cn/auto86/201212/W020121203312244945303.pdf
People's Daily. 2003. Trial of Chongqing 12-23 Natural Gas Well Explosion Case. Retrieved from http://legal.people.com.cn/GB/43027/31108/index.html
Por, Y. L. 2013. China Oil & Gas: Oil Above Water. Hong Kong: BNP Paribas.
Potential Gas Committee. 2012. Potential Supply of Natural Gas in the United States.
Rosen, D. H., and Houser, T. 2007. China Energy: A Guide for the Perplexed. Washington, D.C.: Peterson Institute for International Economics.
State Council. 2013. 国务院关于印发能源发展“十二五”规划的通知. Beijing: State Council of the People’s Republic of China. Retrieved from http://www.gov.cn/zwgk/2013-01/23/content_2318554.htm
UN Statistics Division. 2013. United Nations Commodity Trade Statistics Database. Retrieved September 07, 2012, from http://comtrade.un.org/
USGS. 2013. Mineral Commodity Summaries. Washington, D.C.: U.S. Department of the Interior.
Williams, N. 2013. Husky Energy says Liwan Gas Project on track. Reuters. Calgary. Retrieved from http://www.reuters.com/article/2013/05/07/huskyenergy-results-idUSL2N0DO1KU20130507
Wong, E. 2013. Air Pollution Linked to 1.2 Million Premature Deaths in China. New York Times. Beijing. Retrieved from http://www.nytimes.com/2013/04/02/world/asia/air-pollution-linked-to-1-2-million-deaths-in-china.html
World Bank and Development Research Center of the State Council. 2013. China 2030.
Yuen, A., Kleinman, S. M., Morse, E. L., Lee, E. G., Ahn, D. P., and Doshi, A. 2012. Natural Gas: Bumpy Road to Global Markets. New York: Citigroup.
中国大气污染防治行动计划公布. 2013. Xinhua News. Beijing. Retrieved from http://news.xinhuanet.com/fortune/2013-09/12/c_117337516.htm

Charting China’s Natural Gas Future
32
国土资源部:天然气价格改革两年内扩至全国. 2013. Xinhua News. Beijing. Retrieved from http://news.xinhuanet.com/house/nj/2013-06-20/c_116222360.htm
林伯强:由煤到油到气符合能源大趋势. 2013. Nanfang Daily. Beijing. Retrieved from http://energy.people.com.cn/n/2013/0816/c71661-22587462.html


![GEOPOLITICS OF GAS[INDEX] · 4 The Geopolitics of Gas: Common Pr oblems, Disparate Strategies Until the 1990s, natural gas was by and large perceived as a by-product of oil fields,](https://static.documents.pub/doc/80x56/5edcf51ead6a402d6667dcfb/geopolitics-of-gasindex-4-the-geopolitics-of-gas-common-pr-oblems-disparate.jpg)


