The Physics The Idea The Present The Future The Gerda Experiment - A Search for Neutrinoless Double Beta Decay Francis Froborg On behalf of the Gerda Collaboration University of Zurich TeV PA Stockholm 05. August 2011 Francis Froborg The Gerda Experiment 1 / 19
Transcript
The Physics The Idea The Present The Future
The Gerda Experiment - A Search forNeutrinoless Double Beta Decay
Francis FroborgOn behalf of the Gerda Collaboration
University of Zurich
TeV PA Stockholm05. August 2011
Francis Froborg The Gerda Experiment 1 / 19
The Physics The Idea The Present The Future
Neutrino Physics
We knowNeutrinos have mass
Mass difference betweeneigenstates
Three big questions
Absolute mass scale
Mass hierarchy
Majorana vs. Dirac
Francis Froborg The Gerda Experiment 2 / 19
The Physics The Idea The Present The Future
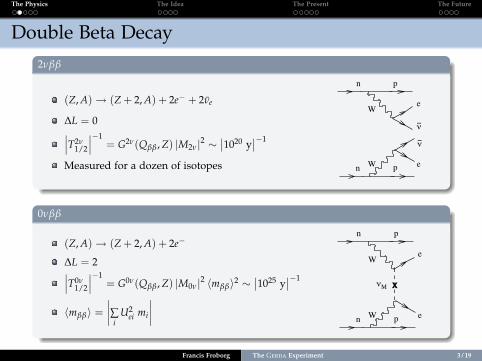
Double Beta Decay2νββ
(Z, A)→ (Z + 2, A) + 2e− + 2νe
∆L = 0∣∣∣T2ν1/2
∣∣∣−1= G2ν(Qββ, Z) |M2ν|2 ∼
∣∣1020 y∣∣−1
Measured for a dozen of isotopes
3
!"
"
n
n p
p
e
e
!
W
W
"#
n
n p
p
e
eW
W
x
FIG. 2 Feynman Diagrams for !!(2") (left) and !!(0")(right).
where G0!(Q"" , Z) is the phase space factor for the emis-sion of the two electrons, M0! is another nuclear matrixelement, and !m""" is the “e!ective” Majorana mass ofthe electron neutrino:
!m""" # |!
k
mkU2ek| . (3)
Here the mk’s are the masses of the three light neutrinosand U is the matrix that transforms states with well-defined mass into states with well-defined flavor (e.g.,electron, mu, tau). Equation 2 gives the !!(0") rateif the exchange of light Majorana neutrinos with lefthanded interactions is responsible. Other mechanismsare possible (see Sections III and IV.D), but they requirethe existence of new particles and/or interactions in ad-dition to requiring that neutrinos be Majorana particles.Light-neutrino exchange is therefore, in some sense, the“minima” mechanism and the most commonly consid-ered.
That neutrinos mix and have mass is now acceptedwisdom. Oscillation experiments constrain U fairly well
— Table I summarizes our current knowledge — but theydetermine only the di!erences between the squares of themasses mk (e.g., m2
2 $m21) rather than the masses them-
selves. It will turn out that !!(0") is among the bestways of getting at the masses (along with cosmology and!-decay measurements), and the only practical way toestablish that neutrinos are Majorana particles.
To extract the e!ective mass from a measurement, itis customary to define a nuclear structure factor FN #G0!(Q"" , Z)|M0! |2m2
e, where me is the electron mass.(The quantity FN is sometimes written as Cmm.) Thee!ective mass !m""" can be written in terms of the cal-culated FN and the measured half life as
!m""" = me[FNT 0!1/2]
!1/2 . (4)
The range of mixing matrix values given below in Ta-ble I, combined with calculated values for FN , allow usto estimate the half-life a given experiment must be ableto measure in order to be sensitive to a particular valueof !m""". Published values of FN are typically between10!13 and 10!14 y!1. To reach a sensitivity of !m"""%0.1 eV, therefore, an experiment must be able to observea half life of 1026 $ 1027 y. As we discuss later, at thislevel of sensitivity an experiment can draw importantconclusions whether or not the decay is observed.
The most sensitive limits thus far are from theHeidelberg-Moscow experiment: T 0!
1/2(76Ge) & 1.9 '
1025 y (Baudis et al., 1999), the IGEX experiment:T 0!
1/2(76Ge) & 1.6 ' 1025 y (Aalseth et al., 2002a, 2004),
and the CUORICINO experiment T 0!1/2(
130Te) & 3.0 '1024 y (Arnaboldi et al., 2005, 2007). These experimentscontained 5 to 10 kg of the parent isotope and ran forseveral years. Hence, increasing the half-life sensitivityby a factor of about 100, the goal of the next generationof experiments, will require hundreds of kg of parent iso-tope and a significant decrease in background beyond thepresent state of the art (roughly 0.1 counts/(keV kg y).
It is straightforward to derive an approximate an-alytical expression for the half-life to which an ex-periment with a given level of background is sensi-tive (Avignone et al., 2005):
T 0!1/2(n#) =
4.16 ' 1026y
n#
" #a
W
#
$
Mt
b"(E). (5)
Here n# is the number of standard deviations correspond-ing to a given confidence level (C.L.) — a CL of 99.73%corresponds to n# = 3 — the quantity # is the event-detection and identification e#ciency, a is the isotopicabundance, W is the molecular weight of the source ma-terial, and M is the total mass of the source. The in-strumental spectral-width "(E), defining the signal re-gion, is related to the energy resolution at the energyof the expected !!(0") peak, and b is the specific back-ground rate in counts/(keV kg y), where the mass is that
0νββ
(Z, A)→ (Z + 2, A) + 2e−
∆L = 2∣∣∣T0ν1/2
∣∣∣−1= G0ν(Qββ, Z) |M0ν|2 〈mββ〉2 ∼
∣∣1025 y∣∣−1
〈mββ〉 =∣∣∣∣∑
iU2
ei mi
∣∣∣∣
3
!"
"
n
n p
p
e
e
!
W
W
"#
n
n p
p
e
eW
W
x
FIG. 2 Feynman Diagrams for !!(2") (left) and !!(0")(right).
where G0!(Q"" , Z) is the phase space factor for the emis-sion of the two electrons, M0! is another nuclear matrixelement, and !m""" is the “e!ective” Majorana mass ofthe electron neutrino:
!m""" # |!
k
mkU2ek| . (3)
Here the mk’s are the masses of the three light neutrinosand U is the matrix that transforms states with well-defined mass into states with well-defined flavor (e.g.,electron, mu, tau). Equation 2 gives the !!(0") rateif the exchange of light Majorana neutrinos with lefthanded interactions is responsible. Other mechanismsare possible (see Sections III and IV.D), but they requirethe existence of new particles and/or interactions in ad-dition to requiring that neutrinos be Majorana particles.Light-neutrino exchange is therefore, in some sense, the“minima” mechanism and the most commonly consid-ered.
That neutrinos mix and have mass is now acceptedwisdom. Oscillation experiments constrain U fairly well
— Table I summarizes our current knowledge — but theydetermine only the di!erences between the squares of themasses mk (e.g., m2
2 $m21) rather than the masses them-
selves. It will turn out that !!(0") is among the bestways of getting at the masses (along with cosmology and!-decay measurements), and the only practical way toestablish that neutrinos are Majorana particles.
To extract the e!ective mass from a measurement, itis customary to define a nuclear structure factor FN #G0!(Q"" , Z)|M0! |2m2
e, where me is the electron mass.(The quantity FN is sometimes written as Cmm.) Thee!ective mass !m""" can be written in terms of the cal-culated FN and the measured half life as
!m""" = me[FNT 0!1/2]
!1/2 . (4)
The range of mixing matrix values given below in Ta-ble I, combined with calculated values for FN , allow usto estimate the half-life a given experiment must be ableto measure in order to be sensitive to a particular valueof !m""". Published values of FN are typically between10!13 and 10!14 y!1. To reach a sensitivity of !m"""%0.1 eV, therefore, an experiment must be able to observea half life of 1026 $ 1027 y. As we discuss later, at thislevel of sensitivity an experiment can draw importantconclusions whether or not the decay is observed.
The most sensitive limits thus far are from theHeidelberg-Moscow experiment: T 0!
1/2(76Ge) & 1.9 '
1025 y (Baudis et al., 1999), the IGEX experiment:T 0!
1/2(76Ge) & 1.6 ' 1025 y (Aalseth et al., 2002a, 2004),
and the CUORICINO experiment T 0!1/2(
130Te) & 3.0 '1024 y (Arnaboldi et al., 2005, 2007). These experimentscontained 5 to 10 kg of the parent isotope and ran forseveral years. Hence, increasing the half-life sensitivityby a factor of about 100, the goal of the next generationof experiments, will require hundreds of kg of parent iso-tope and a significant decrease in background beyond thepresent state of the art (roughly 0.1 counts/(keV kg y).
It is straightforward to derive an approximate an-alytical expression for the half-life to which an ex-periment with a given level of background is sensi-tive (Avignone et al., 2005):
T 0!1/2(n#) =
4.16 ' 1026y
n#
" #a
W
#
$
Mt
b"(E). (5)
Here n# is the number of standard deviations correspond-ing to a given confidence level (C.L.) — a CL of 99.73%corresponds to n# = 3 — the quantity # is the event-detection and identification e#ciency, a is the isotopicabundance, W is the molecular weight of the source ma-terial, and M is the total mass of the source. The in-strumental spectral-width "(E), defining the signal re-gion, is related to the energy resolution at the energyof the expected !!(0") peak, and b is the specific back-ground rate in counts/(keV kg y), where the mass is that
Francis Froborg The Gerda Experiment 3 / 19
The Physics The Idea The Present The Future
Signature
Measuring the energy of both electrons
2νββ: Continuous energy spectrum
0νββ: Sharp peak at Q value of decay
Q = Emother − Edaugther − 2me
Schechter & Valle (1982): Measuring 0νββ⇒ ν Majorana particle
Francis Froborg The Gerda Experiment 4 / 19
The Physics The Idea The Present The Future
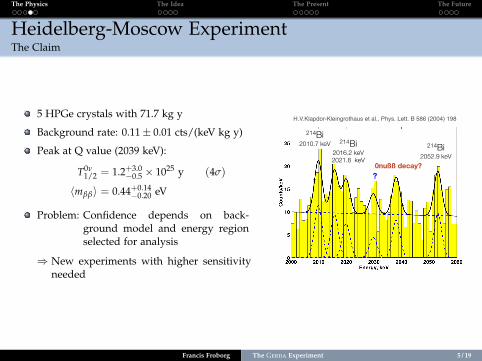
Heidelberg-Moscow ExperimentThe Claim
5 HPGe crystals with 71.7 kg y
Background rate: 0.11± 0.01 cts/(keV kg y)
Peak at Q value (2039 keV):
T0ν1/2 = 1.2+3.0
−0.5 × 1025 y (4σ)
〈mββ〉 = 0.44+0.14−0.20 eV
Problem: Confidence depends on back-ground model and energy regionselected for analysis
⇒ New experiments with higher sensitivityneeded
Evidenz für den Neutrinolosen Doppelbetazerfall?
• Peak beim Q-Wert des Zerfalls
• Periode 1990-2003: 28.8 ± 6.9 Ereignisse
• Periode 1995-2003: 23.0 ± 5.7 Ereignisse
! 4.1- 4.2 ! Evidenz
• ‘Evidenz’ unklar
! muss mit neuen, empfindlicheren Experimenten getestet werden
T1/2
0!= 1.2 "10
25yr
214Bi2010.7 keV 214Bi
2016.2 keV
2021.8 keV
214Bi2052.9 keV
0nußß decay?
?
H.V.Klapdor-Kleingrothaus et al., Phys. Lett. B 586 (2004) 198
m!e = 0.44 eV (0.3"1.24) eV
Francis Froborg The Gerda Experiment 5 / 19
The Physics The Idea The Present The Future
The Experimental Challenge
Sensitivity
T0ν1/2 ∝ 〈mββ〉−2 ∝ const
√M× t
∆E× B
M Mass
t Time
B Background rate
∆E Energy resolution Maneschg, Merle, Rodejohan, arXiv:0812.0479v1
1
Francis Froborg The Gerda Experiment 6 / 19
The Physics The Idea The Present The Future
Possibilities to Reduce Background
Underground Location LNGS 1400 m (3400 mwe) underground
Material Reduction Immerse Ge detectors nakedly into liquidargon
Material Selection Low radioactive materials used
Shielding Large cryostat inside a water Cherenkovtank
Identification Muon vetoDiscrimination between single scatter(signal) and multi-scatter (background)events
Francis Froborg The Gerda Experiment 7 / 19
The Physics The Idea The Present The Future
Design
Cryostat
Detector Array
Water Tankwith
MuonVeto
Lock and Lowering Systems
Francis Froborg The Gerda Experiment 8 / 19
The Physics The Idea The Present The Future
Phase I
The DetectorsClosed-ended coaxial detectors
8 diodes from HdM and IGEXenriched in 76Ge
6 diodes from Genius test facility,natural Ge
∼ 15 kg of 76Ge
The GoalsTest Klapdor’s Claim
Exposure 15 kg y
Background 10−2 cts/(keV kg y)
Half-life T1/2 > 2.2× 1025 y
Majorana mass mee < 0.27 eV
Francis Froborg The Gerda Experiment 9 / 19
The Physics The Idea The Present The Future
Phase II
The DetectorsAll Phase I detectors
Broad-Energy Germanium(BEGe) detectors enriched in 76Ge
A total of ∼ 40 kg of 76Ge
The GoalsExposure 100 kg y
Background 10−3 cts/(keV kg y)
Half-life T1/2 > 15× 1025 y
Majorana mass mee < 0.11 eV
Phase II Detector Production� Purchase Enriched 76GeO2: ECP Zelenogorsk, RU� Metal Reduction and Zone Refinement: Langelsheim, DE
08.03.2010 to 30.4.2010� Crystal Pulling at Canberra: Oakridge, TN, USA� BEGe Detector Diode Production: Olen, BE
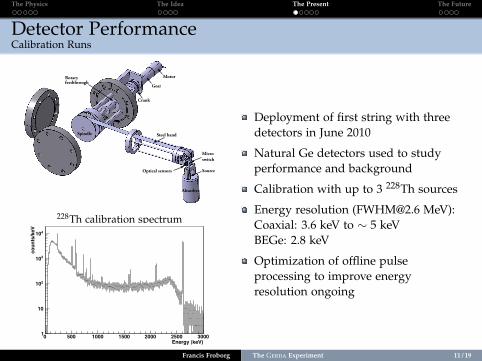
Deployment of first string with threedetectors in June 2010
Natural Ge detectors used to studyperformance and background
Calibration with up to 3 228Th sources
Energy resolution ([email protected] MeV):Coaxial: 3.6 keV to ∼ 5 keVBEGe: 2.8 keV
Optimization of offline pulseprocessing to improve energyresolution ongoing
Francis Froborg The Gerda Experiment 11 / 19
The Physics The Idea The Present The Future
Background42Ar / 42K
The Surprise
Background a factor of ∼ 18 higher thanPhase I goal
Explanation: 42Ar / 42K
Gerda proposal:42Ar/natAr < 3 · 10−21
Barabash et al. 2002
True value up to ×10 higher
42Ar
T1/2 = 32.9 y
Qβ = 599 keV
42K
T1/2 = 12.36 h
Qβ = 3525 keV
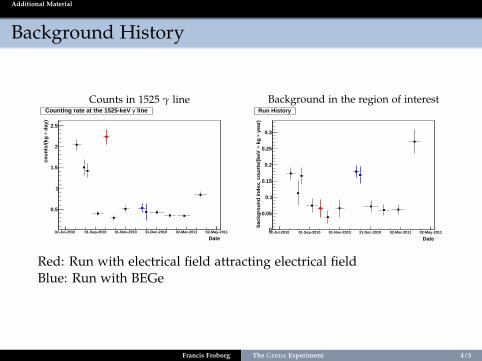
42K line at 1525 keV
Energy (keV)1400 1450 1500 1550 1600 1650
yea
r)×
kg
×co
unts
/(keV
0
20
40
60
80
100
120
Before mini-shroud installation
GERDA background
!"#$%&'()#*+,-.. ,-/. ,/.. ,//. ,0.. ,0/.
'$+
')%'
234"567()#*
.
8.
-.
0.
9.
,..
,8.
run 1 - 3
run 10-11
• 42K+ drift in the electric field
• Changing field configuration changes intensities
Fabiana Cossavella GERDA commissioning results and summary of double beta decay projects 10/14
Francis Froborg The Gerda Experiment 12 / 19
The Physics The Idea The Present The Future
Background Improvements
The Theory
High-energy background from β-decaysof 42K ions collected on the outer surfaceof the detector
The Solution: Cu Cylinder
Cu foil cylinder with an innerdiameter of 113 mm
Reduces volume which the ions canbe collected
Can be biased with ± HV
Reduces background in ROI by afactor of ∼ 3
IS
PANIC11 28jul 2011 GERDA status & perspectives K.T.Knöpfle
commissioning study of Ar-42/K-42 via 1525 keV line
run 5 IS/OS -200V/+500V
run 4 with inner shroud IS/OS: OV/-400V
+3kV
0V
Count rate of 1525 peak factor ~14 larger than expected.
Biasing IS/OS such that positive ions are attracted by IS: Count rate increases to about previous value.
Additional inner shroud (IS) reduces counts by factor of 4-5. Still larger than expected! IS shields E- field and convection. NB: Similar observations at Q !
Clear evidence that 42K-ions drift in electric field. Potentially severe consequences for background at Q ! Field-free configurations desirable!
OS (30 m Cu) Ø 80 cm
Francis Froborg The Gerda Experiment 13 / 19
The Physics The Idea The Present The Future
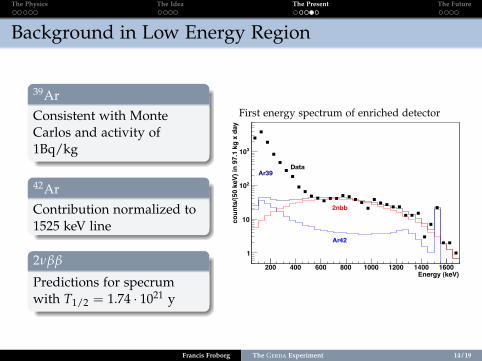
Background in Low Energy Region
39ArConsistent with MonteCarlos and activity of1Bq/kg
42ArContribution normalized to1525 keV line
2νββ
Predictions for specrumwith T1/2 = 1.74 · 1021 y
First energy spectrum of enriched detector
Energy (keV)200 400 600 800 1000 1200 1400 1600
coun
ts/(5
0 ke
V) in
97.
1 kg
x d
ay
1
10
210
310
DataAr39
Ar42
2nbb
Francis Froborg The Gerda Experiment 14 / 19
The Physics The Idea The Present The Future
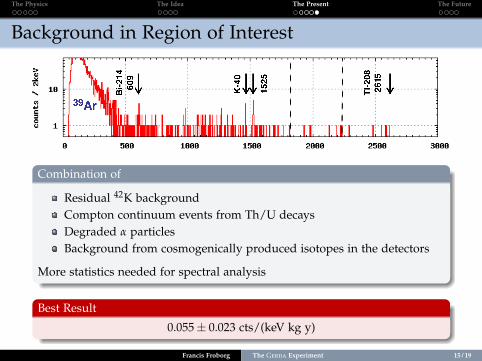
Background in Region of Interest
Combination of
Residual 42K backgroundCompton continuum events from Th/U decaysDegraded α particlesBackground from cosmogenically produced isotopes in the detectors
More statistics needed for spectral analysis
Best Result
0.055± 0.023 cts/(keV kg y)
Francis Froborg The Gerda Experiment 15 / 19
The Physics The Idea The Present The Future
Phase I
Current RunFirst string with enriched detectors deployed in June 2011
Now 6 detectors running: 3 enriched, 3 natural Ge
Cu cylinder installed and grounded
Background comparable with past runs
Data taking ongoing to improve statistics
Plan5 more detectors ready
Physics run will start soon
Pulse shape analysis to improve background in progress
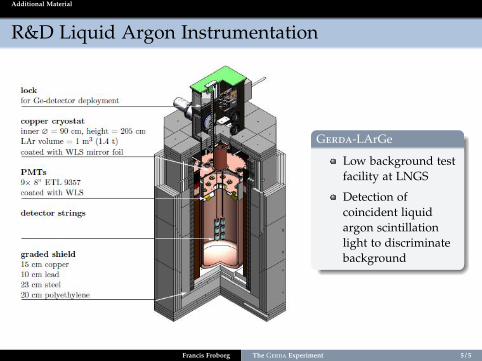
Different possibilities to instrument LAr under investigation
Francis Froborg The Gerda Experiment 16 / 19
The Physics The Idea The Present The Future
Phase II
Detector Production
Enriched 76GeO2 ECP Zelenogorsk, RU
Metal Reduction & Zone Refinement Langelsheim, DE
Crystal Pulling Canberra, Oakridge, TN, USA
BEGe Detector Production Canberra, Olen, BE
Production chain tested with depleted Ge
Phase II Detector Production� Purchase Enriched 76GeO2: ECP Zelenogorsk, RU� Metal Reduction and Zone Refinement: Langelsheim, DE
08.03.2010 to 30.4.2010� Crystal Pulling at Canberra: Oakridge, TN, USA
Neutrinoless double beta decay can answer questions aboutmass and nature of neutrino
Detectors running stable with improvable energy resolution
Background with 0.055 cts/(keV kg y) already factor of 2-3lower than Heidelberg-Moscow
Installation of more detectors to understand backgroundcontributions, more studies ongoing
Initially high count rate of 42Ar could be reduced with Cucylinder
First Gerda physics run will start soon
Francis Froborg The Gerda Experiment 18 / 19
The Physics The Idea The Present The Future
The Gerda Collaboration
INFN Laboratori Nazionali del Gran Sasso, LNGS, Assergi, ItalyInstitute of Physics, Jagellonian University, Cracow, PolandInstitut für Kern- und Teilchenphysik, Technische Universit"at Dres-den, Dresden, GermanyJoint Institute for Nuclear Research, Dubna, RussiaInstitute for Reference Materials and Measurements, Geel, BelgiumMax Planck Institut für Kernphysik, Heidelberg, GermanyDipartimento di Fisica, Università Milano Bicocca, Milano, ItalyINFN Milano Bicocca, Milano, ItalyDipartimento di Fisica, Università degli Studi di Milano e INFN Mi-lano, Milano, Italy
Institute for Nuclear Research of the Russian Academy of Sciences,Moscow, RussiaInstitute for Theoretical and Experimental Physics, Moscow, RussiaRussian Research Center Kurchatov Institute, Moscow, RussiaMax-Planck-Institut für Physik, München, GermanyPhysik Department E15, Technische Universität München, GermanyDipartimento di Fisica dell‘Università di Padova, Padova, ItalyINFN Padova, Padova, ItalyShanghai Jiaotong University, Shanghai, ChinaPhysikalisches Institut, Eberhard Karls Universität Tübingen, Tübin-gen, GermanyPhysik Institut der Universität Zürich, Zürich, Switzerland
Francis Froborg The Gerda Experiment 19 / 19
Additional Material
ADDITIONAL MATERIAL
Francis Froborg The Gerda Experiment 1 / 5
Additional Material
Nuclear Matrix Elements
Three different methods for calculation:
Nuclear Shell Model (SM) Uses Pauli exclusion principle to describe the structure ofthe nucleus in terms of energy levels
Quasi-Particle Random Phase Approximation (QRPA) Uses 3 parameters accountingfor pairing, particle-particle and particle-hole interactions.
Interacting Boson Model (IBM) Bosons can interact through 1- and 2-bodyinteractions giving rise to bosonic wave functions.
QRPA and IBM (coincidentally?) inagreement
SM a factor of 2 lower
Francis Froborg The Gerda Experiment 2 / 5
Additional Material
Pulse Shape Discrimination with BEGe’s
Trajectories2011 JINST 6 P03005
anodecathodeelectronsholesinteraction point
(a) Trajectories
0
300
600
900
1200
1500
char
ge[a
.u.]
0
30
60
90
120
0 100 200 300 400 500 600 700 800cu
rren
t[a.
u.]
time [ns]
(b) Charge and current pulses
Figure 5. Simulated electron-hole trajectories (a) and corresponding charge and current pulses (b) for threeevents occurring in different places in the bulk detector volume far from the p+ electrode (“type I” trajecto-ries). The small oscillation in the current signals after the peak originates from the experimentally measuredFE and DAQ response the pulses are convolved with.
dominant effect on the current signal — the signals of “type I” trajectories in figure 5.b feature asignificant current peak at the end of the hole collection.
Two other types of less common trajectories can be identified when the interactions occur inthe close vicinity of the groove and the small p+ electrode. Examples of these kind of events aredisplayed in figure 6. The “type II” trajectories originate close to the p+ electrode (green and blackcolor). In these events the holes are directly and quickly collected at the cathode. Now also theelectrons drifting in the opposite direction provide a significant contribution to the signal, since theyare now moving in a region of strong φw. The closer the interaction occurs to the cathode, the moreimportant the signal induced by electrons becomes. The signal is fully dominated by the electroncontribution for interactions within∼ 2 mm from the p+ electrode (black example in figure 6). Theinduced charge signal rises quickly at the beginning and then, as they drift away from the cathodeinto the weaker φw regions, the signal growth slows down. The current peak appears at the verybeginning of the collection time. For events occurring few mm to ∼ 1 cm from the p+ electrode(green example in figure 6) neither electrons nor holes traverse the full thickness of the strong φw
region. So the main part of the signal is induced in a relatively short time and the rise time is thusfaster. The current peak is amplified because contributions from both charge carrier types add up.The current amplification can be further enhanced if the interaction happens close to the inner edgeof the groove, because here Ew is strongest (figure 4.b).
Starting points in a zone close to the anode,∼ 1.5 cm from the detector symmetry axis, result in“type III” trajectories (shown blue in figure 6). For these events the electrons are collected quickly,and since φw is still noticeable in this region, they provide a characteristic kink in the first part ofthe signal. This quick increase at the beginning causes the 10% to 90% rise time measurement togive higher values for these events than for the “standard” type I trajectory events.
The three types of signals and the extent of the volumes from which they originate can be
– 9 –
Signal for different trajectories2011 JINST 6 P03005
anodecathodeelectronsholesinteraction point
(a) Trajectories
0
300
600
900
1200
1500
char
ge[a
.u.]
0
30
60
90
120
0 100 200 300 400 500 600 700 800
curr
ent[
a.u.
]
time [ns]
(b) Charge and current pulses
Figure 5. Simulated electron-hole trajectories (a) and corresponding charge and current pulses (b) for threeevents occurring in different places in the bulk detector volume far from the p+ electrode (“type I” trajecto-ries). The small oscillation in the current signals after the peak originates from the experimentally measuredFE and DAQ response the pulses are convolved with.
dominant effect on the current signal — the signals of “type I” trajectories in figure 5.b feature asignificant current peak at the end of the hole collection.
Two other types of less common trajectories can be identified when the interactions occur inthe close vicinity of the groove and the small p+ electrode. Examples of these kind of events aredisplayed in figure 6. The “type II” trajectories originate close to the p+ electrode (green and blackcolor). In these events the holes are directly and quickly collected at the cathode. Now also theelectrons drifting in the opposite direction provide a significant contribution to the signal, since theyare now moving in a region of strong φw. The closer the interaction occurs to the cathode, the moreimportant the signal induced by electrons becomes. The signal is fully dominated by the electroncontribution for interactions within∼ 2 mm from the p+ electrode (black example in figure 6). Theinduced charge signal rises quickly at the beginning and then, as they drift away from the cathodeinto the weaker φw regions, the signal growth slows down. The current peak appears at the verybeginning of the collection time. For events occurring few mm to ∼ 1 cm from the p+ electrode(green example in figure 6) neither electrons nor holes traverse the full thickness of the strong φw
region. So the main part of the signal is induced in a relatively short time and the rise time is thusfaster. The current peak is amplified because contributions from both charge carrier types add up.The current amplification can be further enhanced if the interaction happens close to the inner edgeof the groove, because here Ew is strongest (figure 4.b).
Starting points in a zone close to the anode,∼ 1.5 cm from the detector symmetry axis, result in“type III” trajectories (shown blue in figure 6). For these events the electrons are collected quickly,and since φw is still noticeable in this region, they provide a characteristic kink in the first part ofthe signal. This quick increase at the beginning causes the 10% to 90% rise time measurement togive higher values for these events than for the “standard” type I trajectory events.
The three types of signals and the extent of the volumes from which they originate can be
– 9 –
Discrimination between single-scatter and multi-scatter events
2011 JINST 6 P03005
0
20
40
60
80
0 100 200 300 400 500 600 700 800 900
curr
ent[
a.u.
]
time [ns]
A
A
0
200
400
600
800
1000
1200
char
ge[a
.u.]
E
E
SSEMSE
Figure 9. The upper panel shows typical charge pulses for SSE and MSE while the lower panel shows thecorresponding current pulses obtained as the derivatives of the charge signals. The dashed lines in the toppanel show the contributions of the individual single interactions to the total charge pulse in the MSE.
The region of amplified current signals (approximately a hemisphere of a∼ 13 mm radius fromthe center of the p+ electrode in figure 8, corresponding to∼ 5% of the detector active volume) wasalready identified in refs. [7, 8]. It limits the efficiency of our PSD method, since interactions fromMSE occurring in this volume can have their A/E ratio amplified above the SSE discriminationthreshold. On the positive side, this effect can be used to identify surface events occurring on thep+ electrode and groove surfaces.
4 Validation of the simulation
The implementation of BEGe detectors in the MAGE Monte Carlo simulation framework, accu-rately reproducing their radiation detection efficiency, was presented already in [7, 8, 22, 23]. Herewe report only the measurements carried out to validate the pulse shape simulation. Two sets ofmeasurements were performed for this purpose. First we used a collimated 241Am source to ge-nerate well localized interactions and to compare directly the pulse shapes for different interactionpositions close to the surface of the detector. Then, a 228Th source was used to investigate thedistribution of the pulse rise times and of the parameter A/E as a function of the energy for eventsin the whole detector volume.
4.1 The experimental setup
The detector used for the validation measurements was the BE3830/s BEGe detector described insection 3. The front end read out of the signals was performed with the Canberra charge sensitivepreamplifier 2002CSL [21], which is integrated in the housing of the detector. The preamplifieroutput was digitally recorded with a 4 channel N1728B CAEN NIM flash analogue-digital con-verter [25] running at 100 MHz sampling frequency with a precision of 14 bits. This module is
– 12 –
Agostini et al. JINST, 6 (2011) P03005Francis Froborg The Gerda Experiment 3 / 5