Cite as: Schleinitz, K., Petzoldt, T., Franke-Bartholdt, L., Krems, J.F., & Gehlert, T. (in press). The German Naturalistic Cycling Study – Comparing cycling speed of riders of different e-bikes and conventional bicycles. Safety Science. dx.doi.org/10.1016/j.ssci.2015.07.027 1 The German Naturalistic Cycling Study - Comparing cycling speed of riders of different e-bikes and conventional bicycles K. Schleinitz 1 , T. Petzoldt 1 , L. Franke-Bartholdt 1 , J. Krems 1 , T. Gehlert 2 1 Cognitive and Engineering Psychology, Technische Universität Chemnitz, 09107, Chemnitz e-mail: [katja.schleinitz; tibor.petzoldt; luise.bartholdt; josef.krems]@psychologie.tu- chemnitz.de 2 Traffic Behaviour / Traffic Psychology, German Insurers Accident Research (UDV), Wilhelmstr. 43 / 43 G, 10117 Berlin, Germany e-mail: [email protected]This is the “Accepted Author Manuscript (AAM)” of a work submitted to Elsevier (Safety Science). It includes author- incorporated changes suggested through the processes of submission, peer review and editor-author communications. It does not include other publisher value-added contributions such as copy-editing, formatting, technical enhancements and pagination. The published journal article is available at http://dx.doi.org/10.1016/j.ssci.2015.07.027.
Transcript
Cite as: Schleinitz, K., Petzoldt, T., Franke-Bartholdt, L., Krems, J.F., & Gehlert, T. (in press). The German Naturalistic Cycling Study – Comparing cycling speed of riders of different e-bikes and conventional bicycles. Safety Science. dx.doi.org/10.1016/j.ssci.2015.07.027
1
The German Naturalistic Cycling Study - Comparing cycling speed of
riders of different e-bikes and conventional bicycles
K. Schleinitz1, T. Petzoldt1, L. Franke-Bartholdt1, J. Krems1, T. Gehlert2
1 Cognitive and Engineering Psychology, Technische Universität Chemnitz, 09107, Chemnitz
Cite as: Schleinitz, K., Petzoldt, T., Franke-Bartholdt, L., Krems, J.F., & Gehlert, T. (in press). The German Naturalistic Cycling Study – Comparing cycling speed of riders of different e-bikes and conventional bicycles. Safety Science. dx.doi.org/10.1016/j.ssci.2015.07.027
2
ABSTRACT
In recent years, the number of electric bicycles on European, American and especially Chinese
roads has increased substantially. Today, 11% of all bicycles sold in Germany are e-bikes. Given
their potential to reach higher maximum speeds, concerns have been raised about a possible
increase in crash risk associated with e-bike use. However, as of now, it is unclear if and how
often the potentially higher speed is actually reached in everyday cycling. As part of the German
Naturalistic Cycling study we measured and compared the speed of three bicycle types
(conventional bicycles, pedelecs (pedalling supported up to 25 km/h), S-pedelecs (pedalling
supported up to 45 km/h)) under naturalistic conditions. Ninety participants, divided in three
age groups, took part in our study. Participants used their own bikes or e-bikes. The bicycles
were equipped with a data acquisition system, which included sensors to record speed and
distance, as well as two cameras. Data was collected over a period of four weeks for each
participant. Nearly 17,000 kilometres of cycling were recorded in total. The statistical analysis
revealed significant differences in mean speed between all three bicycle types. Pedelec riders
were, on average, 2 km/h faster than cyclists. S-pedelec speed was even 9 km/h higher. A similar
pattern was also found when analysing free flow conditions and uphill or downhill cycling
separately. The highest speed was measured on carriageways and bicycle infrastructure,
regardless of bicycle type. Participants aged over 65 years rode significantly slower than younger
participants. Data on acceleration from standstill largely confirm the differences between
bicycle types and age groups. The results show that electric bicycles indeed reach higher speeds
than conventional bicycles regularly. Although it is unclear if this also leads to an increase in
crash risk, it can be assumed that the consequences of a crash might be, on average, more
Cite as: Schleinitz, K., Petzoldt, T., Franke-Bartholdt, L., Krems, J.F., & Gehlert, T. (in press). The German Naturalistic Cycling Study – Comparing cycling speed of riders of different e-bikes and conventional bicycles. Safety Science. dx.doi.org/10.1016/j.ssci.2015.07.027
3
1 INTRODUCTION
In recent years, the distribution of electric bicycles (e-bikes) has increased continuously.
Especially in China, the number of e-bikes has risen substantially (Bundesministerium für
Verkehr Innovation und Technologie, 2013). A similar trend can be observed in the US and in
Europe (Rose, 2012). In Germany, about 1.6 million electric bicycles are currently on the road
(Zweirad-Industrie-Verband, 2014), and it is expected, that this number will increase even
further (Jellinek et al., 2013). As a result of this development, questions have been raised
regarding a potentially increased crash risk for e-bikes. One central concern that has been voiced
repeatedly is the fact that these e-bikes can reach a higher speed than conventional bicycles,
which might lead to a variety of problems (Bai et al., 2013; Jellinek et al., 2013; Skorna et al.,
2010). Scaramuzza and Clausen (2010) estimated an increase of severe injuries of about 150%,
and an increase of even 350% for fatalities, if the overall cycling mean speed would increase by
6 km/h as a result of the growing distribution of e-bikes.
Data on the speed of conventional bicycles have been inconsistent. Two US studies found
comparable mean speeds of 18 km/h (Dill and Gliebe, 2008) and 16 km/h (Thompson et al.,
1997). Other investigations from Europe have reported mean speeds between 12 km/h and 14
km/h for conventional cyclists (Dozza and Werneke, 2014; Menghini et al., 2009). Up until now,
only few studies have investigated the average speed of e-bikes. Results from China (Cherry and
He, 2009; Lin et al., 2007) suggest that e-bikes are considerably faster than conventional bicycles.
Mean speeds were found to be 7 km/h (Lin et al., 2007) and 5 km/h (Cherry and He, 2009) higher,
respectively. For users of a US bike share programme higher travel speeds were found for e-
bikes (13 km/h) in comparison to bicycles (11 km/h) on carriageways, whereas e-bike speed was
lower on shared use facilities (Langford et al., 2015). For Europe, a Swiss study (Paefgen and
Michahelles, 2010) reported an e-bike mean speed of about 19 km/h, however lacked
Cite as: Schleinitz, K., Petzoldt, T., Franke-Bartholdt, L., Krems, J.F., & Gehlert, T. (in press). The German Naturalistic Cycling Study – Comparing cycling speed of riders of different e-bikes and conventional bicycles. Safety Science. dx.doi.org/10.1016/j.ssci.2015.07.027
4
comparable data for conventional bicycles. An observational study in Germany recorded a mean
speed of nearly 17 km/h for e-bikes (Alrutz, 2013, 2012), which was two to three km/h higher
than for conventional bicycles.
Unfortunately, the term e-bike has been applied to a very broad range of vehicles, with a high
variance in the support they provide, and subsequently with profound differences in the
potential maximum speed. In China, some scooters with only rudimentary pedals are considered
e-bikes (Cherry and Cervero, 2007). Such vehicles would hardly be called e-bikes by European
standards. But also in Europe, different categories of electric bicycles exist. In Germany, we
distinguish between so called pedelecs, which support pedalling up to 25 km/h (250W), and S-
pedelecs, which support up to 45 km/h (500W) (Zweirad-Industrie-Verband, 2012). Similar
categorisations (often with consequences for licensing, insurance etc.) exist in most European
countries (Jellinek et al., 2013). It is obvious that comparisons of operating speed between
different studies from different countries all over the world, with different traffic environments,
different cyclist populations, and different bicycle categories are problematic.
Adding to this problem is the fact that the cited studies use a variety of different methodologies,
each with their individual shortcomings and restrictions. Many investigations covered only a
limited range of infrastructure types, as they either used a stationary (Jellinek et al., 2013; Lin et
al., 2007; Thompson et al., 1997) or “floating vehicle” (Cherry and He, 2009) approach. This
might result in a considerable bias in the data (limited infrastructure and traffic environment,
bias in the observed cyclist populations, trip purposes etc.), and can limit the generalisability of
the findings. Such observations also hamper the assessment of the influence of a variety of
variables, as age, gender and even bicycle type have to be judged by an observer and cannot be
directly collected (Jellinek et al., 2013; Lin et al., 2007). Other issues include limitations in subject
samples or the lack of proper control groups (Paefgen and Michahelles, 2010).
Cite as: Schleinitz, K., Petzoldt, T., Franke-Bartholdt, L., Krems, J.F., & Gehlert, T. (in press). The German Naturalistic Cycling Study – Comparing cycling speed of riders of different e-bikes and conventional bicycles. Safety Science. dx.doi.org/10.1016/j.ssci.2015.07.027
5
The aim of this study was the investigation of speed (including acceleration) of electric bicycles
in comparison to conventional bicycles. In order to avoid the described methodological issues,
the naturalistic cycling methodology appeared to be most appropriate. In naturalistic
observations, cameras and sensors are used to record the road users’ usual behaviour to obtain
data that is not contaminated by the influence of experimental manipulation. With motorised
vehicles, Naturalistic Driving Studies (NDS) have been conducted for more than 20 years now
(Dingus et al., 2006; Kessler et al., 2012; Lee et al., 2004). Only recently has the NDS approach
been applied for the investigation of cyclist behaviour (so called Naturalistic Cycling Studies,
NCS). Most NCS were interested in the identification of safety critical situations when riding a
conventional bicycle (Dozza and Werneke, 2014; Johnson et al., 2010), while others focused on
mobility behaviour or rider distraction (Gustafsson and Archer, 2013; Knowles et al., 2012). So
far, no NCS has been conducted that addressed the speed differences between different bicycle
types. Our study investigated the speed and acceleration of conventional bicycles, pedelecs and
S-pedelecs without restrictions, taking into consideration aspects such as infrastructure, road
gradient and riders’ age.
2 METHOD
2.1 Participants
Participants were recruited through newspaper ads or flyers in cycling shops. The applicants
filled in a recruitment questionnaire, which included questions on their socio-demographic
status and technical data of their bicycle, with special focus on the bicycle type (conventional
bicycle, pedelec, S-pedelec). Applicants were selected for participation based on criteria such as
bicycle type, frequency of usage and age. As we were especially interested in e-bikes, we tried
to recruit as many e-bike riders as possible. However, since S-pedelecs are still rather rare
(Preißner et al., 2013; Zweirad-Industrie-Verband, 2013), there were relatively few applicants
Cite as: Schleinitz, K., Petzoldt, T., Franke-Bartholdt, L., Krems, J.F., & Gehlert, T. (in press). The German Naturalistic Cycling Study – Comparing cycling speed of riders of different e-bikes and conventional bicycles. Safety Science. dx.doi.org/10.1016/j.ssci.2015.07.027
6
for this group. At the same time, we had a substantial number of candidates for the pedelec
category. Those candidates were, on average, older riders, which is in line with the reported age
structure of the overall pedelec rider population in Germany (Alrutz, 2013; Preißner et al., 2013).
To ensure comparability of our different user groups, we selected users of conventional bicycles
for participation matching the age of the pedelec riders. 90 cyclists took part, however data of
five participants had to be excluded from analysis as the data sets were incomplete. 85 datasets
(32 female, 53 male), divided in three age groups (see Table 1 for an overview), remained for
analysis1. Gender was not equally distributed across the different bicycle types. Our S-pedelec
riders were all male, whereas in the other two groups, distribution was more (although not fully)
even (bicycle: 11 female, 17 male, pedelec: 21 female, 27 male). As participants were supposed
to use their own bicycles for the study, we saw a wide range of different bicycle types. The
majority of our participants’ conventional bicycles were so called city bikes, with also a few
mountain bikes. Only two pedelec riders owned a mountain bike style pedelec, the rest were all
city bikes. All S-pedelec riders used trekking or city bikes. Nearly 60% of the e-bike riders
reported to use a regular bicycle in addition to their e-bike. All participants received €100 for
their participation.
Table 1: Overview of demographic data (N = 85).
Age groups
Cyclist Pedelec rider S-pedelec rider
N M age SD age N M age SD age N M age SD age
≤ 40 years 8 30.8 7.1 15 33.3 6.6 3 25.0 9.5
41 - 64 years 9 52.4 8.5 14 54.1 7.2 6 43.2 1.7
≥ 65 years 11 69.5 3.2 19 70.4 3.2 - - -
Total 28 51.5 17.2 48 53.5 16.8 9 37.1 10.3
1 Due to the use of stricter criteria for the inclusion of datasets, the subject sample differs slightly from the published research report (Schleinitz et al., 2014). Consequently, values in descriptive statistics differ as well. However, the overall findings based on inferential statistics are identical.
Cite as: Schleinitz, K., Petzoldt, T., Franke-Bartholdt, L., Krems, J.F., & Gehlert, T. (in press). The German Naturalistic Cycling Study – Comparing cycling speed of riders of different e-bikes and conventional bicycles. Safety Science. dx.doi.org/10.1016/j.ssci.2015.07.027
7
2.2 Data Acquisition System (DAS)
Trained technicians installed and uninstalled a data acquisition system (DAS) on the participants’
own bicycles. A speed sensor was installed on the front wheel to record speed and distance data
(data rate 2 Hz). Two cameras (Type ACME FlyCamOne eco V2), placed in a small box, were
mounted on the handlebar. One camera captured the forward scenery and the other the face
of the cyclist. The videos were recorded at 30 frames per second with a resolution of 720x480
pixels (VGA). All data was stored on two SD-memory cards, one for video (32 GB) and one for
speed data (4 GB). Participants started and stopped recording with a flip switch.
2.3 Procedure
The study was conducted in and around Chemnitz (Germany) from July to November 2012.
Exposure to different weather conditions did not differ between the three bicycle types, as we
made sure that during the whole period of data acquisition, the same proportion of conventional
bicycles, pedelecs and S-pedelecs was instrumented. For each participant, data was recorded
over a period of four weeks. Weather conditions varied from hot and sunny in summer to cold
and icy in October. An individual appointment for the installation of the DAS was arranged with
each participant. In order to check their level of cycling ability, the technician conducted a short
cycling skill test with the participants. None of the participants showed any specific deficits.
During the course of the observation period, participants were instructed to use their bicycles
as they would do normally. They were supposed to record every single trip they made,
regardless of trip purpose, trip duration, time of day or other factors. Necessary maintenance
procedures like DAS repairs and exchange of storage media were carried out by our technicians.
At the end of the observation period, another individual appointment was made for dismounting
the DAS.
Cite as: Schleinitz, K., Petzoldt, T., Franke-Bartholdt, L., Krems, J.F., & Gehlert, T. (in press). The German Naturalistic Cycling Study – Comparing cycling speed of riders of different e-bikes and conventional bicycles. Safety Science. dx.doi.org/10.1016/j.ssci.2015.07.027
8
2.4 Data preparation
Sensor data
Data of the wheel sensors were collected for each trip to obtain data for speed and covered
distance. Data of non-trip recordings (e.g. DAS still activated while the bike was already parked)
were excluded from the analysis. To calculate operating speed, we followed the common
procedure in removing all standstill situations (speed = 0 km/h) from the dataset (Cherry, 2007;
Dill and Gliebe, 2008; Lin et al., 2007).
To analyse the cyclists’ acceleration, we decided to look into situations in which the cyclist
started from standstill. Due to the relatively low data rate (2Hz), reporting acceleration in m/s²
appeared inappropriate. Instead, we described the development of speed immediately after a
standstill situation, without the calculation of an actual acceleration metric. We analysed a
window of 15s after a bike started moving again. Only situations in which a speed of a least 5
km/h inside that window was reached were included in the analysis. If this was not the case, it
had to be assumed that no normal acceleration had occurred (e.g. the bike was pushed).
Video data
To investigate the influence of different infrastructure characteristics on cyclists’ speed, video
material was annotated for each trip continuously for one week that was chosen randomly. The
categories of infrastructure were based on definitions in German road traffic regulations (StVO,
see Table 2). We also annotated free flow situations (no other road user in front of cyclist, no
curves or other obstacles) and instances of clearly downhill and uphill riding.
The overall annotation procedure was based on Klauer, Perez and McClafferty (Klauer et al.,
2011). All annotators received a special training. Discrepancies found by the senior annotators
Cite as: Schleinitz, K., Petzoldt, T., Franke-Bartholdt, L., Krems, J.F., & Gehlert, T. (in press). The German Naturalistic Cycling Study – Comparing cycling speed of riders of different e-bikes and conventional bicycles. Safety Science. dx.doi.org/10.1016/j.ssci.2015.07.027
9
in spot checks were discussed and resolved in team meetings. In total, 1,023 videos with a
duration of about 263 hours were annotated. The video annotations were synchronised with
the sensor data in our database, so that the cyclists’ speed could be linked to the infrastructure
characteristics.
Table 2: Overview of the annotated categories of infrastructure.
Type of infrastructure Description/Examples
Carriageway Part of a road used by cars etc.
Bicycle infrastructure Bicycle lane, bike path
Pavement Footpath along the sides of a road
Pedestrian precinct Pedestrian-only use, some or all automobile traffic prohibited
Unpaved Forest path, field path
Miscellaneous
All other types of infrastructures i.e. parking facility, small path
between buildings, path in allotment
3 RESULTS
In order to assess the relationship between the different bicycle types and cycling speed without
the confounding influence of age (and since we were not able to recruit older participants in the
S-pedelec group, resulting in an empty cell in our design), we conducted analyses of covariance
(ANCOVA) with participants’ age as covariate. It has to be acknowledged that the ANCOVA
regression slopes were not homogeneous in several cases. Therefore, we conducted additional
ANOVAs, in which we included the age group as a factor (see Table 1), and omitted the S-pedelec
group as a level of the factor bicycle type. All reported post-hoc pairwise comparisons were
corrected for multiple comparisons (Bonferroni correction).
Cite as: Schleinitz, K., Petzoldt, T., Franke-Bartholdt, L., Krems, J.F., & Gehlert, T. (in press). The German Naturalistic Cycling Study – Comparing cycling speed of riders of different e-bikes and conventional bicycles. Safety Science. dx.doi.org/10.1016/j.ssci.2015.07.027
10
3.1 Dataset overview
Overall, we recorded 4,327 trips with a total distance of 16,873 kilometres during the four weeks
of data collection. On average, each participant cycled about 198.5 km during the study.
Although the S-pedelec riders appeared to have cycled longer total distances than the other two
groups, an ANCOVA revealed no significant differences between the bicycle types, F (2, 81) =
2.87, p = .062, η2p = 0.07, (see Table 3). Age had also no significant influence on the distance
cycled, F (1, 81) = 2.73, p = .103, η2p = 0.03. It has to be noted that, for all bicycle types (especially
the S-pedelecs), the range in total distance travelled is considerable. For mean trip length, the
ANCOVA revealed a significant difference between the bicycle types, F (2, 81) = 5.91, p = .004,
η2p = 0.13, whereas no effect for age was found, F (1, 81) = 0.41, p = .523, η2
p = 0.01. Trips on S-
pedelecs (M = 7.3 km, SD = 4.4 km) were significantly longer compared to trips completed with
pedelecs (M = 4.7 km, SD = 2.9 km, p = .035) and conventional bicycles (M = 3.5 km, SD = 2.5 km,
p = .003). Pecelec and bicycle trip length did not differ significantly from each other (p = .350).
Table 3: Mean total distance travelled in km per bicycle type and age group (N = 85).
Cite as: Schleinitz, K., Petzoldt, T., Franke-Bartholdt, L., Krems, J.F., & Gehlert, T. (in press). The German Naturalistic Cycling Study – Comparing cycling speed of riders of different e-bikes and conventional bicycles. Safety Science. dx.doi.org/10.1016/j.ssci.2015.07.027
11
3.2 Speed
Mean speed, free flow conditions and road gradient
Figure 1 displays the distribution of trip mean speed. In general, S-pedelec riders completed
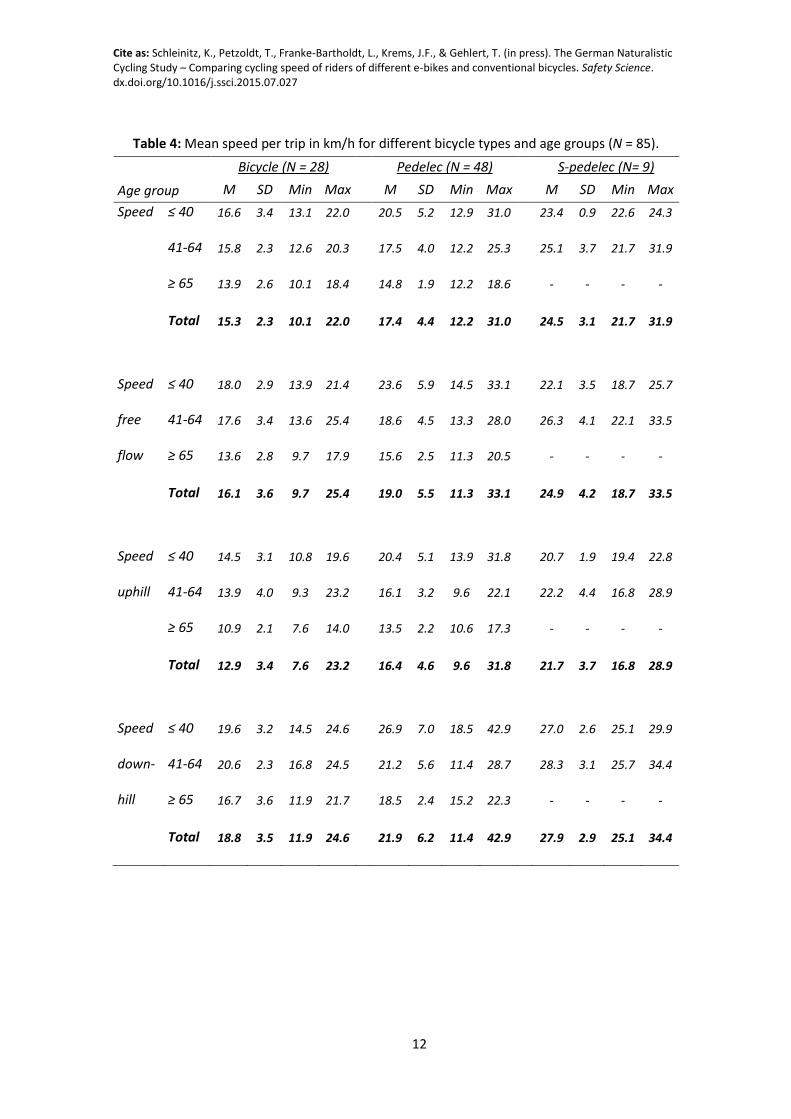
more trips with higher mean speed than the other two groups. The analysis of mean speed (see
Table 4) strengthened this impression. S-pedelecs travelled at ca. 24.5 km/h on average,
pedelecs at 17.4 km/h, and conventional bicycles only at 15.3 km/h. An ANCOVA revealed a
significant effect of bicycle type, F (2, 81) = 15.33, p < .001, η2p = 0.28. Pairwise comparisons
showed that all bicycle types differed significantly from each other (p ≤ .019). Participants’ age
had a significant influence on operating speed as well, F (1, 81) = 27.92, p < .001, η2p = 0.26.
Figure 1: Proportion of trips made at different speeds (1 km/h steps) per bicycle type (N = 85).
Cite as: Schleinitz, K., Petzoldt, T., Franke-Bartholdt, L., Krems, J.F., & Gehlert, T. (in press). The German Naturalistic Cycling Study – Comparing cycling speed of riders of different e-bikes and conventional bicycles. Safety Science. dx.doi.org/10.1016/j.ssci.2015.07.027
12
Table 4: Mean speed per trip in km/h for different bicycle types and age groups (N = 85).
Cite as: Schleinitz, K., Petzoldt, T., Franke-Bartholdt, L., Krems, J.F., & Gehlert, T. (in press). The German Naturalistic Cycling Study – Comparing cycling speed of riders of different e-bikes and conventional bicycles. Safety Science. dx.doi.org/10.1016/j.ssci.2015.07.027
13
For all bicycle types, the speed under free flow conditions (n = 84, one participant was not
recorded riding under free flow conditions) was in general slightly higher than mean speed
(Table 4). The ANCOVA showed a significant effect of bicycle type, F (2, 80) = 8.54, p < .001,
η2p = 0.18, as well as a significant influence of age as covariate, F (1, 80) = 34.77, p < .001,
η2p = 0.30. Pairwise comparisons showed that riders of conventional bicycles rode significantly
slower than the riders of e-bikes (both p ≤ .10). There was no significant difference between
pedelec and S-pedelec.
As expected, road gradient had an influence on the cyclists’ speed as well (Table 4). When riding
downhill, our participants were, on average, 5.8 km/h faster than when cycling uphill,
F (1, 81) = 30.90, p < .001, η2p = 0.28. We again found significant effects of bicycle type, F (2, 81)
= 12.88, p < .001, η2p = 0.24 and age, F (1, 81) = 33.09, p < .001, η2
p = 0.29. The speed of the
conventional bicycles differed significantly from the speed of the other two types (both p ≤ .001),
whereas there was no difference between pedelec and S-pedelec. There was no significant
interaction between bicycle type and road gradient.
Mean distance travelled at higher speed
In addition to the assessment of differences in mean speed, we analysed to what extent our
cyclists travelled at a higher speed. For this purpose, the distance covered at speeds above
20 km/h, 25 km/h and 30 km/h was related to the total cycling distance of each group (see Figure
2). As expected, S-pedelec riders covered a much higher proportion of their overall mileage at
the higher speed levels. More than 80% of their total cycling distance was completed at a speed
of 20 km/h or above, and still 34% with a speed of 30 km/h or higher.
Separate ANCOVAs revealed a significant main effect for bicycle type on each of the three speed
levels (an overview of all effects can be found in Table 5). Pairwise comparisons showed
Cite as: Schleinitz, K., Petzoldt, T., Franke-Bartholdt, L., Krems, J.F., & Gehlert, T. (in press). The German Naturalistic Cycling Study – Comparing cycling speed of riders of different e-bikes and conventional bicycles. Safety Science. dx.doi.org/10.1016/j.ssci.2015.07.027
14
significant differences between all three bicycle types for the 20 km/h level (all p ≤ .031). At 25
km/h and 30 km/h, only the difference between S-pedelecs and the other two bicycle types was
significant (all p < .001).
Figure 2: Proportion of distance travelled at speeds above 20 km/h, 25 km/h and 30 km/h per bicycle type (N = 85).
Table 5: Summary of all ANCOVA results for the three higher speed levels (N = 85).
F p η²p
over 20 km/h Bicycle type 13.06 <.001 0.24
Age group 42.02 <.001 0.34
over 25 km/h Bicycle type 19.78 <.001 0.32
Age group 31.66 <.001 0.28
over 30 km/h Bicycle type 13.48 <.001 0.25
Age group 9.46 .003 0.11
Cite as: Schleinitz, K., Petzoldt, T., Franke-Bartholdt, L., Krems, J.F., & Gehlert, T. (in press). The German Naturalistic Cycling Study – Comparing cycling speed of riders of different e-bikes and conventional bicycles. Safety Science. dx.doi.org/10.1016/j.ssci.2015.07.027
15
Speed on different types of infrastructure
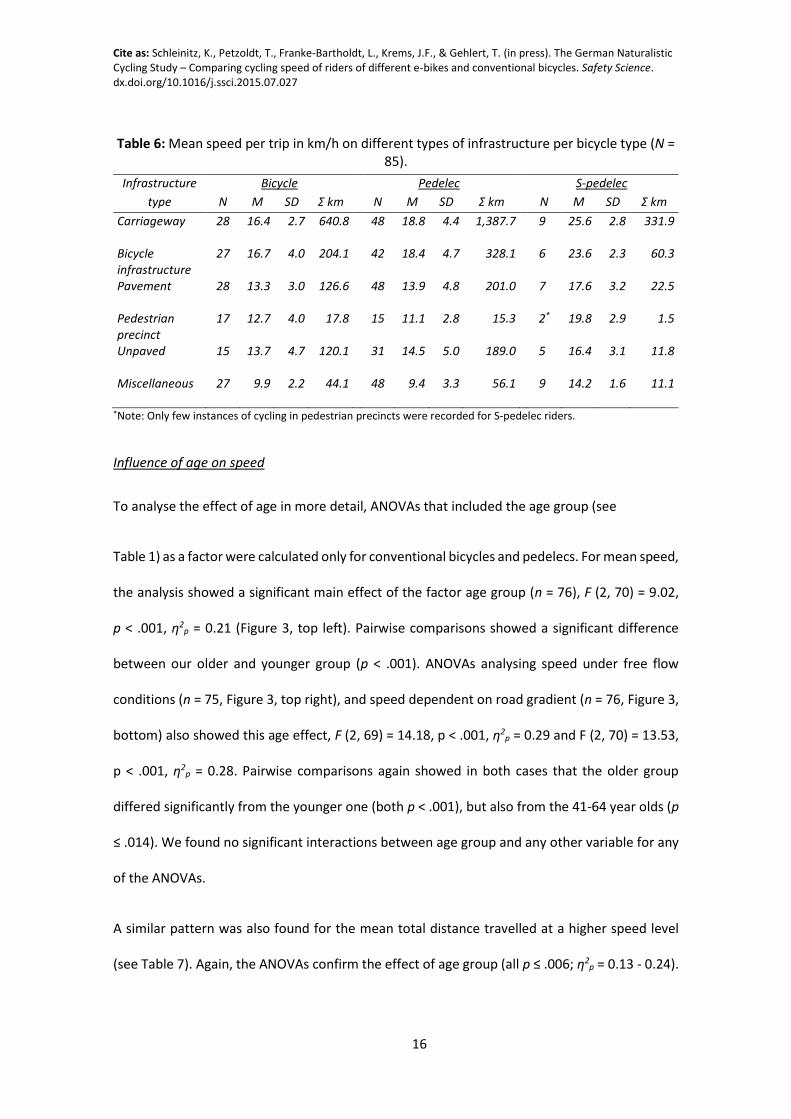
Table 6 displays the mean operating speed and the total distance cycled on each of our
annotated types of infrastructure. The analysis is only reported at a descriptive level, as cell
sizes vary considerably. Also, there is a wide variation in how often and how long each
individual cyclist travelled on a specific infrastructure category, so participants’ contributions
to the cells’ mean values are highly variable. Because of that, we decided to abstain from
inferential statistics for this analysis.
S-pedelec riders cycled fastest on all types of infrastructure. The highest speed was measured
when participants were travelling on the carriageway or bicycle infrastructure. Only for these
two infrastructure types, we found a difference between conventional bicycles and pedelecs,
whereas for all other categories, the mean speed were more or less equal. For all bicycle types,
the speed recorded on the pavement and in pedestrian precincts was relatively high, although
in Germany it is not legal to cycle on such infrastructure (with few exceptions). Also conspicuous
was the high speed of S-pedelecs on bicycle infrastructure, especially when compared to the
other two bicycle types. The use of S-pedelecs on bicycle infrastructure is illegal, yet our
participants covered 18% of their total mileage there.
Cite as: Schleinitz, K., Petzoldt, T., Franke-Bartholdt, L., Krems, J.F., & Gehlert, T. (in press). The German Naturalistic Cycling Study – Comparing cycling speed of riders of different e-bikes and conventional bicycles. Safety Science. dx.doi.org/10.1016/j.ssci.2015.07.027
16
Table 6: Mean speed per trip in km/h on different types of infrastructure per bicycle type (N = 85).
*Note: Only few instances of cycling in pedestrian precincts were recorded for S-pedelec riders.
Influence of age on speed
To analyse the effect of age in more detail, ANOVAs that included the age group (see
Table 1) as a factor were calculated only for conventional bicycles and pedelecs. For mean speed,
the analysis showed a significant main effect of the factor age group (n = 76), F (2, 70) = 9.02,
p < .001, η2p = 0.21 (Figure 3, top left). Pairwise comparisons showed a significant difference
between our older and younger group (p < .001). ANOVAs analysing speed under free flow
conditions (n = 75, Figure 3, top right), and speed dependent on road gradient (n = 76, Figure 3,
bottom) also showed this age effect, F (2, 69) = 14.18, p < .001, η2p = 0.29 and F (2, 70) = 13.53,
p < .001, η2p = 0.28. Pairwise comparisons again showed in both cases that the older group
differed significantly from the younger one (both p < .001), but also from the 41-64 year olds (p
≤ .014). We found no significant interactions between age group and any other variable for any
of the ANOVAs.
A similar pattern was also found for the mean total distance travelled at a higher speed level
(see Table 7). Again, the ANOVAs confirm the effect of age group (all p ≤ .006; η2p = 0.13 - 0.24).
Cite as: Schleinitz, K., Petzoldt, T., Franke-Bartholdt, L., Krems, J.F., & Gehlert, T. (in press). The German Naturalistic Cycling Study – Comparing cycling speed of riders of different e-bikes and conventional bicycles. Safety Science. dx.doi.org/10.1016/j.ssci.2015.07.027
17
Post-hoc comparisons showed that older participants differed significantly from the younger
participants (all p ≤ .006) in all three speed levels. At the 20 km/h level, there was also a
difference between the older participants and the 41 to 64 years group (p = .006).
Figure 3: Overall mean speed (top left), speed under free flow conditions (top right) and speed dependent on road gradient (bottom) per bicycle type (conventional bicycle and pedelec only) and age group (n = 76).
Cite as: Schleinitz, K., Petzoldt, T., Franke-Bartholdt, L., Krems, J.F., & Gehlert, T. (in press). The German Naturalistic Cycling Study – Comparing cycling speed of riders of different e-bikes and conventional bicycles. Safety Science. dx.doi.org/10.1016/j.ssci.2015.07.027
18
Table 7: Proportion of total distance travelled at high speed levels for bicycle types and age groups (n = 76).
Bicycle (N = 28) Pedelec (N = 48) Total (N = 76)
M SD M SD M SD
Proportion
over 20 km/h
in %
≤ 40 years 41.5 22.1 63.1 24.1 55.6 25.2
41-64 years 36.0 16.2 48.9 25.3 43.9 22.7
≥ 65 years 13.6 16.4 25.8 15.0 25.7 15.3
Total 33.5 18.7 44.2 26.3 40.2 24.3
Proportion
over 25 km/h
in %
≤ 40 years 17.3 17.9 36.6 26.4 29.8 25.2
41-64 years 12.1 11.0 19.6 19.8 16.7 17.0
≥ 65 years 7.6 5.9 6.7 4.2 7.1 4.8
Total 11.8 12.1 19.8 22.0 16.9 19.2
Proportion
over 30 km/h
in %
≤ 40 years 5.0 5.1 19.6 22.6 14.5 19.6
41-64 years 3.5 3.5 6.0 6.7 5.0 5.7
≥ 65 years 2.6 2.0 1.9 1.5 2.1 1.7
Total 3.6 3.6 8.6 15.0 6.7 12.3
3.3 Acceleration
In Figure 4 (left), acceleration from standstill is illustrated for the three bicycle types (N = 85). It
is clearly visible that S-pedelec riders accelerated much stronger than the other two groups.
After 2.5 s, they were, on average, more than 2 km/h faster than conventional bicycles and
pedelecs, after 5 s, the difference was nearly 5 km/h. In contrast, there appears to be no
difference between conventional bicycles and pedelecs. It has to be acknowledged that, as we
have shown previously, speed and age are confounded. Since the S-pedelec sample was, on
Cite as: Schleinitz, K., Petzoldt, T., Franke-Bartholdt, L., Krems, J.F., & Gehlert, T. (in press). The German Naturalistic Cycling Study – Comparing cycling speed of riders of different e-bikes and conventional bicycles. Safety Science. dx.doi.org/10.1016/j.ssci.2015.07.027
19
average, younger than the other samples, the actual effect of bicycle type might be smaller than
the graph suggests.
Figure 4 (right) displays the relationship between age group and acceleration (similar to the
analysis of the effect of age on speed, only conventional bicycles and pedelecs are included, n =
76). As the results on operating speed would have suggested, the three different age groups also
differed in terms of acceleration. The youngest group reached certain speed levels much earlier
than the other two. There also seems to be a difference, however less pronounced, between
the two other groups, with the oldest cyclists having accelerated the weakest.
Figure 4: Acceleration per bicycle type (left, N = 85) and age group (right, conventional bicycle and pedelec only, n = 76).
4 DISCUSSION AND CONCLUSION
Aim of this study was to investigate the speed and acceleration of electric and conventional
bicycles under naturalistic conditions. We differentiated between electric bicycles that provide
support up to 45 km/h (so called S-pedelecs) and 25 km/h (pedelecs). The results showed a very
clear pattern. S-pedelecs travelled at a higher mean speed overall and under various specified
conditions. They completed a much higher number of their trips at high mean speeds (Figure 1),
Cite as: Schleinitz, K., Petzoldt, T., Franke-Bartholdt, L., Krems, J.F., & Gehlert, T. (in press). The German Naturalistic Cycling Study – Comparing cycling speed of riders of different e-bikes and conventional bicycles. Safety Science. dx.doi.org/10.1016/j.ssci.2015.07.027
20
just as they completed a much larger portion of their total travelling distance at higher speeds
(Figure 2). In addition, they appeared to accelerate stronger than conventional bicycles and
pedelecs. Furthermore, as speed limits of 30 km/h might impact especially on the behaviour of
faster cyclists (i.e. S-pedelec riders), the potential mean speed might be even higher under
different conditions. We also found significant differences in multiple measures between
pedelecs and conventional bicycles, although less pronounced. Somewhat surprising was the
absence of a difference between pedelecs and conventional bicycles with regard to their
acceleration behaviour. This might interpreted as an indication that, when accelerating from
standstill, the pedelec riders used the assistance that the motor provided mainly to reach their
desired speed easier, not earlier. In general, however, the results support findings from previous
studies, which compared conventional bicycles to either a form of S-pedelec (Cherry and He,
2009) or pedelec (Jellinek et al., 2013; Onnen-Weber et al., 2012). It appears that, at least to
some degree, cyclists use the support that e-bikes provide to ride faster.
A similar pattern emerged when we looked into the effect that different types of infrastructure
might have on cycling speed. The S-pedelec riders cycled fastest on each type of infrastructure.
In contrast, pedelec and conventional bicycle speed differed only on the carriageway and cycling
infrastructure. This suggests that the potential of pedelecs can be exploited especially under
free flow conditions, which are hardly found on infrastructure other than carriageway or bike
path. It has to be acknowledged that we found a substantial amount of illegal infrastructure use
in our dataset. Despite the fact that S-pedelecs are not allowed to use bike paths in Germany,
our S-pedelec riders still used them to a considerable degree, and at a much higher speed. As a
result, a previously uncommon variation in speed is introduced to the cycling infrastructure,
which certainly increases the potential for conflicts. The use of infrastructure usually reserved
Cite as: Schleinitz, K., Petzoldt, T., Franke-Bartholdt, L., Krems, J.F., & Gehlert, T. (in press). The German Naturalistic Cycling Study – Comparing cycling speed of riders of different e-bikes and conventional bicycles. Safety Science. dx.doi.org/10.1016/j.ssci.2015.07.027
21
for pedestrians appears to be another problem. However, mean speed on the pavement and
pedestrian precincts at least suggest that cyclists adapt and slow down.
As anticipated (Jellinek et al., 2013; Lin et al., 2007), cyclists’ age had a significant influence on
their speed. When analysed in separate groups, participants 65 years and older were slowest
overall, and travelled the shortest distances at higher speeds, whereas participants 40 years or
younger produced the highest mean speed and the largest proportion of riding at higher speeds.
Pedelec riders in the oldest group were, on average, slower than the riders of conventional
bicycles in the two other age groups. It appears that the concern that older pedelec riders might
be cycling at a speed beyond their control is mostly unfounded. Of course, individual cases and
situations in which control is lost due to excessive speed might still occur, but so they do for
younger cyclists.
We have to acknowledge that the uneven distribution of gender in the different groups of bicycle
users might have had a confounding effect on the measured mean speed. Previous observations
have found a higher speed for male cyclists compared to female riders (Lin et al., 2007).
However, current S-pedelec riders are predominantly male, so the bias in our sample accurately
reflects the current user population. In addition, the potential of a self selection bias due to the
recruitment of volunteers cannot be denied. Especially for the older participants, it might be
suspected that especially healthy and fit riders might be overrepresented. Consequently, mean
speed, especially of older riders, might have been slightly overestimated when compared to the
complete cyclist population.
The question of whether their overall higher speed makes e-bike riders more accident prone
remains yet to be answered. Chinese statistics suggest that the number of e-bike related injuries
and fatalities increased in recent years, whereas the number decreased for overall road traffic
and conventional bicycles (Feng et al., 2010; Zhang et al., 2013). However, it is unclear if the
Cite as: Schleinitz, K., Petzoldt, T., Franke-Bartholdt, L., Krems, J.F., & Gehlert, T. (in press). The German Naturalistic Cycling Study – Comparing cycling speed of riders of different e-bikes and conventional bicycles. Safety Science. dx.doi.org/10.1016/j.ssci.2015.07.027
22
underlying cause is indeed a higher crash rate of e-bikes, or rather a higher crash severity. Siman-
Tov, Jaffe and Peleg (2012) hypothesised that cycling speed might be related to a higher
likelihood of specific types of injury. Based on Nilsson’s power model that relates speed to road
accidents, it can be assumed that a higher speed results in a higher crash risk as well as injury
severity (Aarts and van Schagen, 2006; Elvik et al., 2004). Even if the actual cycling mean speed
changed only moderately, a higher rate of injuries and fatalities would have to be expected.
Especially for S-pedelecs, this aspect needs to be considered when discussing about road
regulations.
The actual road safety impact of e-bikes and their potential to reach higher speeds can, at this
stage, be only predicted in very broad terms. Given the difference in the user populations (which
is not reflected in our matched participant sample), it is not unreasonable to assume that
currently, e-bikes do not cause any change in cycling mean speed at all. However, there is some
evidence that the acceptance of e-bikes is growing also among younger cyclists (Jellinek et al.,
2013). It has even been suggested that the e-bike is going from being a “rehabilitation vehicle”
to a trendy accessory (Touring Club Schweiz, 2014). In which way this will change two wheeled
traffic and road safety in the middle and long term is a matter of speculation. For the time being,
it appears that the regulations in place (treat pedelecs like conventional bicycles, S-pedelecs like
small motorbikes) are appropriate. It only seems that, especially for S-pedelecs, there is the need
for a stronger enforcement of these regulations.
5 ACKNOWLEDGMENTS
The research presented in this paper was funded by German Insurers Accident Research (UDV).
Cite as: Schleinitz, K., Petzoldt, T., Franke-Bartholdt, L., Krems, J.F., & Gehlert, T. (in press). The German Naturalistic Cycling Study – Comparing cycling speed of riders of different e-bikes and conventional bicycles. Safety Science. dx.doi.org/10.1016/j.ssci.2015.07.027
23
6 REFERENCES
Aarts, L., van Schagen, I., 2006. Driving speed and the risk of road crashes: A review. Accid. Anal. Prev. 38, 215–224. doi:10.1016/j.aap.2005.07.004
Alrutz, D., 2012. Pedelecs im Alltag Was bedeutet der Boom für die ( inter- ) kommunale Planung ? PGV – Wegweisend für den Radverkehr.
Alrutz, D., 2013. Anforderungen von Pedelecs an die kommunale Radverkehrsinfrastruktur PGV – Wegweisend für den Radverkehr Themenübersicht Rasante Entwicklung der Verkaufszahlen.
Bai, L., Liu, P., Chen, Y., Zhang, X., Wang, W., 2013. Comparative analysis of the safety effects of electric bikes at signalized intersections. Transp. Res. Part D Transp. Environ. 20, 48–54. doi:10.1016/j.trd.2013.02.001
Bundesministerium für Verkehr Innovation und Technologie, 2013. Radverkehr in Zahlen. Wien.
Cherry, C.R., 2007. Electric two-wheelers in China: Analysis of environmental, safety, and mobility impacts. Production. University of California, Berkeley, USA.
Cherry, C.R., Cervero, R., 2007. Use characteristics and mode choice behavior of electric bike users in China. Transp. Policy 14, 247–257. doi:10.1016/j.tranpol.2007.02.005
Cherry, C.R., He, M., 2009. Alternative methods of measuring operating speed of electric and traditional bikes in China-Implications for travel demand models, in: Proceedings of the Eastern Asia Society for Transportation Studies.
Dill, J., Gliebe, J., 2008. Understanding and measuring bicycling behavior: a focus on travle time and route choice. Portland.
Dingus, T.A., Klauer, S.G., Neale, V.L., Petersen, A., Lee, S.E., Sudweeks, J., Perez, M.A., Hankey, J., Ramsey, D., Gupta, S., Bucher, C., Doerzaph, Z.R., Jermeland, J., Knipling, R.R., 2006. The 100-Car naturalistic driving study phase II – Results of the 100-Car field experiment DOT HS 810 593. Blacksburg, Virginia.
Dozza, M., Werneke, J., 2014. Introducing naturalistic cycling data: What factors influence bicyclists’ safety in the real world? Transp. Res. Part F Traffic Psychol. Behav. 24, 83–91. doi:10.1016/j.trf.2014.04.001
Elvik, R., Christensen, P., Amundsen, A., 2004. Speed and road accidents.
Feng, Z., Raghuwanshi, R.P., Xu, Z., Huang, D., Zhang, C., Jin, T., 2010. Electric-bicycle-related injury: a rising traffic injury burden in China. Inj. Prev. J. Int. Soc. Child Adolesc. Inj. Prev. 16, 417–419. doi:10.1136/ip.2009.024646
Cite as: Schleinitz, K., Petzoldt, T., Franke-Bartholdt, L., Krems, J.F., & Gehlert, T. (in press). The German Naturalistic Cycling Study – Comparing cycling speed of riders of different e-bikes and conventional bicycles. Safety Science. dx.doi.org/10.1016/j.ssci.2015.07.027
24
Gustafsson, L., Archer, J., 2013. A naturalistic study of commuter cyclists in the greater Stockholm area. Accid. Anal. Prev. 58, 286–298. doi:10.1016/j.aap.2012.06.004
Jellinek, R., Hildebrandt, B., Pfaffenbichler, P., Lemmerer, H., 2013. MERKUR - Auswirkungen der Entwicklung des Marktes für E-Fahrräder auf Risiken, Konflikte und Unfälle auf Radinfrastrukturen. Wien.
Johnson, M., Charlton, J., Oxley, J., Newstead, S., 2010. Naturalistic cycling study: Identifying risk factors for on-road commuter cyclists. Ann. Adv. Automot. Med. / Annu. Sci. Conf. 54, 275–283.
Kessler, C., Etemad, A., Alessandretti, G., Heinig, K., Selpi, Brouwer, R., Cserpinszky, A., Hagleitner, W., Benmimoun, M., 2012. European Large - Scale Field Operational Tests on In - Vehicle System- Final Report. Aachen.
Klauer, S.G., Perez, M., McClafferty, J., 2011. Naturalistic driving studies and data coding and analysis techniques, in: Porter, B.E. (Ed.), Handbook of Traffic Psychology. Academic Press, San Diego, pp. 73–85. doi:10.1016/B978-0-12-381984-0.10006-2
Knowles, D., Aigner-Breuss, E., Strohmayer, F., Orlet, P., 2012. Naturalistic Cycling. Ablenkung beim Radfahren. Wien.
Langford, B.C., Chen, J., Cherry, C.R., 2015. Risky riding: Naturalistic methods comparing safety behavior from conventional bicycle riders and electric bike riders. Accid. Anal. Prev. 82, 220–226. doi:10.1016/j.aap.2015.05.016
Lee, S.E., Olsen, E.C.B., Wierwille, W.W., 2004. A Comprehensive Examination of Naturalistic Lane-Changes. Washington D.C.
Lin, S., He, M., Tan, Y., He, M., 2007. Comparison study on operating speeds of electric-bicycle and bicycle: Experience from field investigation in Kunming. Transp. Res. Rec. J. Transp. Res. Board 2048, 52–59.
Menghini, G., Carrasco, N., Schüssler, N., Axhausen, K.W., 2009. Route choice of cyclists in Zurich: Arbeitsberichte Verkehrs- und Raumplan. 544.
Onnen-Weber, U., Schramek, M., Butz, H., 2012. Schweriner Versuch. Wismar.
Paefgen, J., Michahelles, F., 2010. Inferring usage characteristics of electric bicycles from position information, in: Proceedings of the 3rd International Workshop on Location and the Web - LocWeb ’10. ACM Press, New York, New York, USA, pp. 1–4. doi:10.1145/1899662.1899667
Preißner, C.L., Kemming, H., Wittkowsky, D., Bülow, S., Stark, A., 2013. Einstellungsorientierte Akzeptanzanalyse zur Elektromobilität im Fahrradverkehr. Dortmund.
Rose, G., 2012. E-bikes and urban transportation: emerging issues and unresolved questions. Transportation (Amst). 39, 81–96. doi:10.1007/s11116-011-9328-y
Cite as: Schleinitz, K., Petzoldt, T., Franke-Bartholdt, L., Krems, J.F., & Gehlert, T. (in press). The German Naturalistic Cycling Study – Comparing cycling speed of riders of different e-bikes and conventional bicycles. Safety Science. dx.doi.org/10.1016/j.ssci.2015.07.027
Schleinitz, K., Franke-Bartholdt, L., Petzoldt, T., Schwanitz, S., Kühn, M., Gehlert, T., 2014. Pedelec-Naturalistic Cycling Study. Berlin.
Siman-Tov, M., Jaffe, D.H., Peleg, K., 2012. Bicycle injuries: a matter of mechanism and age. Accid. Anal. Prev. 44, 135–139. doi:10.1016/j.aap.2010.10.006
Skorna, A.C.H., Treutlein, D., Westmoreland, S., Loock, C.-M., Paefgen, J.F., von Watzdorf, S., Ackermann, L., Bereuter, A., 2010. Baloise Group - Sicherheitsstudie 2010 Gefahren und Risikofaktoren beim Fahrradfahren in Deutschland.
Thompson, D.C., Rebolledo, V., Thompson, R.S., Kaufman, A., Rivara, F.P., 1997. Bike speed measurements in a recreational population: validity of self reported speed. Inj. Prev. 3, 43–5.
Touring Club Schweiz, 2014. Elektrozweiräder im Systemvergleich. Emmen.
Zhang, X., Cui, M., Gu, Y., Stallones, L., Xiang, H., 2013. Trends in Electric Bike-Related Injury in China, 2004-2010. Asia. Pac. J. Public Health 1–8. doi:10.1177/1010539513496840
Zweirad-Industrie-Verband, 2012. Beschreibung der Fahrradtypen. Bad Soden a. Ts.