Page 1
ASARC Working Paper 2009/01
The Global Financial Crisis and Short-run Prospects for India
April 2009
Raghbendra Jha
ABSTRACT
This paper provides an overview of the impact of the global financial crisis
(GFC) on the Indian economy. It identifies the channels through which the
GFC has impacted the Indian economy and evaluates the stimulus packages
that have been put in place by the government of India. Finally, the paper
examines short run prospects for the Indian economy in light of the GFC and
the economy’s recent dynamism.
Key words: Global Financial crisis, Economic downturn, Stimulus packages, India
JEL classification: E20, E66, F43, O11
All correspondence to: Prof. Raghbendra Jha Australia South Asia Research Centre, Arndt–Corden Division of Economics, College of Asia and the Pacific, H.C. Coombs Building (09) Australian National University, Canberra, ACT 0200, Australia Phone: + 61 2 6125 2683 Fax: + 61 2 6125 0443 Email: [email protected]
Page 2
I. Introduction
The on-going global financial crisis (GFC) has cast a shadow over the global economy
with world output and trade forecasted (by the IMF) to shrink in 2009. This is the first
time such contraction has taken place since the end of the Second World War and
represents a major challenge for policymakers apart from the immense hardship it is
inflicting on working households who are losing their jobs and/or their homes on an
unprecedented scale and experiencing deep wealth loss.
There are some special characteristics of the current recession. Unlike recent episodes of
recession this is not just a case of an asset bubble bursting with implications for some
financial institutions and an accompanying contraction of demand which could be
addressed by automatic stabilizers on the fiscal side and a monetary policy that cut
interest rates. This recession is a far more complicated entity. First, there was an asset
bubble caused by a glut of savings in the global economy (coming largely from China)
and the US’s inexhaustible appetite for debt. Thus the savings glut which led to low
interest rates largely financed excessive US consumption — not investment. This led to
a substantial hike in asset prices (particularly home prices), aided and abetted by the
commodities boom following strong growth performance in emerging economies —
particularly India and China and the development of complex financial instruments, e.g.,
derivatives, largely unregulated that raised asset prices — particularly mortgage based
loans — to high levels. The debt spiral that this resulted in has been well discussed in
the literature — suffice it to say that when bad mortgage debt started being recalled (the
so called subprime crisis) it was quickly realized that there was a general credit crisis
following from the existence of vast sums of questionable (toxic) assets in the balance
sheets of banks and other financial institutions. As a result, the collateral backing of
many credit advances started being questioned and credit froze. Despite aggressive rate
cutting by central banks in all the major countries the cost of borrowing skyrocketed.
This led to a collapse of demand and rising unemployment — all in a vicious demand
spiral. Appendix 1 to this paper briefly chronicles the development of the current crisis.
Thus, as distinct from most recessions in the recent past the current deep recession
represents a combination of many factors. First, it began as a crisis of debt and of asset
price inflation. Second, it represents a regulatory crisis. The explosion of complex (and
unregulated) financial instruments in a high debt environment exacerbated the crisis of
ASARC WP 2009/01 1
Page 3
Raghbendra Jha The Global Financial Crisis and Short-run Prospects for India
debt. Following immediately from this and, third, it represents a massive imbalance in
the global economy and a credit crunch. Fourth it represents a collapse of demand and,
following from that rising unemployment. Finally, the rising unemployment exacerbates
the debt crisis as people are unable to pay off debts. This also completes a vicious cycle.
Hence, a number of factors are influencing the current downturn. Further, these factors
reinforce each other and it would be necessary to address each of them if the global
economy has to recover from its present malaise. A piecemeal approach is unlikely to
work. A stimulus package consisting of enhanced government expenditure and tax
breaks represents a boost to aggregate demand and will not work by itself. If bank
balance sheets are still bedevilled with toxic assets the money handed out to people
through the stimulus package will be deposited in banks. But if banks are not inclined to
lend this money out the multiplier effect of the stimulus package will be frozen in its
tracks.
Hence, it is important to underscore the fact that there exists a multiplicity of reasons for
the current global financial crisis with some of these reasons having feedback effects on
each other. In light with the Mundell–Tinbergen Assignment Principle we need to have
at least as many independent policy tools as policy objectives. In this particular case,
policy needs to work independently on: (i) stabilizing the balance sheets of banks to rid
them of toxic assets, (ii) facilitating growth of credit by guaranteeing deposits and by
lowering the cost of credit (interest rate and margins reduction), (iii) stimulating
demand; (iv) buttressing social safety nets for the unemployed and making automatic
stabilizers more efficient; (v) putting into place more comprehensive regulation of
financial instruments and enhanced international cooperation in this area; and (vi)
ensuring that global imbalances of the sort preceding the current crisis never happen
again. This is a tall order but unless action is taken on all these fronts the global
economy can run into another crisis albeit with a much larger level of debt. If global
imbalances persist or if effective regulation of financial instruments is not forthcoming
the global economy is at risk of facing another crisis in the not too distant future. At that
time, however, the world economy will be saddled with a much larger debt due mainly
to the many large bailout and stimulus packages. Hence, it is imperative that progress be
made on all these fronts. However, some policies should, logically, precede others, e.g.,
banks should be stabilized before fiscal stimuli are put into place.
ASARC WP 2009/01 2
Page 4
Raghbendra Jha The Global Financial Crisis and Short-run Prospects for India
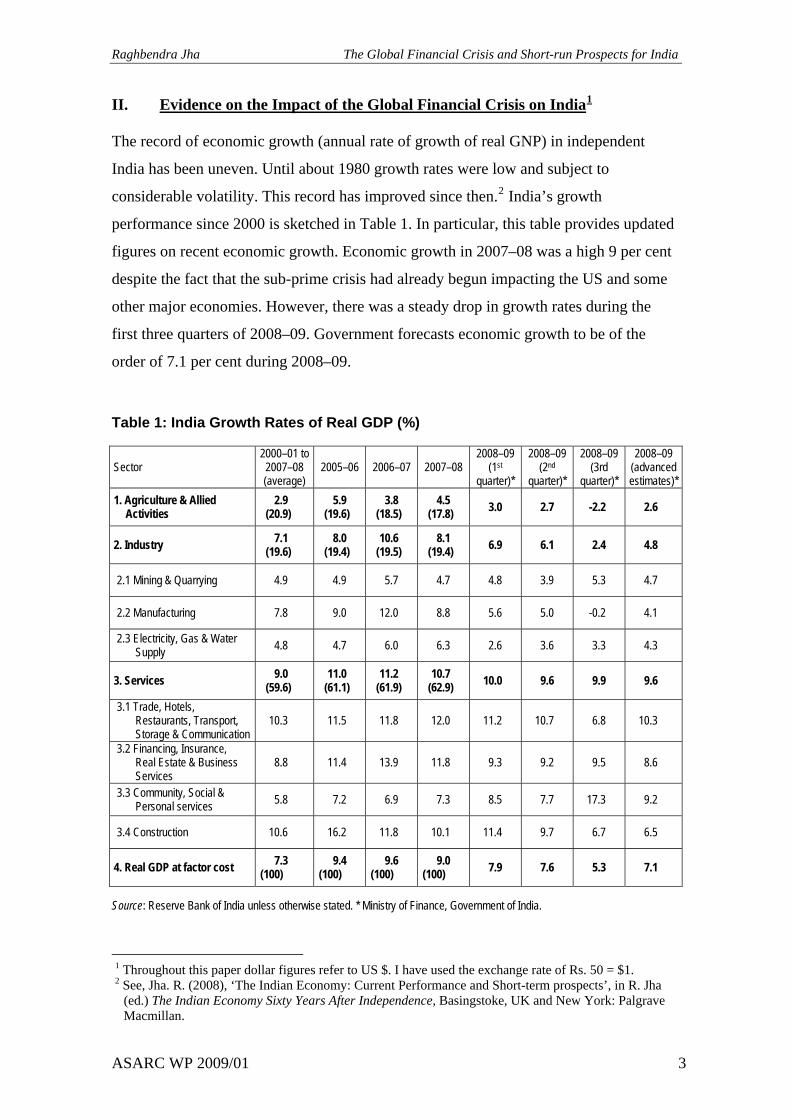
II. Evidence on the Impact of the Global Financial Crisis on India1 The record of economic growth (annual rate of growth of real GNP) in independent
India has been uneven. Until about 1980 growth rates were low and subject to
considerable volatility. This record has improved since then.2 India’s growth
performance since 2000 is sketched in Table 1. In particular, this table provides updated
figures on recent economic growth. Economic growth in 2007–08 was a high 9 per cent
despite the fact that the sub-prime crisis had already begun impacting the US and some
other major economies. However, there was a steady drop in growth rates during the
first three quarters of 2008–09. Government forecasts economic growth to be of the
order of 7.1 per cent during 2008–09.
Table 1: India Growth Rates of Real GDP (%)
Sector 2000–01 to 2007–08 (average)
2005–06 2006–07 2007–08 2008–09
(1st quarter)*
2008–09 (2nd
quarter)*
2008–09 (3rd
quarter)*
2008–09 (advanced estimates)*
1. Agriculture & Allied Activities
2.9 (20.9)
5.9 (19.6)
3.8 (18.5)
4.5 (17.8) 3.0 2.7 -2.2 2.6
2. Industry 7.1 (19.6)
8.0 (19.4)
10.6 (19.5)
8.1 (19.4) 6.9 6.1 2.4 4.8
2.1 Mining & Quarrying 4.9 4.9 5.7 4.7 4.8 3.9 5.3 4.7
2.2 Manufacturing 7.8 9.0 12.0 8.8 5.6 5.0 -0.2 4.1
2.3 Electricity, Gas & Water Supply 4.8 4.7 6.0 6.3 2.6 3.6 3.3 4.3
3. Services 9.0 (59.6)
11.0 (61.1)
11.2 (61.9)
10.7 (62.9) 10.0 9.6 9.9 9.6
3.1 Trade, Hotels, Restaurants, Transport, Storage & Communication
10.3 11.5 11.8 12.0 11.2 10.7 6.8 10.3
3.2 Financing, Insurance, Real Estate & Business Services
8.8 11.4 13.9 11.8 9.3 9.2 9.5 8.6
3.3 Community, Social & Personal services 5.8 7.2 6.9 7.3 8.5 7.7 17.3 9.2
3.4 Construction 10.6 16.2 11.8 10.1 11.4 9.7 6.7 6.5
4. Real GDP at factor cost 7.3 (100)
9.4 (100)
9.6 (100)
9.0 (100) 7.9 7.6 5.3 7.1
Source: Reserve Bank of India unless otherwise stated. * Ministry of Finance, Government of India.
1 Throughout this paper dollar figures refer to US $. I have used the exchange rate of Rs. 50 = $1. 2 See, Jha. R. (2008), ‘The Indian Economy: Current Performance and Short-term prospects’, in R. Jha
(ed.) The Indian Economy Sixty Years After Independence, Basingstoke, UK and New York: Palgrave Macmillan.
ASARC WP 2009/01 3
Page 5
Raghbendra Jha The Global Financial Crisis and Short-run Prospects for India
There is some apprehension — at the present time based only on conjecture — that the
fourth quarter growth figures may be overestimates so that growth in 2008–09 may be
lower than 7.1 percent. Several other indicators have also pointed toward a slowdown in
the economy. Industrial growth during April–January 2008–09 was 3.0 per cent as
compared to 8.7 per cent during the corresponding period in 2007–08. Similarly M3
growth as of 13 February 2009 was 19.9 per cent as compared to 21.6 per cent last year
and the annual rate of inflation in terms of WPI was 0.44 per cent for the week ended 7
March 2009, indicating slackening of demand. .As a result of the fiscal stimulus
packages put in place the fiscal deficit during April–January 2008–09 was 174.3 per cent
higher than the corresponding period in 2007–08 and the revenue deficit was 278.0 per
cent higher, indicating pressures on the fiscal deficit and a departure from the FRBM.
However, net tax revenue to the centre during April–January 2008–09 was higher by 1.6
per cent compared to the corresponding period in 2007–08.
As a consequence of the global liquidity squeeze, Indian banks and corporates saw their
external sources of funding drying up. Hence, demand for credit spilled over into the
domestic market, bringing domestic financial and credit markets under pressure. Some
of the funds borrowed internally were begin converted in dollars to meet the overseas
debt servicing obligations of the corporates. This put the rupee under pressure and there
was a significant depreciation of the home currency. Foreign exchange reserves fell as
some of these were used to defend the rupee against the dollar.
India’s trade data for January 2009, the latest available, showed a 16 per cent drop in
exports and 18 per cent decline in imports and would appear to reinforce the slowdown
story. However, this drop was in dollar terms. Trade data, when denominated in rupees
showed positive growth in exports and still healthy growth in imports. Further, project
imports grew as much as 170 per cent in dollar terms in January 2009, showing that
corporate India has not stopped investing despite the downturn and higher cost of
capital. This trend is indeed confirmed by the third quarter GDP data released by the
Central Statistical Organization. Exports in dollar terms during April–January 2008–09
grew by 13.2 per cent whereas imports increased by 25.3 percent. Gross fixed capital
formation continued to be in excess of 33 per cent of GDP at current market prices in
October–December 2008.
ASARC WP 2009/01 4
Page 6
Raghbendra Jha The Global Financial Crisis and Short-run Prospects for India
Clearly, Indian industry expects the slowdown in the domestic economy to be short-
lived, and does not want to be caught unprepared when the recovery begins. Over a
shorter horizon, rupee exports grew 12 per cent, 22 per cent and 4.3 per cent in
November, December and January, even as the corresponding dollar figures were
negative. Clearly, rupee depreciation is responsible. But from the point of view of the
domestic economy, the rupee figure retains its significance. Exports of goods and
services grew 20 per cent in the third quarter, in rupee terms, even as imports rose 32 per
cent. Recession in the developed markets would continue to hit merchandise exports and
even service exports in the near term. However, as industrialized country companies try
to get their act together, it seems likely that India’s outsourcing industry would pick up
steam again.
On a more firmly optimistic note, the collapse of commodity prices has helped slow the
pace of growth of the trade deficit, bringing it below $100 billion for April 2008–
January 2009. The oil import bill has been slashed and accounts, preponderantly, for the
18 per cent decline in imports. Non-oil imports, too, have contracted but only 0.5 per
cent in January. In rupee terms, non-oil imports grew 23 per cent in January 2009, down
from the 64 per cent in December 2008. Within this category, project imports — no
matter how these are measured — have been growing vigorously. Hence, the trade data
reveal an economy that is still performing reasonably well, rather than of one that is
slipping into deep recession. A key reason for this is the strong dynamism of the Indian
economy, key elements of which we explore in the next section.
III. Key Drivers of Economic Growth in India
India’s growth rate has been accelerating for the past 25 years or so. Hence, there is
considerable momentum in the Indian economy. Contributing to this acceleration is a
broad series of reforms including financial sector reforms, increased globalization and
widening and deepening of product and financial markets. The impact of such reforms
gets reflected in key indicators such as market capitalization of the stock market, the
technology and transparency of transactions, the sets of instruments traded, balance
sheets of financial institutions and the degree of openness of the economy. Concurrently
a benign FDI policy framework has permitted greater tie-ups in high technology areas
ASARC WP 2009/01 5
Page 7
Raghbendra Jha The Global Financial Crisis and Short-run Prospects for India
for production for domestic as well as external markets. I now list some key factors (in a
growth accounting sense) that have led to the current surge in economic growth in India
and have the potential to sustain or even accelerate this growth rate.
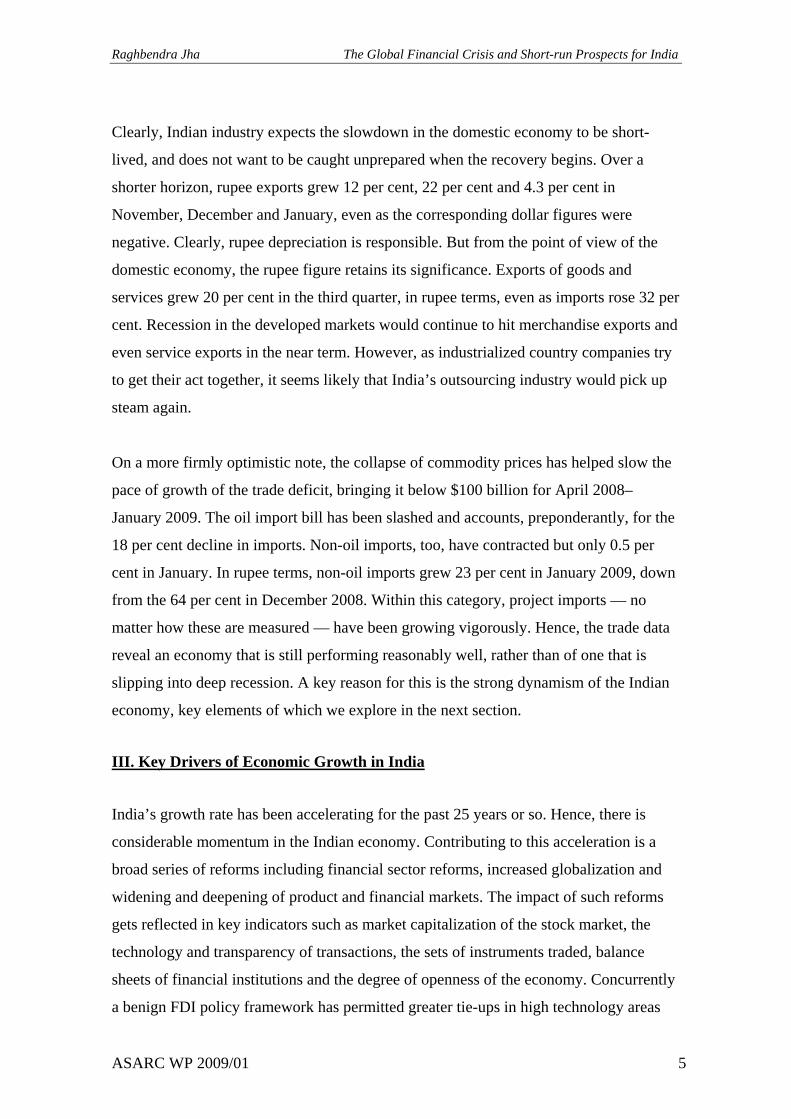
Productivity Growth
The higher GDP growth rate beginning in the 1980s has been accompanied by a sharp
acceleration in total factor productivity growth (Table 2).
Table 2: Sources of Growth in India: Aggregate and by Major Sectors (% pa)
Aggregate Economy
Contribution of
Period Output Employment Output per worker
Physical capital Land Education Factor
productivity 1978–04 5.4 2.0 3.3 1.3 0.0 0.4 1.6 1978–93 4.5 2.1 2.4 1.0 -0.1 0.3 1.1 1993–04 6.5 1.9 4.6 1.8 0.0 0.4 2.3 Agriculture 1978–04 2.5 1.1 1.4 0.4 -0.1 0.3 0.8 1978–93 2.7 1.4 1.3 0.2 -0.1 0.2 1.0 1993–04 2.2 0.7 1.5 0.7 -0.1 0.3 0.5 Industry 1978–04 5.9 3.4 2.5 1.5 0.3 0.6 1978–93 5.4 3.3 2.1 1.4 0.4 0.3 1993–04 6.7 3.6 3.1 1.7 0.3 1.1 Services 1978–04 7.2 3.8 3.5 0.6 0.4 2.4 1978–93 5.9 3.8 2.1 0.3 0.4 1.4 1993–04 9.1 3.7 5.4 1.1 0.4 3.9
Source: Bosworth and Collins (20073).
Table 2 presents data for the period 1978–2004 and the two sub periods: before reforms
(1978–93) and after reforms (1993–04). Aggregate productivity growth, driven mainly
by a pick up in service sector productivity growth, picked up considerably during 1993–
04 — in fact it more than doubled between 1978–93 and 1993–04. Agricultural growth
has stagnated except for the ‘green revolution’ phase of 1978–93.
3 Bosworth, B. & S. Collins (2007), ‘Accounting for Growth: Comparing China and India’, NBER
Working Paper no. 12943, Cambridge, Massachusetts.
ASARC WP 2009/01 6
Page 8
Raghbendra Jha The Global Financial Crisis and Short-run Prospects for India
Rodrik and Subramanian (2004) examine4 a number of possible explanations for this
rise in productivity growth. Such explanations include Keynesian type demand-led
expansion in the 1980s, the advent of the Green Revolution, and external and internal
liberalization. However, they find empirical support for attitudinal changes in
governments in the mid to late 1980s. These administrations, it is argued, began viewing
private investment and enterprise more favorably and modest reforms were initiated.
This had salutary effects on manufacturing sector productivity and later had substantial
spillover effects. Such beneficial synergies were helped by the climate of deregulation
and delicensing started in the early 1990s. Other authors have placed a much stronger
emphasis on the role of the post 1991 reforms and downplayed the role of policy
initiatives of the 1980s.5 To be sure, financial sector reforms began only in 1993 and are
yet to be completed.
Improvements in Labour Supply
India’s labour supply is undergoing fundamental changes. In 2000 the proportion of the
Indian population in the working age group (15–64 age bracket) was 60.9 per cent. The
UN’s Population Division has projected that this ratio will surpass the proportion of
Japanese in this age group by 2012 and climb to over 66 per cent in 30 years. At that
time it is poised to overtake China’s population in the same age group.
At the same time a quiet revolution is taking place in nutritional status in India with
calorie and other macro and micro nutrient deficiency on the decline. According to the
2001 Census during the period 1991 to 2001 the literacy rate climbed from 51.54 per
cent to 65.38 per cent in the aggregate, from 63.3 per cent to 75.85 per cent for males
and from 38.79 to 54.16 per cent for females. Thus India’s labour force is younger,
better nourished and has more skills than before. These changes imply substantial
4 Rodrik, D. and A. Subramanian (2004) ‘From Hindu Growth to Productivity Surge: The Mystery of the
Indian Growth Transition’ available at http://ksghome.harvard.edu/~drodrik/indiapaperdraftmarch2.pdf Accessed 17 April 2009.
5 There has been a debate of sorts about whether attitudinal changes in the government bureaucracy or actual policy changes are better explanations for the acceleration in economic growth in India. In a country with an autarkic trade regime and a highly centralized administrative structure, attitudinal changes may well be the hardest to make. Hence, both policy measures as well as attitudinal changes should be regarded as essential as well as complementary explanations for this surge in the rate of growth.
ASARC WP 2009/01 7
Page 9
Raghbendra Jha The Global Financial Crisis and Short-run Prospects for India
quality improvements in the India’s labour force. Economic theory and international
experience leads us to believe that this will lead to sharp rises in labour productivity and
an upward shift in the trend long run rate of growth of the Indian economy.
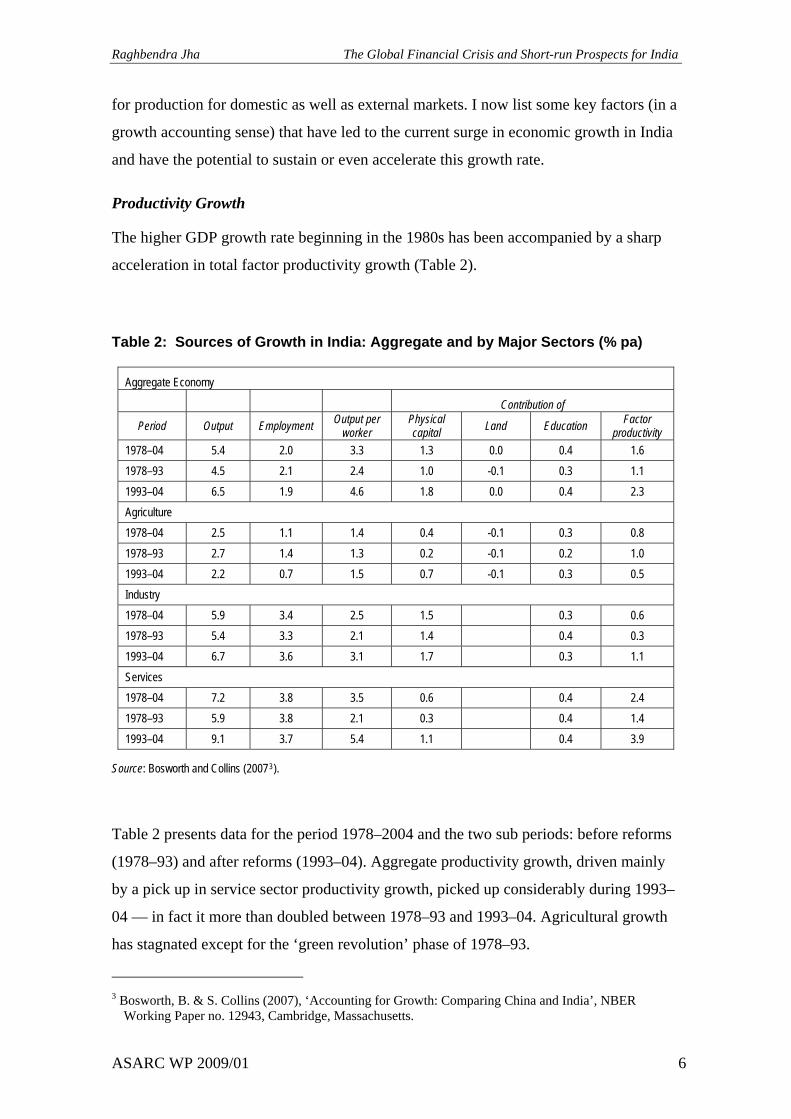
Higher Savings and Investment for Enhanced Economic Growth
Central to the growth success story has been a steady rise in India’s saving and
investment rates (Figure 1).
Figure 1: Gross Domestic Savings (% of GDP)
Private Household 23.8
(2006-07)
Private Corporate 7.8
(2006-07) Public
3.2(2006-07)
Total 35.6
(2007-08)
-5.0
0.0
5.0
10.0
15.0
20.0
25.0
30.0
35.0
40.0
1980
-81
1981
-82
1982
-83
1983
-84
1984
-85
1985
-86
1986
-87
1987
-88
1988
-89
1989
-90
1990
-91
1991
-92
1992
-93
1993
-94
1994
-95
1995
-96
1996
-97
1997
-98
1998
-99
1999
-00
2000
-01
2001
-02
2002
-03
2003
-04
2004
-05
2005
-06
2006
-07
2007
-08
P
Source: Reserve Bank of India
Savings have risen from 23.4 per cent of GDP in 2000–01 to 35.4 per cent in 2007–08.
During the same period investment rose from 24 per cent of GDP to 36.3 per cent of
GDP (Figure 2), indicating a marginal current account deficit. Public sector saving
turned positive in 2003–04 indicating improved tax and budgetary performance. With
36.3 per cent investment in 2007–08 India was able to obtain 9 per cent GDP growth
whereas China obtains 9 per cent growth with investment rates of over 40 per cent. Thus
the productivity of capital is higher in India than in China.
ASARC WP 2009/01 8
Page 10
Raghbendra Jha The Global Financial Crisis and Short-run Prospects for India
Figure 2: Gross Investment (% of GDP)
Public 7.8
(2006-07)
Private 28.1
(2006-07)
Total36.3
(2007-08)
0.0
5.0
10.0
15.0
20.0
25.0
30.0
35.0
40.0
1980
-81
1981
-82
1982
-83
1983
-84
1984
-85
1985
-86
1986
-87
1987
-88
1988
-89
1989
-90
1990
-91
1991
-92
1992
-93
1993
-94
1994
-95
1995
-96
1996
-97
1997
-98
1998
-99
1999
-00
2000
-01
2001
-02
2002
-03
2003
-04
2004
-05
2005
-06
2006
-07
2007
-08
P
Source: Reserve Bank of India
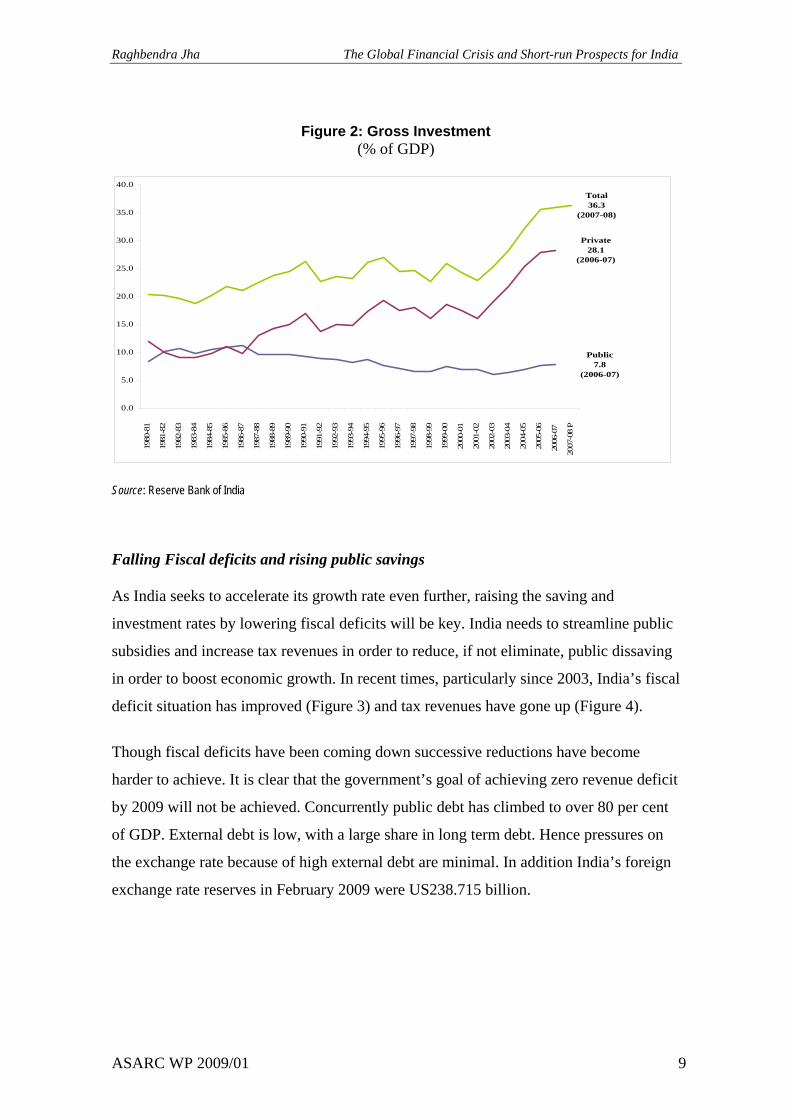
Falling Fiscal deficits and rising public savings
As India seeks to accelerate its growth rate even further, raising the saving and
investment rates by lowering fiscal deficits will be key. India needs to streamline public
subsidies and increase tax revenues in order to reduce, if not eliminate, public dissaving
in order to boost economic growth. In recent times, particularly since 2003, India’s fiscal
deficit situation has improved (Figure 3) and tax revenues have gone up (Figure 4).
Though fiscal deficits have been coming down successive reductions have become
harder to achieve. It is clear that the government’s goal of achieving zero revenue deficit
by 2009 will not be achieved. Concurrently public debt has climbed to over 80 per cent
of GDP. External debt is low, with a large share in long term debt. Hence pressures on
the exchange rate because of high external debt are minimal. In addition India’s foreign
exchange rate reserves in February 2009 were US238.715 billion.
ASARC WP 2009/01 9
Page 11
Raghbendra Jha The Global Financial Crisis and Short-run Prospects for India
Figure 3: Fiscal Deficits: Consolidated Center and States (% of GDP)
-2
0
2
4
6
8
10
12
1980
-81
1981
-82
1982
-83
1983
-84
1984
-85
1985
-86
1986
-87
1987
-88
1988
-89
1989
-90
1990
-91
1991
-92
1992
-93
1993
-94
1994
-95
1995
-96
1996
-97
1997
-98
1998
-99
1999
-00
2000
-01
2001
-02
2002
-03
2003
-04
2004
-05
2005
-06
2006
-07
RE
2007
-08
BE
Fiscal Year
Per
Cen
t
Gross Fiscal Deficit
Revenue Deficit
Gross Primary Deficit
Avg since 1980-81 ( 7.9)
Source: Reserve Bank of India
Figure 4: Tax Revenue: Centre and States (% of GDP)
10
11
12
13
14
15
16
17
18
1980
-81
1981
-82
1982
-83
1983
-84
1984
-85
1985
-86
1986
-87
1987
-88
1988
-89
1989
-90
1990
-91
1991
-92
1992
-93
1993
-94
1994
-95
1995
-96
1996
-97
1997
-98
1998
-99
1999
-00
2000
-01
2001
-02
2002
-03
2003
-04
2004
-05
2005
-06
2006
-07(
RE)
2007
-08
(BE)
Fiscal Year
Per
Cen
t
Avg since 1980-81 (15.0)
Source: Reserve Bank of India
ASARC WP 2009/01 10
Page 12
Raghbendra Jha The Global Financial Crisis and Short-run Prospects for India
India’s External Sector Performance
The recent acceleration in India’s economic growth has been associated with greater
economic integration with the global economy. India missed the first phase of trade
liberalization in the post-War period but is has not done so this time around. Indian
manufacturing tariffs are now low by world developing country standards: 12.5 per cent
and Indian anti-dumping appears to be slowing down. India is far less dependent on
tariffs for government revenue but agricultural tariff reduction has not kept pace with
industrial tariff liberalization. A necessary but not sufficient condition for it to be
reversed would be agricultural protection cuts in developed countries. India’s exports
have surged6 and India’s export basket is geared towards high value added items such as
engineering goods (Table 3).
Table 3: Commodity Composition of India’s Exports
Share (%) Growth rate (in US $ terms) %
April–September
2000–01 2005–06 2006–07 2006–07 2007–08
Cumulative annual
growth rate 2000–01 to
2004–05 2005–06 2006–07 2006–07 2007–08
Commodity Group 1. Primary Products,
of which 16.0 15.4 15.1 13.5 13.4 16.9 18.9 19.8 18.5 16.7
Agriculture & allied 14.0 10.2 10.3 9.5 9.3 9.0 19.8 23.5 24.7 15.1
Ores & Minerals 2.0 5.2 4.8 4.0 4.1 49.9 17.4 12.6 6.0 20.6
2. Manufactured Goods, of which 78.8 72.0 68.6 68.4 67.4 15.3 19.6 16.9 18.1 15.9
Textiles incl. RMG 23.6 14.5 12.5 12.9 11.1 4.3 20.4 5.7 33.5 1.2
Gems & Jewellery 16.6 15.1 12.6 12.7 13.0 16.8 12.8 2.9 -0.6 20.4
Engineering goods 15.7 20.7 23.3 22.8 23.5 25.4 23.4 38.1 48.1 21.2
Chemicals & related products 10.4 11.6 11.2 11.1 10.4 21.7 17.3 19.1 28.4 10.2
Leather & leather Manufactures 4.4 2.6 2.4 2.4 2.3 5.5 11.1 12.1 7.7 12.7
Handicrafts (incl. carpet handmade) 2.8 1.2 1.1 1.1 0.8 -5.3 30.3 4.1 5.2 -14.5
3. Petroleum, Crude & products (incl. coal)
4.3 11.5 15.0 16.5 17.9 38.7 66.2 59.3 106.2 27.6
Total exports 100.0 100.0 100.0 100.0 100.0 17.0 23.4 22.6 27.3 17.6
Source: Economic Survey Government of India 2007–08
6 India’s exports grew at 28.2 per cent and 29.8 per cent in 2004 and 2005 respectively compared to 21.2
per cent and 13.9 per cent for world exports, 27.3 per cent and 21.8 per cent for developing country exports and 35.3 per cent and 28.4 per cent for China for the two years.
ASARC WP 2009/01 11
Page 13
Raghbendra Jha The Global Financial Crisis and Short-run Prospects for India
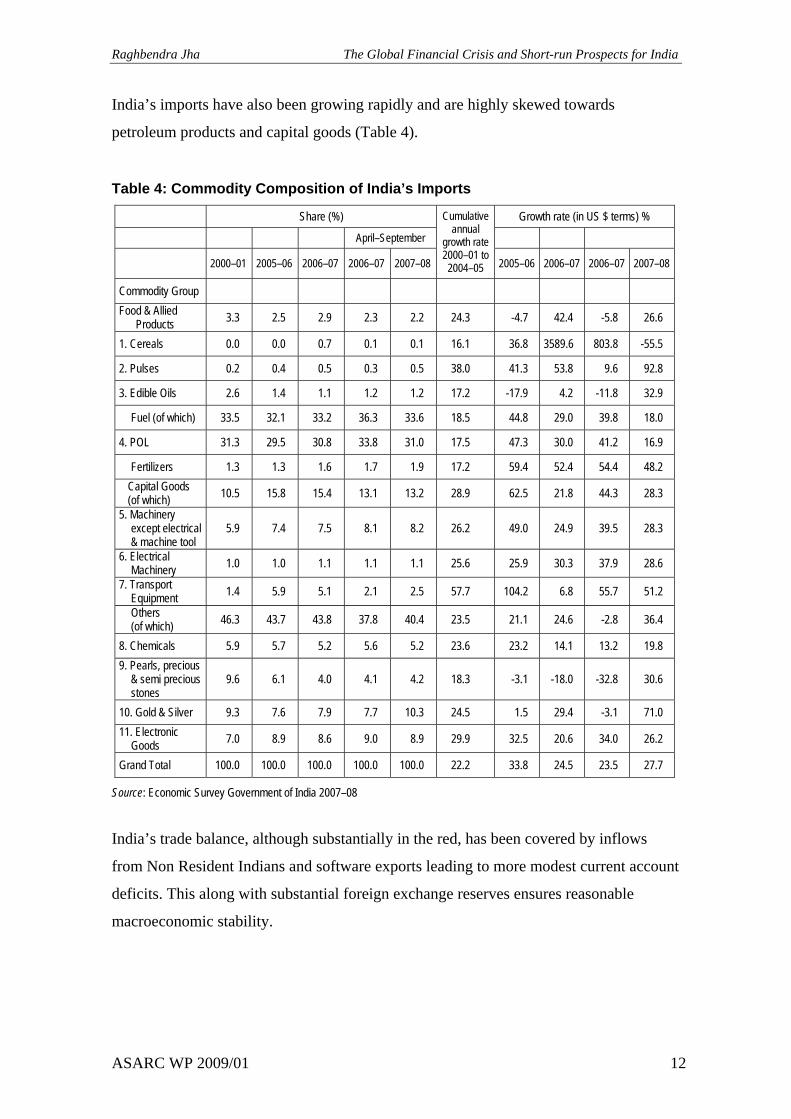
India’s imports have also been growing rapidly and are highly skewed towards
petroleum products and capital goods (Table 4).
Table 4: Commodity Composition of India’s Imports
Share (%) Growth rate (in US $ terms) %
April–September
2000–01 2005–06 2006–07 2006–07 2007–08
Cumulative annual
growth rate 2000–01 to
2004–05 2005–06 2006–07 2006–07 2007–08
Commodity Group
Food & Allied Products 3.3 2.5 2.9 2.3 2.2 24.3 -4.7 42.4 -5.8 26.6
1. Cereals 0.0 0.0 0.7 0.1 0.1 16.1 36.8 3589.6 803.8 -55.5
2. Pulses 0.2 0.4 0.5 0.3 0.5 38.0 41.3 53.8 9.6 92.8
3. Edible Oils 2.6 1.4 1.1 1.2 1.2 17.2 -17.9 4.2 -11.8 32.9
Fuel (of which) 33.5 32.1 33.2 36.3 33.6 18.5 44.8 29.0 39.8 18.0
4. POL 31.3 29.5 30.8 33.8 31.0 17.5 47.3 30.0 41.2 16.9
Fertilizers 1.3 1.3 1.6 1.7 1.9 17.2 59.4 52.4 54.4 48.2 Capital Goods (of which) 10.5 15.8 15.4 13.1 13.2 28.9 62.5 21.8 44.3 28.3
5. Machinery except electrical & machine tool
5.9 7.4 7.5 8.1 8.2 26.2 49.0 24.9 39.5 28.3
6. Electrical Machinery 1.0 1.0 1.1 1.1 1.1 25.6 25.9 30.3 37.9 28.6
7. Transport Equipment 1.4 5.9 5.1 2.1 2.5 57.7 104.2 6.8 55.7 51.2
Others (of which) 46.3 43.7 43.8 37.8 40.4 23.5 21.1 24.6 -2.8 36.4
8. Chemicals 5.9 5.7 5.2 5.6 5.2 23.6 23.2 14.1 13.2 19.8 9. Pearls, precious
& semi precious stones
9.6 6.1 4.0 4.1 4.2 18.3 -3.1 -18.0 -32.8 30.6
10. Gold & Silver 9.3 7.6 7.9 7.7 10.3 24.5 1.5 29.4 -3.1 71.0 11. Electronic
Goods 7.0 8.9 8.6 9.0 8.9 29.9 32.5 20.6 34.0 26.2
Grand Total 100.0 100.0 100.0 100.0 100.0 22.2 33.8 24.5 23.5 27.7
Source: Economic Survey Government of India 2007–08
India’s trade balance, although substantially in the red, has been covered by inflows
from Non Resident Indians and software exports leading to more modest current account
deficits. This along with substantial foreign exchange reserves ensures reasonable
macroeconomic stability.
ASARC WP 2009/01 12
Page 14
Raghbendra Jha The Global Financial Crisis and Short-run Prospects for India
IV. Channels through with the GFC has impacted India
Against the background of section III there should be reasons to believe that India
should be impacted, minimally, if at all by the GFC. However, there has been a
significant impact, which necessitates an explanation.
D. Subbarao, Governor of RBI, in a speech7 in February 2009 dealt at length on the
issue. His argument is essentially as follows. There are at least two reasons why one
should expect the GFC to have minimal impact on India. First, the Indian banking had
no direct exposure to the sub-prime mortgage crisis. Indeed, no Indian bank has had to
be rescued — nor has there been any need for deposits guarantee. Second, India’s
growth, as argued above, is largely based on domestic consumption and domestic
investment. External demand as measured by merchandise exports account for less than
15 per cent of India’s GDP.
However, Subbarao argues, the Indian economy has globalized rapidly during the past
few years. In terms of openness to international trade the ratio of exports plus imports to
GDP increased from by more than 50 per cent in the 10 years from 1997–98 to 2007–08
(from 21.2 per cent of GDP to 34.7 per cent of GDP). Furthermore, the growth of
financial integration has been even more rapid. During the same 10 year period (1997–
98 to 2007–08) the ratio of total external transactions (gross current account flows plus
gross capital account flows to GDP) increased by more than 100 per cent from 46.8 per
cent in 1997–98 to 117.4 per cent in 2007–08. Furthermore, corporate borrowing from
external sources has also increased significantly. In 2007–08, for example, India
received capital inflows to the extent of 9 per cent of GDP as against a current account
deficit of 1.5 per cent of GDP.
As a consequence three different channels of the impact of GFC on India can be
identified. The first is the financial channel — the growing integration of India’s
financial markets with global financial markets, as argued above, indicates that Indian
financial institutions would necessarily get impacted by the turmoil in global financial
markets. Second, and as also argued above, the growing trade links between India and
7 Subbarao, D. (2009), ‘Impact of the Global Financial Crisis on India: Collateral Damage and Response’,
Tokyo.
ASARC WP 2009/01 13
Page 15
Raghbendra Jha The Global Financial Crisis and Short-run Prospects for India
the rest of the world indicates that exports would decline quite sharply. This impact has
been most seriously felt in India’s buoyant services (including business process
outsourcing) and high value added manufacturing sectors. A final avenue through which
the crisis impacted India can be described as the confidence channel. Although Indian
banks and financial institutions continued to function in an orderly fashion, the tightened
global liquidity situation following from the failure of Lehman brothers in September
2008 had a follow-on effect and increased the risk-aversion of several banks and other
lending institutions.8
Thus, there is a slowdown in India’s growth performance — but not a collapse. India
instituted three stimulus packages in response to the slowdown in demand:
Details of various stimulus measures announced by the government are given in
Appendix 2.
Taken together, the measures put in place since mid-September 2008 have ensured that
the Indian financial markets continue to function in an orderly manner. The cumulative
amount of primary liquidity potentially available to the financial system through these
measures is about Rs.390,000 crore (78 billion dollars) or 7 per cent of GDP. This
sizeable easing has ensured a comfortable liquidity position starting mid-November
2008 as evidenced by a number of indicators such as the weighted average call money
rate, the overnight money market rate and the yield on the 10-year benchmark
government security. Commercial banks have responded to policy rate cuts by the
Reserve Bank of India by reducing their benchmark prime lending rates. Bank credit has
expanded too, but slower than last year. The RBI’s rough calculations show that, on
balance, the overall flow of resources to the commercial sector is less than what it was
last year indicating that even though bank credit has expanded, it has not fully offset the
decline in non-bank flow of resources to the commercial sector.
8 See Subbarao, D. (2009), ‘India — Managing the Impact of the Global Financial Crisis’, Reserve Bank
of India, Mumbai. Speech delivered to the Conference of Indian Industries on 26 March.
ASARC WP 2009/01 14
Page 16
Raghbendra Jha The Global Financial Crisis and Short-run Prospects for India
V. Conclusions
The short-run outlook for the Indian economy is unclear. Real GDP growth has shown
strong signs of slipping. Even the most dynamic service sector has been facing a
slowdown. Exports and industrial growth are down as is credit offtake.
The stimulus packages announced by the government and the Reserve bank of India
have had their desired effect. For example, the Indian auto industry, which was heading
towards a decline recorded positive growth of 0.71 per cent in total vehicle sales in fiscal
2008–09. In terms of components of the auto industry domestic passenger car sales rose
by 1.31 per cent to 1, 219,473 up from 1,203, 733 units in the previous year, similarly
sales of two wheelers recorded positive growth. There is widespread optimism that the
services and manufacturing sector will also record reasonable growth. The sharp fall in
the rate of inflation9 has provided room for more aggressive interest rate cuts by the
Reserve Bank of India. India’s banking system remains robust, although the burden of
servicing the larger debt because of the stimulus packages will not be insignificant.
Furthermore, although equity markets have registered steep declines the wealth impact
on domestic residents is limited since a large number of Indians do not participate in
equity markets.
Assuming that the global economy starts picking up in 2009–10, which it shows some
signs of doing, and provided developed countries do not resort to widespread
protectionism,10 the Indian economy should be in a good position to register a strong
comeback. Given that the stimulus packages have already imposed a significant fiscal
burden, the new central government would need to eschew undue populism, failing
which high fiscal deficits could again restrict India’s growth between potential as was
the case in the mid to late 1990s. However, the chances of this happening are lower now.
The Indian economy has certainly grown in terms of sophistication and depth since the
1990s. On balance, there is reason to be guardedly optimistic about the Indian economy
in the short run.
9 But food prices remain high. 10 However, this expectation may be belied.
ASARC WP 2009/01 15
Page 17
Raghbendra Jha The Global Financial Crisis and Short-run Prospects for India
Appendix 1: A Brief Chronology of the Global Financial Crisis 2007–
The Lauder Institute of the University of Pennsylvania provides a detailed chronology of
the Global Financial Crisis. See
http://lauder.wharton.upenn.edu/pdf/Chronology%20Economic%20%20Financial%20Cr
isis.pdf (Accessed 25th March 2009)
A Brief Chronology of the GFC 2007–08
1. In early 2007 default rates on subprime mortgages begin to rise in the US.
2. In June 2007 two hedge funds associated with investment bank Bear Stearns reported
huge losses resulting from their operations in the subprime market.
3. In July 2007 rating agencies began to downgrade bonds based on subprime
mortgages. IKB, a German bank, ran into difficulties with its portfolio of US securities.
4. In August 2007, the French bank BNP suspended three of its mutual funds due to
illiquidity. The European Cental Bank injected 95 billion euros into the repurchase
market. The Federal Reserve Board also took emergency measures to enhance liquidity.
Despite these efforts spreads on interbank overnight lending rose very sharply. The Fed
cut the rate at which it lends to banks by 0.5 per cent to 5.75 per cent and warns that the
credit crunch could be a risk to economic growth.
5. In September 2007 the rate at which banks lend to each other rises to its highest level
since December 1998. The Bank of England gave exceptional support to the British
mortgage bank Northern Rock. This bank did not hold significant US securities, but
relied heavily on borrowing in the short-term market, then frozen. The Fed cut its
interest rate again. The Bank of England injected £10 billion into the economy through
auctions, after previously refusing to inject any funds.
6. In October 2007 the Swiss bank UBS announced huge losses of $3.4 billion. Merrill
Lynch unveiled a $7.9 billion exposure to bad debt.
7. In December 2007 the Bank of England cut interest rates to 5.5 per cent. There was
coordinated and unprecedented action by 5 leading central banks to offer billions in
ASARC WP 2009/01 16
Page 18
Raghbendra Jha The Global Financial Crisis and Short-run Prospects for India
loans to commercial banks all over the world. There was a $20 billion auction from the
US Federal Reserve and $ 500 billion from the European Central Bank.
8. In January 2008 there was a rush to withdraw money from Scottish Equitable
prompting delays of up to 12 months. Global stock markets suffered their biggest loss
since 11 September 2001. The Federal Reserve Board cut interest rates to 3.5 per cent.
9. In February 2008 the Bank of England cut interest rates to 5.25 per cent. The British
government nationalized Northern Rock.
10. In March 2008 the Federal Reserve made $200 billion of funds available to banks to
improve liquidity. Bear Stearnes was bought by JP Morgan Chase in a deal brokered by
the Federal Reserve Board.
11. In April 2008 the Bank of England cut interest rates to 5 per cent. Confidence in the
UK housing market fell to its lowest level in 30 years.
12. In April 2008 the Bank of England announced a plan a £50 billion plan to permit
banks to swap bad assets with government bonds. Royal Bank of Scotland announced a
£12 billion rights issue and a plan to write off £5.9 billion in debt. The first annual fall
in house prices was recorded in the US.
13. In May 2008 the Swiss bank UBS announced a rights issue of $15.5 billion to cover
some of the $37 billion it lost to assets linked to the US mortgage debt.
14. In June 2008 Barclays announced a plan to raise £4.5 billion in a share issue to
bolster its balance sheet. Qatar raised its stake in British bank to 7.7 per cent.
15. In July 2008 US federal regulators seize Indy Mac Bank. This is the largest thrift in
the US to fall. Price of a barrel of oil reached a record $147.50. Financial authorities
stepped in to assist America’s two largest lenders — Fannie Mae and Freddie Mac. The
two institutions were owners or guarantors of $5 trillion worth of home loans. House
prices in Britain fell by 8.1 per cent — their biggest annual fall since the Nationwide
began its housing survey in 1991. In August this fall was confirmed to be of the
magnitude of 10.5 per cent in a year.
ASARC WP 2009/01 17
Page 19
Raghbendra Jha The Global Financial Crisis and Short-run Prospects for India
16. In August 2008 the global banking giant HSBC announced a 28 per cent fall in half
year profits. The investment bank BNP Paribas froze two of its funds because of
liquidity concerns. The European Central bank pumps 203.7 billion euros into the
market.
17. In September 2008 the £ hit new lows against the euro and the dollar. The ECB cut
its growth forecast for 2009 to 1.2 per cent from 1.5 per cent but left the interest rate
unchanged at 4.25 per cent. The FTSE index notched up its steepest weekly decline
since July 2002. The US unemployment rate rose to 6.1 per cent. Fannie May and
Freddie Mac are rescued. Manufacturing output in the UK fell sharply. Lehman Brothers
announced it is looking to be sold after reporting $ 4 billion in losses. The British
government nationalized trouble mortgage lender Bradford & Bingley. Crisis erupts in
Iceland. Lehman Brothers is allowed to close.
18. In October 2008 the US Congress passed a $700 billion asset bailout bill and the UK
Treasury announced a £500 billion bailout bill and the IMF announced emergency plans
to bailout governments affected by the financial crisis. Recession gets deeper in Asia,
particularly Japan. The British government announced that it would pump billions of
pound sterling in a number of banks. Former Fed Chairman, Alan Greenspan, admitted
that he had been ‘partially wrong’ in his hands-off approach to the banking industry. The
UK economy was officially in recession.
The Federal Reserve cut its interest rate by half a point. Deutsche Bank reported steep
falls in profits and write-downs. The chief of Merrill Lynch resigned.
19. In November 2008 China announced a two-year $586 billion stimulus package. The
Bank of England cut its interest rate to 3 per cent, the lowest since 1955 and the ECB
lowered its interest rate to 2.75 per cent. The US Treasury announced investment of $ 40
billion in preferred stock of AIG, adjusting the terms of the existing credit line and its
amount. Fannie Mae lost $29 billion on write-downs. US Treasury Secretary scrapped
the original troubled asset relief program. There was an international summit in
Washington to reinvent the global financial system. Japan passed officially into
recession. Citigroup was bailed out. The IMF approved a $7 billion loan to Pakistan.
The EC unveiled an economic recovery plan worth 200 billion euros. China’s central
bank cut interest rates by more than a full percentage point. The Chinese economy began
ASARC WP 2009/01 18
Page 20
Raghbendra Jha The Global Financial Crisis and Short-run Prospects for India
to slow. Auto makers in Japan and the US posted huge losses. The viability of some
household brands such as General Motors is threatened. Japan’s industrial output kept
falling.
20. In December 2008 a US recession was confirmed. The recession was estimated to
have begun in December 2007. London Scottish Bank went into administration. France
unveiled a 26 billion euro stimulus plan. The European Central Bank and central banks
in England, Sweden and Denmark slash interest rates. The Euro zone entered recession.
The German parliament passed a 31 billion euro stimulus plan. The Reserve Bank of
India cut short term interest rates. Joblessness rose sharply in the US and the three
largest US carmakers — GM, Ford and Chrysler — asked for bailouts. The Government
of India unveiled a $60 billion dollar (5 per cent of GDP) to stimulate the economy. The
Reserve Bank of India cut interest rates for the third time in two months. The Bank of
Canada lowered its benchmark interest rate to the lowest level in 50 years. Citigroup
announce widespread job losses. South Korea’s central bank cut interest rates and China
reported a fall in exports in seven years. Bank of America announced 35,000 job losses.
Russia headed for a recession. The Russian central bank spent $161 billion defending
the rouble but was unsuccessful and had to devalue the currency twice in one week. US
consumer prices fell and the threat of deflation loomed large. The Japanese central bank
cuts interest rates from 0.3 per cent to 0.1 per cent. — the Japanese economy was
confirmed to be in recession. US treasury unveils a $6 billion plan to rescue GMAC but
the plan turned out to be unsuccessful.
21. In January 2009 US budget deficit was estimated to be $1 trillion. Later in the year
this estimate was revised to $2 trillion. The Bank of England cut interest rates to 1.5 per
cent the lowest in its 315 year history. 2.6 million workers were registered as
unemployed in the US alone. It was reported that the UK economy shrank by 1.5 per
cent in the last thee months of 2008. Gold became a safe haven for ravaged investors
and gold prices started to rise. The German Chancellor Angela Merkel unveiled an
economic stimulus package worth about 50 billion euros. China overtook Germany to
become the world’s third largest economy. Citigroup unveiled plans to get split into two
entities. A new bailout for the UK financial system was announced control over lenders
was to be increased. Saudi Arabia’s central bank cut two key interest rates as Arab
economies started to slow down. Bank of Canada cut its benchmark rate to 1 per cent —
ASARC WP 2009/01 19
Page 21
Raghbendra Jha The Global Financial Crisis and Short-run Prospects for India
the lowest in 50 years. Unemployment in the UK came close to 2 million persons.
Chinese economic growth fell to 9 per cent in 2008 — the lowest in seven years. The
UK enters recession officially. Indeed the pace of the UK economy’s shrinking was the
fastest in 26 years. Unemployment kept rising steadily across the world. The French and
German governments announced stimulus packages.
22. In February 2009 the Australian government announced a $26.5 billion stimulus
package. The Reserve Bank of Australia cut interest rates to 3.25 per cent the lowest
level in 45 years. The EU and Canada warned that a clause in the US economic recovery
package could promote protectionism. The Bank of England cut its interest rate to 1 per
cent. German industrial output registered a record fall. The US Congress approved a
$787 billion economic stimulus package. Euro zone GDP dipped at annualized 5.9 per
cent in the fourth quarter of 2008. The French government announced that it would
spend up to 5 billion euros to recapitalise its banking sector. The Dow Jones Index fell
to its lowest value in 12 years. Data from US and Japan suggested that the downturn has
turned into the worst slump since the 1930s.
23. In March 2009 Japan’s parliament passed legislation to give cash hand-outs to every
resident in order to boost the recession-hit economy. Australia’s economy shrank for the
first time in eight years. The European Central bank cut its interest rates to 1.5 per cent,
the lowest since it started setting euro rates in January 1999. The unemployment rate in
the US jumped to 8.1 per cent. Satyam approved to sell 51 per cent stake. Japan’s
current account recorded its largest deficit on record reaching $1.8 billion. This was the
first deficit in 13 years. The World Bank estimated that the global economy will shrink
for the first time this year since World War II. The White House assured China that its
$1 trillion in investments in the US are safes, despite the economic downturn. Finance
Ministers from the G20 group of rich and emerging nations pledged to make a ‘sustained
effort’ to pull the world economy out of recession.
24. In April 2009 leaders from the G-20 countries (19 major countries + the European
Union) gathered in London to discuss the contours of a global response to the financial
crisis. Major regulatory measures and additional funding for the IMF were among the
policy measures advanced.
ASARC WP 2009/01 20
Page 22
Raghbendra Jha The Global Financial Crisis and Short-run Prospects for India
Appendix 2: Summary of various stimulus measures announced by the Government
Several stimulus measures were announced by the Government of India in response to
the GFC. The first such measure, the Sixth Pay Commission, was a routine policy
measure and not in response to the GFC as such. The Pay Commission recommended an
across the board increase in the salary of employees of the central government. This
would be followed in due course by state governments announcing comparable salary
increases for their own employees. The burden of the additional payout was computed to
be Rs. 1.57 trillion ($31.4 billion at current market exchange rates) during 2008–09. This
represents 40 per cent of the payout. The rest 60 per cent is to be paid out in 2009–10.
The first stimulus package announced in December 2008 envisaged the following
(mainly fiscal) measures:
i) Additional plan, non-plan expenditure of Rs.300,000 crore (Rs.3 trillion/$60 billion)
in four months
ii) Parliament nod to be sought for Rs.20,000 crore (Rs. 2 trillion/$40 billion more
toward plan expenditure
iii) Across-the-board cut of four per cent in the ad valorem central value-added tax
iv) Interest subvention of two per cent on export credit for labour intensive sectors
v) Additional allocations for export incentive schemes
vi) Full refund of service tax paid by exporters to foreign agents
vii) Incentives for loans on housing for up to Rs.500,000, and up to Rs.2 million
viii) Limits under the credit guarantee scheme for small enterprises doubled
ix) Lock-in period for loans to small firms under credit guarantee scheme reduced
x) India Infrastructure Finance Co allowed to raise Rs.100 billion through tax-free
bonds
xi) Norms for government departments to replace vehicles relaxed
ASARC WP 2009/01 21
Page 23
Raghbendra Jha The Global Financial Crisis and Short-run Prospects for India
xii) Import duty on naphtha for use by the power sector is being reduced to zero
xiii) Export duty on iron ore fines eliminated
xiv) Export duty on lumps for steel industry reduced to five percent
A second stimulus package (comprising mainly montary and credit policy measures)
was announced in January 2009 . Key elements of this pakage were as follows:
i) An SPV would be designated to provide liquidity support against investment grade
paper to Non Banking Finance Companies (NBFCs) fulfilling certain conditions.
The scale of liquidity potentially available through this window would be Rs.25,000
crores/$50 billion.
ii) An arrangement would be worked out with leading Public Sector Banks to provide a
line of credit to NBFCs specifically for purchase of commercial vehicles.
iii) Credit targets of Public Sector Banks were revised upward to reflect the needs of the
economy. Government would monitor, on a fortnightly basis, the provision of
sectoral credit by public sector banks.
iv) Special monthly meetings of State Level Bankers’ Committees would be held to
oversee the resolution of credit issues of micro, small and medium enterprises by
banks. Department of MSME and Department of Financial Services would jointly
set up a Cell to monitor progress on this front.
v) The guarantee cover under Credit Guarantee Scheme for micro and small enterprises
on loans was increased from Rs 5 million to Rs 10 million with a guarantee cover of
50 per cent. In order to enhance flow of credit to micro enterprises, it was decided to
increase the guarantee cover extended by Credit Guarantee Fund Trust to 85 per cent
for credit facility upto Rs 0.5 million. This will benefit about 84 per cent of the total
number of accounts accorded guarantee cover.
vi) State Governments are facing constraints in financing expenditure because of slower
revenue growth. To help maintain the momentum of expenditure at the state
government level, states will be allowed to raise in the current financial year
ASARC WP 2009/01 22
Page 24
Raghbendra Jha The Global Financial Crisis and Short-run Prospects for India
additional market borrowings of 0.5 per cent of their Gross State Domestic Product
(GSDP), amounting to about Rs 30,000crore/$ 60 billion, for capital expenditures.
vii) India Infrastructure Finance Company (IIFCL) was authorized to raise Rs 10,000
crores/$20 billion through tax free bonds by 31 March 2009 for refinancing bank
lending of longer maturity to eligible infrastructure bid based PPP projects. This
would enable the funding of mainly highways and port projects on hand of about Rs
25,000crore/$50 billion. To fund additional projects of about Rs 75,000 crore/$150
billion at competitive rates over the next 18 months, IIFCL would be allowed to
access in tranches an additional Rs 30,000crores/$60 billion by way of tax free
bonds once funds raised in the current year are effectively utilized.
ASARC WP 2009/01 23