13
The Global Flows of Recovered Fibre Henri Vermeulen, VP Recovered Fibre Europe
The Global Flows of Recovered Fibre
Henri Vermeulen, VP Recovered Fibre Europe

Key Takeaways
► Global Recovered Fibre demand is increasing whilst supply is constrained by collection rate ceilings
► Chinese Recovered Fibre deficit will remain in place
North American and European exports of key importance
► Quality of Recovered Fibre becoming an important factor
► SKG’s 75% ‘Grip’ gives a strong control over supply
► Rising OCC prices will support industry pricing
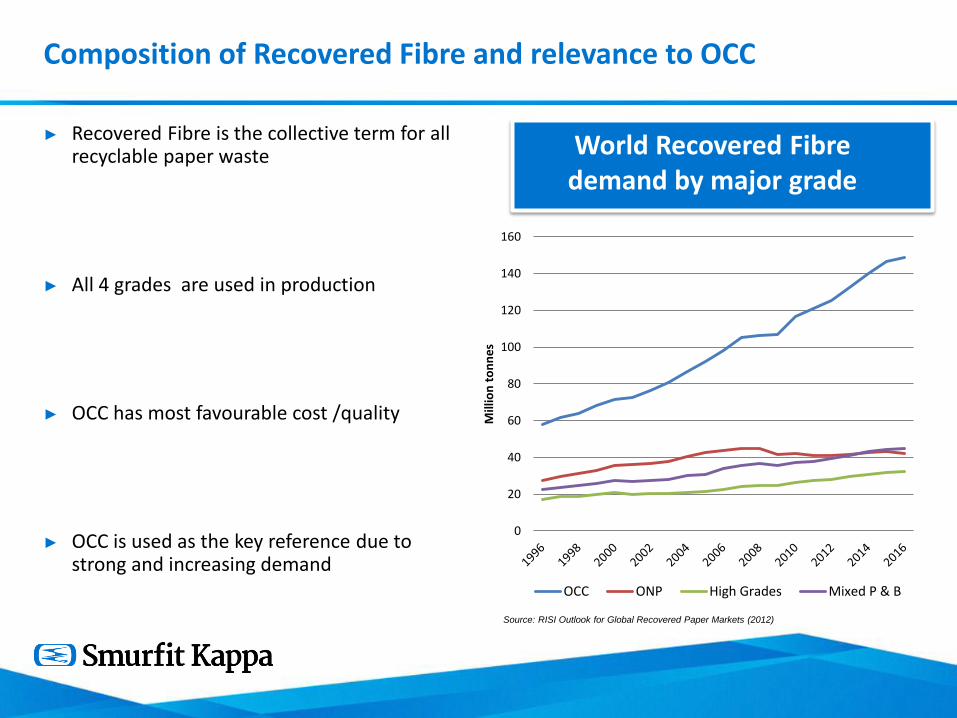
Composition of Recovered Fibre and relevance to OCC
► Recovered Fibre is the collective term for all recyclable paper waste
► All 4 grades are used in production
► OCC has most favourable cost /quality
► OCC is used as the key reference due to strong and increasing demand
0
20
40
60
80
100
120
140
160
Mill
ion
to
nn
es
OCC ONP High Grades Mixed P & B
World Recovered Fibre demand by major grade
Source: RISI Outlook for Global Recovered Paper Markets (2012)

Snap-shot of Recovered Fibre at SKG
► Europe’s biggest Recovered Fibre consumer
2012 consumption of 5.4m tonnes
► Strong control over supply
► Recovered Fibre makes up ~ 50% of paper production costs
► Increasingly impacted by global trade flows
4,260 metric
kT
1,176 metric
kT
Europe the Americas
Recovered Fibre consumption: Smurfit Kappa
Source: Smurfit Kappa

World Recovered Fibre market
► Annual consumption approximately 234m tonnes
► China, North America and Western Europe account for more than 60% of the global consumption
► Decreases in North America and Western Europe due to declining publication paper market
0
10
20
30
40
50
60
70
80
90
100
China North America Western Europe
Mill
ion
to
nn
es
1995 2007 2012
Recovered Fibre Consumption by region
Source: RISI Outlook for Global Recovered Paper Markets (2012)
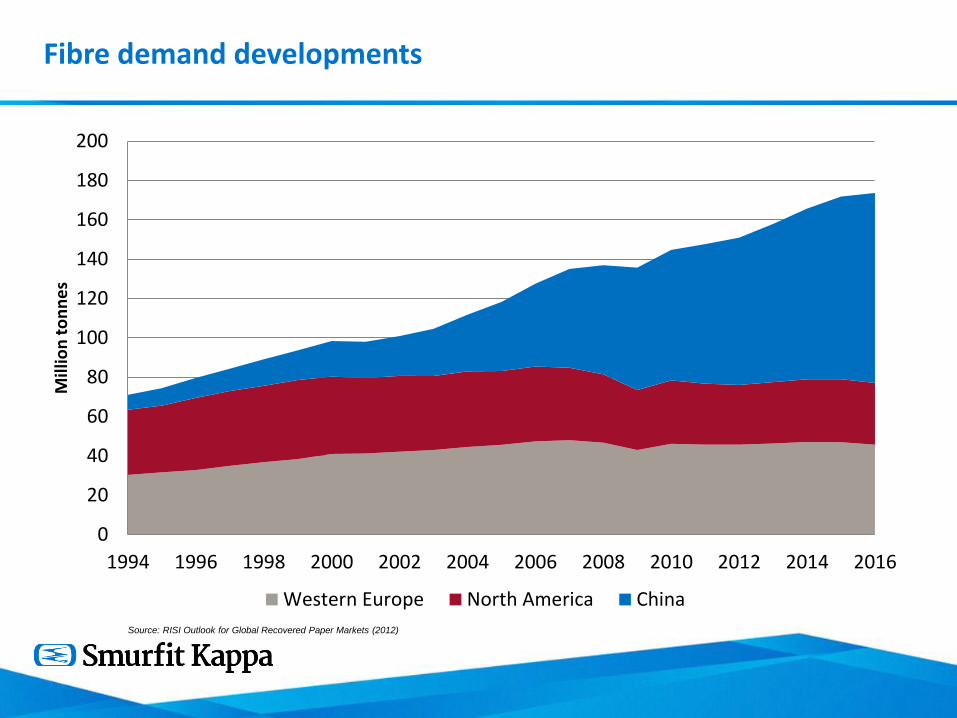
Fibre demand developments
0
20
40
60
80
100
120
140
160
180
200
1994 1996 1998 2000 2002 2004 2006 2008 2010 2012 2014 2016
Mill
ion
to
nn
es
Western Europe North America China
Source: RISI Outlook for Global Recovered Paper Markets (2012)
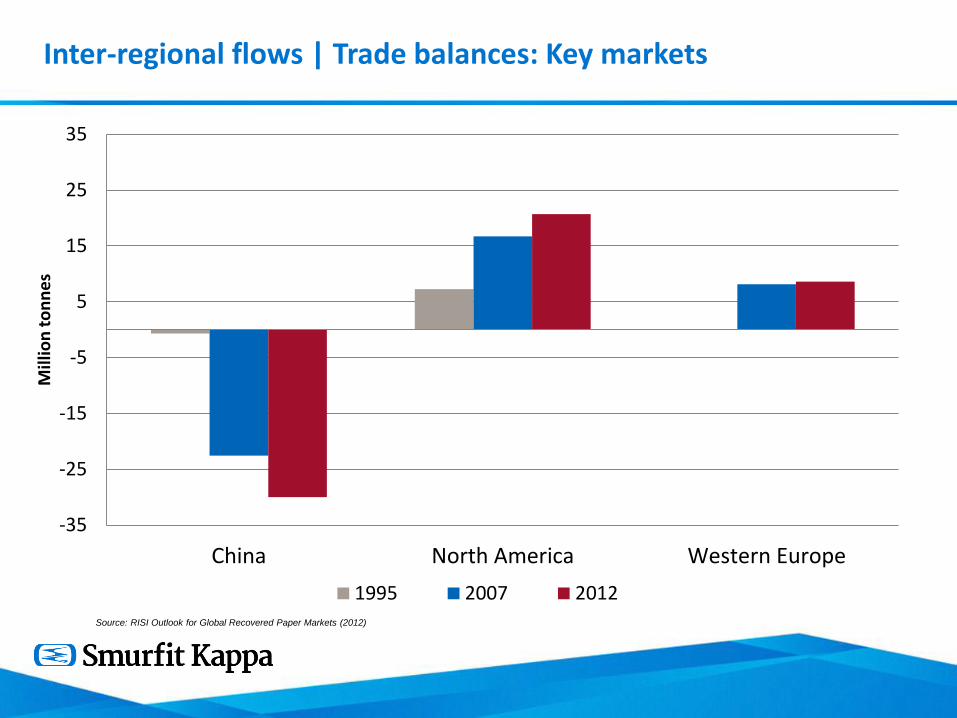
Inter-regional flows | Trade balances: Key markets
-35
-25
-15
-5
5
15
25
35
China North America Western Europe
Mill
ion
to
nn
es
1995 2007 2012Source: RISI Outlook for Global Recovered Paper Markets (2012)

Recovery rates of Recovered Fibre
► The recovery rate is the ratio of Recovered Fibre collection to (apparent) paper and board consumption
China: 44% | North America: 65% | Western Europe: 74% Source: RISI Outlook for Global Recovered Paper Markets (2012)
► A recovery rate of around 80% is considered the maximum limit
► Chinese reported rates are depressed by corrugated exports
► China will require continuing high imports levels of Recovered Fibre to sustain planned capacity expansion

Quality issues with Recovered Fibre
► Deteriorating quality of Recovered Fibre an important issue
► Comingled collection and material recovery facilities
► Recycling rates in Europe are close to the ‘recycling limit’
As a result inferior quality was tolerated due to tight supply conditions
► Clean and accessible Recovered Fibre volumes used for local consumption with remainder exported

Quality issues with Recovered Fibre
► In February 2013 China adopted their ‘Green fence’ policy
► Demand has remained balanced with 2012 levels despite tighter quality controls
► Exporters reluctant to ship materials unless quality can be assured
► Increased demand for quality further reinforces price premium
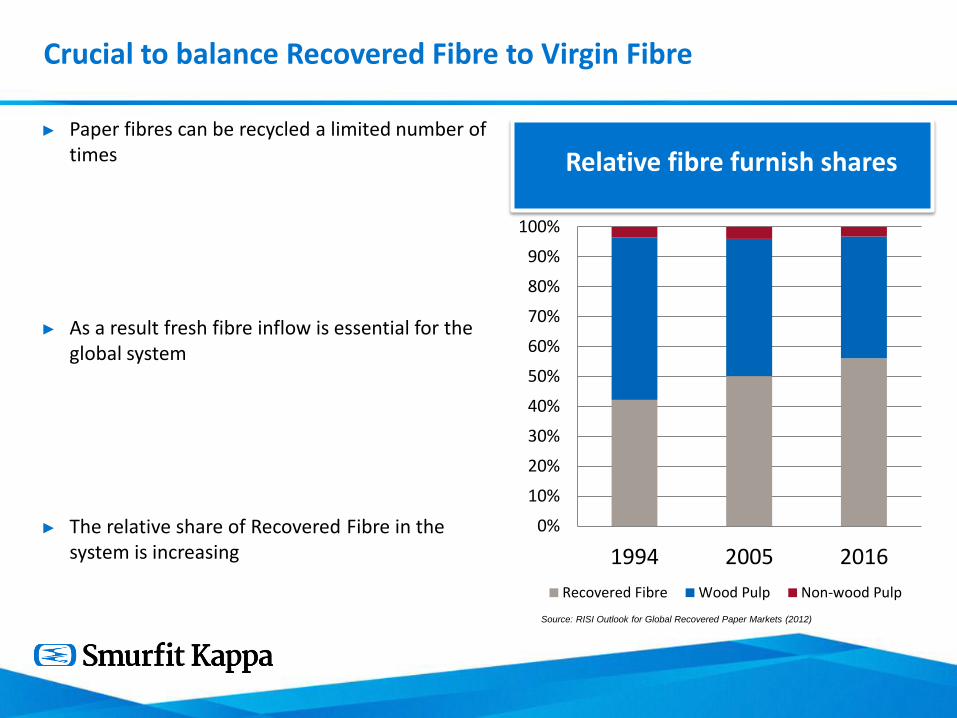
Crucial to balance Recovered Fibre to Virgin Fibre
► Paper fibres can be recycled a limited number of times
► As a result fresh fibre inflow is essential for the global system
► The relative share of Recovered Fibre in the system is increasing
0%
10%
20%
30%
40%
50%
60%
70%
80%
90%
100%
1994 2005 2016
Recovered Fibre Wood Pulp Non-wood Pulp
Source: RISI Outlook for Global Recovered Paper Markets (2012)
Relative fibre furnish shares
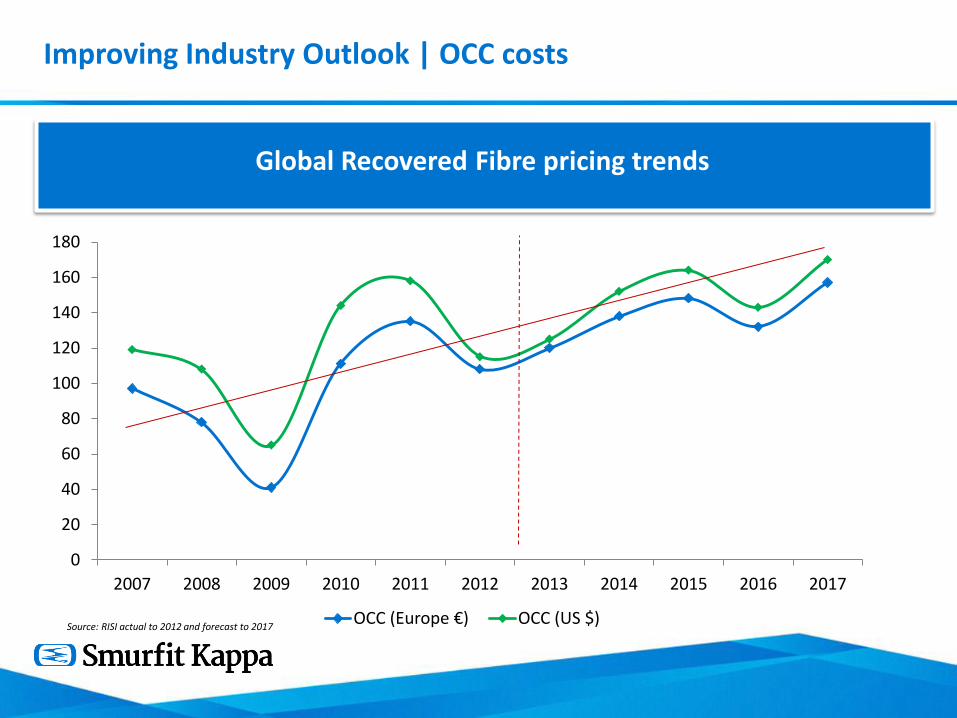
Improving Industry Outlook | OCC costs
0
20
40
60
80
100
120
140
160
180
2007 2008 2009 2010 2011 2012 2013 2014 2015 2016 2017
OCC (Europe €) OCC (US $)
Global Recovered Fibre pricing trends
Source: RISI actual to 2012 and forecast to 2017
Key Takeaways
► Global Recovered Fibre demand is increasing whilst supply is constrained by collection rate ceilings
► Chinese Recovered Fibre deficit will remain in place
North American and European exports of key importance
► Quality of Recovered Fibre becoming an important factor
► SKG’s 75% ‘Grip’ gives a strong control over supply
► Rising OCC prices will support industry pricing

![Govt Acctg Recovered] Recovered]](https://static.documents.pub/doc/80x56/577d26c61a28ab4e1ea2266a/govt-acctg-recovered-recovered.jpg)

![Yatra.ppt Recovered]](https://static.documents.pub/doc/80x56/5467820ab4af9f3a3f8b580c/yatrappt-recovered.jpg)
![Evaluation media presentation1 [recovered] [recovered]](https://static.documents.pub/doc/80x56/5539c6115503464e418b4a65/evaluation-media-presentation1-recovered-recovered.jpg)
![barcodes [Recovered]](https://static.documents.pub/doc/80x56/5885f0ec1a28ab864f8b5c79/barcodes-recovered.jpg)


![Poster_IIC [Recovered] [Recovered]](https://static.documents.pub/doc/80x56/568bf4721a28ab89339e0ba6/posteriic-recovered-recovered.jpg)


![ALCOHOL1 [Recovered]](https://static.documents.pub/doc/80x56/577ce4601a28abf1038e36af/alcohol1-recovered.jpg)
![Anglesinlife [Recovered]](https://static.documents.pub/doc/80x56/5592a5e61a28ab57798b46dd/anglesinlife-recovered.jpg)

