36
www.GTED.net THE GLOBAL TAX EXPENDITURES DATABASE (GTED) COMPANION PAPER Agustín Redonda Christian von Haldenwang Flurim Aliu

www.GTED.net
THE GLOBAL TAX EXPENDITURES DATABASE (GTED) COMPANION PAPER
Agustín Redonda
Christian von Haldenwang
Flurim Aliu

COMPANION PAPER TO THE GLOBAL TAX EXPENDITURES DATABASE
CONTENT TABLE
3 LIST OF ABBREVIATIONS
4 ABSTRACT
5 1 INTRODUCTION
7 2 THE GLOBAL TAX EXPENDITURES DATABASE2.1 Tax expenditure data2.2 Search process2.3 Data collection and classification 2.4 Quality assurance
17 3 DATA COMPARABILITY3.1 Within-country comparability3.2 Cross-country comparability
21 4 USING THE GLOBAL TAX EXPENDITURES DATABASE WEBSITE. A PRACTICAL GUIDE4.1 Home page4.2 Country profiles4.3 Data visualisation4.4 Data download4.5 Other GTED website pages
30 REFERENCES
32 ANNEX
ISBN 978-3-96021-164-8DOI 10.23661/r6.2021
© Deutsches Institut für Entwicklungspolitik gGmbHTulpenfeld 6, 53113 BonnTel.: +49 (0)228 94927-0Fax: +49 (0)228 94927-130Email: [email protected]://www.die-gdi.de
Except as otherwise noted this publication is licensed under Creative Commons Attribution (CC BY 4.0). You are free to copy, communicate and adapt this work, as long as you attribute the German Development Institute / Deutsches Institut für Entwicklungspolitik (DIE), the Council on Economic Policies (CEP) and the authors.
COMPANION PAPER TO THE GLOBAL TAX EXPENDITURES DATABASE
3
ATAF African Tax Administration Forum
CIT Corporate Income Tax
CIAT Inter-American Center of Tax Administrations
EU European Union
G20 Group of Twenty
GDP Gross Domestic Product
GTED Global Tax Expenditure Database
IBP International Budget Partnership
IMF International Monetary Fund
LCU Local Currency Unit
LICs Low-Income Countries
LMICs Lower Middle-Income Countries
MoF Ministry of Finance
OECD Organisation for Economic Co-operation and Development
PIT Personal Income Tax
PwC PricewaterhouseCoopers
R&D Research and Development
SME Small and Medium-Sized Enterprises
SECO Swiss State Secretariat for Economic Affairs
TE Tax Expenditure
UNCTAD United Nations Conference on Trade and Development
UNU-WIDER
United Nations University World Institute for Development Economics Research
UN-ECLAC
United Nations Economic Commission for Latin America and the Caribbean
USD US Dollar
VAT Value-Added Tax
LIST OF ABBREVIATIONS

COMPANION PAPER TO THE GLOBAL TAX EXPENDITURES DATABASE
4
The Global Tax Expenditures Database (GTED) is the first database providing timely and consistent information on TEs, based on official information published by national governments worldwide from 1990 onwards. The GTED aims to improve reporting, enhance scrutiny, and, ultimately, to contribute to the design of effective and fair TEs across the world. This Companion Paper introduces the GTED. It describes the rationale and scope as well as the methodology and assumptions underpinning data collection and categorisation.
The Companion Paper also discusses the limitations and issues that GTED users need to bear in mind when using the database. Finally, it presents a users’ guide to the GTED website www.GTED.net, providing details on the categories and indicators as well as insights on the potential queries and pre-defined charts that can be generated on the platform.
ABSTRACT
Tax expenditures (TEs) are tax benefits that lower government revenue and the tax liability of the beneficiary. Governments worldwide use TEs to pursue different policy goals such as attracting investment, boosting innovation and fighting poverty. At the same time, TEs are costly (the global average over the 1990-2020 period is 3.8 per cent of GDP and 24.2 per cent of tax revenue) and often ineffective in reaching their stated goals. They can sometimes be highly distortive and trigger negative externalities such as exacerbating inequality.
Yet, despite the fact that TEs have similar effects on public budgets as direct spending, the lack of transparency in this area is striking: only 97 out of 218 jurisdictions have reported on TEs at least once since 1990. Moreover; the quality, regularity and scope of such reports are highly heterogeneous and, in many cases, lag significantly behind minimum standards.

COMPANION PAPER TO THE GLOBAL TAX EXPENDITURES DATABASE
5
1 INTRODUCTION
Tax expenditures (TEs) - also known as tax breaks, tax benefits or tax incentives - are benefits granted through preferential tax treatment that lower government revenue as well as the tax liability of the beneficiary taxpayer.
The TE notion was introduced in the 1970s by Stanley Surrey, a former Harvard professor and Assistant Secretary of the US Treasury, who highlighted the fact that government support for specific groups or activities is often granted through tax privileges rather than direct spending.
Although impressive, the figures mentioned above probably underestimate the real dimension of tax expenditures, for several reasons. First, despite their magnitude and the fact that they have similar effects on public budgets as direct spending entitlements, the lack of transparency and accountability on tax expenditures is notable. According to the GTED, only 97 out of the existing 218 jurisdictions have reported official revenue forgone estimates at least once since 1990.
In the vast majority of the cases, an “indirect” approach is taken to define TEs as departures from the normal – usually country-specific – tax structure or benchmark. Indeed, as stated by Surrey & McDaniel (1976), taxation consists of two components: i) the general provisions of the tax system, and ii) exemptions from those provisions in favour of a particular industry, activity, or group. It is the latter that they refer to as TEs.1
TEs are widely used by governments worldwide to pursue different policy goals such as attracting investment, boosting research and development (R&D) and innovation, incentivising pensions savings, or mitigating inequality; and are implemented as exemptions, deductions, credits, deferrals, and reduced tax rates.
They are also costly and significantly reduce tax revenue collection. In the United States, the federal government is estimated to have forgone more than 1.4 trillion US dollars (USD) in 2019, almost 7 per cent of gross domestic product (GDP) and roughly one third of federal government spending. In Australia, Canada and the United Kingdom (UK), TEs amounted to 8.4 per cent, 6.5 per cent and 7.5 per cent of GDP in 2019, respectively. On average, TEs exceed 4 per cent of GDP among European Union (EU) member states and can be as high as 13 per cent in the Netherlands, more than 12 per cent in Finland and more than 10 per cent in Czechia. TEs are also widely used in emerging and developing countries. TEs range from more than 1 per cent to almost 8 per cent of GDP in Latin America, from almost 0.5 per cent to more than 6 per cent in Asia, and from slightly more than 0.5 per cent to 8 per cent of GDP in Africa.
Although already significant in themselves, the figures mentioned above often underestimate the real dimension of TEs as, despite their magnitude, the use of TEs is characterised by a striking lack of transparency and accountability: only 97 out of the existing 218 jurisdictions have reported official revenue forgone estimates at least once since 1990.
The availability of reliable TE data is not only crucial to increase transparency and accountability. It is also a necessary (though not sufficient) condition to conduct sound evaluations regarding the effectiveness and efficiency of TE provisions, and ultimately, to better align tax systems with the different policy objectives pursued by governments.
1 Althoughnotwidelyused,someexpertshavetakena“direct”approachtodefineTEs,basedonasetofcharacteristics (Myles et al., 2014).
COMPANION PAPER TO THE GLOBAL TAX EXPENDITURES DATABASE
6
Against this backdrop, the goals of the Global Tax Expenditures Database are threefold: i) to shed light on the current state of TE reporting and enhance transparency on TEs, ii) to create consistent cross-country information on TEs, ensuring a certain level of comparability, and iii) to trigger international research in the field of TEs, including empirical assessments of specific provisions, leading to evidence-based reforms of TE systems.
This paper presents the newly created GTED, a joint initiative led by the Council on Economic Policies (CEP) and the German Development Institute (DIE) that was launched in June 2021 and will be updated on an ongoing basis. The GTED seeks to fill some of the main TE data gaps by collecting all official and publicly available information on TEs published by national governments worldwide from 1990 onwards.2
The reminder of the paper is structured as follows. Section 2 describes the GTED, its rationale and scope as well as the methodology and assumptions underpinning data collection and categorisation. Section 3 discusses the limitations and issues that GTED users need to bear in mind when using the database. Finally, Section 4 presents a users’ guide to the GTED website www.GTED.net, providing details on the categories and indicators as well as insights on some of the potential queries and pre-defined charts that can be generated on the platform.
2 ThecurrentversionoftheGTEDincludesdatapublisheduntil30September2020.

COMPANION PAPER TO THE GLOBAL TAX EXPENDITURES DATABASE
7
2 THE GLOBAL TAX EXPENDITURES DATABASE
2.1 Tax expenditure dataThe GTED gathers all official and publicly available data on TEs. Relying on official and public information alone limits the scope of the GTED, but including internal reports or other types of information that are not publicly available would go against one of the main objectives of the GTED: shed light on the lack of transparency in the field. Moreover, complementing official figures with other sources would not provide an accurate picture of TE reporting. In addition, assessing the quality and credibility of information provided by third parties can be challenging. While the same could be said regarding information provided by governmental sources, in this latter case governments themselves can be held accountable if the information they publish turns out to be incomplete or wrong.
Ideally, governments would publish TE reports on an annual basis, linked to their budgets. They would provide information on all TE provisions individually, including their legal basis and duration, the tax base upon which each TE is granted, the policy objective it is supposed to serve, the beneficiaries it targets, the type of TE and, not least, the fiscal cost it entails in terms of revenue forgone.
In reality, however, the quality, regularity and scope of TE reports vary significantly. Some countries such as Australia and Morocco publish comprehensive documents, providing not only revenue forgone estimates at the level of individual TEs, but also information on the tax base, type of TE, policy objectives and beneficiaries. In countries such as Germany,
Canada, France, Ukraine and Italy, the information for some provisions even includes the number of taxpayers benefitting from a specific TE. In many other cases, however, governments report only a limited number of aggregate revenue forgone estimates. Portugal and Costa Rica, for instance, only provide overall estimates aggregated by tax base.
Apart from the overall quality and regularity of TEs, it is difficult to judge how close the data provided reflects the reality, since governments often publish information on a subset of existing provisions only. In the United States, for instance, the official TE report published by the Treasury includes revenue forgone estimates at the provision level, but only for income-related TE provisions.3
In general terms, richer countries tend to report more and better on TEs.4 However, the heterogeneity is significant across all country income groups. Of the 46 member countries of the Group of 20 (G20) and the Organisation for Economic Co-Operation and Development (OECD), 2 do not publish any official tax expenditure information (China and Saudi Arabia), and 11 do not report provision-level data, but only aggregate estimates. Indeed, the quality and scope of TE reports vary widely in this group of countries (Redonda & Neubig, 2018). Likewise, of the 27 EU member states, 3 (Croatia, Cyprus and Malta) do not report on TEs at all, and 10 only provide limited information. Both groups of countries appear to be in breach of the EU Council Directive on requirements for budgetary frameworks, which explicitly states that “Member States shall publish detailed information on
3 Thereportalsoprovidesrevenueforgonefiguresforafewprovisionsrelatedtotaxesongoodsandservices,buttheseareonlyincludedasfootnotesandrepresentanegligibleshareofthereportedrevenueforgone(ingeneral,therevenueforgonefromincometaxesaccountsfor99.5percentormore)–see:https://home.treasury.gov/policy-issues/tax-policy/tax-expenditures, accessed 11.06.2021
4 FormoreinformationonpatternsofTEusebasedonGTEDdata,pleaserefertotheGTEDFlagshipReport2021 “SheddingLightonWorldwideTaxExpenditures”(vonHaldenwangetal.,2021).

COMPANION PAPER TO THE GLOBAL TAX EXPENDITURES DATABASE
8
and the US since 1972. Yet, for the vast majority of countries, TE reporting is a relatively new exercise and hence the availability of time series data can be limited. Indeed, some countries have produced just one or very few reports over the last decades. For example, Switzerland has reported only once on TEs (in 2011), Senegal has published only two reports since 2014, and Turkey has released three reports since 2007.5
2.2 Search processBuilding-up the GTED starts with the search process to gather the data. Whereas some countries are very transparent in publishing TE data (e.g. by including TE reporting in their budget process), this is far from being the rule.
As indicated in Figure 1, we developed a “step-by-step” process to uncover all potential sources of official information. As the first step, we use standard internet search engines to look for “tax expenditure” and other related terms (e.g. tax relief, tax break, tax incentive, etc.) both in English and in the official language(s) of each country. Regardless of whether the first step yields any results, we continue by looking into the websites of several official institutions such as the Parliament (Budget Statement), the Ministry of Finance, the Tax Administration, and the Statistics Office, among others.6
This ensures that we cover any reported data even in the rare cases, such as the US, where more than one government agency publishes a TE report.7 In addition, we download and screen the three most recent reports of each institution (i.e. Budget Statement from the Ministry of Finance or the Annual Report of the Tax Authority) to find any information on TEs.8
the impact of tax expenditures on revenues.” (Council directive 2011/85/EU, p. L 306/47).
The situation is even bleaker when it comes to low- and middle-income countries, where TE reporting is frequently still in its infancy. This is due to a variety of reasons, including data constraints, insufficient human and financial resources and weaker institutional frameworks (Kassim & Mansour, 2018). Of the 79 low- and lower-middle income economies, 45 do not report at all and 8 countries report aggregate estimates only.
It is worth mentioning that, the GTED only gathers data on TEs implemented by national governments, as the lack of reliable data on TEs implemented by lower tiers of government is even more significant than in the case of national-level data. This said, a number of highly visible and widely discussed cases show that TEs granted by subnational governments can indeed be significant in federations or highly decentralised countries. Provided that the availability of data improves, future versions of the GTED could incorporate subnational TE data.
The GTED has a global scope, and it is structured as a panel, providing information on 218 jurisdictions since 1990. Regarding the cross-sectional dimension, 121 out of 218 countries have been classified as non-reporting. Identifying the countries that do not report any TE data is already a valuable piece of information , because it illustrates the lack of transparency in the field.
When it comes to the time dimension, some countries have been reporting on TEs for many years. Some countries even started reporting before 1990 – i.e. Canada provides data since 1979, Germany since 1967,
5 Apartfromthe2011report,theSwissStateSecretariatforEconomicAffairs(SECO)haspublishedinformationontaxreliefsgrantedtoindividualfirmsinstructurallyweakregions,withrevenueforgonefiguresrangingbetween0.3percentand0.05percentofGDPbetween2007and2017.Seehttps://www.seco.admin.ch/seco/en/home/Standortfoerderung/KMU-Politik/Steuererleichterungen_im_Rahmen_der_Regionalpolitik.html, accessed 11.06.2021.
6 TheGTEDDataSearchTemplatecanbefoundatwww.GTED.net/methodology7 TheUnitedStatespublishesmultipleTEreports:areportbytheTreasuryDepartment,areportbytheJointCommitteeon
TaxationusingdatafromtheTreasury,andanotherreportbytheCongressionalBudgetOffice.WeusetheTreasuryTEreportasthemainsourceofdata.Thisisbasedonthebroadcoverageofthereportandthelengthoftimeforwhichithasbeenpubliclyavailable.Similarassessmentsarecarriedoutinothercaseswheremorethanonesourceofdataisavailable.
8 TheEnglish-languageversionsofofficialwebsitesoftencontainmuchlessinformationthanthewebsiteversionsintheoriginallanguageofthecountry.Toensurethatwenotmissanyinformation,weemploythelistofsearchtermsinbothversionsofthewebsiteandinbothlanguages.
COMPANION PAPER TO THE GLOBAL TAX EXPENDITURES DATABASE
9
A positive result of these first two steps implies that the process moves into the second stage: data collection and classification. However, if the outcome is negative, a reviewer repeats the first two steps of the data search process to check for any potential omission. This is due to the fact that a confirmation of non-reporting is also highly relevant for the GTED. Even after a second negative outcome, there are additional steps to confirm non-reporting. First, we look for statements of non-reporting by national or a third-party institutions. Third-party sources of information mainly include the Open Budget Survey (OBS) conducted by the International Budget Partnership (IBP) and the IMF Fiscal Transparency Evaluations. The IBP conducts country-specific surveys to promote public access to budget information and the adoption of inclusive and accountable budget systems. These surveys assess availability, timeliness and comprehensiveness of budget documents, opportunities for public participation and the scope of budgetary oversight. Most relevant for the GTED, Question #45 reads as follows: “Does the Executive’s Budget Proposal or any supporting budget documentation present information on tax expenditures for at least the budget year?”, which is an important source of information (IPB, 2016).
The IMF Fiscal Transparency Evaluations are another source of information when it comes to the existence of TE data (IMF, 2018). These assessments are carried out upon request by a given country. They explicitly assess the existence of TE reporting, and can even provide some information on the scope of the reports as well as the repository where they are published.9 We also check for no-data confirmations from other sources such as different regional organisations – the African Tax Administration Forum (ATAF, for Africa), the Inter-American Center of Tax Administrations (CIAT, for Latin America) – and even the PricewaterhouseCoopers (PwC) Worldwide Tax Summaries.
As a last step, we reach out to a governmental institution (usually the MoF) in order to get an official confirmation of non-reporting from a government representative. If we do not receive response within the time period
specified in the request for information, and if all other options described above have been exhausted, a given country is classified as “non-reporting”.
Whenever data is found (at any stage of the search process), the collection and classification stage is triggered. Again, to minimise the likelihood of human errors in inputting the data, there is always a 2-step process before the data is uploaded into the GTED: a first data analyst collects and classifies the data following the GTED Data Collection Template, and a second data analyst (or reviewer) performs a random quality check of the inputted data.10
2.3 Data collection and classification
2.3.1 Quantitative dataThe GTED collects two types of quantitative TE data: revenue forgone estimates and numbers of beneficiaries. TE or revenue forgone estimates quantify the amount of revenue a country forgoes or loses by granting tax deductions, exemptions, etc. The number of beneficiaries refers to the number of taxpayers who claimed a particular tax benefit, triggering a direct revenue loss. Unlike estimating revenue forgone, which often requires statistical modelling and simulations, reporting the number of beneficiaries is relatively straightforward, provided the availability of tax return data. Nonetheless, this can also be challenging for some governments, particularly in low- or lower-middle-income countries (LICs and LMICs), since compiling and processing administrative tax return data can be a resource- and time-consuming exercise.
In some cases, getting access to the raw data can be difficult, even for the MoF. In Switzerland, for instance, tax returns (including for federal income taxes) are processed by the cantonal (and/or local) authorities. They may or may not capture the data needed to evaluate certain TEs and, moreover, they are typically not shared with the federal government (FTA, 2019).
9 TheIMFFiscalTransparencyEvaluationsareavailableat:https://www.imf.org/en/Topics/fiscal-policies/fiscal-transparency, accessed 11.06.2021
10TheGTEDDataCollectionTemplatecanbefoundatwww.GTED.net/methodology.

COMPANION PAPER TO THE GLOBAL TAX EXPENDITURES DATABASE
10
Figure 1. GTED Search Process
Task Completed by:
• Data Analyst • Reviewer • Data Manager
GTED Search Process
Data Found
Data Collected
Data Reviewed
Issues with Data
Issues Addressed
No Issues with Data
Data Uploaded to GTED
No Data Found
Search Process
Repeated
Data Found
No Data Found
Confirmation of Non- Reporting Found?
Yes
Classified as "Non-
Reporting"
No
Government Contacted
Data Found
Non-Reporting Confirmed
No Response
Data Uploaded to GTED Jurisdiction Classified as
"Non-Reporting"
Figure 1: GTED search process
COMPANION PAPER TO THE GLOBAL TAX EXPENDITURES DATABASE
11
2.3.1.1 Revenue forgone dataThe revenue forgone estimates are a core information of the GTED. Inputting revenue forgone data usually does not present major challenges since the raw data is simply collected and inputted in local currency units (LCU).
In some cases, a single revenue forgone estimate is reported for multiple TE provisions, or multiple revenue forgone estimates are reported for one TE provision. In the former case, since it is impossible to know the share of each provision, a new record is created in the GTED Template, which saves the estimate separately. In the latter case, the reported TE provision is split into several records and the revenue forgone estimates are saved separately.
Revenue forgone estimates are taken from the most recent report in which they appear. For example, if a government reports estimates for 2014 in its 2014 TE report, its 2015 TE report, and its 2016 TE report; the 2014 figures in the GTED will come from the 2016 report. However, if a country reports disaggregated data for a year in one report, but only aggregated data for the same year in subsequent reports, we record the most recent data point with disaggregated data. We also only record actual revenue forgone estimates and not projections or forecasts.
For the sake of comparability and to put figures in context, we then normalise the revenue forgone figures and present them as a share of GDP and as a share of tax revenue collected. To do this, we use LCU figures from the UNU-WIDER Government Revenue Dataset (UNU-WIDER, 2020). For GDP UNU-WIDER mainly uses data from international organisations such as the IMF or the World Bank, sometimes re-basing them due to country-specific circumstances. GDP figures are currently provided up to the year 2019. Regarding tax revenue, we use the “total tax revenue (including social contributions)” figures for central governments from UNU-WIDER. This indicator uses data from international and regional organisations such as IMF, OECD, and UN-ECLAC. The tax revenue figures currently go up to the year 2018. Both datasets are updated on a yearly basis.
Data offered by UNU-WIDER uses the most recent local currency for each country. In some cases we have to convert our own revenue forgone figures from an older local currency to the current local currency (e.g. Deutsche Mark for Germany before 1999 to Euros). Such a conversion is done using online sources providing average yearly currency exchange rates.11
Finally, also for the sake of comparability, all revenue forgone LCU figures are converted into USD using exchange rate data from the United Nations Conference on Trade and Development (UNCTAD). This data represents the average yearly exchange rate between the USD and a given LCU.12
2.3.1.2 Number of beneficiariesWherever available, we gather information on the number of beneficiaries, which is the other piece of information (apart from revenue forgone estimates) that varies on a yearly basis. Hence, the number of beneficiaries for each year is inputted in a similar format to the revenue forgone estimates. Although this is a crucial piece of information, e.g. to shed light on take-up ratios, it is rarely provided. Only 21 countries publish such data for a subset of TE provisions in each case.
2.3.2 Qualitative dataBesides the name (in original language and in English) and the description of the TE provision, we classify the data based on four main categories: the tax base to which TE provisions are applied (for instance, corporate income tax - CIT, or value-added tax - VAT), the mechanism or type of TE through which they are granted (exemption, reduced rate, deduction, credit, deferral, etc.), the policy objective pursued by the TE (employment creation, boosting R&D and innovation, reducing poverty, etc.) as well as the targeted beneficiary group (businesses, households, etc.).
On top of these four main categories, we gather other relevant information including the estimation method, the legal reference triggering the TE provision, and information regarding the time frame (i.e. if a provision
11Thesesourcesincludecountry-specificwebsitesexplainingtheconversionoftheoldcurrencytoeuros,suchasthewebsiteoftheBundesbank,aswellaswebsitescoveringmultiplecountries,suchaswww.fxtop.com.
12 Inrarecases,missingexchangeratedatafromtheUNCTADiscomplementedusingwww.fxtop.com.
COMPANION PAPER TO THE GLOBAL TAX EXPENDITURES DATABASE
12
Besides looking into the basic tax base categories such as PIT, CIT, VAT, customs, and excises; data analysts do additional research on what exactly the reported name of a tax base means in the context of a specific country. For example, a country may report revenue forgone on a tax base called “Vehicle Tax.” The data analyst establishes whether such a provision refers to a tax on vehicle ownership (in which case the tax base is categorised as a property tax), a tax on the import of vehicles (in which case it is categorised as a customs duty, under taxes on goods and services), or a tax on the fuel used to power the vehicle (in which case it is categorised as a fuel tax, under excise taxes).
If it is uncertain under which GTED category the tax base falls, the tax base of the provision is categorised as “Other”. This label is also used if the reported tax base is clear, but does not fall under any of the categories listed in the Data Manual. Likewise, if the report confirms that a provision is applicable to more than one tax base, it is categorised as “Multiple”. If the TE report confirms that a provision is applicable to multiple tax bases, but all those tax bases fall under one of the Level 1 GTED tax base categories, the appropriate category is selected under Level 1 and the option “multiple” is selected in the lower categories. For example, an exemption for a certain good that is applicable to both customs duties and VAT is classified as taxes on goods and services, on Level 1, and “Multiple”, on level 2. Lastly, “Not stated/unclear” is selected when the TE report offers very limited or no data regarding the applicable tax base for a given provision.
2.3.2.2 Type of TERegarding the type of TE, all categories are organised under the same level. The data analyst must choose between categories such as: exemption, deduction, deferral, reduced tax rate, tax credits, etc. For special incentives such as “accelerated depreciation,” “accelerated capital-cost allowances”, “loss carry-forwards,” etc.14 the data analyst must do additional research to confirm the core type of incentive that is behind the program – i.e. read about the incentive and determine whether it operates as an exemption,
is permanent or if there is a sunset clause limiting its duration). The four main qualitative categories, the TE name, and the legal reference of the TE provision are mandatory and must be filled out for all records in the GTED. The classification methodology for these fields is described in the following sub-sections.
2.3.2.1 Tax basesTax base information in the GTED is organised in three levels. The first level distinguishes three broad tax base categories: taxes on income, goods and services, and property. The second level introduces sub-categories. For example, taxes on income are split into CIT, personal income tax (PIT), capital gains tax, etc.; taxes on goods and services are split into VAT, customs duties, excise taxes, etc.; and taxes on property are split into real estate taxes, land value taxes, vehicle taxes, etc. The third level takes some of the second level categories and breaks them down further. For example, VAT is broken down into internal VAT and customs VAT; and excise taxes are broken down into the specific goods to which the excise is applied (e.g. alcohol, tobacco, fuels, etc.).13 The data analysts always select the lowest possible level of disaggregation and the upper levels are automatically applied. For example, if a report indicates that a certain provision is for internal VAT, the data analyst selects that option under Level 3 and the two upper levels are added automatically (Level 2=VAT, Level 1=Taxes on Goods and Services).
Such a breakdown allows the GTED to accommodate different reporting styles of countries and produce data that can be analysed in a consistent way. For example, Country A may only report that certain revenue forgone estimates stem from “income taxes” but not specify whether those estimates come from PIT or CIT. Country B, in contrast, may differentiate between PIT and CIT revenue forgone. While we cannot compare the share of revenue forgone attributed to CIT between Country A and Country B, we can still compare the two countries regarding their respective share of revenue forgone attributed to “taxes on income”.
13 ThefulltaxbasecategorylistcanbefoundintheAnnex,TableA.1.14 ThefullTEtypecategorylistcanbefoundintheAnnex,TableA.2.

COMPANION PAPER TO THE GLOBAL TAX EXPENDITURES DATABASE
13
a deduction, a tax credit, etc. If the incentive program is complex and includes more than one type of TE – for example, the provision offers an income tax deduction for an investment up to a certain amount and a reduced tax rate thereafter – the type of TE is classified as “Multiple”. In cases in which it is not clear what the correct categorisation should be, or the type of TE does not neatly fall under any category listed in the Data Manual (e.g. the provision only offers a partial exemption and not a full exemption), the option “Other” is selected. Lastly, “Not stated/unclear” is selected when the TE report offers very limited or no data regarding the applicable type of TE.
2.3.2.3 BeneficiariesSimilarly to the type of TE category, the beneficiary category also has one level of mandatory classification. This includes categories such as businesses, households, non-profit organisations, international organisations, etc.15 However, the beneficiaries category also has a non-mandatory second level where the type of beneficiary is further specified, if such information is available in the TE report (which is not often the case). For example, if level 1 is “Businesses”, the second level may specify that the targeted businesses are small and medium-sized enterprises (SMEs) “manufacturers,” “exporters,” or any other type of business. However, because the way countries report data about beneficiary types is very heterogeneous, this level 2 field does not include a set of pre-defined categories, but allows free text inputs.
Information on the type of beneficiaries is not always explicitly stated, or can be inferred from the TE name or description. The only cases in which the beneficiary type can be inferred is if the tax base of the provision is PIT (beneficiaries = households) or if the tax base for the provision is CIT (beneficiaries = businesses). In all other cases, if the beneficiary type is not explicitly stated, the classification “Not stated/unclear” is selected. If the reported information specifies multiple types of beneficiaries – for example, the TE report states that a particular VAT exemption is applicable both to businesses and to households – the beneficiary
is classified as “Multiple.” If the beneficiary type for any provision is stated but does not fall under any of the first level categories defined in the GTED Data Manual, the beneficiaries for those provisions are classified as “Other.”
2.3.2.4 Policy objectivePerhaps the hardest category to classify is the policy objective. The objectives countries pursue through the implementation of TEs can range from broad policy goals such as “promote economic growth” or “create employment” to more specific ones such as “develop the agriculture sector” or “increase access to health services.” Such heterogeneity makes the classification of policy objectives particularly challenging. The GTED uses a long list of policy objectives and two levels to classify the data for this category. The first level splits data into broad objectives such as “Attract/promote investment”, “Develop a priority economic sector”, “Increase access to/demand for certain goods or services”, etc. The second level, splits those categories further. For example, “Attract/promote investment” is split into “Attract domestic investment”, “Attract Foreign Direct Investment (FDI)”, etc.; and the “Develop a priority economic sector” first-level category is split into “Develop the agriculture sector”, “Develop the Information and Communication Technology (ICT) sector”, etc. 16
Similarly to the beneficiaries category, the policy objective can hardly ever be inferred from the name or description of the TE provision, unless explicitly stated. The policy objective of a TE provision is usually only inputted if it is specified in the TE report, i.e. only when the report has a section stating the provision’s objective. In rare cases, information about the policy objective may be taken from the name or description of a TE provision, but only if it is presented as such – for instance, if the name or description of the provision contains phrases such as “the objective of this provision is…”, “this provision aims to…”, “the goal of this provision is…”, etc.
15 ThefullbeneficiariescategorylistcanbefoundintheAnnex,TableA.3.16 ThefullpolicyobjectiveslistcanbefoundintheAnnex,TableA.4.

COMPANION PAPER TO THE GLOBAL TAX EXPENDITURES DATABASE
14
Legal ReferenceThis field collects information about the law, article, and paragraph upon which a certain TE provision is based. The most recent available legal reference is used to populate this field.
Linked ProvisionIf an original provision is transformed into 2 or more new provisions, the ID of the original provision is recorded in this field for each of the new provisions. For example, if a country reports revenue forgone from “VAT exemptions on milk and milk products” (all together) until 2008, and revenue from “VAT exemptions on milk” and from “VAT exemptions on milk products” separately from 2009 onwards, the ID of the original provision is saved in the linked provision field of the two new provisions.
Data TypeThis field classifies the data reported by countries into four groups: “Provision-level data”, if the country reports data at the individual TE provision level; “Overall estimates” if a country only reports aggregate TE data, e.g. by tax base; “Very disaggregated” if the country provides detailed information, yet without unambiguously linking it to individual provisions, and “Somewhat disaggregated” if the country provides data that is not as detailed as the latter category, but contains more information than a broad category such as tax base only (e.g. data providing both the tax base and the type of beneficiary).
Source, Last Updated, Other, & FootnotesThe “Source” field saves the name of the government agency from which the data regarding a TE provision is collected. “Last Updated” indicates the month and the year in which the GTED staff last updated the qualitative and quantitative data for a given provision. “Other” and “Footnotes” collect any overall notes or footnotes that cannot be saved in the category-specific notes sections.
2.3.2.6 Data collection practices applicable to all categoriesSome useful information (tax base, beneficiary type, TE type, or other information) is provided in table titles/subtitles and columns. For instance, in Belgium, the tax
Because of the heterogeneity of the data and because policy objectives can be very nuanced (i.e. “attract investment” and “promote investment” can have diverging meanings), the original wording of each policy objective is saved in the notes section. This information can be relevant to GTED users who need to go into more detail. The policy objective for a provision is classified as “Multiple” when the provision has more than one objective; as “Other” if the original data does not neatly fall under any of the GTED labels; and as “Not stated/unclear” if the policy objective of a provision is not explicitly stated.
2.3.2.5 Other qualitative data fieldsFunctional or Budgetary CategoryIn this optional field, we record any information regarding the budgetary/functional category of a provision, or the sector to which it applies. This field is optional because countries often do not provide this information, and even when they do, the categorisations used differs heavily from one country to another.
Time Frame & DurationIn the “time frame” field, we classify provisions as having a sunset clause, if such information is provided in the TE report, or as permanent if no information on the end date of a provision is given. If a provision does indeed have a sunset clause, we record the end date of the provision or the number of years for which it will be/has been active in the “duration” field.
Estimation methodThis field collects information about the estimation method of the revenue loss caused by a provision. Currently, since the vast majority of countries reports estimates based on the „revenue forgone“ approach, this is the only estimation method included in the GTED. However, additional methods may be added in the future if such data becomes available.17
Implementation and ModificationIn this field, we record any information about modifications made to a provision over the years. For example, a reduced VAT rate for a specific activity that jumps from 3 per cent to 5 per cent in 2013 (compared to the standard VAT rate of 8 per cent).
17 SeeSection3.2.2formoredetailsonestimationmethods.

COMPANION PAPER TO THE GLOBAL TAX EXPENDITURES DATABASE
15
base (e.g. “Impôt des sociétés” = Corporate Income Tax) is contained in the table title.18 Other useful information – budgetary category, or simply more information on the TE – is contained in the subtitle (e.g. “Recherche et Developpement” = Research and Development). More useful information is also contained in the subcategories. The GTED data analysts extract useful information from any part of the TE report, however, they never try to guess or infer the classification for a particular category. So, if the information about a certain category for a provision is not explicitly stated somewhere in the report, the category is classified as “Not stated/unclear.”
As already mentioned, the GTED records the most recent revenue forgone estimates for each year for a specific provision. The same rule applies to qualitative data. The qualitative classifications are also based on the latest report in which a specific provision appears. Any differences in the classification across years are noted in the appropriate notes sections or in the “Implementation and Modifications” field.
Other rules GTED data analysts follow when collecting data are:• A note should be added any time a category is
classified as “Other” or “Multiple”.• Notes should also be added any time they make the
interpretation of the data easier.• The most disaggregated piece of information should
always be collected.
2.4 Quality assurance
2.4.1 Process for quantitative dataThe first step in ensuring the quality of the quantitative data is to check whether the yearly totals of revenue forgone in the TE report, when available, match the yearly totals in the GTED Template. The reviewer compares those totals for all years and notes any differences. Since TE totals are not always reported and to ensure that no mistakes were made at the provision level, in the second step of the quality assurance process, the reviewer randomly selects at least 25 per cent of the reported provisions and compares their reported figures to the data included in the GTED.
For countries that report few provisions, this is done for a larger share of the total number of provisions reported. For example, if a country only reports 30 to 50 provisions, the reviewer checks all of the quantitative data for potential mistakes. However, if a country reports 400 provisions, the reviewer checks at least 25 per cent of provisions.
If the reviewer finds any errors in the yearly totals (during the first review step), the data analyst originally working on the data is asked to review and correct all the provisions for those specific years. If the reviewer finds any errors at the provision level (during the second review step), the data analyst is asked to correct those errors and review the remainder of the data for similar mistakes. Once the data analyst sends the data back to the reviewer, another random 10 per cent of the provisions are reviewed to ensure that no other issues remain in the data. This process is repeated until no more errors are found.
2.4.2 Process for qualitative dataThe quality assurance process for qualitative data is similar, but based on a checklist of common mistakes. This includes checking:
1. Whether all mandatory fields have data. The applicable fields for this step are: TE original name, TE name in English, Country Code, Region, Tax Base, TE Type, Beneficiary - Level 1, Time Frame, Estimation Method, Policy Objective - Level 1, Legal Reference, and Unit/Currency.
2. Whether the non-mandatory fields (those not listed above) are consistently recorded. For example, if 90 out of 100 provisions have a TE description, but 10 do not, the reviewer checks if the description for those 10 provisions can be found in the available reports.
3. Whether there is an associated note for every record for which „Multiple“ or “Other” was selected in any of the categories.
4. Whether the original wording of available policy objectives was included in the notes section. This is important so that the reviewer can cross-check the categorisation of the data during the next step of the qualitative assurance process.
18 TheBelgianreporttowhichthissectionreferscanbefoundhere:https://finances.belgium.be/fr/statistiques_et_analyses/chiffres/inventaire_depenses_fiscales_federales, accessed 11.06.2021.

COMPANION PAPER TO THE GLOBAL TAX EXPENDITURES DATABASE
16
There are cases in which the name or description of a provision changes from one year to the other. The data analyst reports these cases when submitting the data for review. The reviewer also checks if there are any provisions that may have changed their name from one year to the other, but had been recorded as two different provisions by the data analyst. The reviewer checks for any pair of records in the GTED template that meet the following four conditions: i) the two records have similar names and other qualitative information, ii) there are no years for which both entries have revenue forgone estimates, iii) the revenue forgone estimates for one record stop at the same year in which they begin for the other record, and iv) the magnitude of revenue forgone is similar for both records. If all four conditions are met, the reviewer and the data manager review all available information and decide whether to merge the two records or report them separately on a case-by-case basis.
5. Whether there is an associated entry in the Duration column for every record which has an option other than “Permanent” selected in the Time Frame column.
6. Whether all the notes are recorded in the correct column (for example, notes about the beneficiary type should not be recorded in the tax base notes section).
Similarly, as for the quantitative data, the reviewer then proceeds to check the quality of the inputted data by randomly selecting at least 25 per cent of the provisions reported in the data template. In cases in which the categorisation is explicitly stated in the report (e.g. the report explicitly states that the tax base is VAT for a specific provision), the reviewer checks whether the categorisations of the GTED Template match the reported categorisations. In all other cases, the reviewer consults the Data Manual to check whether the categorisations chosen by the data analyst in the template follow the definitions of the manual. If the reviewer and the data analyst disagree on how to categorise a provision, or if they are both unsure about the correct categorisation, the data manager takes the final decision.

COMPANION PAPER TO THE GLOBAL TAX EXPENDITURES DATABASE
17
The GTED is not only about cross-country comparability. It is structured as a panel, hence allowing to assess changes within countries over time as well. Yet, cross-country comparability is indeed a key feature and, at the same, one of the more challenging methodological aspects of the project.
3.1 Within-country comparabilityTE reporting is a time- and resource-intensive exercise that usually evolves over time. In general, TE reports improve over time, e.g. by including more and better information. In some cases, there can be changes in the methodology used by governments to estimate the revenue forgone or even in the definition of specific benchmarks. When these differences are substantial, the comparability of the data over time can be affected. As mentioned before, the spirit of the GTED is to respect as much as possible what governments report. Hence, while we seek to understand and discuss such changes as explicitly and transparently as possible, we do not complement or correct the official data published by governments.
For instance, in 2016 the Netherlands started reporting revenue forgone estimates for tax incentive programs “other than tax expenditures”. The 2016 report explicitly differentiates between what is a TE and what is classified as “other type of tax incentives”. However, no such distinction is made in the subsequent reports, where revenue forgone estimates are reported jointly both for TEs and “other type of tax incentives”. This was due to a change in the underlying rationale, according to which it is not the exact definition of a specific TE that matters, but rather whether such provision has significant meaning because of policy relevance or budgetary impact. Since 2017, these latter two conditions are the criterium defining whether a given TE provision is reported or not. Accordingly, TE reports from 2017 and onwards exclude those
provisions with a fiscal cost below EUR 5 million and provisions that follow from European legislation (and are thus mandatory). This explains why the number of provisions is lower in 2017 compared to 2016, but the revenue forgone remains comparable. On the other hand, the significant spike in the TE/GDP ratio (jumping from roughly 3 per cent 2013 to roughly 13 per cent in 2014) is mainly explained by the inclusion of (general) tax credits in the newer reports which presented updated data for 2014 and onwards, but not for 2013 and earlier. In this concrete case, we input the data as reported by the Netherlands’ government, without making any specific adjustment.19
3.2 Cross-country comparabilityWhile the GTED allows for cross-country comparisons, and while we believe that such cross-country comparisons provide valuable insights, two methodological aspects - different benchmarks, and different estimation methods - need to be borne in mind when comparing data across countries. The lack of reliable data of TEs implemented by lower tiers of government is another case in point.
3.2.1 BenchmarkingBenchmarking is probably the most important challenge for any initiative seeking to compare TEs across countries, including the GTED. As mentioned before, TEs are defined as departures from the – usually country-specific – standard tax structure or benchmark. Hence, differences in national benchmarks lead to certain tax provisions being considered as TEs in one country, and not in another one. This is an inherent issue triggered by the definition of TEs and the differences in benchmark systems across countries. Carbon taxation is a case in point. When a carbon price scheme is implemented, governments often grant TEs (e.g. reduced rates or exemptions) for energy-intensive
3 DATA COMPARABILITY
19 The2016TEreportexplainingthemethodologychangeandthe2018TEReportprovidingupdateddatafortheyears2014onwardsfortheNetherlandscanbefoundathttps://zoek.officielebekendmakingen.nl/kst-34550-2.html and https://zoek.officielebekendmakingen.nl/kst-35000-2,bothaccessed10.06.2021
COMPANION PAPER TO THE GLOBAL TAX EXPENDITURES DATABASE
18
3.2.2 Different estimation methods and aggregation of revenue forgone estimatesThe cost of TEs can be estimated using different approaches. The three main methodologies to measure TEs are the following ones:
• Revenue forgone approach: estimates the amount by which taxpayers have their tax liabilities reduced as a result of a TE based on their actual current economic behaviour.
• Revenue gain approach: estimates the additional revenue that would be collected if a TE was removed, accounting for behavioural changes resulting from this removal.
• Outlay equivalent approach: estimates the government cash outlay required for an alternative direct spending program replacing the TE that would have the same benefit for the taxpayers. As the revenue forgone method, it assumes no behavioural change.
Each of these approaches has its pros and cons and provides different estimates of the size of a TE. Yet, and probably because of its relative simplicity, the vast majority of countries report on TEs based on the revenue forgone approach. Hence, all revenue forgone estimates gathered by the GTED are based on this method.21
Since the revenue forgone methodology is static and does not take potential behavioural responses into account, the cost estimates and projections may exceed the revenue gains that would result if a particular provision was eliminated. In other words, the removal of a specific TE provision could trigger behaviour adjustments by some taxpayers in order to minimise their tax liabilities, which are not captured by this estimation method. Likewise, the revenue forgone method does not take into account the potential impact of a particular TE (or its elimination) on the overall level of economic activity, and thus on aggregate tax revenues. As discussed in the Canadian
and trade-exposed sectors to avoid the increased price on carbon putting their economies at a disadvantage compared to those countries where no pricing scheme is in place. In other words, TEs in the context of carbon taxation can only arise where a carbon tax is part of the benchmark tax system.
As a rule, we input the data published by official governmental institutions, sticking to their own definitions of benchmarks, without trying to complement official figures or challenge what different countries consider as their standard tax system or benchmark. For instance, Canada, which is one of the best performers when it comes to TE reporting, provides revenue forgone estimates for TEs and also for provisions classified as a “Tax measure other than tax expenditure”.20 The latter are classified as “structural measures” and an explanation is often provided, e.g. “This measure is considered part of the benchmark tax system, and therefore is not a tax expenditure”. In this concrete example, we input the revenue forgone estimates only for those provisions classified as TEs, without challenging the country’s criteria for such classification.
Another issue triggered by benchmarking regards the fact that TE estimates could vary either because of changes in the magnitude of concessions relative to the benchmark tax treatment, or because of a variation in the benchmark itself. Again, as long as this is not explicitly discussed in TE reports (in which cases, a note is added for the convenience of users), the GTED does not provide information regarding such changes.
20 See,forinstance,theentryfor“Non-capitallosscarry-overs”:https://www.canada.ca/en/department-finance/services/publications/federal-tax-expenditures/2020/part-6.html#Non-capital-loss-carry-overs, accessed 10.06.2021.
21 Formoredetails,seeRedonda(2016).
COMPANION PAPER TO THE GLOBAL TAX EXPENDITURES DATABASE
19
TE report referenced before, “… eliminating a particular tax expenditure may affect the level of consumption or economic activity, which in turn could cause a further change in the amount of tax revenue collected. Eliminating a tax expenditure would also mean that the government would have more funds available to increase spending, reduce taxes or pay down debt—actions that could have additional dynamic effects on the economy and on tax revenues.”
Hence, adding up all the individual costs computed separately and without taking behavioural changes into account would not result in a figure that represents the total cost of all TEs. The Australian Treasury highlights that “it is not appropriate to aggregate revenue forgone estimates. As indicated above, revenue forgone estimates do not take account of potential changes in taxpayer behaviour following the (hypothetical) removal of a tax expenditure. However, in reality such changes in behaviour would be likely to occur – in particular, the removal of one tax expenditure would often affect the utilisation of other tax expenditures. Aggregating revenue forgone estimates therefore risks significantly amplifying the limitations inherent in this method of estimating the size of tax expenditures.”22 As acknowledged by Myles et al. (2014), many countries sum their TEs, despite recognising the limitations of doing so, e.g. to provide an order of magnitude of their total fiscal costs.23 The South African TE Statement, for instance, includes a section where the trends in TE for the latest available years are discussed, showing the share of total TE by tax base.24
It is worth mentioning that some countries do provide figures based on the other two methods, but only as a complement to the measurement based on revenue forgone. For example, the Australian Treasury provides estimates of a selected group of TEs based on the
revenue gain approach, in addition to the standard estimates based on the revenue forgone method.25 In these cases, and for the sake of completeness, revenue gain estimates are collected, but they are not considered for the calculation of the different indicators and charts produced on the website.
3.2.3 Tax expenditures implemented by lower tiers of governmentIn some countries subnational governments are required by law to publish TE figures, similar to those provisions implemented at the national level. Yet, even in those cases, actual TE reporting is often strikingly poor. In Canada, for example, the estimates presented in the official report relate to federal revenues only, even if the potential impact of the Federal-Provincial interaction is explicitly acknowledged in the report: “The federal and provincial tax and benefit systems interact with each other to varying degrees, and as a result changes to tax expenditures in the federal system may have consequences for provincial revenues. Any such provincial revenue effects are not taken into account in this publication. Information on provincial tax expenditures can be obtained by consulting the tax expenditure reports that are produced by certain provinces”.26 Now, some countries report the budget impact of TEs disaggregated by level of government. For instance, Germany breaks down (in per cent) the fiscal cost for the federation, states and municipalities. Austria splits the cost between the federal government and the rest. In these cases, as long as the TE provision is implemented by the national government, we include the total fiscal cost, no matter the tier of government bearing it.
22 SeetheAustralianTaxExpenditureReport(p.6)https://treasury.gov.au/publication/tax-expenditures-statement-2015, accessed 10.06.2021.
23 See,forinstance,Astaritaetal.(2014)andTyson(2014).24 TheSouthAfricanTEStatementcanbefoundat:http://www.treasury.gov.za/documents/national%20budget/2018/review/
Annexure%20B.pdf, accessed 10.06.2021.25 See,forinstance,the2017AustralianTEStatement:https://treasury.gov.au/publication/2017-tax-expenditures-statement,
accessed 10.06.2021.26 SeetheCanadianReportonFederalTaxExpenditures:https://www.canada.ca/en/department-finance/services/
publications/federal-tax-expenditures/2020.html, accessed 10.06.2021.

COMPANION PAPER TO THE GLOBAL TAX EXPENDITURES DATABASE
20
To sum up, even if comparing overall TE estimates alone can indeed be misleading, the GTED provides a significant amount of metadata allowing users to put figures in context. For instance, classifying TEs by tax base or policy objective provides users with the possibility to address comparability issues, and could be particularly informative in certain contexts.
The estimation of the VAT Policy Gap across EU member states is a case in point. The VAT Policy Gap is the component of the VAT Gap that captures the effects of applying multiple rates and exemptions on the theoretical revenue that could be levied in a given VAT system (Poniatowski et al., 2020). Whereas VAT-related TEs are, up to a certain extent, regulated at the supranational level, each member state has different standard VAT rates (i.e. the benchmark), which vary from 17 per cent in Luxembourg to 27 per cent in Hungary. Poniatowski et al. (2020) compute the VAT Policy Gap for each EU member state as well as the regional average. For the EU overall, the average Policy Gap was 44.24 per cent in 2018, 10.07 percentage points being explained by the application of reduced and super-reduced rates, and 34.17 percentage points by the application of exemptions without the right to deduct.
Finally, presenting all existing TE data in a consistent way opens the door to different TE analyses. The GTED Flagship Report provides examples of how the GTED is used as a crucial source of information to shed light on specific topics, such as for instance patent boxes and domestic revenue mobilisation (von Haldenwang et al., 2021).

COMPANION PAPER TO THE GLOBAL TAX EXPENDITURES DATABASE
21
This section provides an overview of the GTED website (www.GTED.net), its content, and its analytical tools. It is intended to help users navigate through the website and utilise its potential in full.
4.1 Home pageWhen visiting www.GTED.net, users land on the portion of the Home Page depicted in Figure 4.1. There, they find a permanent navigation bar on top of the page, basic background information about the project as well as some main facts regarding the GTED coverage: the number of countries reporting TE data and the number of non-reporting countries, the total number of TE provisions in the database, the cumulative number of years of TE data reported by all countries, as well as the number of years for which the GTED collects data.27
Scrolling down, users will see a world map, highlighting the revenue forgone as a percentage of GDP for the latest available year for each reporting country (Figure 4.2).
In the lower-left section of the map, users may choose to change the view of the map and show other indicators: revenue forgone as a percentage of tax revenue collected, number of provisions, share of provisions with revenue forgone estimates (all for the latest available year), or the number of years since 1990 for which each country reports TE data.
By hovering over any reporting country in the map, the user will be able to see information such as the name of the country, the name of the indicator visualised in the map, the latest available year of data for that country, and the value associated with that country for
27 TheGTEDisanongoingproject,hencethereportingfiguresdepictedinthescreenshotinFigure4.1orinanyoftheremainingscreenshotsinthispapershouldbetakenasareferenceonly.Theywillbeupdatedonanregularbasis.
4 USING THE GLOBAL TAX EXPENDITURES DATABASE WEBSITE. A PRACTICAL GUIDE
Figure 4.1 GTED landing page

COMPANION PAPER TO THE GLOBAL TAX EXPENDITURES DATABASE
22
the chosen indicator. Scrolling further down the Home Page, users will be presented with short descriptions of the type of data and type of analytics the website provides, as well as news articles and publications about the GTED.
4.2 Country profilesUsing the navigation bar on top of the page, users will be able to visit the Country Profiles section of the GTED website by clicking on “Countries”. There, users will be presented with an overview of each country’s TE reporting. They can select the country for which they would like to display the data by using the dropdown menu at the top of the page (Figure 4.3, Highlight 1).
Right below the country name, users will see background information about the selected country, such as its currency, the region and the country income group to which it belongs (based on World Bank classifications), and membership with the EU, the OECD, or the G20, if applicable. On the left side, users can see a map of the country and background information regarding its TE reporting such as the first year the country provides data for (starting with 1990), the number of years for which it provides data, the type of data it provides (based on the classifications
described in Section 2.4.2.5), and the regularity of its reporting (based on the classifications described in Section 2.4.2.7).
Next to the country map, on the right, the Country Profile page presents some of the main TE statistics for the four latest years for which the country reports data, starting with the most recent year of available data. The information covered here is the number of reported provisions, number of provisions with revenue forgone estimates, the total revenue forgone for that country in LCU as well as USD, and information on the total revenue forgone both as shares of GDP and tax revenue. The user can change the year for which these statistics are displayed by clicking on any of the other years, as shown in Highlight 2 of Figure 4.3. Also in this section of the Country Profile page, users can download the full dataset for the country by clicking on the “Download Country Data” button on the upper right corner (Figure 4.3, Highlight 3).
The second portion of the Country Profiles page (below the map) allows users to visualise and analyse the country’s TE data. The users can select the category by which they want to analyse the country’s data (tax base, beneficiaries, policy objective, or TE types); they can choose how they would like to visualise data (either
Figure 4.2 GTED Home Page Map

COMPANION PAPER TO THE GLOBAL TAX EXPENDITURES DATABASE
23
as revenue forgone in percentage of GDP, revenue forgone in percentage of tax revenue, revenue forgone in local currency, the number of provisions with data, or as the number of beneficiaries); and they can select the period of time (between 1990 and the present year) for which they wish to visualise the data (Figure 4.3, Highlight 4). By clicking on the “Apply” button at the bottom left corner of the page, the selection will be applied to the adjacent chart.
Users can choose to display data by higher level categories (the four categories mentioned above) or drill down deeper into the data. For example, if users click on the “Tax Base” option and choose to visualise data as revenue forgone in per cent of GDP, the Country Profiles chart will break down the TE data by the three main tax base categories – taxes on income, taxes on goods and services, taxes on property – and display the total revenue forgone in per cent of GDP attributed
Figure 4.3 GTED country profile

COMPANION PAPER TO THE GLOBAL TAX EXPENDITURES DATABASE
24
4.3 Data visualisationThe two Data pages, Data Visualisation and Data Download, can be accessed from any part of the GTED website by clicking on the “Data” button of the navigation bar and choosing either option (Figure 4.5).
The Data Visualisation page allows users to run cross-country comparisons on over fifty indicators. The indicators are organised in two groups: 1. Indicators about TE and 2. Indicators about TE reporting. The former group contains basic indicators such as the total revenue forgone as a percentage of GDP, as a percentage of tax revenue, or in USD, but also more advanced indicators based on the four GTED categories (tax base, beneficiaries, policy objectives, and TE types) (Figure 4.6, Highlight 1).
The TE reporting indicator group contains indicators such as the yearly number of provisions with estimates or the percentage of provisions reported in a year that have revenue forgone estimates (Figure 4.6, Highlight 2).
The “Share of Total Tax Expenditure” subsection allows users to compare countries on indicators built by any subcategory of the four GTED categories. For example, users can choose to compare countries on the share of total TE attributed to TE provisions with the policy objective “Attract/Promote investment.” In addition, users can drill down further and compare the share of total TE attributed to the policy “Attract FDI”, which is a subcategory of the “Attract/Promote investment” policy objective (Figure 4.7). Similarly to the chart options in the Country Profile page, any
to each of these categories. Tax base data classified as “Multiple”, “Other”, or “Not stated/unclear” will appear on the chart as well.
However, users can zoom in further into the data by choosing, for example, to break down the country’s TE portion attributed to taxes on goods and services by the type of taxes on goods and services (Figure 4.4, left side). The resulting graph will display a line depicting the yearly total revenue forgone as percentage of GDP for each type of taxes on goods and services present in the country’s data (VAT, excise taxes, customs duties, etc.). If such data is available, users can also choose to display data by type of VAT (internal vs. customs VAT) or the type of excise taxes (alcohol taxes, tobacco taxes, fuel taxes, etc.) (Figure 4.4, right side).
Users will know the categories with data to be displayed by following the arrows and the selection icons in the Category section. For example, after clicking on the arrow related to tax bases, the options menu that appears to the right displays 6 entries, only 3 of which have a selection icon (Figure 4.6, left side). The selection icon indicates that the listed category has subcategories by which TE data can be broken down. “Multiple”, “Other”, or “Not stated/unclear” do not have any subcategories and no selection icon. Similarly, some subcategories of taxes on goods and services have their own subcategories (VAT and excise) while others do not (customs duties, stamp duties, etc.). Only those tax bases that have subcategories have a selection icon and have a downward pointing arrow which can be clicked to open the list of subcategories.
Figure 4.4 Data visualisation drilldown

COMPANION PAPER TO THE GLOBAL TAX EXPENDITURES DATABASE
25
options that have their own subcategories are marked with a downward-pointing arrow, which, when clicked, reveals those subcategories.
After selecting an indicator, users can choose the countries or country groupings they wish to compare using that indicator in the “Additional Options” section
of the Data Visualisation page. Users can compare countries to each other; compare countries to their respective regional or country income group averages or the averages of other country groupings; or compare the averages of different country groupings for the selected indicator (Figure 4.7). All ratio-based averages (share of GDP, tax revenue, total TEs) are unweighted,
Figure 4.5 GTED navigation bar displaying data pages
Figure 4.6 GTED Data Visualisation Page

COMPANION PAPER TO THE GLOBAL TAX EXPENDITURES DATABASE
26
2). By clicking on the same legend item again, the associated line appears again on the chart. The same functionality is also available in the Country Profile charts.
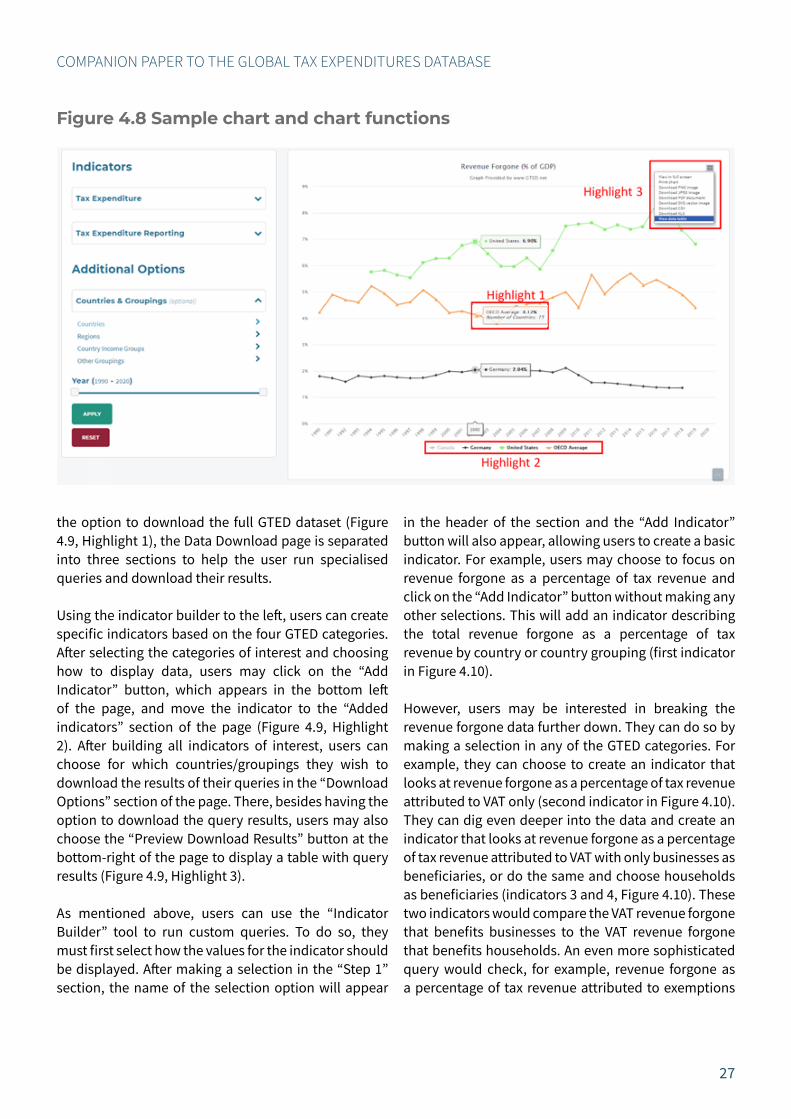
Clicking on the options icon (displayed as three horizontal lines) at the top-right corner of the chart, presents the user with the choice to view the chart in full screen, print the chart, download the chart in six different formats, and display the data visualised in the chart in table format (Figure 4.8, Highlight 3). If the last option is selected, a data table will appear below the chart. The table can be removed by selecting the same option again. Similar chart options are also available in the Country Profile chart and on the Home Page world map.
Users can download the full GTED dataset by clicking on the “Download Full Dataset” button in the upper-right corner of the Data Visualisation page (Figure 4.6, Highlight 3). However, more data download options are available in the Data Download page described in the next section.
4.4 Data downloadSimilarly to Data Visualisation, the Data Download page can also be accessed from any page in the GTED Website by clicking on the option Data and then Download of the GTED Navigation Bar. Besides offering
meaning that the same weight is given to each country that is part of the group, independently of the size of their economy or tax revenue.
In the “Additional Options” section, users can also choose the period of time for which they wish to compare the data by adjusting the two markers in the “Year” ribbon. After selecting an indicator, the countries/groupings they wish to compare, and the period of interest, users click on the “Apply” button at the bottom left corner of the page to generate a chart with their selection. If they wish to reset all the selections, users can click on the “Reset” button which is also located at the bottom left corner of the page.
Once a selection has been made, the resulting chart displays a timeline for each country/grouping selected using values from the selected indicator. For example, Figure 4.8 shows a chart comparing the trend of total revenue forgone as a percentage of GDP of Germany and the US to the OECD average. Hovering over any data point in the chart allows the viewer to see the associated value with that data point for that year for all the lines in the chart. For the averages of different country groupings, the number of countries includeed in the average for that year is also displayed (Figure 4.8, Highlight 1).
Clicking on any of the legend items at the bottom of the chart removes the associated line from the chart and colours the respective item grey (Figure 4.8, Highlight
Figure 4.7 GTED Data Visualisation Page
COMPANION PAPER TO THE GLOBAL TAX EXPENDITURES DATABASE
27
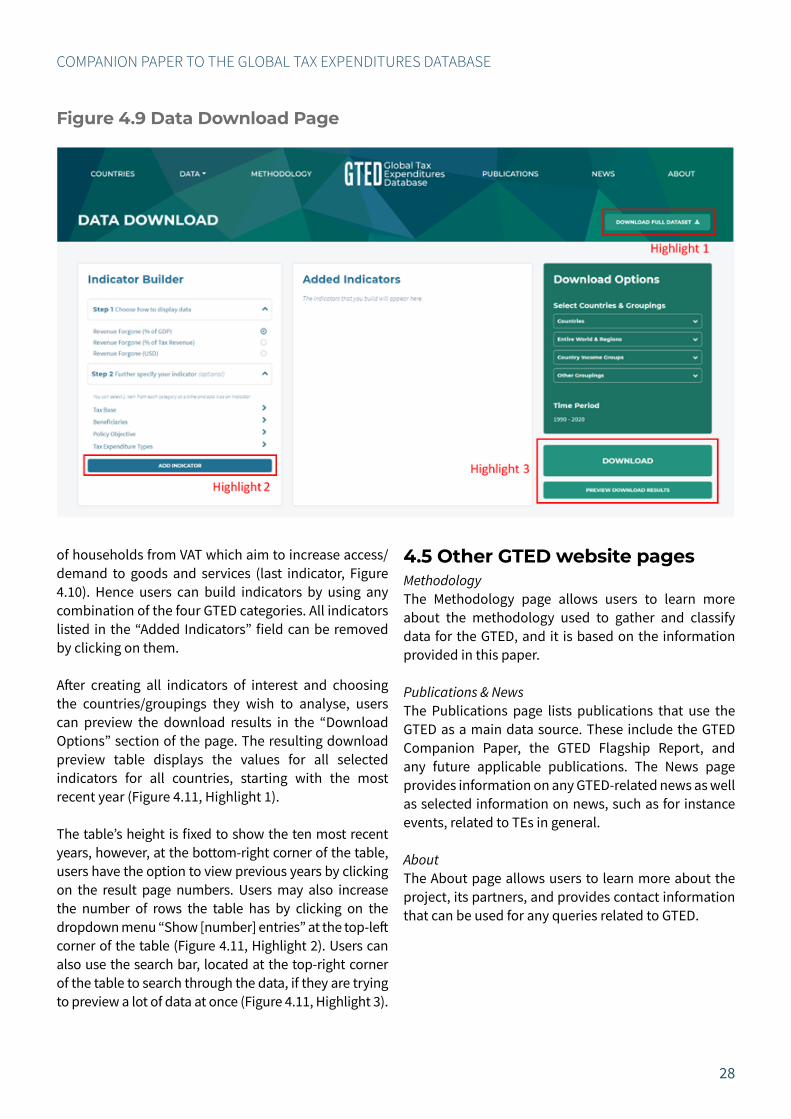
the option to download the full GTED dataset (Figure 4.9, Highlight 1), the Data Download page is separated into three sections to help the user run specialised queries and download their results.
Using the indicator builder to the left, users can create specific indicators based on the four GTED categories. After selecting the categories of interest and choosing how to display data, users may click on the “Add Indicator” button, which appears in the bottom left of the page, and move the indicator to the “Added indicators” section of the page (Figure 4.9, Highlight 2). After building all indicators of interest, users can choose for which countries/groupings they wish to download the results of their queries in the “Download Options” section of the page. There, besides having the option to download the query results, users may also choose the “Preview Download Results” button at the bottom-right of the page to display a table with query results (Figure 4.9, Highlight 3).
As mentioned above, users can use the “Indicator Builder” tool to run custom queries. To do so, they must first select how the values for the indicator should be displayed. After making a selection in the “Step 1” section, the name of the selection option will appear
in the header of the section and the “Add Indicator” button will also appear, allowing users to create a basic indicator. For example, users may choose to focus on revenue forgone as a percentage of tax revenue and click on the “Add Indicator” button without making any other selections. This will add an indicator describing the total revenue forgone as a percentage of tax revenue by country or country grouping (first indicator in Figure 4.10).
However, users may be interested in breaking the revenue forgone data further down. They can do so by making a selection in any of the GTED categories. For example, they can choose to create an indicator that looks at revenue forgone as a percentage of tax revenue attributed to VAT only (second indicator in Figure 4.10). They can dig even deeper into the data and create an indicator that looks at revenue forgone as a percentage of tax revenue attributed to VAT with only businesses as beneficiaries, or do the same and choose households as beneficiaries (indicators 3 and 4, Figure 4.10). These two indicators would compare the VAT revenue forgone that benefits businesses to the VAT revenue forgone that benefits households. An even more sophisticated query would check, for example, revenue forgone as a percentage of tax revenue attributed to exemptions
Figure 4.8 Sample chart and chart functions
COMPANION PAPER TO THE GLOBAL TAX EXPENDITURES DATABASE
28
4.5 Other GTED website pagesMethodologyThe Methodology page allows users to learn more about the methodology used to gather and classify data for the GTED, and it is based on the information provided in this paper.
Publications & NewsThe Publications page lists publications that use the GTED as a main data source. These include the GTED Companion Paper, the GTED Flagship Report, and any future applicable publications. The News page provides information on any GTED-related news as well as selected information on news, such as for instance events, related to TEs in general.
AboutThe About page allows users to learn more about the project, its partners, and provides contact information that can be used for any queries related to GTED.
of households from VAT which aim to increase access/demand to goods and services (last indicator, Figure 4.10). Hence users can build indicators by using any combination of the four GTED categories. All indicators listed in the “Added Indicators” field can be removed by clicking on them.
After creating all indicators of interest and choosing the countries/groupings they wish to analyse, users can preview the download results in the “Download Options” section of the page. The resulting download preview table displays the values for all selected indicators for all countries, starting with the most recent year (Figure 4.11, Highlight 1).
The table’s height is fixed to show the ten most recent years, however, at the bottom-right corner of the table, users have the option to view previous years by clicking on the result page numbers. Users may also increase the number of rows the table has by clicking on the dropdown menu “Show [number] entries” at the top-left corner of the table (Figure 4.11, Highlight 2). Users can also use the search bar, located at the top-right corner of the table to search through the data, if they are trying to preview a lot of data at once (Figure 4.11, Highlight 3).
Figure 4.9 Data Download Page

COMPANION PAPER TO THE GLOBAL TAX EXPENDITURES DATABASE
29
Figure 4.10 Building and adding indicators
Figure 4.11 Download preview table
COMPANION PAPER TO THE GLOBAL TAX EXPENDITURES DATABASE
30
Astarita, C., Bauger, L., Fatica, S., Kalyva, A., Mourre, G., & Wöhlbier, F. (2014). Tax expenditures in direct taxation in EU Member States. Brussels: European Commission. https://ec.europa.eu/economy_finance/publications/occasional_paper/2014/pdf/ocp207_en.pdf
Ebrahim, A., & Bridgman, G. (2021). Using tax data to inform economic policy in South Africa. WIDERAngle. https://www.wider.unu.edu/publication/using-tax-data-inform-economic-policy-south-africa
European Union. (2011). Council Directive 2011/85/ EU of 8 November 2011 on requirements for budgetary frameworks of the Member States. Brussels: EU. http://data.europa.eu/eli/dir/2011/85/oj
Federal Tax Administration. (2019). The Swiss Tax System. 2019 Edition. https://www.estv.admin.ch/dam/estv/en/dokumente/allgemein/Dokumentation/Publikationen/schweizer_steuersystem/ch-steuersystem.pdf.download.pdf/CH-Steuersystem_2019_e.pdf
HMRC. (2017a). Tax Reliefs in Force in 2016-17 or 2017-18: Estimates of Cost Unavailable, Her Majesty‘s Revenue and Customs (HMRC), https://assets.publishing.service.gov.uk/government/uploads/system/uploads/attachment_data/file/675231/Dec_17_allow_rels_estimates_unavailable_Final.pdf
International Budget Partnership. (2016). Guide to Open Budget Questionnaire: An Explanation of the Questions and the Response Options. https://www.internationalbudget.org/wp-content/uploads/open-budget-survey-2017-guide-and-questionnaire-english.pdf
International Monetary Fund. (2018). Fiscal Transparency Handbook. Washington DC: IMF. https://doi.org/10.5089/9781484331859.069
REFERENCES
Kassim, L., & Mansour, M. (2018). Les rapports sur les dépenses fiscales des pays en développement: Une évaluation. Revue d’economie du developpement, Vol. 26(2), 113–167. https://www.cairn.info/revue-d-economie-du-developpement-2018-2-page-113.html
Myles, G., Hashimzade, N., Heady, C., Oats, L., Scharf, K., & Yousefi, H. (2014). The definition, measurement, and evaluation of tax expenditures and tax reliefs. London: Tax Administration Research Centre, National Audit Office. https://www.nao.org.uk/wp-content/uploads/2014/03/TARC-Tax-Expenditures-and-tax-reliefs-technical-paper.pdf
OECD (2020). Taxation and Philanthropy, OECD Tax Policy Studies, No. 27, OECD Publishing, Paris, https://doi.org/10.1787/df434a77-en
Poniatowski, G., Bonch-Osmolovskiy, M., Śmietanka, A., & Zavatta, R. (2020). Study and reports on the VAT gap in the EU-28 Member States: 2020 final report. Brussels: European Commission. https://data.europa.eu/doi/10.2778/2517
Redonda, A. (2016). Tax Expenditures and Sustainability. An Overview. Zurich: Council on Economic Policies. https://www.cepweb.org/wp-content/uploads/CEP-DN-Tax-Expenditures-and-Sustainability.-An-Overview.pdf
Redonda, A., & Neubig, T. (2018). Assessing Tax Expenditure Reporting in G20 and OECD Economies. Zurich: Council on Economic Policies. https://www.cepweb.org/wp-content/uploads/2018/11/Redonda-and-Neubig-2018.-Assessing-Tax-Expenditure-Reporting.pdf
Surrey, S., & McDaniel, P. R. (1976). The Tax Expenditure Concept and the Budget Reform Act of 1974. Boston College Law Review, 17(5), 679–737. https://lawdigitalcommons.bc.edu/cgi/viewcontent.cgi?article=1529&context=bclr
> Table of contents

COMPANION PAPER TO THE GLOBAL TAX EXPENDITURES DATABASE
31
Tyson, J. (2014). Reforming Tax Expenditures in Italy: What, Why, and How? IMF Working Papers, 14(6), 1. Washington DC: IMF. https://www.imf.org/external/pubs/ft/wp/2014/wp1407.pdf
UNU-WIDER. (2020). Government Revenue Dataset. https://www.wider.unu.edu/project/government-revenue-dataset
von Haldenwang, C., Redonda, A., & Aliu, F. (2021). Shedding Light on Worldwide Tax Expenditures. GTED Flagship Report 2021. https://gted.net/2021/05/shedding-light-on-worldwide-tax-expenditures

COMPANION PAPER TO THE GLOBAL TAX EXPENDITURES DATABASE
32
Table A.1 Tax base categories
Level 1 Level 2 Level 3
Taxes on Income
Corporate Income Tax (CIT)Personal Income Tax (PIT)Capital Gains TaxPayroll TaxOther Income TaxesMultiple Income Taxes
Taxes on Goods and Services
Sales TaxValue-Added Tax (VAT) Internal VAT
Customs / Import VATExcise Taxes Alcohol Tax
Fuel TaxTobacco TaxOther Excise TaxesMultiple Excise Taxes
Customs DutiesStamp DutiesFees and User ChargesFinancial Transaction TaxCarbon TaxOther Pollution TaxesOther Taxes on Goods and ServicesMultiple Taxes on Goods and Services
Taxes on Property
Real Estate Tax
Land Value Tax
Estate Tax
Vehicle Tax
Other Property Taxes
Multiple Property Taxes
OtherMultiple
Not stated/unclear
ANNEX
> Table of contents

COMPANION PAPER TO THE GLOBAL TAX EXPENDITURES DATABASE
33
Table A.2 Tax expenditure type categories
Tax Expenditure TypeDeductionDeferralExemptionReduced RateTax Credits, Rebates and RefundsZero-ratedOtherMultipleNot stated/unclear
Table A.3 Beneficiary categories
BeneficiaryBusinessesChurches/Religious OrganizationsHouseholdsInternational/Regional/Multilateral OrganizationsNon-profit Organizations/NGOs/Philantrophic Organizations/FoundationsPublic SectorOtherMultipleNot stated/unclear
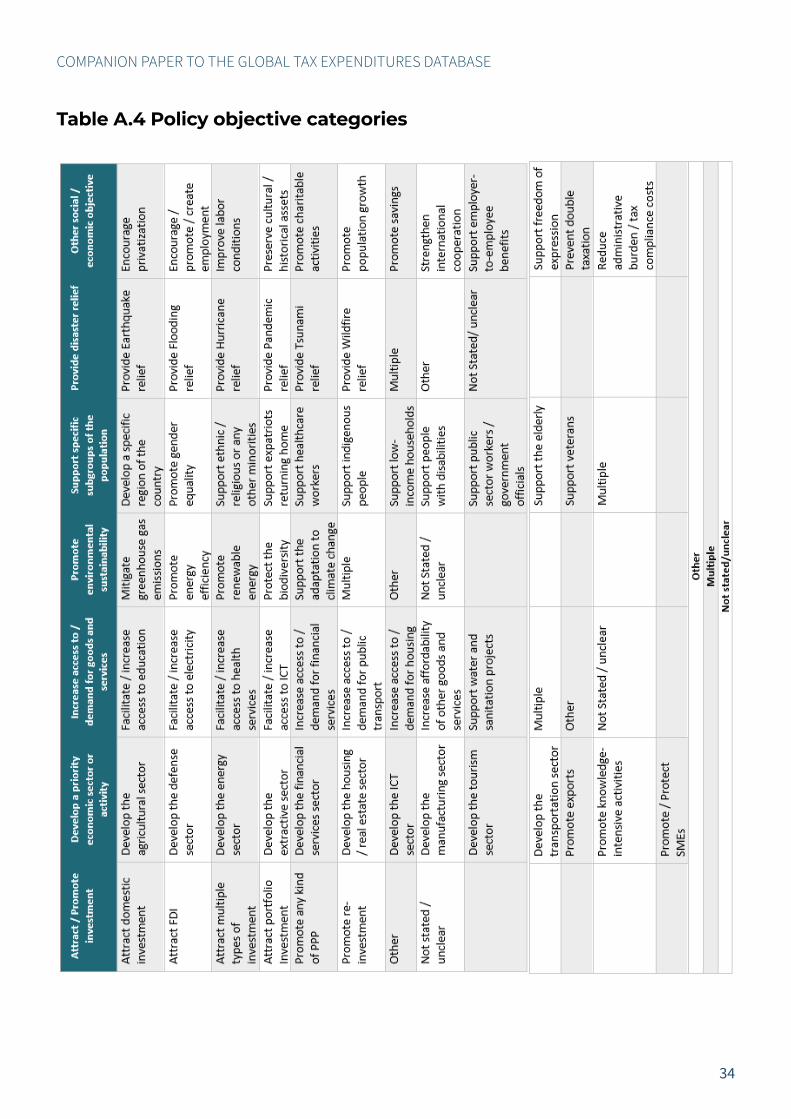
COMPANION PAPER TO THE GLOBAL TAX EXPENDITURES DATABASE
34
Table A.4 Policy objective categories

COMPANION PAPER TO THE GLOBAL TAX EXPENDITURES DATABASE
35
Table A.4 Policy objective categories

www.GTED.net


