116

THE GOODYEAR TIRE & RUBBER COMPANY
1144 East Market StreetAkron, Ohio 44316-0001www.goodyear.com
©2012 The Goodyear Tire & Rubber Company
Goodyear is one of the world’s leading tire companies, with operations in most regions of the world. Together with its U.S. and international subsidiaries and joint ventures, Goodyeardevelops, manufactures, markets and distributes tires for mostapplications. It also manufactures and markets rubber-relatedchemicals for various applications. Goodyear is one of the world’s largest operators of commercial truck service and tireretreading centers. In addition, it operates approximately 1,400tire and auto service center outlets where it offers its products for retail sale and provides automotive repair and other services.Goodyear manufactures its products in 53 facilities in 22 countries. It has marketing operations in almost every country around the world.
ON THE COVER:
Even in a complex media and marketing environment, the world-famous Goodyear blimp stands apart as it carries the company’s brand to millions of people each year. Whether flyingcross-country or providing an aerial camera platform fromevents ranging to championship football games to space shuttlelaunches, the Goodyear blimp is synonymous with big events.Today, Goodyear operates three airships in the United States.Goodyear blimps have also flown in Europe, South America andChina. Beginning in 2013, Goodyear will begin upgrading itsU.S. fleet with innovative new airships that will be built at thecompany’s Wingfoot Lake Airship Hangar near Akron, Ohio.
This Annual Report contains a number of forward-looking statements. For more information, please see pages 33-34.
FINANCIAL OVERVIEW
* Total debt includes Notes payable and overdrafts, Long term debt and capital leases due within one year, and Long term debt and capital leases.
YEAR ENDED DEC. 31
(Dollars in millions, except per share) 2011 2010
Net Sales $ 22,767 $ 18,832Total Segment Operating Income 1,368 917Goodyear Net Income (Loss) 343 (216)
Less Preferred Stock Dividends 22 —Goodyear Net Income (Loss) available to Common Shareholders 321 (216)– Per diluted share 1.26 (0.89)
Total Assets $ 17,629 $ 15,630Total Debt* 5,201 4,745Goodyear Shareholders’ Equity 749 644Total Shareholders’ Equity 1,017 921Debt to Debt and Equity 83.6% 83.7%
Weighted Average Shares Outstanding – basic 244 242Weighted Average Shares Outstanding – diluted 271 242Number of Associates 73,000 72,000
Price range of common stock: – high $ 18.83 $ 16.39Price range of common stock: – low 8.53 9.10
CONTENTS2 To Our Shareholders5 Management’s Discussion and Analysis of Financial Condition
and Results of Operations33 Forward-Looking Information34 Quantitative and Qualitative Disclosures about Market Risk36 Consolidated Financial Statements43 Notes to Consolidated Financial Statements
100 Management’s Report on Internal Control Over Financial Reporting101 Report of Independent Registered Public Accounting Firm102 Supplementary Data (unaudited)105 Selected Financial Data107 General Information Regarding Our Segments108 Performance Graph109 Directors and Officers110 Facilities111 Shareholder Information
T H E G O O DY E A R T I R E & RU B B E R C O M PA N Y | 2 0 1 1 A N N UA L R E P O RT | 1
Record segment operating income reflected recordsales in all four of the company’s business units,despite economic softness;Annual sales were a record $22.8 billion, up 21% from $18.8 billion in 2010; Compared to the prior year, 2011 segment operatingincome benefitted from $2.4 billion in improvedprice/mix, which more than offset $2 billion in higher raw material costs;Over the past two years, we have generated cost savings of $748 million and remain on track to deliver $1 billion of savings for the three year periodending in 2012;And North American Tire continued on its path,delivering $276 million in segment operatingincome, its highest earnings since 2000.
I am very pleased with our 2011 results, but I am evenmore gratified that our performance is further validationof our Strategy Roadmap, the foundation of which isdefined by three Key Strategies:
Return North American Tire to profitability—Though the tire industry is cyclical, delivering a return of5% earnings-to-sales is our guidepost for the long term. In2011, we made a progress leap, with a level of earnings wehave not attained in more than a decade. In the future, theindustry will still experience cycles, but this target keeps usfocused on sustainable profitability in North America.
Win in China—We must capitalize on the enormousopportunity in this high-growth and high-volume region.Over the past year, we continued to see the Goodyearbrand grow at twice the pace of the industry in China. Our new factory in Pulandian, China will serve the strongand growing demand for high-value-added Goodyear tires in the region.
Continue our success in EMEA and Latin America—Historically, our brands have been very strong in theselocations, and that strength must continue. We continuedour brand and product leadership in the European market—winning awards and magazine tests throughoutthe year—and returned record earnings. While many of the regional economies in Latin America were beset byon-going instability, we continue to manage our businessfor the volatility and are investing for growth.
TO OUR SHAREHOLDERS,
2 | T H E G O O DY E A R T I R E & RU B B E R C O M PA N Y | 2 0 1 1 A N N UA L R E P O RT
s we reflect on 2011, we see a year that isunique in Goodyear’s history because ofour record results. But while our recordearnings were gratifying, the year wasdefined by the strategy we declared for
the future. We made it clear that our strategy is notdesigned to produce short-term success, but to put us ontrack to achieve a far greater objective: creating long-termeconomic value.
Also over the past 12 months, we took significant stepsto further engage internal and external Goodyear stake-holders, from associates to investors, in the elements ofour path forward. In March, we made a presentation toinvestors containing two important elements. The first element was our Strategy Roadmap, defining our keystrategies, critical areas of execution, and long-term objectives. The second component was describing theseven “MegaTrends” that are shaping the tire industry over the next decade.
Both elements provide clearer understanding of howthe industry is growing, changing and evolving, and howwe believe our strategic focus gives Goodyear a competi-tive advantage in that context. We made our goals—andour path to reach them—clear, and hold ourselvesaccountable.
I am pleased that we delivered record results in 2011 inboth sales and segment operating income. Our $1.4 billionof full-year segment operating income is nearly 50% morethan 2010 and more than 10% higher than our previousrecord. What is most gratifying, however, is that theseresults were achieved amidst an uncertain global economicclimate.
For the year, our price/mix performance drove revenueper tire, excluding the impact of foreign currency transla-tion, up 17% from a year ago. Our price/mix strategy wascritical to our ability to offset record high raw materialcosts and the success of that strategy continued throughthe end of the year. In addition:
A
As you would expect, our Strategy Roadmap leads to aspecific destination. We define our destination as “creatingsustainable economic value” by being:
First with customers—We will have the best products and the best supply chain to serve our customers and help them grow their businesses.Around the world, we will invest in making more ofthe high-value tires that our customers want to selland end-users want to buy. To be the supplier ofchoice, we will continue to innovate and producemore award-winning tires. We will become moreefficient in all areas of our supply chain to help customers win in their markets.The leader in our targeted market segments—Wewill have the right brands, channels and customersselling premium products. Our focus is on growingprofitably, not growing volume for volume’s sake. We will focus on segments, geographies, customersand channels that offer the highest long-term profitpotential. Our targeted segments will be those inwhich Goodyear’s innovation and technology differ-entiates our products from the competition. The innovation leader—We are setting the pace for innovation in our industry. We will stay on theleading edge with the best products, processes andpeople. Our commitment to innovation will notwaver.And we will be competitively advantaged in everything we do—We must set the industry standard in products, marketing, supply chain, andmanufacturing. We must be operationally excellentand create an on-going competitive advantage withrepeatable, efficient, and standardized processes thatprovide more of the right tires to our customers.
As a result, we will be profitable through economiccycles, we will deliver positive cash flow, and ultimately wewill return to an investment grade balance sheet. But morethan that, Goodyear will be the company that everyonewants to do business with—customers, consumers, associates, and investors.
We believe our strategies and momentum supportachieving that goal. I am confident that we are on the way to creating sustainable value. While we acknowledgeexternal economic events, we are committed to our path.
We must continue to execute our plan and manage the risks we face. Our results this year reflect how weresponded to the risks I described in last year’s letter. Wehad a high level of success offsetting record raw materialcosts and driving innovation. We made steady progress instrengthening our supply chain.
Much of our confidence is rooted in the alignment ofour Strategy Roadmap to the seven MegaTrends that willshape the tire industry over the next five to 10 years. Thesetrends favor our technical capabilities, our global reach,and our market-back thinking, all of which, together, provide us with a competitive advantage.
The seven MegaTrends are:1. Growth in emerging markets, representing signifi-
cant opportunity in the tire industry. We are alreadyfocused on winning in China and are positioned totake advantage of growth in India, Latin America,Eastern Europe and other growing markets. Therapid growth of a consuming middle class and theability to buy more cars and light trucks for personaluse characterize each of these markets.
2. Developed markets retain their strength because of their changing mix toward higher technologytires, offering significant growth and a chance to differentiate products and brands. This trend alignswith our focus on targeted market segments.
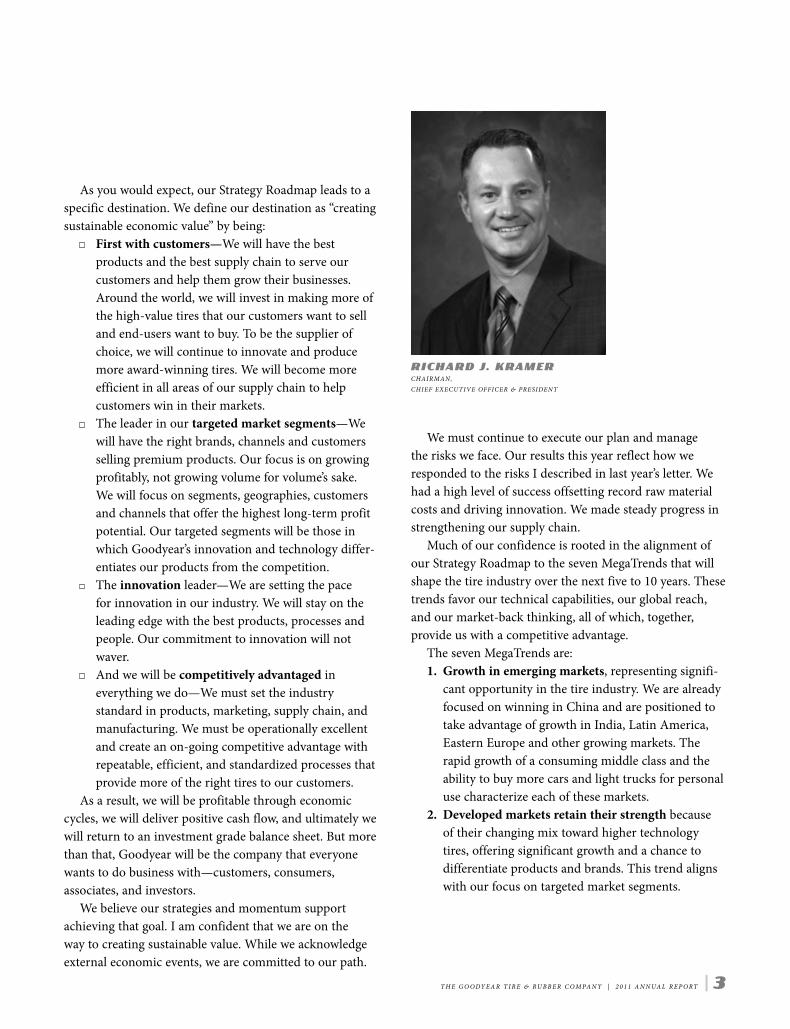
RICHARD J. KRAMERCHAIRMAN, CHIEF EXECUTIVE OFFICER & PRESIDENT
T H E G O O DY E A R T I R E & RU B B E R C O M PA N Y | 2 0 1 1 A N N UA L R E P O RT | 3
3. Higher value, more complex tires will be moreprevalent in the mid-tier vehicle segment. Vehiclemanufacturers around the world are increasing thenumber of high-value tires across all their offerings.Increased technology and innovative features arenow standard in virtually all new vehicles, and tiresare no exception. High-value products such as theGoodyear Assurance FuelMax tire are already growing in popularity on many of the high-volumeOE fitments.
4. The “green” trend is here to stay. An emphasis on increased fuel efficiency is an outgrowth ofworldwide environmental awareness. Our globalinnovation and industry leadership in fuel efficientproducts gives us an advantage in this trend.
5. Standardized tire performance labeling becomes areality in Europe later this year, and the rest of theworld is not far behind. We are accelerating ourproduct development to meet or exceed the labelingstandards…another competitive advantage forGoodyear.
6. The use of the internet will continue to grow in itsimpact on the tire industry. Many tire purchasesbegin with research and comparison online. Ourglobal objective is to use the internet as a bridge,taking consumers from shopping for tires and quickly leading them to one of our retailers to buyGoodyear products. This is another example ofworking from the market back, satisfying the needsof consumers and helping our customers grow theirbusinesses.
7. The changes in the tire industry are evolutionary…not revolutionary. It is vital for us to see with predictability the technologies that are likely to affect us…and direct our investments toward them.Though the tire industry goes through up and downcycles, the increasing number of vehicles being driven around the world means that a quick, drasticshift in the industry is unlikely. In this environment,we manage our investments to both maximizereturns and execute our strategy.
These are the most important trends in the tire indus-try, ones that have been building momentum over the pastdecade and will shape it over the decade to come. Theyrepresent exciting opportunities for us to differentiateGoodyear from our competition. They are real, they arepowerful, and they favor Goodyear because our strategy isin alignment with the future of the global tire business.
In this letter a year ago, I shared my belief that there’snever been a better time to be in the tire industry. Withour full commitment to a strategy that is already workingand positioned to take advantage of the opportunities inthe future, I believe there is no better time to be part ofGoodyear. We have seen the difference that our innovationmakes. We are well positioned for growth in the parts ofthe world that are expanding most rapidly. And we have ateam of leaders that will help us build new capabilities andindustry defining operations excellence.
I have always been optimistic and confident about ourcompany and remain so today. But more than that, I amtruly excited about what’s ahead and what’s possible. Yes,the environment around us will constantly change andthere will be continued uncertainty around the world.Even so, those challenges will present opportunities tocontinue to distinguish Goodyear in the global tire industry.
I am proud of how far we have come, pleased withwhere we are, and inspired about what’s ahead. I assureyou that we will pursue the future with energy and passionand I look forward to having you with us.
Respectfully submitted,
Richard J. KramerCHAIRMAN, CHIEF EXECUTIVE OFFICER & PRESIDENT
4 | T H E G O O DY E A R T I R E & RU B B E R C O M PA N Y | 2 0 1 1 A N N UA L R E P O RT
MANAGEMENT’S DISCUSSION AND ANALYSIS OF FINANCIAL CONDITION AND RESULTS OFOPERATIONS.
OVERVIEW
The Goodyear Tire & Rubber Company (the “Company”) is one of the world’s leading manufacturers of tires,with one of the most recognizable brand names in the world and operations in most regions of the world. Wehave a broad global footprint with 53 manufacturing facilities in 22 countries, including the United States. Weoperate our business through four operating segments representing our regional tire businesses: North AmericanTire; Europe, Middle East and Africa Tire (“EMEA”); Latin American Tire; and Asia Pacific Tire. The terms“Goodyear,” “Company” and “we,” “us” or “our” wherever used herein refer to the Company together with all ofits consolidated U.S. and foreign subsidiary companies, unless the context indicates to the contrary.
We experienced uneven industry conditions in 2011 as the economic recovery in developed markets wasimpacted by uncertainty surrounding debt issues in Europe and the United States and continued high levels ofunemployment, which had a negative impact on overall economic conditions and customer and consumerconfidence. In emerging markets, high inflation and interest rates also contributed to uneven industry conditions.Our tire unit shipments in 2011 were essentially flat compared to 2010, and global tire industry demandcontinues to be difficult to predict. In addition, our raw material costs rose by approximately 30% in 2011compared to 2010.
We acted to address the uncertain economic environment and the challenges described above byimplementing strategic initiatives aimed at permitting us to emerge stronger in the future. Under those strategicinitiatives we planned to:
• Continue to focus on consumer-driven product development;
• Take a selective approach to the market, targeting profitable segments where we have competitiveadvantages;
• Focus on price and product mix improvements to address rising raw material costs;
• Achieve cost reductions of $1.0 billion over three years from 2010 to 2012;
• Improve our manufacturing efficiency, including recovering unabsorbed fixed costs incurred during therecession;
• Focus on cash flow to provide funding for investments in future growth; and
• Create an advantaged supply chain focused on optimizing inventory levels and further improvingcustomer service.
In spite of the macroeconomic and industry-specific challenges we faced, we produced record net sales andsegment operating income in 2011. During 2011, improved price and product mix of nearly $2.4 billion morethan offset the impact of unprecedented raw material cost increases of nearly $2.0 billion on segment operatingincome, exclusive of approximately $177 million of raw material cost savings included in our cost savings plandescribed below. Price and product mix also drove a 17% improvement in revenue per tire, excluding the impactof foreign currency translation, in 2011 compared to 2010, reflecting our continued focus on driving improvedprice and product mix through innovative product offerings in targeted market segments.
In 2011, we realized approximately $281 million of cost savings, bringing the total cost savings for 2010and 2011 to approximately $748 million. Our cost savings plan includes savings from continuous improvementinitiatives, including net savings under our United Steelworkers contract, increased low-cost country sourcing,and initiatives to reduce raw material costs and selling, administrative and general expense. We also recoveredapproximately $195 million of under-absorbed fixed overhead costs in 2011 compared to 2010. Other keystrategic achievements include:
• Continued progress on actions to reduce our high-cost manufacturing capacity, including the closure ofour factory in Union City, Tennessee in July 2011;
5
• Initiated production of tires at our new factory in Pulandian, China; and
• Continued improvements in working capital efficiency, measured as a percent of sales.
For the year ended December 31, 2011, Goodyear net income was $343 million, compared to a Goodyear net lossof $216 million in 2010, and Goodyear net income available to common shareholders was $321 million,compared to a Goodyear net loss available to common shareholders of $216 million in 2010. Our total segmentoperating income for 2011 was $1,368 million, compared to $917 million in 2010. The increase in segmentoperating income was due primarily to strong price and product mix which more than offset raw material costs, asignificant decrease in under-absorbed fixed overhead costs due to increased production volumes, and favorableforeign currency translation. See “Results of Operations — Segment Information” for additional information.
Net sales were $22.8 billion in 2011, compared to $18.8 billion in 2010. Net sales increased due toimproved price and product mix, an increase in other tire-related businesses, primarily in North American Tire’sthird party sales of chemical products, and favorable foreign currency translation, primarily in EMEA and AsiaPacific Tire.
Pension and Benefit Plans
During 2011, our U.S. pension plans experienced actuarial losses from decreases in discount rates, whichincreased plan obligations by $452 million. In addition, the actual return on plan assets for our U.S. pension fundin 2011 was $283 million less than the expected return. These results increased actuarial net losses included inAccumulated Other Comprehensive Loss (“AOCL”) by $735 million. As a result, annual U.S. net periodicpension cost will increase to approximately $200 million to $225 million in 2012 from $175 million in 2011, dueprimarily to amortization of higher net actuarial losses from AOCL.
Liquidity
At December 31, 2011, we had $2,772 million in Cash and cash equivalents as well as $2,544 million of unusedavailability under our various credit agreements, compared to $2,005 million and $2,475 million, respectively, atDecember 31, 2010. Cash and cash equivalents were favorably affected by the improvement in earningscompared to 2010, the net proceeds from the issuance of our mandatory convertible preferred stock of $484million, and the issuance of €250 million aggregate principal amount of 6.75% senior notes due 2019. Partiallyoffsetting these increases in Cash and cash equivalents were capital expenditures of $1,043 million, theredemption of $350 million of our 10.5% senior notes due 2016, and working capital expenditures of $650million.
We believe that our liquidity position is adequate to fund our operating and investing needs in 2012 and toprovide us with flexibility to respond to further changes in the business environment.
New Products
In 2011, we successfully launched our new Goodyear Assurance TripleTred All-Season, Goodyear Ultra Grip IceWRT and Kelly Safari ATR tire lines in North American Tire. We also successfully launched nine new tire andretread product lines in our commercial truck tire business with three of those lines featuring SmartWay (fuelefficiency) certification and/or Duraseal Technology. At our North American Tire dealer conference in early2012, we introduced several key products, most notably the Goodyear Assurance CS TripleTred All-Season andthe Eagle F1 Asymmetric All-Season tires. Additionally, we are adding key sizes of new consumer productslaunched in recent years.
In EMEA, we launched the new Eagle F1 Asymmetric 2 summer ultra high performance tire and theGoodyear Ultra Grip 8 and Dunlop Winter Sport 4D winter tires. We have also strengthened our MaxTechnology commercial tire line up with a new regional haul trailer tire, RHTII, and a new line of higher loadrange tires that offer increased load capacity. In addition, we have upgraded our Fuel Max line with our LHS II +and LHD II + tires.
6
In Latin American Tire, we successfully launched the Wrangler MT/R with Kevlar tire in the consumermarket. We also launched several products using Fuel Max Technology in the commercial market, as well asexpanded our commercial product lines by adding key sizes of new commercial products launched in recentyears.
In Asia Pacific Tire, we launched two of our leading ultra high performance tires, the Goodyear Eagle F1Asymmetric 2 for luxury sports performance vehicles and the Goodyear Eagle F1 Directional 5 for mid-rangesports performance vehicles. Both of these Goodyear Eagle products are successors to previous award-winningultra high performance tires and provide superior braking and handling capabilities.
Outlook
In 2012, we expect to continue to face challenges related to uneven tire industry growth and the actions we aretaking globally to improve our manufacturing footprint.
We expect long-term growth in the global tire industry to continue, but at a slower pace near-term thanpreviously forecast due to continued economic weakness in several parts of the world, most notably in Europe.We expect that our full-year tire unit volume for 2012 will be essentially flat with 2011. For the full year of 2012in North America, we expect consumer replacement to be flat to down 2%, consumer original equipment to beflat to up 3%, commercial replacement to be up between 2% and 6% and commercial original equipment to be upbetween 10% and 15%. For the full year in Europe, the consumer replacement industry is expected to be flat todown 2%, consumer original equipment to be down between 5% and 9%, commercial replacement to be downbetween 3% and 8% and commercial original equipment to be down between 20% and 25%.
We expect our raw material costs in the first quarter of 2012 to increase 20% to 25% when compared withthe first quarter of 2011. Smaller increases are expected for the second quarter of 2012 compared with the secondquarter of 2011. For the second half of 2012, we expect raw material costs to decrease compared with the secondhalf of 2011. For the full year of 2012, we expect our raw material costs will increase approximately 5%compared with 2011. However, natural and synthetic rubber prices and other commodity prices have experiencedsignificant volatility, and this estimate could change significantly based on fluctuations in the cost of these andother key raw materials. In order to mitigate some of the impact of rising raw material costs, we are continuing tofocus on price and product mix, to substitute lower cost materials where possible and to work to identifyadditional substitution opportunities, to reduce the amount of material required in each tire, and to pursuealternative raw materials including innovative bio-based materials. However, during periods of rapidly rising rawmaterial costs, we may not be able to fully offset those raw material cost increases through the use of thesestrategies, although we remain confident in our ability to do so over the longer term.
As a result of the closure of our Union City, Tennessee manufacturing facility, we now expect to recoverapproximately $40 million to $60 million of unabsorbed fixed costs in 2012, net of the impact of anticipatedproduction cuts due to flat tire unit volume. We also expect to reduce costs by approximately $250 million in2012. As a partial offset to these benefits, we expect to incur approximately $40 million to $60 million ofadditional costs related to start-up expenses for our new Pulandian, China manufacturing facility andunder-absorbed overhead costs related to the closure of our Dalian, China manufacturing facility in 2012.
See “Forward-Looking Information — Safe Harbor Statement” at page 33 for a discussion of our use offorward-looking statements.
RESULTS OF OPERATIONS— CONSOLIDATED
All per share amounts are diluted and refer to Goodyear net income (loss) available to common shareholders.
2011 Compared to 2010
For the year ended December 31, 2011, Goodyear net income was $343 million, or $1.32 per share, compared tonet loss of $216 million, or $0.89 per share, in 2010. For the year ended December 31, 2011 Goodyear netincome available to common shareholders was $321 million, or $1.26 per share, reflecting $22 million ofpreferred stock dividends, compared to a Goodyear net loss available to common shareholders of $216 million,or $0.89 per share, in 2010.
7
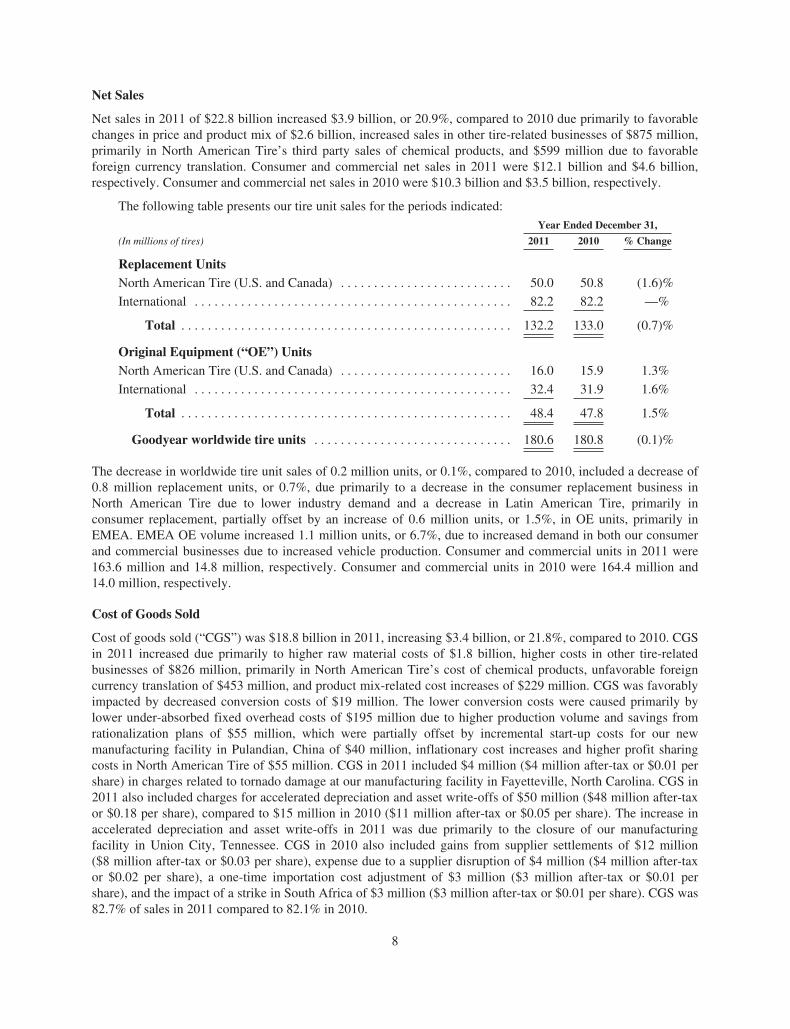
Net Sales
Net sales in 2011 of $22.8 billion increased $3.9 billion, or 20.9%, compared to 2010 due primarily to favorablechanges in price and product mix of $2.6 billion, increased sales in other tire-related businesses of $875 million,primarily in North American Tire’s third party sales of chemical products, and $599 million due to favorableforeign currency translation. Consumer and commercial net sales in 2011 were $12.1 billion and $4.6 billion,respectively. Consumer and commercial net sales in 2010 were $10.3 billion and $3.5 billion, respectively.
The following table presents our tire unit sales for the periods indicated:Year Ended December 31,
(In millions of tires) 2011 2010 % Change
Replacement UnitsNorth American Tire (U.S. and Canada) . . . . . . . . . . . . . . . . . . . . . . . . . . 50.0 50.8 (1.6)%
International . . . . . . . . . . . . . . . . . . . . . . . . . . . . . . . . . . . . . . . . . . . . . . . . 82.2 82.2 —%
Total . . . . . . . . . . . . . . . . . . . . . . . . . . . . . . . . . . . . . . . . . . . . . . . . . . 132.2 133.0 (0.7)%
Original Equipment (“OE”) UnitsNorth American Tire (U.S. and Canada) . . . . . . . . . . . . . . . . . . . . . . . . . . 16.0 15.9 1.3%
International . . . . . . . . . . . . . . . . . . . . . . . . . . . . . . . . . . . . . . . . . . . . . . . . 32.4 31.9 1.6%
Total . . . . . . . . . . . . . . . . . . . . . . . . . . . . . . . . . . . . . . . . . . . . . . . . . . 48.4 47.8 1.5%
Goodyear worldwide tire units . . . . . . . . . . . . . . . . . . . . . . . . . . . . . . 180.6 180.8 (0.1)%
The decrease in worldwide tire unit sales of 0.2 million units, or 0.1%, compared to 2010, included a decrease of0.8 million replacement units, or 0.7%, due primarily to a decrease in the consumer replacement business inNorth American Tire due to lower industry demand and a decrease in Latin American Tire, primarily inconsumer replacement, partially offset by an increase of 0.6 million units, or 1.5%, in OE units, primarily inEMEA. EMEA OE volume increased 1.1 million units, or 6.7%, due to increased demand in both our consumerand commercial businesses due to increased vehicle production. Consumer and commercial units in 2011 were163.6 million and 14.8 million, respectively. Consumer and commercial units in 2010 were 164.4 million and14.0 million, respectively.
Cost of Goods Sold
Cost of goods sold (“CGS”) was $18.8 billion in 2011, increasing $3.4 billion, or 21.8%, compared to 2010. CGSin 2011 increased due primarily to higher raw material costs of $1.8 billion, higher costs in other tire-relatedbusinesses of $826 million, primarily in North American Tire’s cost of chemical products, unfavorable foreigncurrency translation of $453 million, and product mix-related cost increases of $229 million. CGS was favorablyimpacted by decreased conversion costs of $19 million. The lower conversion costs were caused primarily bylower under-absorbed fixed overhead costs of $195 million due to higher production volume and savings fromrationalization plans of $55 million, which were partially offset by incremental start-up costs for our newmanufacturing facility in Pulandian, China of $40 million, inflationary cost increases and higher profit sharingcosts in North American Tire of $55 million. CGS in 2011 included $4 million ($4 million after-tax or $0.01 pershare) in charges related to tornado damage at our manufacturing facility in Fayetteville, North Carolina. CGS in2011 also included charges for accelerated depreciation and asset write-offs of $50 million ($48 million after-taxor $0.18 per share), compared to $15 million in 2010 ($11 million after-tax or $0.05 per share). The increase inaccelerated depreciation and asset write-offs in 2011 was due primarily to the closure of our manufacturingfacility in Union City, Tennessee. CGS in 2010 also included gains from supplier settlements of $12 million($8 million after-tax or $0.03 per share), expense due to a supplier disruption of $4 million ($4 million after-taxor $0.02 per share), a one-time importation cost adjustment of $3 million ($3 million after-tax or $0.01 pershare), and the impact of a strike in South Africa of $3 million ($3 million after-tax or $0.01 per share). CGS was82.7% of sales in 2011 compared to 82.1% in 2010.
8
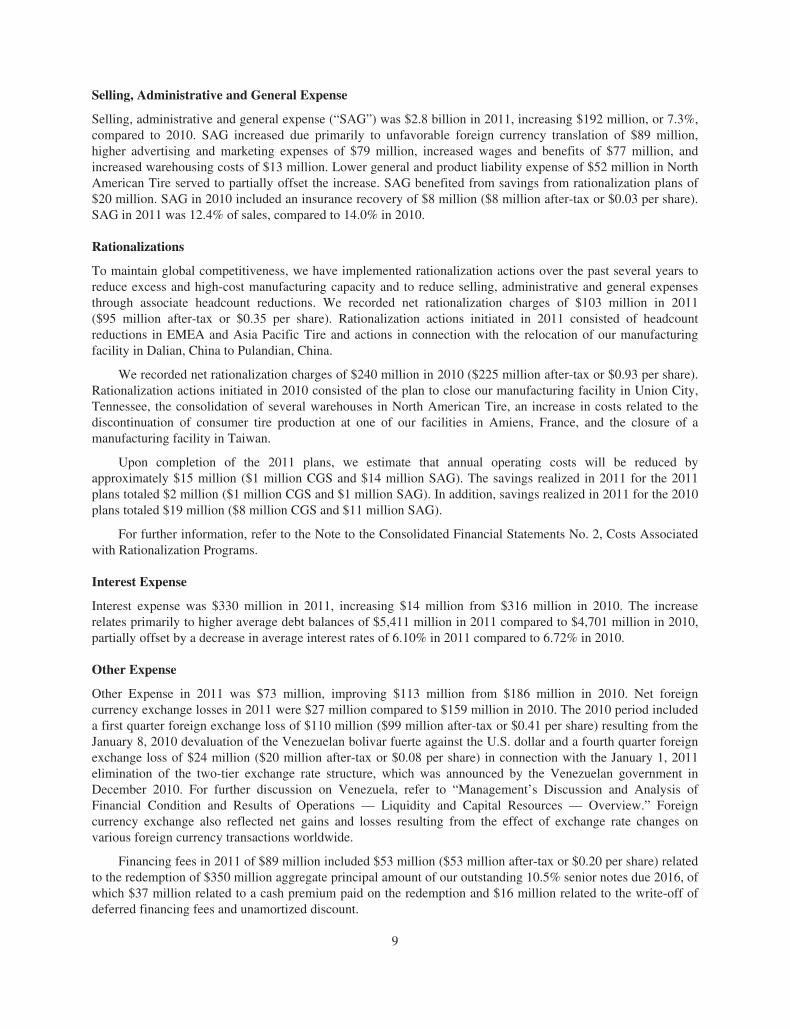
Selling, Administrative and General Expense
Selling, administrative and general expense (“SAG”) was $2.8 billion in 2011, increasing $192 million, or 7.3%,compared to 2010. SAG increased due primarily to unfavorable foreign currency translation of $89 million,higher advertising and marketing expenses of $79 million, increased wages and benefits of $77 million, andincreased warehousing costs of $13 million. Lower general and product liability expense of $52 million in NorthAmerican Tire served to partially offset the increase. SAG benefited from savings from rationalization plans of$20 million. SAG in 2010 included an insurance recovery of $8 million ($8 million after-tax or $0.03 per share).SAG in 2011 was 12.4% of sales, compared to 14.0% in 2010.
Rationalizations
To maintain global competitiveness, we have implemented rationalization actions over the past several years toreduce excess and high-cost manufacturing capacity and to reduce selling, administrative and general expensesthrough associate headcount reductions. We recorded net rationalization charges of $103 million in 2011($95 million after-tax or $0.35 per share). Rationalization actions initiated in 2011 consisted of headcountreductions in EMEA and Asia Pacific Tire and actions in connection with the relocation of our manufacturingfacility in Dalian, China to Pulandian, China.
We recorded net rationalization charges of $240 million in 2010 ($225 million after-tax or $0.93 per share).Rationalization actions initiated in 2010 consisted of the plan to close our manufacturing facility in Union City,Tennessee, the consolidation of several warehouses in North American Tire, an increase in costs related to thediscontinuation of consumer tire production at one of our facilities in Amiens, France, and the closure of amanufacturing facility in Taiwan.
Upon completion of the 2011 plans, we estimate that annual operating costs will be reduced byapproximately $15 million ($1 million CGS and $14 million SAG). The savings realized in 2011 for the 2011plans totaled $2 million ($1 million CGS and $1 million SAG). In addition, savings realized in 2011 for the 2010plans totaled $19 million ($8 million CGS and $11 million SAG).
For further information, refer to the Note to the Consolidated Financial Statements No. 2, Costs Associatedwith Rationalization Programs.
Interest Expense
Interest expense was $330 million in 2011, increasing $14 million from $316 million in 2010. The increaserelates primarily to higher average debt balances of $5,411 million in 2011 compared to $4,701 million in 2010,partially offset by a decrease in average interest rates of 6.10% in 2011 compared to 6.72% in 2010.
Other Expense
Other Expense in 2011 was $73 million, improving $113 million from $186 million in 2010. Net foreigncurrency exchange losses in 2011 were $27 million compared to $159 million in 2010. The 2010 period includeda first quarter foreign exchange loss of $110 million ($99 million after-tax or $0.41 per share) resulting from theJanuary 8, 2010 devaluation of the Venezuelan bolivar fuerte against the U.S. dollar and a fourth quarter foreignexchange loss of $24 million ($20 million after-tax or $0.08 per share) in connection with the January 1, 2011elimination of the two-tier exchange rate structure, which was announced by the Venezuelan government inDecember 2010. For further discussion on Venezuela, refer to “Management’s Discussion and Analysis ofFinancial Condition and Results of Operations — Liquidity and Capital Resources — Overview.” Foreigncurrency exchange also reflected net gains and losses resulting from the effect of exchange rate changes onvarious foreign currency transactions worldwide.
Financing fees in 2011 of $89 million included $53 million ($53 million after-tax or $0.20 per share) relatedto the redemption of $350 million aggregate principal amount of our outstanding 10.5% senior notes due 2016, ofwhich $37 million related to a cash premium paid on the redemption and $16 million related to the write-off ofdeferred financing fees and unamortized discount.
9
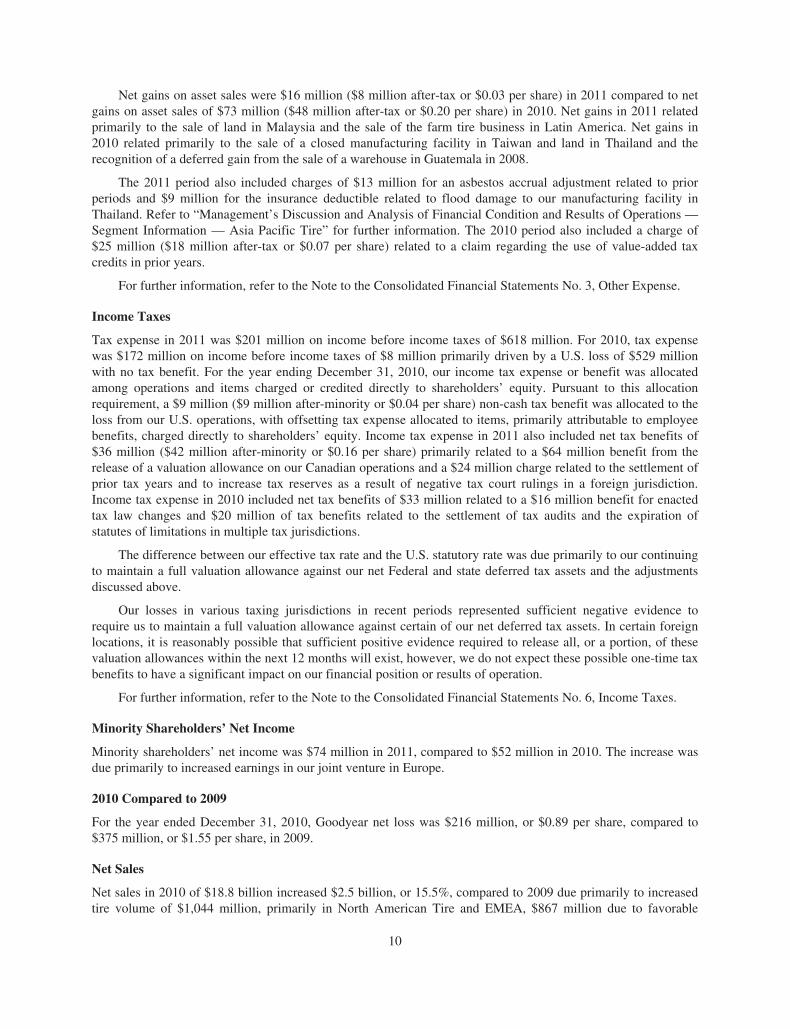
Net gains on asset sales were $16 million ($8 million after-tax or $0.03 per share) in 2011 compared to netgains on asset sales of $73 million ($48 million after-tax or $0.20 per share) in 2010. Net gains in 2011 relatedprimarily to the sale of land in Malaysia and the sale of the farm tire business in Latin America. Net gains in2010 related primarily to the sale of a closed manufacturing facility in Taiwan and land in Thailand and therecognition of a deferred gain from the sale of a warehouse in Guatemala in 2008.
The 2011 period also included charges of $13 million for an asbestos accrual adjustment related to priorperiods and $9 million for the insurance deductible related to flood damage to our manufacturing facility inThailand. Refer to “Management’s Discussion and Analysis of Financial Condition and Results of Operations —Segment Information — Asia Pacific Tire” for further information. The 2010 period also included a charge of$25 million ($18 million after-tax or $0.07 per share) related to a claim regarding the use of value-added taxcredits in prior years.
For further information, refer to the Note to the Consolidated Financial Statements No. 3, Other Expense.
Income Taxes
Tax expense in 2011 was $201 million on income before income taxes of $618 million. For 2010, tax expensewas $172 million on income before income taxes of $8 million primarily driven by a U.S. loss of $529 millionwith no tax benefit. For the year ending December 31, 2010, our income tax expense or benefit was allocatedamong operations and items charged or credited directly to shareholders’ equity. Pursuant to this allocationrequirement, a $9 million ($9 million after-minority or $0.04 per share) non-cash tax benefit was allocated to theloss from our U.S. operations, with offsetting tax expense allocated to items, primarily attributable to employeebenefits, charged directly to shareholders’ equity. Income tax expense in 2011 also included net tax benefits of$36 million ($42 million after-minority or $0.16 per share) primarily related to a $64 million benefit from therelease of a valuation allowance on our Canadian operations and a $24 million charge related to the settlement ofprior tax years and to increase tax reserves as a result of negative tax court rulings in a foreign jurisdiction.Income tax expense in 2010 included net tax benefits of $33 million related to a $16 million benefit for enactedtax law changes and $20 million of tax benefits related to the settlement of tax audits and the expiration ofstatutes of limitations in multiple tax jurisdictions.
The difference between our effective tax rate and the U.S. statutory rate was due primarily to our continuingto maintain a full valuation allowance against our net Federal and state deferred tax assets and the adjustmentsdiscussed above.
Our losses in various taxing jurisdictions in recent periods represented sufficient negative evidence torequire us to maintain a full valuation allowance against certain of our net deferred tax assets. In certain foreignlocations, it is reasonably possible that sufficient positive evidence required to release all, or a portion, of thesevaluation allowances within the next 12 months will exist, however, we do not expect these possible one-time taxbenefits to have a significant impact on our financial position or results of operation.
For further information, refer to the Note to the Consolidated Financial Statements No. 6, Income Taxes.
Minority Shareholders’ Net Income
Minority shareholders’ net income was $74 million in 2011, compared to $52 million in 2010. The increase wasdue primarily to increased earnings in our joint venture in Europe.
2010 Compared to 2009
For the year ended December 31, 2010, Goodyear net loss was $216 million, or $0.89 per share, compared to$375 million, or $1.55 per share, in 2009.
Net Sales
Net sales in 2010 of $18.8 billion increased $2.5 billion, or 15.5%, compared to 2009 due primarily to increasedtire volume of $1,044 million, primarily in North American Tire and EMEA, $867 million due to favorable
10
changes in price and product mix, and increased sales in other tire-related businesses of $582 million, primarilyin North American Tire’s third party sales of chemical products. Consumer and commercial net sales in 2010were $10.3 billion and $3.5 billion, respectively. Consumer and commercial net sales in 2009 were $9.4 billionand $2.8 billion, respectively.
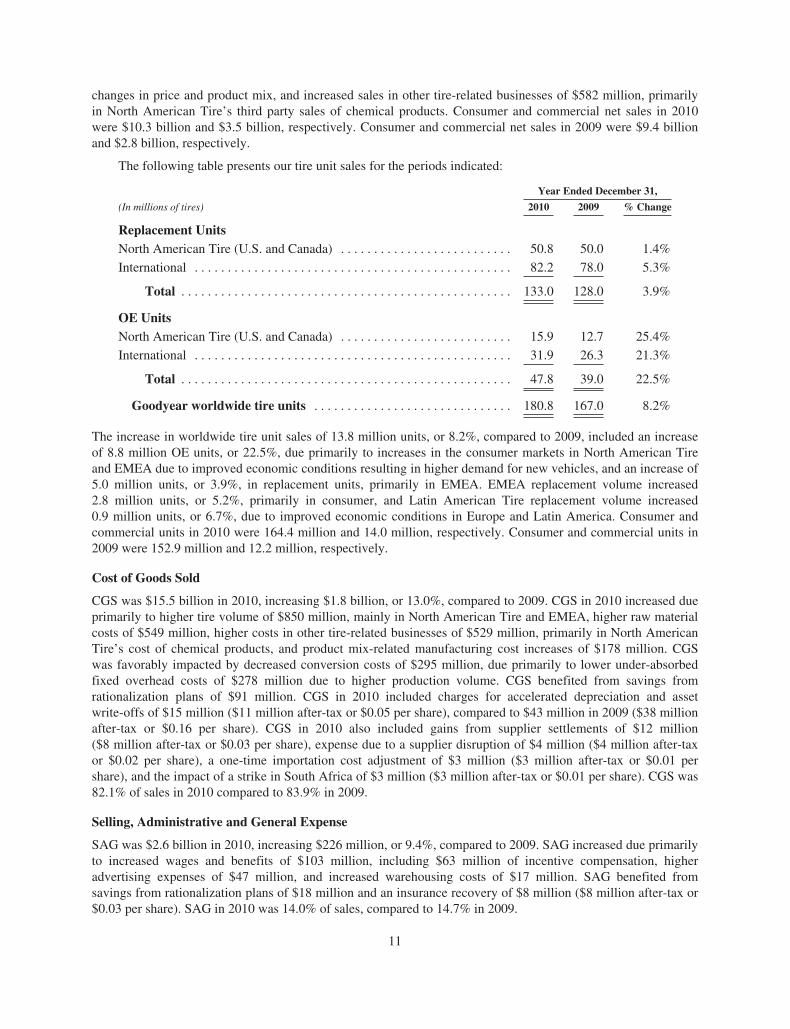
The following table presents our tire unit sales for the periods indicated:
Year Ended December 31,
(In millions of tires) 2010 2009 % Change
Replacement UnitsNorth American Tire (U.S. and Canada) . . . . . . . . . . . . . . . . . . . . . . . . . . 50.8 50.0 1.4%
International . . . . . . . . . . . . . . . . . . . . . . . . . . . . . . . . . . . . . . . . . . . . . . . . 82.2 78.0 5.3%
Total . . . . . . . . . . . . . . . . . . . . . . . . . . . . . . . . . . . . . . . . . . . . . . . . . . 133.0 128.0 3.9%
OE UnitsNorth American Tire (U.S. and Canada) . . . . . . . . . . . . . . . . . . . . . . . . . . 15.9 12.7 25.4%
International . . . . . . . . . . . . . . . . . . . . . . . . . . . . . . . . . . . . . . . . . . . . . . . . 31.9 26.3 21.3%
Total . . . . . . . . . . . . . . . . . . . . . . . . . . . . . . . . . . . . . . . . . . . . . . . . . . 47.8 39.0 22.5%
Goodyear worldwide tire units . . . . . . . . . . . . . . . . . . . . . . . . . . . . . . 180.8 167.0 8.2%
The increase in worldwide tire unit sales of 13.8 million units, or 8.2%, compared to 2009, included an increaseof 8.8 million OE units, or 22.5%, due primarily to increases in the consumer markets in North American Tireand EMEA due to improved economic conditions resulting in higher demand for new vehicles, and an increase of5.0 million units, or 3.9%, in replacement units, primarily in EMEA. EMEA replacement volume increased2.8 million units, or 5.2%, primarily in consumer, and Latin American Tire replacement volume increased0.9 million units, or 6.7%, due to improved economic conditions in Europe and Latin America. Consumer andcommercial units in 2010 were 164.4 million and 14.0 million, respectively. Consumer and commercial units in2009 were 152.9 million and 12.2 million, respectively.
Cost of Goods Sold
CGS was $15.5 billion in 2010, increasing $1.8 billion, or 13.0%, compared to 2009. CGS in 2010 increased dueprimarily to higher tire volume of $850 million, mainly in North American Tire and EMEA, higher raw materialcosts of $549 million, higher costs in other tire-related businesses of $529 million, primarily in North AmericanTire’s cost of chemical products, and product mix-related manufacturing cost increases of $178 million. CGSwas favorably impacted by decreased conversion costs of $295 million, due primarily to lower under-absorbedfixed overhead costs of $278 million due to higher production volume. CGS benefited from savings fromrationalization plans of $91 million. CGS in 2010 included charges for accelerated depreciation and assetwrite-offs of $15 million ($11 million after-tax or $0.05 per share), compared to $43 million in 2009 ($38 millionafter-tax or $0.16 per share). CGS in 2010 also included gains from supplier settlements of $12 million($8 million after-tax or $0.03 per share), expense due to a supplier disruption of $4 million ($4 million after-taxor $0.02 per share), a one-time importation cost adjustment of $3 million ($3 million after-tax or $0.01 pershare), and the impact of a strike in South Africa of $3 million ($3 million after-tax or $0.01 per share). CGS was82.1% of sales in 2010 compared to 83.9% in 2009.
Selling, Administrative and General Expense
SAG was $2.6 billion in 2010, increasing $226 million, or 9.4%, compared to 2009. SAG increased due primarilyto increased wages and benefits of $103 million, including $63 million of incentive compensation, higheradvertising expenses of $47 million, and increased warehousing costs of $17 million. SAG benefited fromsavings from rationalization plans of $18 million and an insurance recovery of $8 million ($8 million after-tax or$0.03 per share). SAG in 2010 was 14.0% of sales, compared to 14.7% in 2009.
11
Rationalizations
We recorded net rationalization charges of $240 million in 2010 ($225 million after-tax or $0.93 per share).Rationalization actions in 2010 consisted of the plan to close our manufacturing facility in Union City,Tennessee, the consolidation of several warehouses in North American Tire, an increase in costs related to thediscontinuation of consumer tire production at one of our facilities in Amiens, France, and the closure of amanufacturing facility in Taiwan.
We recorded net rationalization charges of $227 million in 2009 ($182 million after-tax or $0.75 per share).Rationalization actions in 2009 consisted of initiatives in North American Tire to reduce manufacturingheadcount at several facilities, including Union City, Tennessee, Danville, Virginia and Topeka, Kansas, torespond to lower production demand. Additional salaried headcount reductions were initiated at our corporateoffices in Akron, Ohio, in North American Tire and throughout EMEA. We also initiated the discontinuation ofconsumer tire production at one of our facilities in Amiens, France and manufacturing headcount reductions ateach of our two facilities in Brazil.
For further information, refer to the Note to the Consolidated Financial Statements No. 2, Costs Associatedwith Rationalization Programs.
Interest Expense
Interest expense was $316 million in 2010, increasing $5 million compared to 2009. The increase relatesprimarily to higher average interest rates of 6.72% in 2010 compared to 5.65% in 2009 partially offset by loweraverage debt balances of $4,701 million in 2010 compared to $5,509 million in 2009.
Other Expense
Other Expense in 2010 was $186 million, increasing $146 million from $40 million in 2009. Net foreigncurrency exchange losses in 2010 were $159 million compared to $7 million in 2009. The 2010 period included afirst quarter foreign exchange loss of $110 million ($99 million after-tax or $0.41 per share) resulting from theJanuary 8, 2010 devaluation of the Venezuelan bolivar fuerte against the U.S. dollar and a fourth quarter foreignexchange loss of $24 million ($20 million after-tax or $0.08 per share) in connection with the January 1, 2011elimination of the two-tier exchange rate structure, which was announced by the Venezuelan government inDecember 2010. Foreign currency exchange also reflected net gains and losses resulting from the effect ofexchange rate changes on various foreign currency transactions worldwide.
Financing fees in 2010 of $95 million included $56 million ($56 million after-tax or $0.23 per share) relatedto the redemption of $973 million of long term debt, of which $50 million were cash premiums paid on theredemption and $6 million were financing fees which were written off. Also included in financing fees werecosts related to a debt exchange offer of $5 million ($5 million after-tax or $0.02 per share).
Net gains on asset sales were $73 million ($48 million after-tax or $0.20 per share) in 2010 compared to netlosses on asset sales of $30 million ($30 million after-tax or $0.13 per share) in 2009. Net gains in 2010 relatedprimarily to the sale of a closed manufacturing facility in Taiwan and land in Thailand and the recognition of adeferred gain from the sale of a warehouse in Guatemala in 2008. Net losses in 2009 were due primarily to thesale of certain of our properties in Akron, Ohio that comprise our current headquarters in connection with thedevelopment of a new headquarters in Akron, Ohio.
The 2010 period also included a charge of $25 million ($18 million after-tax or $0.07 per share) related to aclaim regarding the use of value-added tax credits in prior years.
For further information, refer to the Note to the Consolidated Financial Statements No. 3, Other Expense.
Income Taxes
Tax expense in 2010 was $172 million on income before income taxes of $8 million primarily driven by a U.S.loss of $529 million with no tax benefit. For 2009, tax expense was $7 million on a loss before income taxes of
12

$357 million. For the years ending December 31, 2010 and 2009, our income tax expense or benefit wasallocated among operations and items charged or credited directly to shareholders’ equity. Pursuant to thisallocation requirement, a $9 million ($9 million after-minority or $0.04 per share) and $100 million($100 million after-minority or $0.42 per share), respectively, non-cash tax benefit has been allocated to the lossfrom our U.S. operations, with offsetting tax expense allocated to items, primarily attributable to employeebenefits, charged directly to shareholders’ equity. Income tax expense in 2010 also included net tax benefits of$33 million ($31 million after-minority or $0.13 per share) primarily related to a $16 million benefit on enactedtax law changes and $20 million of tax benefits related to the settlement of tax audits and the expiration ofstatutes of limitations in multiple tax jurisdictions. Income tax expense in 2009 also included net tax benefits of$42 million ($42 million after-minority or $0.18 per share) primarily related to a $29 million benefit resultingfrom the release of a valuation allowance on our Australian operations and a $19 million benefit resulting fromthe settlement of our 1997 through 2003 Competent Authority claim between the United States and Canada.
The difference between our effective tax rate and the U.S. statutory rate was due primarily to our continuingto maintain a full valuation allowance against our net Federal and state deferred tax assets and the adjustmentsdiscussed above.
For further information, refer to the Note to the Consolidated Financial Statements No. 6, Income Taxes.
Minority Shareholders’ Net Income
Minority shareholders’ net income was $52 million in 2010, compared to $11 million in 2009. The increase wasdue primarily to increased earnings in our joint venture in Europe.
RESULTS OF OPERATIONS— SEGMENT INFORMATION
Segment information reflects our strategic business units (“SBUs”), which are organized to meet customerrequirements and global competition and are segmented on a regional basis.
Results of operations are measured based on net sales to unaffiliated customers and segment operatingincome. Each segment exports tires to other segments. The financial results of each segment exclude sales oftires exported to other segments, but include operating income derived from such transactions. Segmentoperating income is computed as follows: Net Sales less CGS (excluding asset write-off and accelerateddepreciation charges) and SAG (including certain allocated corporate administrative expenses). Segmentoperating income also includes certain royalties and equity in earnings of most affiliates. Segment operatingincome does not include net rationalization charges (credits), asset sales and certain other items.
Total segment operating income was $1,368 million in 2011, $917 million in 2010 and $372 million in2009. Total segment operating margin (segment operating income divided by segment sales) in 2011 was 6.0%,compared to 4.9% in 2010 and 2.3% in 2009.
Management believes that total segment operating income is useful because it represents the aggregate valueof income created by our SBUs and excludes items not directly related to the SBUs for performance evaluationpurposes. Total segment operating income is the sum of the individual SBUs’ segment operating income. Referto the Note to the Consolidated Financial Statements No. 8, Business Segments, for further information and for areconciliation of total segment operating income to Income (Loss) before Income Taxes.
North American TireYear Ended December 31,
(In millions) 2011 2010 2009
Tire Units . . . . . . . . . . . . . . . . . . . . . . . . . . . . . . . . . . . . . . . . . . . . . . . . . . 66.0 66.7 62.7
Net Sales . . . . . . . . . . . . . . . . . . . . . . . . . . . . . . . . . . . . . . . . . . . . . . . . . . . $9,859 $8,205 $6,977
Operating Income (Loss) . . . . . . . . . . . . . . . . . . . . . . . . . . . . . . . . . . . . . . 276 18 (305)
Operating Margin . . . . . . . . . . . . . . . . . . . . . . . . . . . . . . . . . . . . . . . . . . . . 2.8% 0.2% (4.4)%
13
2011 Compared to 2010
North American Tire unit sales in 2011 decreased 0.7 million units, or 0.9%, from the 2010 period. The decreasewas primarily related to a decrease in replacement volume of 0.8 million units, or 1.6%, primarily in ourconsumer business reflecting lower industry demand. OE volume remained relatively flat with increases in ourcommercial business offsetting decreases in our consumer business.
Net sales in 2011 were $9,859 million, increasing $1,654 million, or 20.2%, compared to $8,205 million in2010 due primarily to improved price and product mix of $1,000 million, increased sales in other tire-relatedbusinesses of $677 million primarily related to an increase in the price and volume of third party sales ofchemical products, and favorable foreign currency translation of $28 million. Lower sales volume of $54 millionpartially offset these improvements.
Operating income in 2011 was $276 million, improving $258 million from $18 million in 2010. Price andproduct mix improved $883 million, which more than offset raw material cost increases of $706 million.Operating income also benefited from decreased SAG expenses of $53 million, increased operating income inour other tire-related businesses of $30 million driven by increased profits for our aviation products and in ourretail tire businesses, and favorable foreign currency translation of $12 million. Conversion costs, which were flatcompared to the prior year, benefited from lower under-absorbed fixed overhead costs of approximately$96 million due to higher production volume and decreased pension expense of $35 million. These benefits wereoffset by higher profit sharing costs of $55 million, increased workers compensation of $15 million, andinflation. Lower volume of $5 million served to partially offset the improvement in operating income. Thedecrease in SAG expense was driven by lower general and product liability expenses of $52 million. Conversioncosts and SAG expenses included savings from rationalization plans of $16 million and $11 million, respectively.
Operating income in 2011 excluded net rationalization charges of $72 million and charges for accelerateddepreciation and asset write-offs of $43 million, primarily related to the closure of our Union City, Tennesseemanufacturing facility, and net losses on asset sales of $2 million. Operating income in 2010 excluded netrationalization charges of $184 million and charges for accelerated depreciation and asset write-offs of $2million, primarily related to the closure of our Union City, Tennessee manufacturing facility, and net gains onasset sales of $2 million.
2010 Compared to 2009
North American Tire unit sales in 2010 increased 4.0 million units, or 6.3%, from the 2009 period. The increasewas primarily related to an increase in OE volume of 3.2 million units, or 25.4%, primarily in our consumerbusiness, due to increased vehicle production. Replacement volume increased 0.8 million units, or 1.4%, dueprimarily to improved industry volumes driven by economic growth.
Net sales in 2010 increased $1,228 million, or 17.6%, compared to 2009 due primarily to increased sales inother tire-related businesses of $610 million, primarily related to an increase in the price and volume of thirdparty sales of chemical products. Higher tire volume of $304 million, improved price and product mix of$269 million and favorable foreign currency translation of $39 million also contributed to the growth in net sales.
Operating income in 2010 was $18 million, improving $323 million from a loss of $305 million in 2009.Price and product mix improved $260 million, which more than offset raw material cost increases of$177 million. Operating income also benefited from lower conversion costs of $171 million, increased operatingincome in our other tire-related business of $47 million, primarily related to sales of chemical products, highertire volume of $26 million and lower transportation costs of $20 million. The decrease in conversion costs wasprimarily driven by lower under-absorbed fixed overhead costs of $119 million due to higher production volumeand savings from rationalization plans of $55 million. Lower employee benefit costs and productivityimprovements were offset by inflation and higher profit sharing costs. SAG expense increased $15 million drivenby increased advertising costs of $15 million and higher general and product liability expenses of $14 millionpartially offset by savings from rationalization plans of $8 million and lower bad debt expense of $6 million.
Operating income in 2010 excluded net rationalization charges of $184 million primarily related to theclosure of our Union City, Tennessee manufacturing facility, net gains on asset sales of $2 million and charges
14
for accelerated depreciation of $2 million. Operating loss in 2009 excluded net rationalization charges of$112 million, charges for accelerated depreciation and asset write-offs of $16 million, and net gains on assetsales of $4 million.
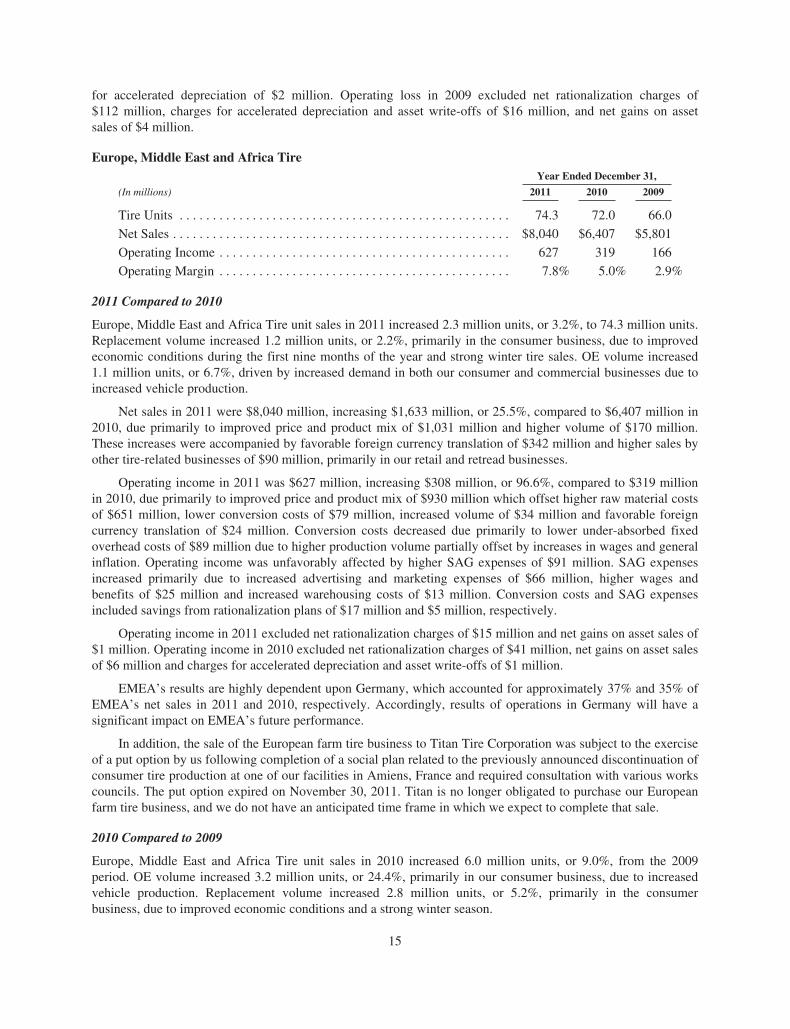
Europe, Middle East and Africa TireYear Ended December 31,
(In millions) 2011 2010 2009
Tire Units . . . . . . . . . . . . . . . . . . . . . . . . . . . . . . . . . . . . . . . . . . . . . . . . . . 74.3 72.0 66.0
Net Sales . . . . . . . . . . . . . . . . . . . . . . . . . . . . . . . . . . . . . . . . . . . . . . . . . . . $8,040 $6,407 $5,801
Operating Income . . . . . . . . . . . . . . . . . . . . . . . . . . . . . . . . . . . . . . . . . . . . 627 319 166
Operating Margin . . . . . . . . . . . . . . . . . . . . . . . . . . . . . . . . . . . . . . . . . . . . 7.8% 5.0% 2.9%
2011 Compared to 2010
Europe, Middle East and Africa Tire unit sales in 2011 increased 2.3 million units, or 3.2%, to 74.3 million units.Replacement volume increased 1.2 million units, or 2.2%, primarily in the consumer business, due to improvedeconomic conditions during the first nine months of the year and strong winter tire sales. OE volume increased1.1 million units, or 6.7%, driven by increased demand in both our consumer and commercial businesses due toincreased vehicle production.
Net sales in 2011 were $8,040 million, increasing $1,633 million, or 25.5%, compared to $6,407 million in2010, due primarily to improved price and product mix of $1,031 million and higher volume of $170 million.These increases were accompanied by favorable foreign currency translation of $342 million and higher sales byother tire-related businesses of $90 million, primarily in our retail and retread businesses.
Operating income in 2011 was $627 million, increasing $308 million, or 96.6%, compared to $319 millionin 2010, due primarily to improved price and product mix of $930 million which offset higher raw material costsof $651 million, lower conversion costs of $79 million, increased volume of $34 million and favorable foreigncurrency translation of $24 million. Conversion costs decreased due primarily to lower under-absorbed fixedoverhead costs of $89 million due to higher production volume partially offset by increases in wages and generalinflation. Operating income was unfavorably affected by higher SAG expenses of $91 million. SAG expensesincreased primarily due to increased advertising and marketing expenses of $66 million, higher wages andbenefits of $25 million and increased warehousing costs of $13 million. Conversion costs and SAG expensesincluded savings from rationalization plans of $17 million and $5 million, respectively.
Operating income in 2011 excluded net rationalization charges of $15 million and net gains on asset sales of$1 million. Operating income in 2010 excluded net rationalization charges of $41 million, net gains on asset salesof $6 million and charges for accelerated depreciation and asset write-offs of $1 million.
EMEA’s results are highly dependent upon Germany, which accounted for approximately 37% and 35% ofEMEA’s net sales in 2011 and 2010, respectively. Accordingly, results of operations in Germany will have asignificant impact on EMEA’s future performance.
In addition, the sale of the European farm tire business to Titan Tire Corporation was subject to the exerciseof a put option by us following completion of a social plan related to the previously announced discontinuation ofconsumer tire production at one of our facilities in Amiens, France and required consultation with various workscouncils. The put option expired on November 30, 2011. Titan is no longer obligated to purchase our Europeanfarm tire business, and we do not have an anticipated time frame in which we expect to complete that sale.
2010 Compared to 2009
Europe, Middle East and Africa Tire unit sales in 2010 increased 6.0 million units, or 9.0%, from the 2009period. OE volume increased 3.2 million units, or 24.4%, primarily in our consumer business, due to increasedvehicle production. Replacement volume increased 2.8 million units, or 5.2%, primarily in the consumerbusiness, due to improved economic conditions and a strong winter season.
15
Net sales in 2010 increased $606 million, or 10.4%, compared to 2009, due primarily to higher volume of$454 million and improved price and product mix of $356 million. These increases were partially offset byunfavorable foreign currency translation of $193 million.
Operating income in 2010 increased $153 million, or 92.2%, compared to 2009, due primarily to lowerconversion costs of $174 million and increased volume of $118 million. Conversion costs decreased dueprimarily to lower under-absorbed fixed overhead costs of $108 million due to higher production volume.Operating income was unfavorably affected by higher raw material costs of $182 million, which were partiallyoffset by improved price and product mix of $131 million, higher SAG expenses of $73 million, and unfavorableforeign currency translation of $17 million. SAG expenses increased due to higher wages and benefits of$35 million and increased advertising expenses of $26 million. Conversion costs and SAG expenses includedsavings from rationalization plans of $12 million and $7 million, respectively.
Operating income in 2010 excluded net rationalization charges of $41 million, net gains on asset sales of$6 million and charges for accelerated depreciation and asset write-offs of $1 million. Operating income in 2009excluded net rationalization charges of $82 million and net gains on asset sales of $1 million.
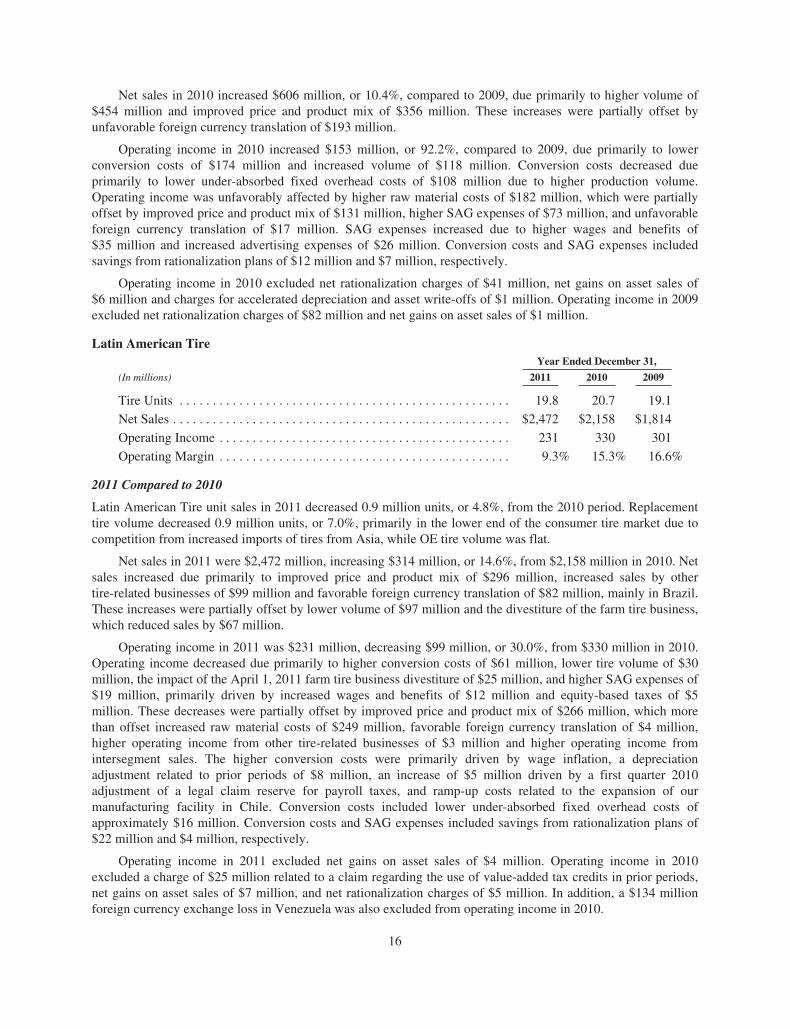
Latin American TireYear Ended December 31,
(In millions) 2011 2010 2009
Tire Units . . . . . . . . . . . . . . . . . . . . . . . . . . . . . . . . . . . . . . . . . . . . . . . . . . 19.8 20.7 19.1
Net Sales . . . . . . . . . . . . . . . . . . . . . . . . . . . . . . . . . . . . . . . . . . . . . . . . . . . $2,472 $2,158 $1,814
Operating Income . . . . . . . . . . . . . . . . . . . . . . . . . . . . . . . . . . . . . . . . . . . . 231 330 301
Operating Margin . . . . . . . . . . . . . . . . . . . . . . . . . . . . . . . . . . . . . . . . . . . . 9.3% 15.3% 16.6%
2011 Compared to 2010
Latin American Tire unit sales in 2011 decreased 0.9 million units, or 4.8%, from the 2010 period. Replacementtire volume decreased 0.9 million units, or 7.0%, primarily in the lower end of the consumer tire market due tocompetition from increased imports of tires from Asia, while OE tire volume was flat.
Net sales in 2011 were $2,472 million, increasing $314 million, or 14.6%, from $2,158 million in 2010. Netsales increased due primarily to improved price and product mix of $296 million, increased sales by othertire-related businesses of $99 million and favorable foreign currency translation of $82 million, mainly in Brazil.These increases were partially offset by lower volume of $97 million and the divestiture of the farm tire business,which reduced sales by $67 million.
Operating income in 2011 was $231 million, decreasing $99 million, or 30.0%, from $330 million in 2010.Operating income decreased due primarily to higher conversion costs of $61 million, lower tire volume of $30million, the impact of the April 1, 2011 farm tire business divestiture of $25 million, and higher SAG expenses of$19 million, primarily driven by increased wages and benefits of $12 million and equity-based taxes of $5million. These decreases were partially offset by improved price and product mix of $266 million, which morethan offset increased raw material costs of $249 million, favorable foreign currency translation of $4 million,higher operating income from other tire-related businesses of $3 million and higher operating income fromintersegment sales. The higher conversion costs were primarily driven by wage inflation, a depreciationadjustment related to prior periods of $8 million, an increase of $5 million driven by a first quarter 2010adjustment of a legal claim reserve for payroll taxes, and ramp-up costs related to the expansion of ourmanufacturing facility in Chile. Conversion costs included lower under-absorbed fixed overhead costs ofapproximately $16 million. Conversion costs and SAG expenses included savings from rationalization plans of$22 million and $4 million, respectively.
Operating income in 2011 excluded net gains on asset sales of $4 million. Operating income in 2010excluded a charge of $25 million related to a claim regarding the use of value-added tax credits in prior periods,net gains on asset sales of $7 million, and net rationalization charges of $5 million. In addition, a $134 millionforeign currency exchange loss in Venezuela was also excluded from operating income in 2010.
16
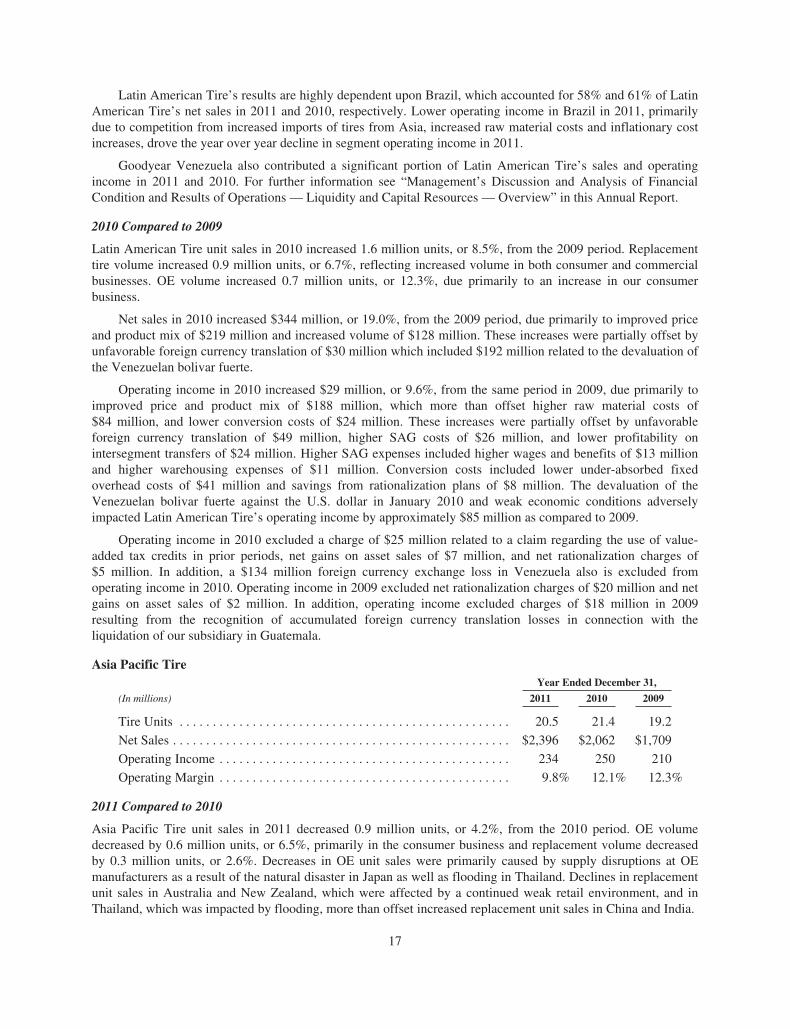
Latin American Tire’s results are highly dependent upon Brazil, which accounted for 58% and 61% of LatinAmerican Tire’s net sales in 2011 and 2010, respectively. Lower operating income in Brazil in 2011, primarilydue to competition from increased imports of tires from Asia, increased raw material costs and inflationary costincreases, drove the year over year decline in segment operating income in 2011.
Goodyear Venezuela also contributed a significant portion of Latin American Tire’s sales and operatingincome in 2011 and 2010. For further information see “Management’s Discussion and Analysis of FinancialCondition and Results of Operations — Liquidity and Capital Resources — Overview” in this Annual Report.
2010 Compared to 2009
Latin American Tire unit sales in 2010 increased 1.6 million units, or 8.5%, from the 2009 period. Replacementtire volume increased 0.9 million units, or 6.7%, reflecting increased volume in both consumer and commercialbusinesses. OE volume increased 0.7 million units, or 12.3%, due primarily to an increase in our consumerbusiness.
Net sales in 2010 increased $344 million, or 19.0%, from the 2009 period, due primarily to improved priceand product mix of $219 million and increased volume of $128 million. These increases were partially offset byunfavorable foreign currency translation of $30 million which included $192 million related to the devaluation ofthe Venezuelan bolivar fuerte.
Operating income in 2010 increased $29 million, or 9.6%, from the same period in 2009, due primarily toimproved price and product mix of $188 million, which more than offset higher raw material costs of$84 million, and lower conversion costs of $24 million. These increases were partially offset by unfavorableforeign currency translation of $49 million, higher SAG costs of $26 million, and lower profitability onintersegment transfers of $24 million. Higher SAG expenses included higher wages and benefits of $13 millionand higher warehousing expenses of $11 million. Conversion costs included lower under-absorbed fixedoverhead costs of $41 million and savings from rationalization plans of $8 million. The devaluation of theVenezuelan bolivar fuerte against the U.S. dollar in January 2010 and weak economic conditions adverselyimpacted Latin American Tire’s operating income by approximately $85 million as compared to 2009.
Operating income in 2010 excluded a charge of $25 million related to a claim regarding the use of value-added tax credits in prior periods, net gains on asset sales of $7 million, and net rationalization charges of$5 million. In addition, a $134 million foreign currency exchange loss in Venezuela also is excluded fromoperating income in 2010. Operating income in 2009 excluded net rationalization charges of $20 million and netgains on asset sales of $2 million. In addition, operating income excluded charges of $18 million in 2009resulting from the recognition of accumulated foreign currency translation losses in connection with theliquidation of our subsidiary in Guatemala.
Asia Pacific TireYear Ended December 31,
(In millions) 2011 2010 2009
Tire Units . . . . . . . . . . . . . . . . . . . . . . . . . . . . . . . . . . . . . . . . . . . . . . . . . . 20.5 21.4 19.2
Net Sales . . . . . . . . . . . . . . . . . . . . . . . . . . . . . . . . . . . . . . . . . . . . . . . . . . . $2,396 $2,062 $1,709
Operating Income . . . . . . . . . . . . . . . . . . . . . . . . . . . . . . . . . . . . . . . . . . . . 234 250 210
Operating Margin . . . . . . . . . . . . . . . . . . . . . . . . . . . . . . . . . . . . . . . . . . . . 9.8% 12.1% 12.3%
2011 Compared to 2010
Asia Pacific Tire unit sales in 2011 decreased 0.9 million units, or 4.2%, from the 2010 period. OE volumedecreased by 0.6 million units, or 6.5%, primarily in the consumer business and replacement volume decreasedby 0.3 million units, or 2.6%. Decreases in OE unit sales were primarily caused by supply disruptions at OEmanufacturers as a result of the natural disaster in Japan as well as flooding in Thailand. Declines in replacementunit sales in Australia and New Zealand, which were affected by a continued weak retail environment, and inThailand, which was impacted by flooding, more than offset increased replacement unit sales in China and India.
17
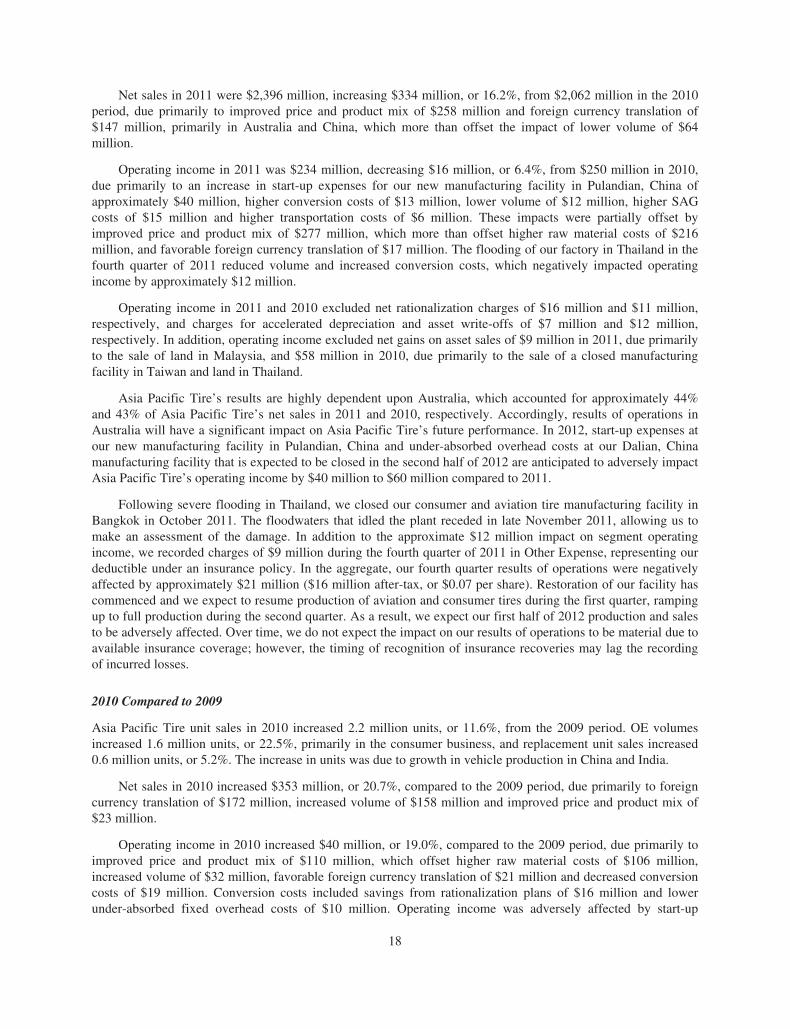
Net sales in 2011 were $2,396 million, increasing $334 million, or 16.2%, from $2,062 million in the 2010period, due primarily to improved price and product mix of $258 million and foreign currency translation of$147 million, primarily in Australia and China, which more than offset the impact of lower volume of $64million.
Operating income in 2011 was $234 million, decreasing $16 million, or 6.4%, from $250 million in 2010,due primarily to an increase in start-up expenses for our new manufacturing facility in Pulandian, China ofapproximately $40 million, higher conversion costs of $13 million, lower volume of $12 million, higher SAGcosts of $15 million and higher transportation costs of $6 million. These impacts were partially offset byimproved price and product mix of $277 million, which more than offset higher raw material costs of $216million, and favorable foreign currency translation of $17 million. The flooding of our factory in Thailand in thefourth quarter of 2011 reduced volume and increased conversion costs, which negatively impacted operatingincome by approximately $12 million.
Operating income in 2011 and 2010 excluded net rationalization charges of $16 million and $11 million,respectively, and charges for accelerated depreciation and asset write-offs of $7 million and $12 million,respectively. In addition, operating income excluded net gains on asset sales of $9 million in 2011, due primarilyto the sale of land in Malaysia, and $58 million in 2010, due primarily to the sale of a closed manufacturingfacility in Taiwan and land in Thailand.
Asia Pacific Tire’s results are highly dependent upon Australia, which accounted for approximately 44%and 43% of Asia Pacific Tire’s net sales in 2011 and 2010, respectively. Accordingly, results of operations inAustralia will have a significant impact on Asia Pacific Tire’s future performance. In 2012, start-up expenses atour new manufacturing facility in Pulandian, China and under-absorbed overhead costs at our Dalian, Chinamanufacturing facility that is expected to be closed in the second half of 2012 are anticipated to adversely impactAsia Pacific Tire’s operating income by $40 million to $60 million compared to 2011.
Following severe flooding in Thailand, we closed our consumer and aviation tire manufacturing facility inBangkok in October 2011. The floodwaters that idled the plant receded in late November 2011, allowing us tomake an assessment of the damage. In addition to the approximate $12 million impact on segment operatingincome, we recorded charges of $9 million during the fourth quarter of 2011 in Other Expense, representing ourdeductible under an insurance policy. In the aggregate, our fourth quarter results of operations were negativelyaffected by approximately $21 million ($16 million after-tax, or $0.07 per share). Restoration of our facility hascommenced and we expect to resume production of aviation and consumer tires during the first quarter, rampingup to full production during the second quarter. As a result, we expect our first half of 2012 production and salesto be adversely affected. Over time, we do not expect the impact on our results of operations to be material due toavailable insurance coverage; however, the timing of recognition of insurance recoveries may lag the recordingof incurred losses.
2010 Compared to 2009
Asia Pacific Tire unit sales in 2010 increased 2.2 million units, or 11.6%, from the 2009 period. OE volumesincreased 1.6 million units, or 22.5%, primarily in the consumer business, and replacement unit sales increased0.6 million units, or 5.2%. The increase in units was due to growth in vehicle production in China and India.
Net sales in 2010 increased $353 million, or 20.7%, compared to the 2009 period, due primarily to foreigncurrency translation of $172 million, increased volume of $158 million and improved price and product mix of$23 million.
Operating income in 2010 increased $40 million, or 19.0%, compared to the 2009 period, due primarily toimproved price and product mix of $110 million, which offset higher raw material costs of $106 million,increased volume of $32 million, favorable foreign currency translation of $21 million and decreased conversioncosts of $19 million. Conversion costs included savings from rationalization plans of $16 million and lowerunder-absorbed fixed overhead costs of $10 million. Operating income was adversely affected by start-up
18
expenses for our new manufacturing facility in Pulandian, China of approximately $10 million and higher SAGcosts of $22 million, including increased wages and benefits of $9 million. Operating income in 2009 included again of $7 million from insurance proceeds related to the settlement of a claim as a result of a fire at ourmanufacturing facility in Thailand in 2007.
Operating income in 2010 and 2009 excluded charges for accelerated depreciation and asset write-offs of$12 million and $26 million, respectively, and net rationalization charges of $11 million and $10 million,respectively. In addition, operating income excluded net gains on asset sales of $58 million and $5 million in2010 and 2009, respectively, due primarily to the sale of a closed manufacturing facility in Taiwan and land inThailand in 2010.
CRITICAL ACCOUNTING POLICIES
The preparation of financial statements in conformity with generally accepted accounting principles requiresmanagement to make estimates and assumptions that affect the amounts reported in the consolidated financialstatements and related notes to the financial statements. On an ongoing basis, management reviews its estimates,based on currently available information. Changes in facts and circumstances may alter such estimates and affectour results of operations and financial position in future periods. Our critical accounting policies relate to:
• general and product liability and other litigation,
• workers’ compensation,
• recoverability of goodwill,
• deferred tax asset valuation allowances and uncertain income tax positions, and
• pensions and other postretirement benefits.
General and Product Liability and Other Litigation. General and product liability and other recorded litigationliabilities are recorded based on management’s assessment that a loss arising from these matters is probable. Ifthe loss can be reasonably estimated, we record the amount of the estimated loss. If the loss is estimated within arange and no point within the range is more probable than another, we record the minimum amount in the range.As additional information becomes available, any potential liability related to these matters is assessed and theestimates are revised, if necessary. Loss ranges are based upon the specific facts of each claim or class of claimsand are determined after review by counsel. Court rulings on our cases or similar cases may impact ourassessment of the probability and our estimate of the loss, which may have an impact on our reported results ofoperations, financial position and liquidity. We record receivables for insurance recoveries related to ourlitigation claims when it is probable that we will receive reimbursement from the insurer. Specifically, we are adefendant in numerous lawsuits alleging various asbestos-related personal injuries purported to result fromalleged exposure to asbestos in certain products manufactured by us or present in certain of our facilities.Typically, these lawsuits have been brought against multiple defendants in Federal and state courts.
A significant assumption in our estimated asbestos liability is the period over which the liability can bereasonably estimated. Due to the difficulties in making these estimates, analysis based on new data and/orchanged circumstances arising in the future may result in an increase in the recorded obligation in an amount thatcannot be reasonably estimated, and that increase may be significant. We had recorded gross liabilities for bothasserted and unasserted asbestos claims, inclusive of defense costs, totaling $138 million at December 31, 2011.The portion of the liability associated with unasserted asbestos claims and related defense costs was $64 million.At December 31, 2011, we estimate that it is reasonably possible that our gross liabilities, net of our estimate forprobable insurance recoveries, could exceed our recorded amounts by approximately $10 million.
We maintain primary insurance coverage under coverage-in-place agreements, and also have excess liabilityinsurance with respect to asbestos liabilities. We record a receivable with respect to such policies when wedetermine that recovery is probable and we can reasonably estimate the amount of a particular recovery. Thisdetermination is based on consultation with our outside legal counsel and taking into consideration agreementswith certain of our insurance carriers, the financial viability and legal obligations of our insurance carriers andother relevant factors.
19
As of December 31, 2011, we recorded a receivable related to asbestos claims of $67 million, and we expectthat approximately 50% of asbestos claim related losses would be recoverable through insurance through theperiod covered by the estimated liability. Of this amount, $8 million was included in Current Assets as part ofAccounts receivable at December 31, 2011. The recorded receivable consists of an amount we expect to collectunder coverage-in-place agreements with certain primary carriers as well as an amount we believe is probable ofrecovery from certain of our excess coverage insurance carriers.
Workers’ Compensation. We had recorded liabilities, on a discounted basis, of $302 million for anticipatedcosts related to U.S. workers’ compensation claims at December 31, 2011. The costs include an estimate ofexpected settlements on pending claims, defense costs and a provision for claims incurred but not reported. Theseestimates are based on our assessment of potential liability using an analysis of available information withrespect to pending claims, historical experience and current cost trends. The amount of our ultimate liability inrespect of these matters may differ from these estimates. We periodically, and at least annually, update our lossdevelopment factors based on actuarial analyses. The liability is discounted using the risk-free rate of return.
For further information on general and product liability and other litigation, and workers’ compensation,refer to the Note to the Consolidated Financial Statements No. 19, Commitments and Contingent Liabilities.
Recoverability of Goodwill. Goodwill is tested for impairment annually or more frequently if an indicator ofimpairment is present. Goodwill totaled $654 million at December 31, 2011.
We have determined our reporting units to be consistent with our operating segments comprised of fourstrategic business units: North American Tire, Europe, Middle East and Africa Tire, Latin American Tire andAsia Pacific Tire. Goodwill is allocated to these reporting units based on the original purchase price allocationfor acquisitions within the various reporting units. There have been no changes to our reporting units or in themanner in which goodwill was allocated in 2011.
FASB Accounting Standard Update No. 2011-08 Intangibles — Goodwill and Other Topics was issued inSeptember 2011 and allows an entity to first assess qualitative factors to determine if it is more likely than notthat the fair value of a reporting unit is less than its carrying amount and if a quantitative assessment should beperformed. We adopted this standard update in the third quarter in connection with our July 31, 2011 annualimpairment assessment and performed a qualitative analysis. After considering changes to assumptions used inthe prior year test, including the capital markets environment, global economic conditions, tire industrycompetition and trends, and improvements in our results of operations, as well as the excess of fair value over thecarrying amount of each reporting unit as determined in our 2010 annual testing of 40% for North American Tire,over 45% for EMEA and over 20% for Asia Pacific Tire, and other factors, we concluded it was more likely thannot that the fair value of each reporting unit was not less than its carrying value and, therefore, did not perform aquantitative analysis. Accordingly, the annual impairment test at July 31, 2011 indicated there was noimpairment of goodwill.
Deferred Tax Asset Valuation Allowances and Uncertain Income Tax Positions. At December 31, 2011, we hadvaluation allowances aggregating $3.1 billion against all of our net Federal and state and certain of our foreignnet deferred tax assets.
We assess both negative and positive evidence when measuring the need for a valuation allowance.Evidence, such as operating results during the most recent three-year period, is given more weight than ourexpectations of future profitability, which are inherently uncertain. Our losses in the U.S. and certain foreignlocations in recent periods represented sufficient negative evidence to require a full valuation allowance againstour net Federal, state and certain of our foreign deferred tax assets. We intend to maintain valuation allowancesagainst our net deferred tax assets until sufficient positive evidence exists to support the realization of suchassets.
The calculation of our tax liabilities involves dealing with uncertainties in the application of complex taxregulations. We recognize liabilities for anticipated tax audit issues based on our estimate of whether, and theextent to which, additional taxes will be due. If we ultimately determine that payment of these amounts isunnecessary, we reverse the liability and recognize a tax benefit during the period in which we determine that the
20
liability is no longer necessary. We also recognize tax benefits to the extent that it is more likely than not that ourpositions will be sustained when challenged by the taxing authorities. We derecognize tax benefits when basedon new information we determine that it is no longer more likely than not that our position will be sustained. Tothe extent we prevail in matters for which liabilities have been established, or determine we need to derecognizetax benefits recorded in prior periods, or that we are required to pay amounts in excess of our liabilities, oureffective tax rate in a given period could be materially affected. An unfavorable tax settlement would require useof our cash and result in an increase in our effective tax rate in the period of resolution. A favorable taxsettlement would be recognized as a reduction in our effective tax rate in the period of resolution. We reportinterest and penalties related to uncertain income tax positions as income taxes. For additional informationregarding uncertain income tax positions, refer to the Note to the Consolidated Financial Statements No. 6,Income Taxes.
Pensions and Other Postretirement Benefits. Our recorded liabilities for pensions and other postretirementbenefits are based on a number of assumptions, including:
• life expectancies,
• retirement rates,
• discount rates,
• long term rates of return on plan assets,
• inflation rates,
• future compensation levels,
• future health care costs, and
• maximum company-covered benefit costs.
Certain of these assumptions are determined with the assistance of independent actuaries. Assumptions about lifeexpectancies, retirement rates, future compensation levels and future health care costs are based on pastexperience and anticipated future trends. The discount rate for our U.S. plans is based on a yield curve derivedfrom a portfolio of corporate bonds from issuers rated Aa or higher as of December 31 and is reviewed annually.Our expected benefit payment cash flows are discounted based on spot rates developed from the yield curve. Thelong term rate of return on plan assets is based on the compound annualized return of our U.S. pension fund overa period of 15 years or more, estimates of future long term rates of return on assets similar to the target allocationof our pension fund and long term inflation. Actual U.S. pension fund asset allocations are reviewed on amonthly basis and the pension fund is rebalanced to target ranges on an as-needed basis. These assumptions arereviewed regularly and revised when appropriate. Changes in one or more of them may affect the amount of ourrecorded liabilities and net periodic costs for these benefits. Other assumptions involving demographic factorssuch as retirement age, mortality and turnover are evaluated periodically and are updated to reflect ourexperience and expectations for the future. If the actual experience differs from expectations, our financialposition, results of operations and liquidity in future periods may be affected.
The weighted average discount rate used in estimating the total liability for our U.S. pension and otherpostretirement benefit plans was 4.52% and 4.12%, respectively, at December 31, 2011, compared to 5.20% and4.62% for our U.S. pension and other postretirement benefit plans, respectively, at December 31, 2010. Thedecrease in the discount rate at December 31, 2011 was due primarily to lower interest rate yields on highly ratedcorporate bonds. Interest cost included in our U.S. net periodic pension cost was $283 million in 2011, comparedto $296 million in 2010 and $314 million in 2009. Interest cost included in our worldwide net periodic otherpostretirement benefits cost was $30 million in 2011, compared to $33 million in 2010 and $32 million in 2009.
21
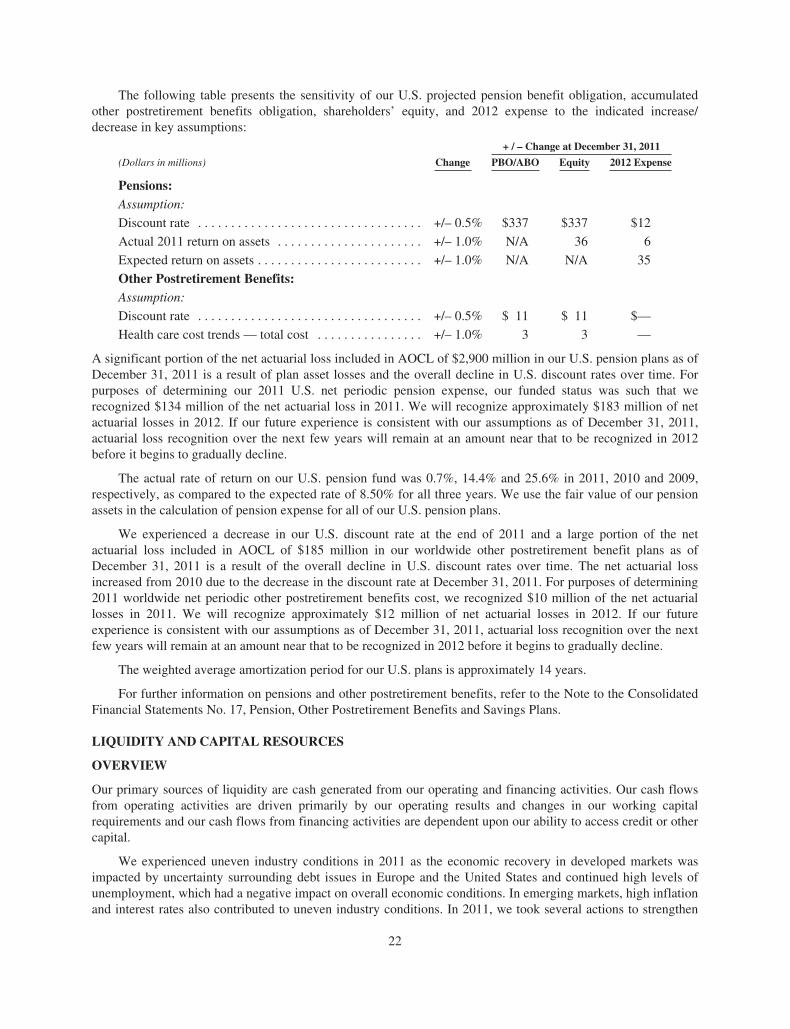
The following table presents the sensitivity of our U.S. projected pension benefit obligation, accumulatedother postretirement benefits obligation, shareholders’ equity, and 2012 expense to the indicated increase/decrease in key assumptions:
+ / – Change at December 31, 2011
(Dollars in millions) Change PBO/ABO Equity 2012 Expense
Pensions:Assumption:
Discount rate . . . . . . . . . . . . . . . . . . . . . . . . . . . . . . . . . . +/– 0.5% $337 $337 $12
Actual 2011 return on assets . . . . . . . . . . . . . . . . . . . . . . +/– 1.0% N/A 36 6
Expected return on assets . . . . . . . . . . . . . . . . . . . . . . . . . +/– 1.0% N/A N/A 35
Other Postretirement Benefits:Assumption:
Discount rate . . . . . . . . . . . . . . . . . . . . . . . . . . . . . . . . . . +/– 0.5% $ 11 $ 11 $—
Health care cost trends — total cost . . . . . . . . . . . . . . . . +/– 1.0% 3 3 —
A significant portion of the net actuarial loss included in AOCL of $2,900 million in our U.S. pension plans as ofDecember 31, 2011 is a result of plan asset losses and the overall decline in U.S. discount rates over time. Forpurposes of determining our 2011 U.S. net periodic pension expense, our funded status was such that werecognized $134 million of the net actuarial loss in 2011. We will recognize approximately $183 million of netactuarial losses in 2012. If our future experience is consistent with our assumptions as of December 31, 2011,actuarial loss recognition over the next few years will remain at an amount near that to be recognized in 2012before it begins to gradually decline.
The actual rate of return on our U.S. pension fund was 0.7%, 14.4% and 25.6% in 2011, 2010 and 2009,respectively, as compared to the expected rate of 8.50% for all three years. We use the fair value of our pensionassets in the calculation of pension expense for all of our U.S. pension plans.
We experienced a decrease in our U.S. discount rate at the end of 2011 and a large portion of the netactuarial loss included in AOCL of $185 million in our worldwide other postretirement benefit plans as ofDecember 31, 2011 is a result of the overall decline in U.S. discount rates over time. The net actuarial lossincreased from 2010 due to the decrease in the discount rate at December 31, 2011. For purposes of determining2011 worldwide net periodic other postretirement benefits cost, we recognized $10 million of the net actuariallosses in 2011. We will recognize approximately $12 million of net actuarial losses in 2012. If our futureexperience is consistent with our assumptions as of December 31, 2011, actuarial loss recognition over the nextfew years will remain at an amount near that to be recognized in 2012 before it begins to gradually decline.
The weighted average amortization period for our U.S. plans is approximately 14 years.
For further information on pensions and other postretirement benefits, refer to the Note to the ConsolidatedFinancial Statements No. 17, Pension, Other Postretirement Benefits and Savings Plans.
LIQUIDITY AND CAPITAL RESOURCES
OVERVIEW
Our primary sources of liquidity are cash generated from our operating and financing activities. Our cash flowsfrom operating activities are driven primarily by our operating results and changes in our working capitalrequirements and our cash flows from financing activities are dependent upon our ability to access credit or othercapital.
We experienced uneven industry conditions in 2011 as the economic recovery in developed markets wasimpacted by uncertainty surrounding debt issues in Europe and the United States and continued high levels ofunemployment, which had a negative impact on overall economic conditions. In emerging markets, high inflationand interest rates also contributed to uneven industry conditions. In 2011, we took several actions to strengthen
22
our balance sheet and improve our liquidity, including the issuance of our mandatory convertible preferred stock,the redemption of a portion of our 10.5% senior notes due 2016 with the proceeds of that equity offering, therefinancing of our European revolving credit facility and the issuance of euro-denominated notes by GDTE. AtDecember 31, 2011, we had solid liquidity, with approximately $5.3 billion of cash and cash equivalents andunused availability under our credit facilities.
For further information on the other strategic initiatives we pursued in 2011, see “Management’s Discussionand Analysis of Financial Condition and Results of Operations — Overview.”
At December 31, 2011, we had $2,772 million in Cash and cash equivalents, compared to $2,005 million atDecember 31, 2010. For the year ended December 31, 2011, net cash provided by operating activities was $773million. Net income of $417 million and non-cash depreciation and amortization of $715 million were partiallyoffset by working capital expenditures of $650 million. Higher raw material costs and increased selling pricesdrove the increase in working capital, while higher inventory units to support customer service levels and weakerindustry sales in the fourth quarter, primarily in EMEA, also contributed. For the year ended December 31, 2011,net cash used by investing activities was $902 million and net cash provided by financing activities was $994million. Cash and cash equivalents were favorably affected by the net proceeds from the issuance of ourmandatory convertible preferred stock of $484 million and the issuance of €250 million aggregate principalamount of 6.75% senior notes due 2019. Partially offsetting these increases in Cash and cash equivalents werecapital expenditures of $1,043 million and the redemption of $350 million of our 10.5% senior notes due 2016.
At December 31, 2011 and 2010, we had $2,544 million and $2,475 million, respectively, of unusedavailability under our various credit agreements. The table below provides unused availability by our significantcredit facilities as of December 31:
(In millions) 2011 2010
First lien revolving credit facility . . . . . . . . . . . . . . . . . . . . . . . . . . . . . . . . . . . . . . . . $1,093 $1,001
European revolving credit facility . . . . . . . . . . . . . . . . . . . . . . . . . . . . . . . . . . . . . . . . 511 664
Chinese credit facilities . . . . . . . . . . . . . . . . . . . . . . . . . . . . . . . . . . . . . . . . . . . . . . . . 188 394
Other domestic and international debt . . . . . . . . . . . . . . . . . . . . . . . . . . . . . . . . . . . . 410 158
Notes payable and overdrafts . . . . . . . . . . . . . . . . . . . . . . . . . . . . . . . . . . . . . . . . . . . 342 258
$2,544 $2,475
At December 31, 2011, our unused availability included $188 million that can only be used to finance therelocation and expansion of our manufacturing facility in China. These credit facilities, along with governmentgrants, should provide funding for most of the cost related to the relocation and expansion of our manufacturingfacility. There were $389 million of borrowings outstanding under these credit facilities at December 31, 2011.
We have deposited our cash and cash equivalents and entered into various credit agreements and derivativecontracts with financial institutions that we considered to be substantial and creditworthy at the time of suchtransactions. We seek to control our exposure to these financial institutions by diversifying our deposits, creditagreements and derivative contracts across multiple financial institutions, by setting deposit and counterpartycredit limits based on long term credit ratings and other indicators of credit risk such as credit default swapspreads, and by monitoring the financial strength of these financial institutions on a regular basis. We also enterinto master netting agreements with counterparties when possible. By controlling and monitoring exposure tofinancial institutions in this manner, we believe that we effectively manage the risk of loss due tononperformance by a financial institution. However, we cannot provide assurance that we will not experiencelosses or delays in accessing our deposits or lines of credit due to the nonperformance of a financial institution.Our inability to access our cash deposits or make draws on our lines of credit, or the inability of a counterparty tofulfill its contractual obligations to us, could have a material adverse effect on our liquidity, financial position orresults of operations in the period in which it occurs.
In 2012, we expect our operating needs to include global contributions to our funded pension plans ofapproximately $550 million to $600 million and our investing needs to include capital expenditures of
23
approximately $1.1 billion to $1.3 billion. We also expect interest expense to range between $360 million and$385 million and, when and if future dividends are declared, dividends on our mandatory convertible preferredstock to be $29 million. We intend to operate the business in a way that allows us to address these needs with ourexisting cash and available credit if they cannot be funded by cash generated from operations.
The Preservation of Access to Care for Medicare Beneficiaries and Pension Relief Act of 2010 (the“Pension Relief Act”) provides funding relief for defined benefit pension plan sponsors by deferring near-termcontributions. As allowed by the Pension Relief Act, we elected funding relief for the 2009 and 2011 plan years.Funding relief delays certain funding requirements for the elected plan years to years after 2014 and is expectedto reduce our total U.S. pension contributions in 2011 to 2014 by approximately $275 million to $325 million.Current low interest rates have increased our funding requirements, thereby offsetting much of the benefitprovided by funding relief. We currently estimate that we will be required to make contributions to our fundedU.S. pension plans of approximately $425 million to $450 million in 2012 and $425 million to $475 million in2013. If the current low interest rate environment continues without funding stabilization legislation, we willexperience additional increases in our funding obligations in 2014. For additional information, see“Management’s Discussion and Analysis of Financial Condition and Results of Operations — Commitments andContingent Liabilities.”
SRI has certain minority exit rights that, if triggered and exercised, could require us to make a substantialpayment to acquire SRI’s interests in GDTE and GDTNA following the determination of the fair value of SRI’sinterests. As of the date of this filing, SRI has not provided us notice of any exit rights that have becomeexercisable.
Our ability to service debt and operational requirements is also dependent, in part, on the ability of oursubsidiaries to make distributions of cash to various other entities in our consolidated group, whether in the formof dividends, loans or otherwise. In certain countries where we operate, such as China, Venezuela, and SouthAfrica, transfers of funds into or out of such countries by way of dividends, loans, advances or payments tothird-party or affiliated suppliers are generally or periodically subject to certain requirements, such as obtainingapproval from the foreign government and/or currency exchange board before net assets can be transferred out ofthe country. In addition, certain of our credit agreements and other debt instruments limit the ability of foreignsubsidiaries to make distributions of cash. Thus, we would have to repay and/or amend these credit agreementsand other debt instruments in order to use this cash to service our consolidated debt. Because of the inherentuncertainty of satisfactorily meeting these requirements or limitations, we do not consider the net assets of oursubsidiaries, including our Chinese, Venezuelan and South African subsidiaries, that are subject to suchrequirements or limitations to be integral to our liquidity or our ability to service our debt and operationalrequirements. At December 31, 2011, approximately $647 million of net assets, including $534 million of cashand cash equivalents, were subject to such requirements, including $291 million of cash in Venezuela. Therequirements we must comply with to transfer funds out of China and South Africa have not adversely impactedour ability to make transfers out of those countries.
Effective January 1, 2010, Venezuela’s economy was considered to be highly inflationary underU.S. generally accepted accounting principles since it experienced a rate of general inflation in excess of 100%over the latest three year period, based upon the blended Consumer Price Index and National Consumer PriceIndex. Accordingly, the U.S. dollar was determined to be the functional currency of our Venezuelan subsidiary.All gains and losses resulting from the remeasurement of its financial statements since January 1, 2010 weredetermined using official exchange rates and are reported in Other Expense. Venezuela remained a highlyinflationary economy for U.S. GAAP purposes during 2011.
On January 8, 2010, Venezuela established a two-tier exchange rate structure for essential and non-essentialgoods. For essential goods the official exchange rate was 2.6 bolivares fuertes to the U.S. dollar and fornon-essential goods the official exchange rate was 4.3 bolivares fuertes to the U.S. dollar. On January 1, 2011,the two-tier exchange rate structure was eliminated. For our unsettled amounts at December 31, 2010 and goingforward, the official exchange rate of 4.3 bolivares fuertes to the U.S. dollar is expected to be used forsubstantially all goods.
24
The $110 million foreign currency exchange loss in the first quarter of 2010 primarily consisted of a$157 million remeasurement loss on bolivar-denominated net monetary assets and liabilities, including deferredtaxes, at the time of the January 2010 devaluation. The loss was primarily related to cash deposits in Venezuelathat were remeasured at the official exchange rate of 4.3 bolivares fuertes applicable to non-essential goods, andwas partially offset by a $47 million subsidy receivable related to U.S. dollar-denominated payables that wereexpected to be settled at the official subsidy exchange rate of 2.6 bolivares fuertes applicable to essential goods.Since we expected these payables to be settled at the subsidy essential goods rate, we established a subsidyreceivable to reflect the expected benefit to be received in the form of the difference between the essential andnon-essential goods exchange rates. Throughout 2010, we periodically assessed our ability to realize the benefitof the subsidy receivable, and a substantial portion of purchases by our Venezuelan subsidiary had qualified andsettled at the official exchange rate for essential goods. As a result of the elimination of the official subsidyexchange rate for essential goods, we recorded a foreign exchange loss of $24 million in the fourth quarter of2010 related to the reversal of the subsidy receivable at December 31, 2010.
If in the future we convert bolivares fuertes at a rate other than the official exchange rate or the officialexchange rate is revised, we may realize additional losses that would be recorded in the Statement of Operations.At December 31, 2011, we had bolivar fuerte denominated monetary assets of $317 million, which consistedprimarily of $291 million of cash, $18 million of deferred tax assets and $8 million of accounts receivable, andbolivar fuerte denominated monetary liabilities of $152 million which consisted primarily of $92 million ofintercompany payables, including $59 million of dividends, $24 million of accounts payable — trade,$15 million of compensation and benefits and $14 million of income taxes payable. At December 31, 2010, wehad bolivar fuerte denominated monetary assets of $210 million, which consisted primarily of $188 million ofcash, $18 million of deferred tax assets and $4 million of accounts receivable, and bolivar fuerte denominatedmonetary liabilities of $75 million which consisted primarily of $48 million of intercompany payables, including$31 million of dividends, $12 million of accounts payable — trade and $7 million of compensation and benefits.All monetary assets and liabilities were remeasured at 4.3 bolivares fuertes to the U.S. dollar atDecember 31, 2011 and 2010.
Goodyear Venezuela’s sales were 1.5% and 1.2% of our net sales for the twelve months endedDecember 31, 2011 and 2010, respectively. Goodyear Venezuela’s cost of goods sold was 1.2% and 0.9% of ourcost of goods sold for the twelve months ended December 31, 2011 and 2010, respectively. GoodyearVenezuela’s sales are bolivar fuerte denominated and cost of goods sold are approximately 55% bolivar fuertedenominated and approximately 45% U.S. dollar-denominated. A further 10% decrease in the bolivar fuerteagainst the U.S. dollar would decrease Goodyear Venezuela’s sales and increase cost of goods sold byapproximately $39 million and approximately $26 million, respectively, on an annual basis.
During the twelve months ended December 31, 2011, Goodyear Venezuela settled $91 million and$12 million, respectively, of U.S. dollar-denominated intercompany payables and accounts payable — trade. Forthe twelve months ended December 31, 2011, 92% of those payables were settled at the official exchange rate of4.3 bolivares fuertes to the U.S. dollar and 8% were settled at the essential goods rate of 2.6 bolivar fuertes to theU.S. dollar. At December 31, 2011, settlements of U.S. dollar-denominated liabilities pending before thecurrency exchange board were $159 million, all of which are expected to settle at the official exchange rate of 4.3bolivares fuertes to the U.S. dollar. At December 31, 2011, $81 million of the requested settlements werepending up to 180 days, less than $1 million were pending from 180 to 360 days and $78 million were pendingover one year. Amounts pending up to 180 days include imported tires and raw materials of $43 million anddividends payable of $28 million, and amounts pending over one year include dividends payable of $31 million,imported tires of $17 million and intercompany charges for royalties of $17 million. Currency exchange controlsin Venezuela continue to limit our ability to remit funds from Venezuela.
Goodyear Venezuela contributed a significant portion of Latin American Tire’s sales and operating incomein 2011 and 2010. The devaluation of the Venezuelan bolivar fuerte against the U.S. dollar in January 2010 andweak economic conditions and operational disruptions in Venezuela adversely impacted Latin American Tire’soperating income in 2010. We continue to face operational challenges in Venezuela, including inflationary costpressures, high absenteeism, and difficulties importing raw materials and finished goods. In response to
25
conditions in Venezuela, we continue to evaluate the need to adjust prices for our products while remainingcompetitive and have taken steps to address our operational challenges, including securing necessary approvalsfor import licenses and increasing the local production of certain tires. Our pricing policies take into accountfactors such as fluctuations in raw material and other production costs, market demand and adherence togovernment price controls.
We believe that our liquidity position is adequate to fund our operating and investing needs and debtmaturities in 2012 and to provide us with flexibility to respond to further changes in the business environment. Ifmarket opportunities exist, we may choose to undertake additional financing actions in order to further enhanceour liquidity position, which could include obtaining new bank debt or capital markets transactions. However, thechallenges we face may cause a material reduction in our liquidity as a result of an adverse change in our cashflow from operations or our access to credit or other capital.
Cash Position
At December 31, 2011, significant concentrations of cash and cash equivalents held by our internationalsubsidiaries included the following amounts:
• $793 million or 29% in Europe, Middle East and Africa, primarily Luxembourg and South Africa ($415million or 21% at December 31, 2010),
• $430 million or 16% in Asia, primarily China, Australia and India ($393 million or 20% atDecember 31, 2010), and
• $527 million or 19% in Latin America, primarily Venezuela and Brazil ($368 million or 18% atDecember 31, 2010).
Operating Activities
Net cash provided by operations was $773 million in 2011, compared to $924 million in 2010 and $1,297 millionin 2009. Operating cash flows in 2011 were favorably impacted by the improvement in earnings compared to2010. Net cash used by working capital was $650 million in 2011, compared to net cash provided of $52 millionand $1,081 million in 2010 and 2009, respectively. The increase in cash used for working capital in 2011 wasdue primarily to higher raw material costs and increased selling prices, while higher inventory units to supportcustomer service levels and weaker industry sales in the fourth quarter, primarily in EMEA, also contributed.
Investing Activities
Net cash used in investing activities was $902 million in 2011, compared to $859 million in 2010 and $663million in 2009. Capital expenditures were $1,043 million in 2011, compared to $944 million in 2010 and $746million in 2009. Capital expenditures in 2011 increased from 2010 due primarily to the expansion ofmanufacturing capacity in China and Chile. Capital expenditures in 2010 and 2009 primarily related to projectstargeted at increasing our capacity for high value-added tires, which were scaled back in 2009 due to therecessionary economic conditions. Investing cash flows in 2011 included cash inflows of $95 million fromgovernment grants related to the relocation and expansion of our manufacturing facility in China. Investing cashflows also reflect cash provided from the disposition of assets each year as a result of the realignment ofoperations under rationalization programs and the divestiture of non-core assets.
Financing Activities
Net cash provided by financing activities was $994 million in 2011, compared to $179 million in 2010 and netcash used of $654 million in 2009. Financing activities in 2011 included $484 million of net proceeds from theissuance of our mandatory convertible preferred stock and net borrowings of $562 million to fund workingcapital needs and capital expenditures. Included in these net borrowings were the issuance by GDTE of€250 million aggregate principal amount of 6.75% senior notes due 2019 and the redemption of $350 million inaggregate principal amount of our outstanding 10.5% senior notes due 2016.
26
Credit Sources
In aggregate, we had total credit arrangements of $8,129 million available at December 31, 2011, of which$2,544 million were unused, compared to $7,689 million available at December 31, 2010, of which $2,475million were unused. At December 31, 2011, we had long term credit arrangements totaling $7,531 million, ofwhich $2,202 million were unused, compared to $7,193 million and $2,217 million, respectively, atDecember 31, 2010. At December 31, 2011, we had short term committed and uncommitted credit arrangementstotaling $598 million, of which $342 million were unused, compared to $496 million and $258 million,respectively, at December 31, 2010. The continued availability of the short term uncommitted arrangements is atthe discretion of the relevant lender and may be terminated at any time.
See the Note to Consolidated Financial Statements, No. 15, Financing Arrangements and DerivativeFinancial Instruments for a discussion of the redemption of a portion of our 10.5% senior notes due 2016, theamendment and restatement of our European revolving credit facility and the issuance of €250 million of GDTE6.75% senior notes due 2019. See the Note to Consolidated Financial Statements, No. 20, Mandatory ConvertiblePreferred Stock for a discussion of the issuance of our 5.875% mandatory convertible preferred stock.
Outstanding Notes
At December 31, 2011, we had $2,362 million of outstanding notes, compared to $2,371 million atDecember 31, 2010. For additional information on our outstanding notes, refer to the Note to ConsolidatedFinancial Statements, No. 15, Financing Arrangements and Derivative Financial Instruments.
$1.5 Billion Amended and Restated First Lien Revolving Credit Facility due 2013
Our $1.5 billion first lien revolving credit facility is available in the form of loans or letters of credit, with letterof credit availability limited to $800 million. Subject to the consent of the lenders whose commitments are to beincreased, we may request that the facility be increased by up to $250 million. Our obligations under the facilityare guaranteed by most of our wholly-owned U.S. and Canadian subsidiaries. Our obligations under this facilityand our subsidiaries’ obligations under the related guarantees are secured by first priority security interests invarious collateral. Availability under the facility is subject to a borrowing base, which is based on eligibleaccounts receivable and inventory of the parent company and certain of its U.S. and Canadian subsidiaries, afteradjusting for customary factors that are subject to modification from time to time by the administrative agent andthe majority lenders at their discretion (not to be exercised unreasonably). Modifications are based on the resultsof periodic collateral and borrowing base evaluations and appraisals. To the extent that our eligible accountsreceivable and inventory decline, our borrowing base will decrease and the availability under the facility maydecrease below $1.5 billion. In addition, if the amount of outstanding borrowings and letters of credit under thefacility exceeds the borrowing base, we are required to prepay borrowings and/or cash collateralize letters ofcredit sufficient to eliminate the excess. As of December 31, 2011, our borrowing base was above the facility’sstated amount of $1.5 billion.
At December 31, 2011 and 2010, we had no borrowings outstanding and $407 million and $474 million,respectively, of letters of credit issued under the revolving credit facility.
$1.2 Billion Amended and Restated Second Lien Term Loan Facility due 2014
Our obligations under this facility are guaranteed by most of our wholly-owned U.S. and Canadian subsidiariesand are secured by second priority security interests in the same collateral securing the $1.5 billion first lienrevolving credit facility. At December 31, 2011 and 2010, this facility was fully drawn.
€400 Million Amended and Restated Senior Secured European Revolving Credit Facility due 2016
Our amended and restated €400 million revolving credit facility consists of a €100 million German tranche that isavailable only to Goodyear Dunlop Tires Germany GmbH (the “German borrower”) and a €300 millionall-borrower tranche that is available to GDTE, the German borrower and certain of GDTE’s other subsidiaries.Up to €50 million in letters of credit are available for issuance under the all-borrower tranche. GDTE and certain
27
of its subsidiaries in the United Kingdom, Luxembourg, France and Germany provide guarantees to support thefacility. GDTE’s obligations under the facility and the obligations of its subsidiaries under the related guaranteesare secured by security interests in a variety of collateral. Goodyear and its U.S. and Canadian subsidiaries thatguarantee our U.S. senior secured credit facilities also provide unsecured guarantees to support the facility.
As of December 31, 2011 and 2010, there were no borrowings under the European revolving credit facility.Letters of credit issued under the all-borrower tranche totaled $8 million (€6 million) as of December 31, 2011and $12 million (€9 million) as of December 31, 2010.
Each of our first lien revolving credit facility and our European revolving credit facility have customaryrepresentations and warranties including, as a condition to borrowing, that all such representations and warrantiesare true and correct, in all material respects, on the date of the borrowing, including representations as to nomaterial adverse change in our financial condition since December 31, 2006 under the first lien facility andDecember 31, 2010 under the European facility. Each of the facilities described above have customary defaults,including cross-defaults to material indebtedness of Goodyear and our subsidiaries. For a description of thecollateral securing the above facilities as well as the covenants applicable to them, please refer to “CovenantCompliance” below and the Note to the Consolidated Financial Statements No. 15, Financing Arrangements andDerivative Financial Instruments.
International Accounts Receivable Securitization Facilities (On-Balance Sheet)
GDTE and certain of its subsidiaries are parties to a pan-European accounts receivable securitization facility thatprovides up to €450 million of funding and expires in 2015. Utilization under this facility is based on currentavailable receivable balances. The facility is subject to customary annual renewal of back-up liquiditycommitments.
The facility involves an ongoing daily sale of substantially all of the trade accounts receivable of certainGDTE subsidiaries to a bankruptcy-remote French company controlled by one of the liquidity banks in thefacility. These subsidiaries retain servicing responsibilities. As of December 31, 2011 and 2010, the amountavailable and fully utilized under this program totaled $393 million (€303 million) and $319 million (€238million), respectively. The program did not qualify for sale accounting, and accordingly, these amounts areincluded in Long term debt and capital leases.
In addition to the pan-European accounts receivable securitization facility discussed above, subsidiaries inAustralia have an accounts receivable securitization program totaling $75 million and $72 million atDecember 31, 2011 and 2010, respectively. The receivables sold under this program also serve as collateral forthe related facility. We retain the risk of loss related to these receivables in the event of non-payment. Theseamounts are included in Notes payable and overdrafts.
Accounts Receivable Factoring Facilities (Off-Balance Sheet)
Various subsidiaries sold certain of their trade receivables under off-balance sheet programs during 2011 and2010. For these programs, we have concluded that there is generally no risk of loss to us from non-payment ofthe sold receivables. At December 31, 2011 and 2010, the gross amount of receivables sold was $190 million and$126 million, respectively.
Other Foreign Credit Facilities
Our Chinese subsidiary has two financing agreements in China. At December 31, 2011, these non-revolvingcredit facilities had total unused availability of 1.2 billion renminbi ($188 million) and can only be used tofinance the relocation and expansion of our manufacturing facility in China. The facilities contain covenantsrelating to our Chinese subsidiary and have customary representations and warranties and defaults relating to ourChinese subsidiary’s ability to perform its obligations under the facilities. One of the facilities (with 1.1 billionrenminbi of unused availability at December 31, 2011) matures in 2018 and principal amortization begins in2015. There were $199 million and $99 million of borrowings outstanding under this facility atDecember 31, 2011 and 2010, respectively. The other facility (with 0.1 billion renminbi of unused availability at
28
December 31, 2011) matures in 2019 and principal amortization begins in 2015. There were $190 million and$54 million of borrowings outstanding under this facility at December 31, 2011 and 2010, respectively.Restricted cash of $9 million and $8 million was related to funds obtained under these credit facilities atDecember 31, 2011 and 2010, respectively.
Covenant Compliance
Our amended and restated first lien revolving and second lien credit facilities and some of the indenturesgoverning our notes contain certain covenants that, among other things, limit our ability to incur additional debtor issue redeemable preferred stock, make certain restricted payments or investments, incur liens, sell assets,incur restrictions on the ability of our subsidiaries to pay dividends to us, enter into affiliate transactions, engagein sale and leaseback transactions, and consolidate, merge, sell or otherwise dispose of all or substantially all ofour assets. These covenants are subject to significant exceptions and qualifications.
We have additional financial covenants in our first lien revolving and second lien credit facilities that arecurrently not applicable. We only become subject to these financial covenants when certain events occur. Thesefinancial covenants and related events are as follows:
• We become subject to the financial covenant contained in our first lien revolving credit facility when theaggregate amount of our Parent Company and Guarantor subsidiaries cash and cash equivalents(“Available Cash”) plus our availability under our first lien revolving credit facility is less than$150 million. If this were to occur, our ratio of EBITDA to Consolidated Interest Expense may not be lessthan 2.0 to 1.0 for any period of four consecutive fiscal quarters. As of December 31, 2011, ouravailability under this facility of $1,093 million, plus our Available Cash of $1,024 million, totaled$2.1 billion, which is in excess of $150 million.
• We become subject to a covenant contained in our second lien credit facility upon certain asset sales. Thecovenant provides that, before we use cash proceeds from certain asset sales to repay any junior lien,senior unsecured or subordinated indebtedness, we must first offer to prepay borrowings under the secondlien credit facility unless our ratio of Consolidated Net Secured Indebtedness to EBITDA (Pro FormaSenior Secured Leverage Ratio) for any period of four consecutive fiscal quarters is equal to or less than3.0 to 1.0.
In addition, our amended and restated European revolving credit facility contains non-financial covenants similarto the non-financial covenants in our first and second lien credit facilities that are described above and a financialcovenant applicable only to GDTE and its subsidiaries. This financial covenant provides that we are notpermitted to allow GDTE’s ratio of Consolidated Net J.V. Indebtedness to Consolidated European J.V. EBITDAfor a period of four consecutive fiscal quarters to be greater than 3.0 to 1.0 at the end of any fiscal quarter.Consolidated Net J.V. Indebtedness is determined net of the sum of cash and cash equivalents in excess of$100 million held by GDTE and its subsidiaries, cash and cash equivalents in excess of $150 million held by theParent Company and its U.S. subsidiaries and availability under our first lien revolving credit facility if the ratioof EBITDA to Consolidated Interest Expense described above is not applicable and the conditions to borrowingunder the first lien revolving credit facility are met. Consolidated Net J.V. Indebtedness also excludes loans fromother consolidated Goodyear entities. This financial covenant is also included in our pan-European accountsreceivable securitization facility. At December 31, 2011, we were in compliance with this financial covenant.
Our amended and restated credit facilities also state that we may only incur additional debt or make restrictedpayments that are not otherwise expressly permitted if, after giving effect to the debt incurrence or the restrictedpayment, our ratio of EBITDA to Consolidated Interest Expense for the prior four fiscal quarters would exceed2.0 to 1.0. Certain of our senior note indentures have substantially similar limitations on incurring debt andmaking restricted payments. Our credit facilities and indentures also permit the incurrence of additional debtthrough other provisions in those agreements without regard to our ability to satisfy the ratio-based incurrencetest described above. We believe that these other provisions provide us with sufficient flexibility to incuradditional debt necessary to meet our operating, investing and financing needs without regard to our ability tosatisfy the ratio-based incurrence test.
29
There are no known future changes to, or new covenants in, any of our existing debt obligations other thanas described above. Covenants could change based upon a refinancing or amendment of an existing facility, oradditional covenants may be added in connection with the incurrence of new debt.
As of December 31, 2011, we were in compliance with the currently applicable material covenants imposedby our principal credit facilities and indentures.
The terms “Available Cash,” “EBITDA,” “Consolidated Interest Expense,” “Consolidated Net SecuredIndebtedness,” “Pro Forma Senior Secured Leverage Ratio,” “Consolidated Net J.V. Indebtedness” and“Consolidated European J.V. EBITDA” have the meanings given them in the respective credit facilities.
Potential Future Financings
In addition to our previous financing activities, we may seek to undertake additional financing actions whichcould include restructuring bank debt or capital markets transactions, possibly including the issuance ofadditional debt or equity. Given the challenges that we face and the uncertainties of the market conditions, accessto the capital markets cannot be assured.
Our future liquidity requirements may make it necessary for us to incur additional debt. However, asubstantial portion of our assets are already subject to liens securing our indebtedness. As a result, we are limitedin our ability to pledge our remaining assets as security for additional secured indebtedness. In addition, noassurance can be given as to our ability to raise additional unsecured debt.
Dividends
Under our primary credit facilities we are permitted to pay dividends on our common stock as long as no defaultwill have occurred and be continuing, additional indebtedness can be incurred under the credit facilitiesfollowing the payment, and certain financial tests are satisfied.
So long as any of our mandatory convertible preferred stock is outstanding, no dividend, except a dividendpayable in shares of our common stock, or other shares ranking junior to the mandatory convertible preferredstock, may be paid or declared or any distribution be made on shares of our common stock unless all accrued andunpaid dividends on the then outstanding mandatory convertible preferred stock payable on all dividend paymentdates occurring on or prior to the date of such action have been declared and paid or sufficient funds have beenset aside for that payment.
Asset Dispositions
The restrictions on asset sales imposed by our material indebtedness have not affected our strategy of divestingnon-core businesses, and those divestitures have not affected our ability to comply with those restrictions.
30
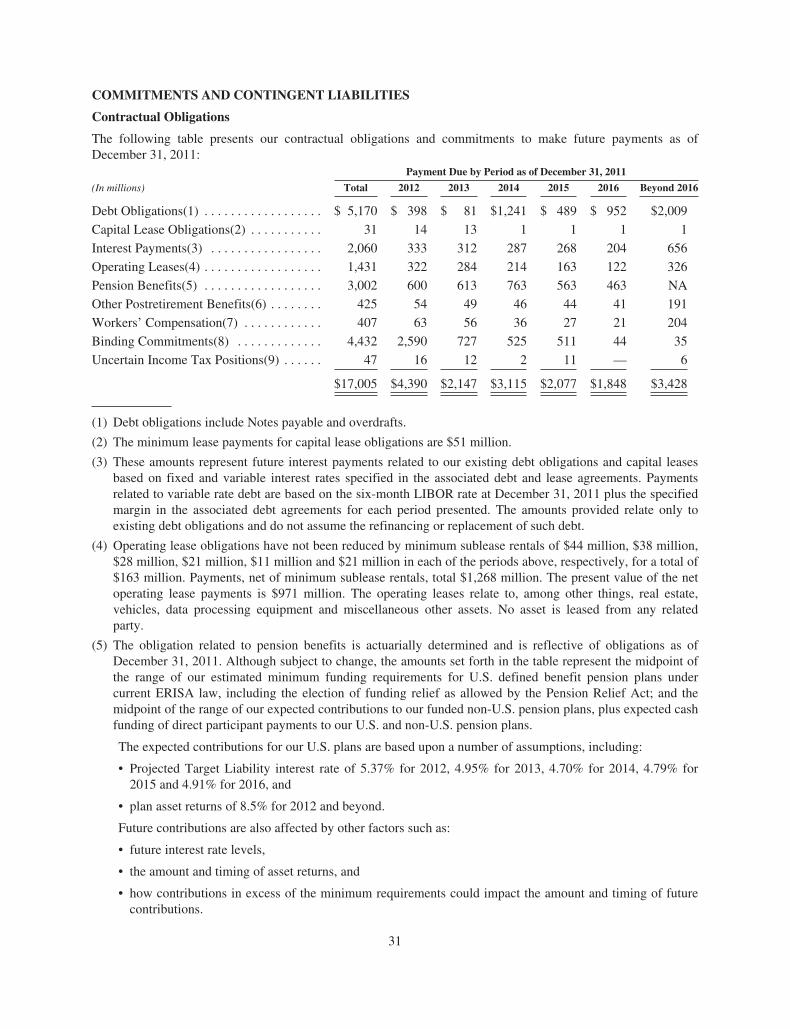
COMMITMENTS AND CONTINGENT LIABILITIES
Contractual Obligations
The following table presents our contractual obligations and commitments to make future payments as ofDecember 31, 2011:
Payment Due by Period as of December 31, 2011
(In millions) Total 2012 2013 2014 2015 2016 Beyond 2016
Debt Obligations(1) . . . . . . . . . . . . . . . . . . $ 5,170 $ 398 $ 81 $1,241 $ 489 $ 952 $2,009
Capital Lease Obligations(2) . . . . . . . . . . . 31 14 13 1 1 1 1
Interest Payments(3) . . . . . . . . . . . . . . . . . 2,060 333 312 287 268 204 656
Operating Leases(4) . . . . . . . . . . . . . . . . . . 1,431 322 284 214 163 122 326
Pension Benefits(5) . . . . . . . . . . . . . . . . . . 3,002 600 613 763 563 463 NA
Other Postretirement Benefits(6) . . . . . . . . 425 54 49 46 44 41 191
Workers’ Compensation(7) . . . . . . . . . . . . 407 63 56 36 27 21 204
Binding Commitments(8) . . . . . . . . . . . . . 4,432 2,590 727 525 511 44 35
Uncertain Income Tax Positions(9) . . . . . . 47 16 12 2 11 — 6
$17,005 $4,390 $2,147 $3,115 $2,077 $1,848 $3,428
(1) Debt obligations include Notes payable and overdrafts.
(2) The minimum lease payments for capital lease obligations are $51 million.
(3) These amounts represent future interest payments related to our existing debt obligations and capital leasesbased on fixed and variable interest rates specified in the associated debt and lease agreements. Paymentsrelated to variable rate debt are based on the six-month LIBOR rate at December 31, 2011 plus the specifiedmargin in the associated debt agreements for each period presented. The amounts provided relate only toexisting debt obligations and do not assume the refinancing or replacement of such debt.
(4) Operating lease obligations have not been reduced by minimum sublease rentals of $44 million, $38 million,$28 million, $21 million, $11 million and $21 million in each of the periods above, respectively, for a total of$163 million. Payments, net of minimum sublease rentals, total $1,268 million. The present value of the netoperating lease payments is $971 million. The operating leases relate to, among other things, real estate,vehicles, data processing equipment and miscellaneous other assets. No asset is leased from any relatedparty.
(5) The obligation related to pension benefits is actuarially determined and is reflective of obligations as ofDecember 31, 2011. Although subject to change, the amounts set forth in the table represent the midpoint ofthe range of our estimated minimum funding requirements for U.S. defined benefit pension plans undercurrent ERISA law, including the election of funding relief as allowed by the Pension Relief Act; and themidpoint of the range of our expected contributions to our funded non-U.S. pension plans, plus expected cashfunding of direct participant payments to our U.S. and non-U.S. pension plans.
The expected contributions for our U.S. plans are based upon a number of assumptions, including:
• Projected Target Liability interest rate of 5.37% for 2012, 4.95% for 2013, 4.70% for 2014, 4.79% for2015 and 4.91% for 2016, and
• plan asset returns of 8.5% for 2012 and beyond.
Future contributions are also affected by other factors such as:
• future interest rate levels,
• the amount and timing of asset returns, and
• how contributions in excess of the minimum requirements could impact the amount and timing of futurecontributions.
31
(6) The payments presented above are expected payments for the next 10 years. The payments for otherpostretirement benefits reflect the estimated benefit payments of the plans using the provisions currently ineffect. Under the relevant summary plan descriptions or plan documents we have the right to modify orterminate the plans. The obligation related to other postretirement benefits is actuarially determined on anannual basis. The estimated payments have been reduced to reflect the provisions of the MedicarePrescription Drug Improvement and Modernization Act of 2003.
(7) The payments for workers’ compensation obligations are based upon recent historical payment patterns onclaims. The present value of anticipated claims payments for workers’ compensation is $302 million.
(8) Binding commitments are for raw materials, capital expenditures, utilities, and various other types ofcontracts. The obligations to purchase raw materials include supply contracts at both fixed and variableprices. Those with variable prices are based on index rates for those commodities at December 31, 2011.
(9) These amounts primarily represent expected payments with interest for uncertain tax positions as ofDecember 31, 2011. We have reflected them in the period in which we believe they will be ultimately settledbased upon our experience with these matters.
Additional other long term liabilities include items such as general and product liabilities, environmentalliabilities and miscellaneous other long term liabilities. These other liabilities are not contractual obligations bynature. We cannot, with any degree of reliability, determine the years in which these liabilities might ultimatelybe settled. Accordingly, these other long term liabilities are not included in the above table.
In addition, the following contingent contractual obligations, the amounts of which cannot be estimated, arenot included in the table above:
• The terms and conditions of our global alliance with SRI, as set forth in the global alliance agreementsbetween SRI and us, provide for certain minority exit rights available to SRI upon the occurrence ofcertain events enumerated in the global alliance agreements, including certain bankruptcy events, changesin our control or breaches of the global alliance agreements. SRI’s exit rights, in the event of theoccurrence of a triggering event and the subsequent exercise of SRI’s exit rights, could require us to makea substantial payment to acquire SRI’s minority interests in GDTE and GDTNA following thedetermination of the fair value of SRI’s interests.
• Pursuant to certain long term agreements, we will purchase varying amounts of certain raw materials andfinished goods at agreed upon base prices that may be subject to periodic adjustments for changes in rawmaterial costs and market price adjustments, or in quantities that may be subject to periodic adjustmentsfor changes in our or our suppliers production levels.
We do not engage in the trading of commodity contracts or any related derivative contracts. We generallypurchase raw materials and energy through short term, intermediate and long term supply contracts at fixedprices or at formula prices related to market prices or negotiated prices. We may, however, from time to time,enter into contracts to hedge our energy costs.
Off-Balance Sheet Arrangements
An off-balance sheet arrangement is any transaction, agreement or other contractual arrangement involving anunconsolidated entity under which a company has:
• made guarantees,
• retained or held a contingent interest in transferred assets,
• undertaken an obligation under certain derivative instruments, or
• undertaken any obligation arising out of a material variable interest in an unconsolidated entity thatprovides financing, liquidity, market risk or credit risk support to the company, or that engages in leasing,hedging or research and development arrangements with the company.
32
We have entered into certain arrangements under which we have provided guarantees that are off-balance sheetarrangements. Those guarantees totaled approximately $105 million at December 31, 2011 and expire at varioustimes through 2023. For further information about our guarantees, refer to the Note to the Consolidated FinancialStatements No. 19, Commitments and Contingent Liabilities.
FORWARD-LOOKING INFORMATION— SAFE HARBOR STATEMENT
Certain information in this Annual Report (other than historical data and information) may constitute forward-looking statements regarding events and trends that may affect our future operating results and financial position.The words “estimate,” “expect,” “intend” and “project,” as well as other words or expressions of similarmeaning, are intended to identify forward-looking statements. You are cautioned not to place undue reliance onforward-looking statements, which speak only as of the date of this Annual Report. Such statements are based oncurrent expectations and assumptions, are inherently uncertain, are subject to risks and should be viewed withcaution. Actual results and experience may differ materially from the forward-looking statements as a result ofmany factors, including:
• if we do not achieve projected savings from various cost reduction initiatives or successfully implementother strategic initiatives our operating results, financial condition and liquidity may be materiallyadversely affected;
• higher raw material and energy costs may materially adversely affect our operating results and financialcondition;
• our pension plans are significantly underfunded and further increases in the underfunded status of theplans could significantly increase the amount of our required contributions and pension expense;
• we face significant global competition, increasingly from lower cost manufacturers, and our market sharecould decline;
• deteriorating economic conditions in any of our major markets, or an inability to access capital markets orthird-party financing when necessary, may materially adversely affect our operating results, financialcondition and liquidity;
• work stoppages, financial difficulties or supply disruptions at our major OE customers, dealers orsuppliers could harm our business;
• our capital expenditures may not be adequate to maintain our competitive position and may not beimplemented in a timely or cost-effective manner;
• if we experience a labor strike, work stoppage or other similar event our financial position, results ofoperations and liquidity could be materially adversely affected;
• our long term ability to meet current obligations and to repay maturing indebtedness is dependent on ourability to access capital markets in the future and to improve our operating results;
• we have a substantial amount of debt, which could restrict our growth, place us at a competitivedisadvantage or otherwise materially adversely affect our financial health;
• any failure to be in compliance with any material provision or covenant of our secured credit facilitiescould have a material adverse effect on our liquidity and our results of operations;
• our international operations have certain risks that may materially adversely affect our operating results;
• we have foreign currency translation and transaction risks that may materially adversely affect ouroperating results, financial condition and liquidity;
• our variable rate indebtedness subjects us to interest rate risk, which could cause our debt serviceobligations to increase significantly;
33
• we have substantial fixed costs and, as a result, our operating income fluctuates disproportionately withchanges in our net sales;
• we may incur significant costs in connection with product liability and other tort claims;
• our reserves for product liability and other tort claims and our recorded insurance assets are subject tovarious uncertainties, the outcome of which may result in our actual costs being significantly higher thanthe amounts recorded;
• we may be required to provide letters of credit or post cash collateral if we are subject to a significantadverse judgment or if we are unable to obtain surety bonds, which may have a material adverse effect onour liquidity;
• we are subject to extensive government regulations that may materially adversely affect our operatingresults;
• the terms and conditions of our global alliance with SRI provide for certain exit rights available to SRIupon the occurrence of certain events, which could require us to make a substantial payment to acquireSRI’s minority interests in GDTE and GDTNA following the determination of the fair value of thoseinterests;
• we may be adversely affected by any disruption in, or failure of, our information technology systems;
• if we are unable to attract and retain key personnel, our business could be materially adverselyaffected; and
• we may be impacted by economic and supply disruptions associated with events beyond our control, suchas war, acts of terror, political unrest, public health concerns, labor disputes or natural disasters.
It is not possible to foresee or identify all such factors. We will not revise or update any forward-lookingstatement or disclose any facts, events or circumstances that occur after the date hereof that may affect theaccuracy of any forward-looking statement.
QUANTITATIVE AND QUALITATIVE DISCLOSURES ABOUTMARKET RISK.
We utilize derivative financial instrument contracts and nonderivative instruments to manage interest rate,foreign exchange and commodity price risks. We have established a control environment that includes policiesand procedures for risk assessment and the approval, reporting and monitoring of derivative financial instrumentactivities. We do not hold or issue derivative financial instruments for trading purposes.
Commodity Price Risk
The raw materials costs to which our operations are principally exposed include the cost of natural rubber,synthetic rubber, carbon black, fabrics, steel cord and other petrochemical-based commodities. Approximatelytwo-thirds of our raw materials are oil-based derivatives, the cost of which may be affected by fluctuations in theprice of oil. We currently do not hedge commodity prices. We do, however, use various strategies to partiallyoffset cost increases for raw materials, including centralizing purchases of raw materials through our globalprocurement organization in an effort to leverage our purchasing power, expanding our capabilities to substitutelower-cost raw materials and reducing the amount of natural rubber required in each tire.
Interest Rate Risk
We continuously monitor our fixed and floating rate debt mix. Within defined limitations, we manage the mixusing refinancing. At December 31, 2011, 43% of our debt was at variable interest rates averaging 4.36%compared to 41% at an average rate of 3.72% at December 31, 2010.
34
The following table presents information about long term fixed rate debt, excluding capital leases, atDecember 31:
(In millions) 2011 2010
Carrying amount — liability . . . . . . . . . . . . . . . . . . . . . . . . . . . . . . . . . . . . . . . . . . . . $2,843 $2,691
Fair value — liability . . . . . . . . . . . . . . . . . . . . . . . . . . . . . . . . . . . . . . . . . . . . . . . . . 2,891 2,791
Pro forma fair value — liability . . . . . . . . . . . . . . . . . . . . . . . . . . . . . . . . . . . . . . . . . 2,993 2,893
The pro forma information assumes a 100 basis point decrease in market interest rates at December 31 of eachyear, and reflects the estimated fair value of fixed rate debt outstanding at that date under that assumption. Thesensitivity of our fixed rate debt to changes in interest rates was determined using current market pricing models.
Foreign Currency Exchange Risk
We enter into foreign currency contracts in order to reduce the impact of changes in foreign exchange rates onour consolidated results of operations and future foreign currency-denominated cash flows. These contractsreduce exposure to currency movements affecting existing foreign currency-denominated assets, liabilities, firmcommitments and forecasted transactions resulting primarily from trade receivables and payables, equipmentacquisitions, intercompany loans and royalty agreements, and forecasted purchases and sales. Contracts hedgingshort-term trade receivables and payables normally have no hedging designation.
The following table presents foreign currency derivative information at December 31:
(In millions) 2011 2010
Fair value — asset (liability) . . . . . . . . . . . . . . . . . . . . . . . . . . . . . . . . . . . $31 $9
Pro forma decrease in fair value . . . . . . . . . . . . . . . . . . . . . . . . . . . . . . . . (117) (113)
Contract maturities . . . . . . . . . . . . . . . . . . . . . . . . . . . . . . . . . . . . . . . . . . . 1/12 - 10/19 1/11 - 10/19
The pro forma decrease in fair value assumes a 10% adverse change in underlying foreign exchange rates atDecember 31 of each year, and reflects the estimated change in the fair value of positions outstanding at that dateunder that assumption. The sensitivity of our foreign currency positions to changes in exchange rates wasdetermined using current market pricing models.
Fair values are recognized on the Consolidated Balance Sheets at December 31 as follows:
(In millions) 2011 2010
Asset (liability):
Accounts receivable . . . . . . . . . . . . . . . . . . . . . . . . . . . . . . . . . . . . . . . . . . . . . . . . . . . . . $37 $ 25
Other Assets . . . . . . . . . . . . . . . . . . . . . . . . . . . . . . . . . . . . . . . . . . . . . . . . . . . . . . . . . . . — 1
Other current liabilities . . . . . . . . . . . . . . . . . . . . . . . . . . . . . . . . . . . . . . . . . . . . . . . . . . (5) (17)
Other long term liabilities . . . . . . . . . . . . . . . . . . . . . . . . . . . . . . . . . . . . . . . . . . . . . . . . (1) —
For further information on foreign currency contracts, refer to the Note to the Consolidated FinancialStatements No. 15, Financing Arrangements and Derivative Financial Instruments.
See “Management’s Discussion and Analysis of Financial Condition and Results of Operations — Liquidityand Capital Resources” for a discussion of our management of counterparty risk.
35
THE GOODYEAR TIRE & RUBBER COMPANY AND SUBSIDIARIES
CONSOLIDATED STATEMENTS OF OPERATIONSYear Ended December 31,
(In millions, except per share amounts) 2011 2010 2009
Net Sales . . . . . . . . . . . . . . . . . . . . . . . . . . . . . . . . . . . . . . . . . . . . . . . . . . . . . . . . . $22,767 $18,832 $16,301
Cost of Goods Sold . . . . . . . . . . . . . . . . . . . . . . . . . . . . . . . . . . . . . . . . . . . . . . . . . 18,821 15,452 13,676
Selling, Administrative and General Expense . . . . . . . . . . . . . . . . . . . . . . . . . . . . . 2,822 2,630 2,404
Rationalizations (Note 2) . . . . . . . . . . . . . . . . . . . . . . . . . . . . . . . . . . . . . . . . . . . . . 103 240 227
Interest Expense (Note 5) . . . . . . . . . . . . . . . . . . . . . . . . . . . . . . . . . . . . . . . . . . . . . 330 316 311
Other Expense (Note 3) . . . . . . . . . . . . . . . . . . . . . . . . . . . . . . . . . . . . . . . . . . . . . . 73 186 40
Income (Loss) before Income Taxes . . . . . . . . . . . . . . . . . . . . . . . . . . . . . . . . . . . 618 8 (357)
United States and Foreign Taxes (Note 6) . . . . . . . . . . . . . . . . . . . . . . . . . . . . . . . . 201 172 7
Net Income (Loss) . . . . . . . . . . . . . . . . . . . . . . . . . . . . . . . . . . . . . . . . . . . . . . . . . . 417 (164) (364)
Less: Minority Shareholders’ Net Income . . . . . . . . . . . . . . . . . . . . . . . . . . . . . . 74 52 11
Goodyear Net Income (Loss) . . . . . . . . . . . . . . . . . . . . . . . . . . . . . . . . . . . . . . . . . 343 (216) (375)
Less: Preferred Stock Dividends . . . . . . . . . . . . . . . . . . . . . . . . . . . . . . . . . . . . . 22 — —
Goodyear Net Income (Loss) available to Common Shareholders . . . . . . . . . . $ 321 $ (216) $ (375)
Goodyear Net Income (Loss) available to Common Shareholders — PerShare of Common Stock
Basic . . . . . . . . . . . . . . . . . . . . . . . . . . . . . . . . . . . . . . . . . . . . . . . . . . . . . . . . . . . $ 1.32 $ (0.89) $ (1.55)
Weighted Average Shares Outstanding (Note 7) . . . . . . . . . . . . . . . . . . . . . . . . . 244 242 241
Diluted . . . . . . . . . . . . . . . . . . . . . . . . . . . . . . . . . . . . . . . . . . . . . . . . . . . . . . . . . $ 1.26 $ (0.89) $ (1.55)
Weighted Average Shares Outstanding (Note 7) . . . . . . . . . . . . . . . . . . . . . . . . . 271 242 241
The accompanying notes are an integral part of these consolidated financial statements.
36
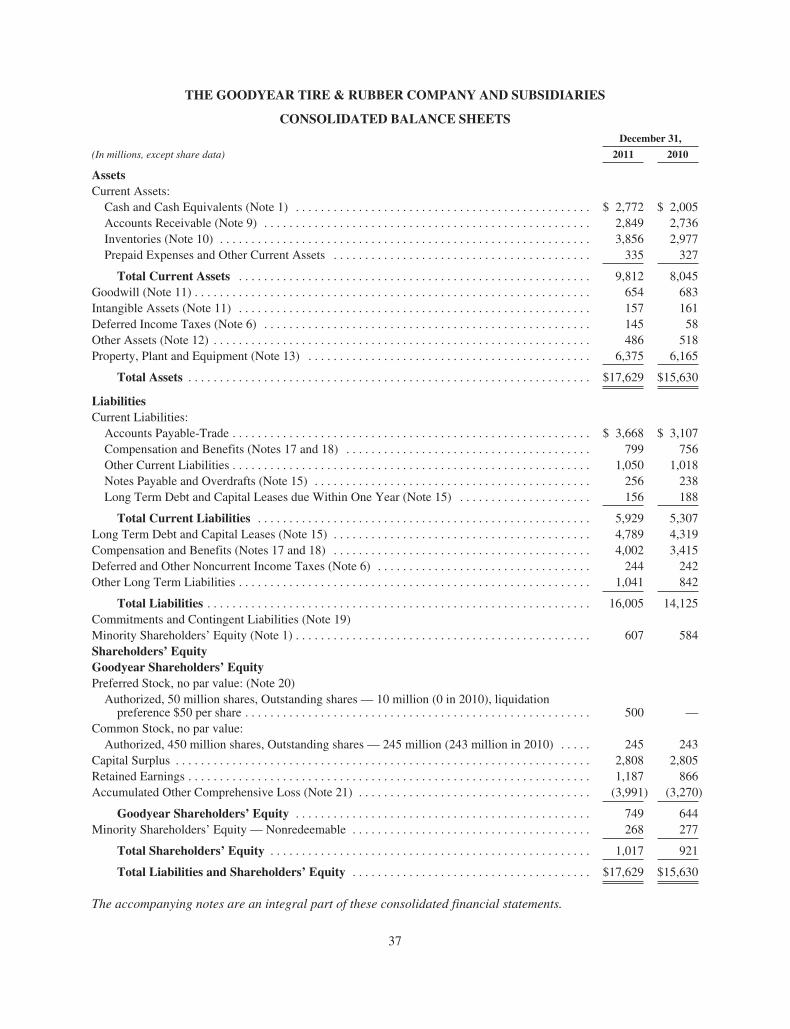
THE GOODYEAR TIRE & RUBBER COMPANY AND SUBSIDIARIES
CONSOLIDATED BALANCE SHEETSDecember 31,
(In millions, except share data) 2011 2010
AssetsCurrent Assets:
Cash and Cash Equivalents (Note 1) . . . . . . . . . . . . . . . . . . . . . . . . . . . . . . . . . . . . . . . . . . . . . . . $ 2,772 $ 2,005Accounts Receivable (Note 9) . . . . . . . . . . . . . . . . . . . . . . . . . . . . . . . . . . . . . . . . . . . . . . . . . . . . 2,849 2,736Inventories (Note 10) . . . . . . . . . . . . . . . . . . . . . . . . . . . . . . . . . . . . . . . . . . . . . . . . . . . . . . . . . . . 3,856 2,977Prepaid Expenses and Other Current Assets . . . . . . . . . . . . . . . . . . . . . . . . . . . . . . . . . . . . . . . . . 335 327
Total Current Assets . . . . . . . . . . . . . . . . . . . . . . . . . . . . . . . . . . . . . . . . . . . . . . . . . . . . . . . . 9,812 8,045Goodwill (Note 11) . . . . . . . . . . . . . . . . . . . . . . . . . . . . . . . . . . . . . . . . . . . . . . . . . . . . . . . . . . . . . . . 654 683Intangible Assets (Note 11) . . . . . . . . . . . . . . . . . . . . . . . . . . . . . . . . . . . . . . . . . . . . . . . . . . . . . . . . 157 161Deferred Income Taxes (Note 6) . . . . . . . . . . . . . . . . . . . . . . . . . . . . . . . . . . . . . . . . . . . . . . . . . . . . 145 58Other Assets (Note 12) . . . . . . . . . . . . . . . . . . . . . . . . . . . . . . . . . . . . . . . . . . . . . . . . . . . . . . . . . . . . 486 518Property, Plant and Equipment (Note 13) . . . . . . . . . . . . . . . . . . . . . . . . . . . . . . . . . . . . . . . . . . . . . 6,375 6,165
Total Assets . . . . . . . . . . . . . . . . . . . . . . . . . . . . . . . . . . . . . . . . . . . . . . . . . . . . . . . . . . . . . . . . $17,629 $15,630
LiabilitiesCurrent Liabilities:
Accounts Payable-Trade . . . . . . . . . . . . . . . . . . . . . . . . . . . . . . . . . . . . . . . . . . . . . . . . . . . . . . . . . $ 3,668 $ 3,107Compensation and Benefits (Notes 17 and 18) . . . . . . . . . . . . . . . . . . . . . . . . . . . . . . . . . . . . . . . 799 756Other Current Liabilities . . . . . . . . . . . . . . . . . . . . . . . . . . . . . . . . . . . . . . . . . . . . . . . . . . . . . . . . . 1,050 1,018Notes Payable and Overdrafts (Note 15) . . . . . . . . . . . . . . . . . . . . . . . . . . . . . . . . . . . . . . . . . . . . 256 238Long Term Debt and Capital Leases due Within One Year (Note 15) . . . . . . . . . . . . . . . . . . . . . 156 188
Total Current Liabilities . . . . . . . . . . . . . . . . . . . . . . . . . . . . . . . . . . . . . . . . . . . . . . . . . . . . . 5,929 5,307Long Term Debt and Capital Leases (Note 15) . . . . . . . . . . . . . . . . . . . . . . . . . . . . . . . . . . . . . . . . . 4,789 4,319Compensation and Benefits (Notes 17 and 18) . . . . . . . . . . . . . . . . . . . . . . . . . . . . . . . . . . . . . . . . . 4,002 3,415Deferred and Other Noncurrent Income Taxes (Note 6) . . . . . . . . . . . . . . . . . . . . . . . . . . . . . . . . . . 244 242Other Long Term Liabilities . . . . . . . . . . . . . . . . . . . . . . . . . . . . . . . . . . . . . . . . . . . . . . . . . . . . . . . . 1,041 842
Total Liabilities . . . . . . . . . . . . . . . . . . . . . . . . . . . . . . . . . . . . . . . . . . . . . . . . . . . . . . . . . . . . . 16,005 14,125Commitments and Contingent Liabilities (Note 19)Minority Shareholders’ Equity (Note 1) . . . . . . . . . . . . . . . . . . . . . . . . . . . . . . . . . . . . . . . . . . . . . . . 607 584Shareholders’ EquityGoodyear Shareholders’ EquityPreferred Stock, no par value: (Note 20)
Authorized, 50 million shares, Outstanding shares — 10 million (0 in 2010), liquidationpreference $50 per share . . . . . . . . . . . . . . . . . . . . . . . . . . . . . . . . . . . . . . . . . . . . . . . . . . . . . . . 500 —
Common Stock, no par value:Authorized, 450 million shares, Outstanding shares — 245 million (243 million in 2010) . . . . . 245 243
Capital Surplus . . . . . . . . . . . . . . . . . . . . . . . . . . . . . . . . . . . . . . . . . . . . . . . . . . . . . . . . . . . . . . . . . . 2,808 2,805Retained Earnings . . . . . . . . . . . . . . . . . . . . . . . . . . . . . . . . . . . . . . . . . . . . . . . . . . . . . . . . . . . . . . . . 1,187 866Accumulated Other Comprehensive Loss (Note 21) . . . . . . . . . . . . . . . . . . . . . . . . . . . . . . . . . . . . . (3,991) (3,270)
Goodyear Shareholders’ Equity . . . . . . . . . . . . . . . . . . . . . . . . . . . . . . . . . . . . . . . . . . . . . . . 749 644Minority Shareholders’ Equity — Nonredeemable . . . . . . . . . . . . . . . . . . . . . . . . . . . . . . . . . . . . . . 268 277
Total Shareholders’ Equity . . . . . . . . . . . . . . . . . . . . . . . . . . . . . . . . . . . . . . . . . . . . . . . . . . . 1,017 921
Total Liabilities and Shareholders’ Equity . . . . . . . . . . . . . . . . . . . . . . . . . . . . . . . . . . . . . . $17,629 $15,630
The accompanying notes are an integral part of these consolidated financial statements.
37

THE GOODYEAR TIRE & RUBBER COMPANY AND SUBSIDIARIES
CONSOLIDATED STATEMENTS OF SHAREHOLDERS’ EQUITY
(Dollars in millions)
Common Stock CapitalSurplus
RetainedEarnings
AccumulatedOther
ComprehensiveLoss
GoodyearShareholders’
Equity
MinorityShareholders’Equity — Non-Redeemable
TotalShareholders’
EquityShares Amount
Balance at December 31, 2008(after deducting 9,599,694 treasury
shares) . . . . . . . . . . . . . . . . . . . . . . . . . 241,289,921 $241 $2,764 $1,463 $(3,446) $1,022 $231 $1,253Comprehensive income (loss):
Net (loss) income . . . . . . . . . . . . . . . . (375) (375) 28 (347)Foreign currency translation
(net of tax of $22) . . . . . . . . . . . . . . 217 217 7 224Reclassification adjustment for
amounts recognized in income(net of tax of $0) . . . . . . . . . . . . . . . (17) (17) (17)
Amortization of prior service cost andunrecognized gains and lossesincluded in net periodic benefit cost(net of tax of $57) . . . . . . . . . . . . . . 121 121 121
Increase in net actuarial losses (net oftax benefit of $19) . . . . . . . . . . . . . . (277) (277) (277)
Immediate recognition of prior servicecost and unrecognized gains andlosses due to curtailments andsettlements (net of tax of $1) . . . . . . 43 43 43
Prior service cost from planamendments (net of tax of $7) . . . . . (16) (16) (16)
Other (net of tax benefit of $2) . . . . . . 3 3 3
Other comprehensive income(loss) . . . . . . . . . . . . . . . . . . . . . . 74 7 81
Total comprehensive income(loss) . . . . . . . . . . . . . . . . . . . . . . (301) 35 (266)
Dividends declared to minorityshareholders . . . . . . . . . . . . . . . . . . . (15) (15)
Stock-based compensation plans . . . . . 18 18 18Common stock issued from treasury
(Note 18) . . . . . . . . . . . . . . . . . . . . . 912,498 1 1 2 2Other . . . . . . . . . . . . . . . . . . . . . . . . . . (6) (6) (6)
Balance at December 31, 2009(after deducting 8,687,196 treasury
shares) . . . . . . . . . . . . . . . . . . . . . . . . . 242,202,419 $242 $2,783 $1,082 $(3,372) $ 735 $251 $ 986
The accompanying notes are an integral part of these consolidated financial statements.
38
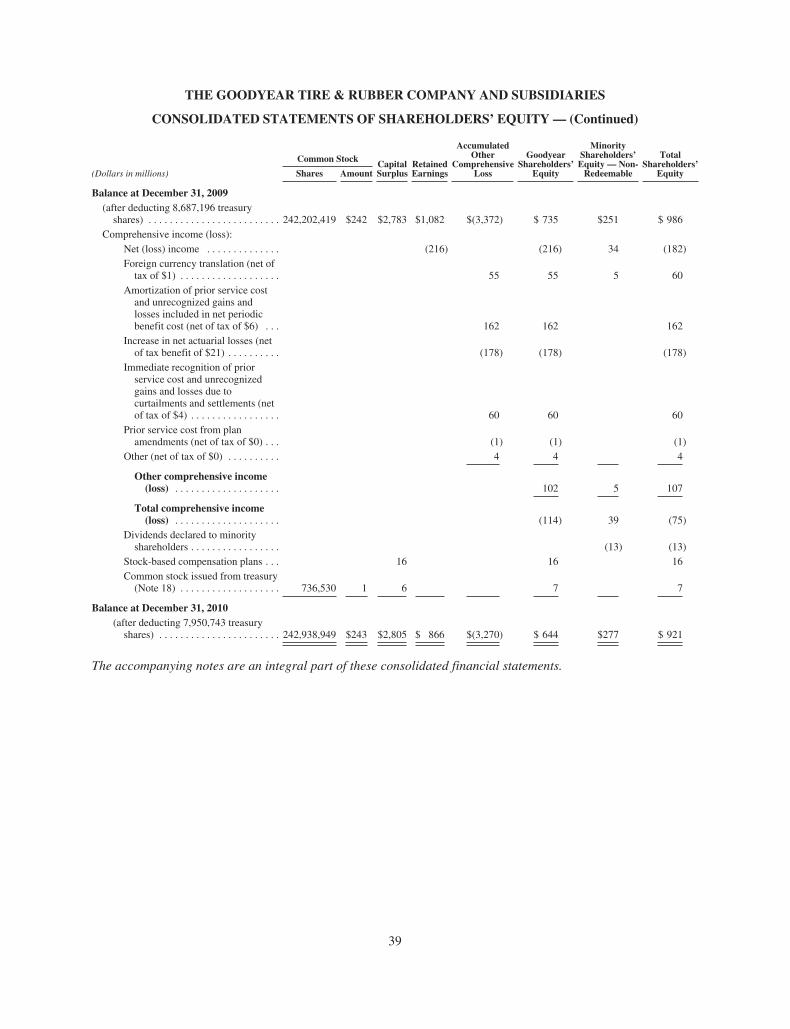
THE GOODYEAR TIRE & RUBBER COMPANY AND SUBSIDIARIES
CONSOLIDATED STATEMENTS OF SHAREHOLDERS’ EQUITY— (Continued)
Common Stock CapitalSurplus
RetainedEarnings
AccumulatedOther
ComprehensiveLoss
GoodyearShareholders’
Equity
MinorityShareholders’Equity — Non-Redeemable
TotalShareholders’
Equity(Dollars in millions) Shares Amount
Balance at December 31, 2009(after deducting 8,687,196 treasury
shares) . . . . . . . . . . . . . . . . . . . . . . . . . 242,202,419 $242 $2,783 $1,082 $(3,372) $ 735 $251 $ 986Comprehensive income (loss):
Net (loss) income . . . . . . . . . . . . . . (216) (216) 34 (182)Foreign currency translation (net of
tax of $1) . . . . . . . . . . . . . . . . . . . 55 55 5 60Amortization of prior service cost
and unrecognized gains andlosses included in net periodicbenefit cost (net of tax of $6) . . . 162 162 162
Increase in net actuarial losses (netof tax benefit of $21) . . . . . . . . . . (178) (178) (178)
Immediate recognition of priorservice cost and unrecognizedgains and losses due tocurtailments and settlements (netof tax of $4) . . . . . . . . . . . . . . . . . 60 60 60
Prior service cost from planamendments (net of tax of $0) . . . (1) (1) (1)
Other (net of tax of $0) . . . . . . . . . . 4 4 4
Other comprehensive income(loss) . . . . . . . . . . . . . . . . . . . . 102 5 107
Total comprehensive income(loss) . . . . . . . . . . . . . . . . . . . . (114) 39 (75)
Dividends declared to minorityshareholders . . . . . . . . . . . . . . . . . (13) (13)
Stock-based compensation plans . . . 16 16 16Common stock issued from treasury
(Note 18) . . . . . . . . . . . . . . . . . . . 736,530 1 6 7 7
Balance at December 31, 2010(after deducting 7,950,743 treasury
shares) . . . . . . . . . . . . . . . . . . . . . . . 242,938,949 $243 $2,805 $ 866 $(3,270) $ 644 $277 $ 921
The accompanying notes are an integral part of these consolidated financial statements.
39
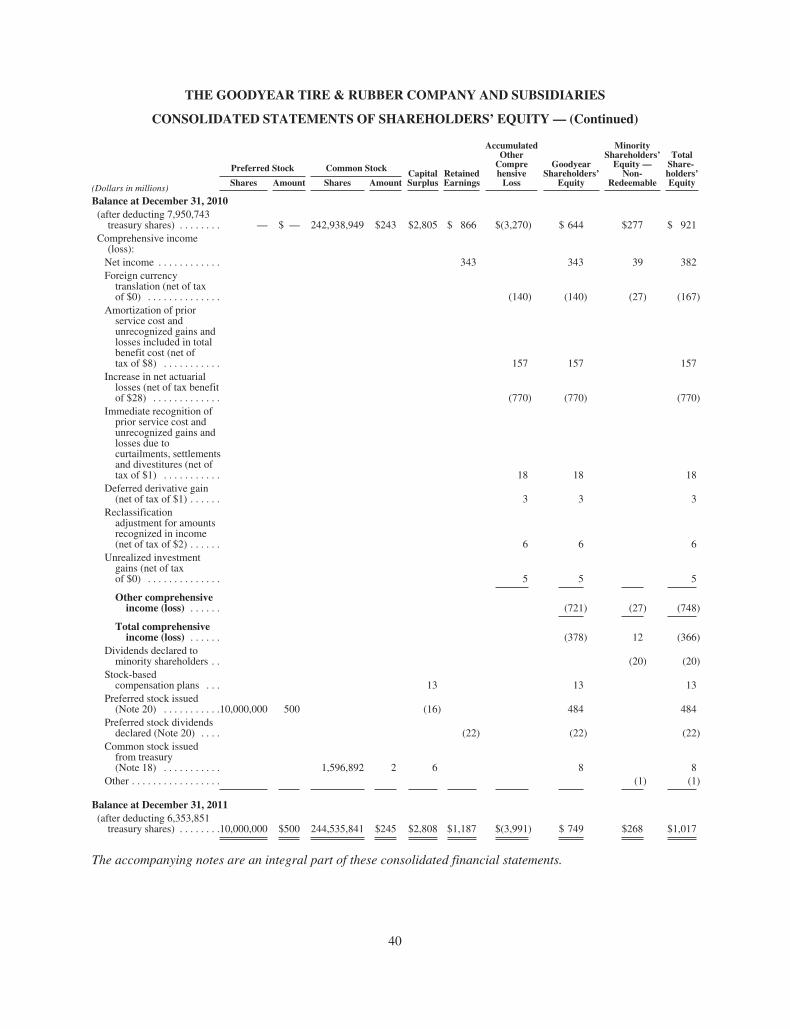
THE GOODYEAR TIRE & RUBBER COMPANY AND SUBSIDIARIES
CONSOLIDATED STATEMENTS OF SHAREHOLDERS’ EQUITY— (Continued)
(Dollars in millions)
Preferred Stock Common Stock CapitalSurplus
RetainedEarnings
AccumulatedOtherComprehensiveLoss
GoodyearShareholders’
Equity
MinorityShareholders’Equity —
Non-Redeemable
TotalShare-holders’EquityShares Amount Shares Amount
Balance at December 31, 2010(after deducting 7,950,743
treasury shares) . . . . . . . . — $ — 242,938,949 $243 $2,805 $ 866 $(3,270) $ 644 $277 $ 921Comprehensive income
(loss):Net income . . . . . . . . . . . . 343 343 39 382Foreign currency
translation (net of taxof $0) . . . . . . . . . . . . . . (140) (140) (27) (167)
Amortization of priorservice cost andunrecognized gains andlosses included in totalbenefit cost (net oftax of $8) . . . . . . . . . . . 157 157 157
Increase in net actuariallosses (net of tax benefitof $28) . . . . . . . . . . . . . (770) (770) (770)
Immediate recognition ofprior service cost andunrecognized gains andlosses due tocurtailments, settlementsand divestitures (net oftax of $1) . . . . . . . . . . . 18 18 18
Deferred derivative gain(net of tax of $1) . . . . . . 3 3 3
Reclassificationadjustment for amountsrecognized in income(net of tax of $2) . . . . . . 6 6 6
Unrealized investmentgains (net of taxof $0) . . . . . . . . . . . . . . 5 5 5
Other comprehensiveincome (loss) . . . . . . (721) (27) (748)
Total comprehensiveincome (loss) . . . . . . (378) 12 (366)
Dividends declared tominority shareholders . . (20) (20)
Stock-basedcompensation plans . . . 13 13 13
Preferred stock issued(Note 20) . . . . . . . . . . .10,000,000 500 (16) 484 484
Preferred stock dividendsdeclared (Note 20) . . . . (22) (22) (22)
Common stock issuedfrom treasury(Note 18) . . . . . . . . . . . 1,596,892 2 6 8 8
Other . . . . . . . . . . . . . . . . . (1) (1)
Balance at December 31, 2011(after deducting 6,353,851
treasury shares) . . . . . . . .10,000,000 $500 244,535,841 $245 $2,808 $1,187 $(3,991) $ 749 $268 $1,017
The accompanying notes are an integral part of these consolidated financial statements.
40
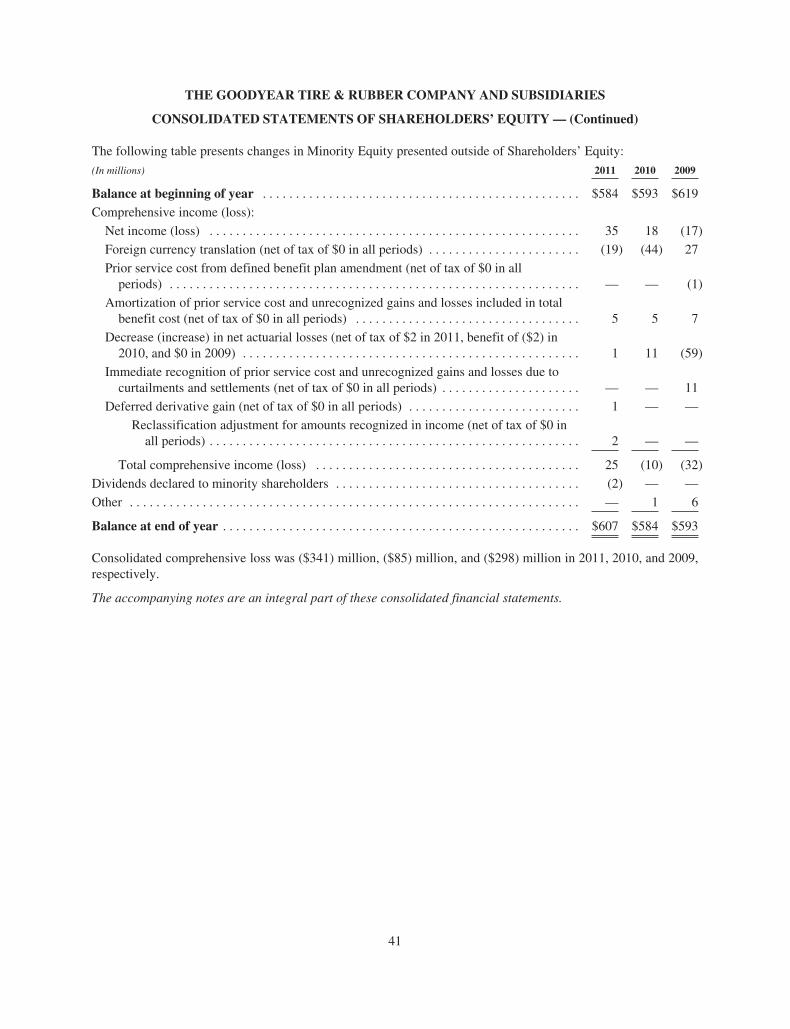
THE GOODYEAR TIRE & RUBBER COMPANY AND SUBSIDIARIES
CONSOLIDATED STATEMENTS OF SHAREHOLDERS’ EQUITY— (Continued)
The following table presents changes in Minority Equity presented outside of Shareholders’ Equity:
(In millions) 2011 2010 2009
Balance at beginning of year . . . . . . . . . . . . . . . . . . . . . . . . . . . . . . . . . . . . . . . . . . . . . . . . $584 $593 $619
Comprehensive income (loss):
Net income (loss) . . . . . . . . . . . . . . . . . . . . . . . . . . . . . . . . . . . . . . . . . . . . . . . . . . . . . . . . 35 18 (17)
Foreign currency translation (net of tax of $0 in all periods) . . . . . . . . . . . . . . . . . . . . . . . (19) (44) 27
Prior service cost from defined benefit plan amendment (net of tax of $0 in allperiods) . . . . . . . . . . . . . . . . . . . . . . . . . . . . . . . . . . . . . . . . . . . . . . . . . . . . . . . . . . . . . . — — (1)
Amortization of prior service cost and unrecognized gains and losses included in totalbenefit cost (net of tax of $0 in all periods) . . . . . . . . . . . . . . . . . . . . . . . . . . . . . . . . . . 5 5 7
Decrease (increase) in net actuarial losses (net of tax of $2 in 2011, benefit of ($2) in2010, and $0 in 2009) . . . . . . . . . . . . . . . . . . . . . . . . . . . . . . . . . . . . . . . . . . . . . . . . . . . 1 11 (59)
Immediate recognition of prior service cost and unrecognized gains and losses due tocurtailments and settlements (net of tax of $0 in all periods) . . . . . . . . . . . . . . . . . . . . . — — 11
Deferred derivative gain (net of tax of $0 in all periods) . . . . . . . . . . . . . . . . . . . . . . . . . . 1 — —
Reclassification adjustment for amounts recognized in income (net of tax of $0 inall periods) . . . . . . . . . . . . . . . . . . . . . . . . . . . . . . . . . . . . . . . . . . . . . . . . . . . . . . . . 2 — —
Total comprehensive income (loss) . . . . . . . . . . . . . . . . . . . . . . . . . . . . . . . . . . . . . . . . 25 (10) (32)
Dividends declared to minority shareholders . . . . . . . . . . . . . . . . . . . . . . . . . . . . . . . . . . . . . (2) — —
Other . . . . . . . . . . . . . . . . . . . . . . . . . . . . . . . . . . . . . . . . . . . . . . . . . . . . . . . . . . . . . . . . . . . . — 1 6
Balance at end of year . . . . . . . . . . . . . . . . . . . . . . . . . . . . . . . . . . . . . . . . . . . . . . . . . . . . . . $607 $584 $593
Consolidated comprehensive loss was ($341) million, ($85) million, and ($298) million in 2011, 2010, and 2009,respectively.
The accompanying notes are an integral part of these consolidated financial statements.
41
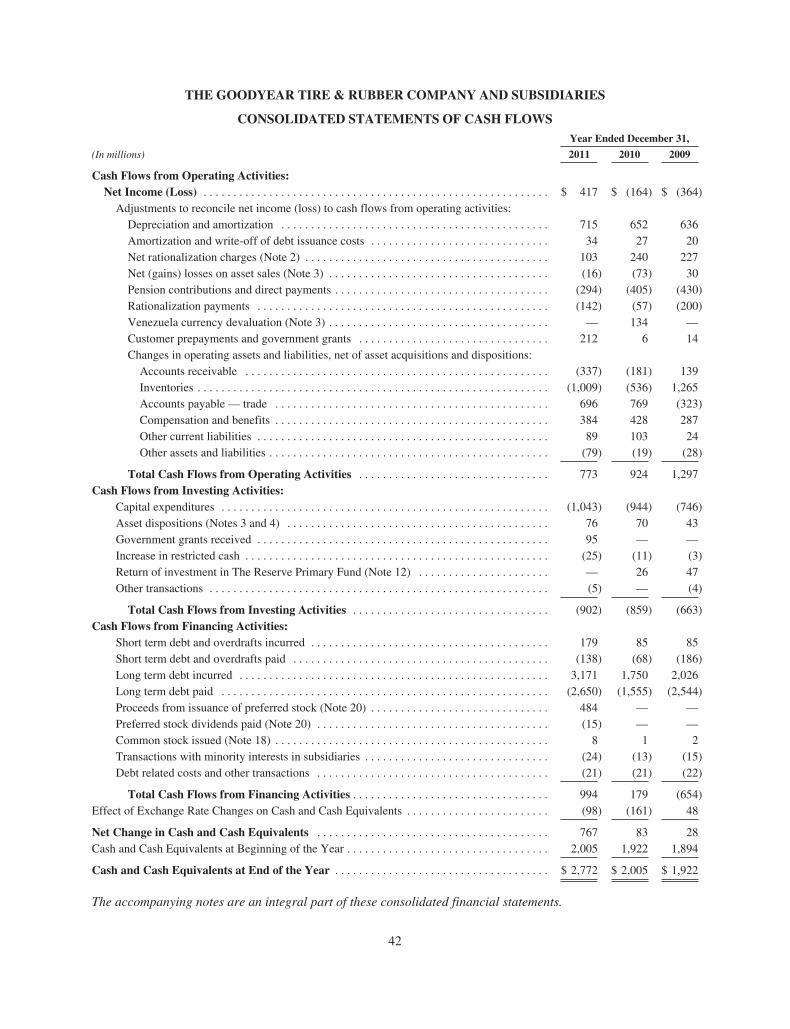
THE GOODYEAR TIRE & RUBBER COMPANY AND SUBSIDIARIES
CONSOLIDATED STATEMENTS OF CASH FLOWSYear Ended December 31,
(In millions) 2011 2010 2009
Cash Flows from Operating Activities:Net Income (Loss) . . . . . . . . . . . . . . . . . . . . . . . . . . . . . . . . . . . . . . . . . . . . . . . . . . . . . . . . . . $ 417 $ (164) $ (364)
Adjustments to reconcile net income (loss) to cash flows from operating activities:Depreciation and amortization . . . . . . . . . . . . . . . . . . . . . . . . . . . . . . . . . . . . . . . . . . . . . 715 652 636Amortization and write-off of debt issuance costs . . . . . . . . . . . . . . . . . . . . . . . . . . . . . . 34 27 20Net rationalization charges (Note 2) . . . . . . . . . . . . . . . . . . . . . . . . . . . . . . . . . . . . . . . . . 103 240 227Net (gains) losses on asset sales (Note 3) . . . . . . . . . . . . . . . . . . . . . . . . . . . . . . . . . . . . . (16) (73) 30Pension contributions and direct payments . . . . . . . . . . . . . . . . . . . . . . . . . . . . . . . . . . . . (294) (405) (430)Rationalization payments . . . . . . . . . . . . . . . . . . . . . . . . . . . . . . . . . . . . . . . . . . . . . . . . . (142) (57) (200)Venezuela currency devaluation (Note 3) . . . . . . . . . . . . . . . . . . . . . . . . . . . . . . . . . . . . . — 134 —Customer prepayments and government grants . . . . . . . . . . . . . . . . . . . . . . . . . . . . . . . . 212 6 14Changes in operating assets and liabilities, net of asset acquisitions and dispositions:
Accounts receivable . . . . . . . . . . . . . . . . . . . . . . . . . . . . . . . . . . . . . . . . . . . . . . . . . . . (337) (181) 139Inventories . . . . . . . . . . . . . . . . . . . . . . . . . . . . . . . . . . . . . . . . . . . . . . . . . . . . . . . . . . . (1,009) (536) 1,265Accounts payable — trade . . . . . . . . . . . . . . . . . . . . . . . . . . . . . . . . . . . . . . . . . . . . . . 696 769 (323)Compensation and benefits . . . . . . . . . . . . . . . . . . . . . . . . . . . . . . . . . . . . . . . . . . . . . . 384 428 287Other current liabilities . . . . . . . . . . . . . . . . . . . . . . . . . . . . . . . . . . . . . . . . . . . . . . . . . 89 103 24Other assets and liabilities . . . . . . . . . . . . . . . . . . . . . . . . . . . . . . . . . . . . . . . . . . . . . . . (79) (19) (28)
Total Cash Flows from Operating Activities . . . . . . . . . . . . . . . . . . . . . . . . . . . . . . . . 773 924 1,297Cash Flows from Investing Activities:
Capital expenditures . . . . . . . . . . . . . . . . . . . . . . . . . . . . . . . . . . . . . . . . . . . . . . . . . . . . . . . (1,043) (944) (746)Asset dispositions (Notes 3 and 4) . . . . . . . . . . . . . . . . . . . . . . . . . . . . . . . . . . . . . . . . . . . . 76 70 43Government grants received . . . . . . . . . . . . . . . . . . . . . . . . . . . . . . . . . . . . . . . . . . . . . . . . . 95 — —Increase in restricted cash . . . . . . . . . . . . . . . . . . . . . . . . . . . . . . . . . . . . . . . . . . . . . . . . . . . (25) (11) (3)Return of investment in The Reserve Primary Fund (Note 12) . . . . . . . . . . . . . . . . . . . . . . — 26 47Other transactions . . . . . . . . . . . . . . . . . . . . . . . . . . . . . . . . . . . . . . . . . . . . . . . . . . . . . . . . . (5) — (4)
Total Cash Flows from Investing Activities . . . . . . . . . . . . . . . . . . . . . . . . . . . . . . . . . (902) (859) (663)Cash Flows from Financing Activities:
Short term debt and overdrafts incurred . . . . . . . . . . . . . . . . . . . . . . . . . . . . . . . . . . . . . . . . 179 85 85Short term debt and overdrafts paid . . . . . . . . . . . . . . . . . . . . . . . . . . . . . . . . . . . . . . . . . . . (138) (68) (186)Long term debt incurred . . . . . . . . . . . . . . . . . . . . . . . . . . . . . . . . . . . . . . . . . . . . . . . . . . . . 3,171 1,750 2,026Long term debt paid . . . . . . . . . . . . . . . . . . . . . . . . . . . . . . . . . . . . . . . . . . . . . . . . . . . . . . . (2,650) (1,555) (2,544)Proceeds from issuance of preferred stock (Note 20) . . . . . . . . . . . . . . . . . . . . . . . . . . . . . . 484 — —Preferred stock dividends paid (Note 20) . . . . . . . . . . . . . . . . . . . . . . . . . . . . . . . . . . . . . . . (15) — —Common stock issued (Note 18) . . . . . . . . . . . . . . . . . . . . . . . . . . . . . . . . . . . . . . . . . . . . . . 8 1 2Transactions with minority interests in subsidiaries . . . . . . . . . . . . . . . . . . . . . . . . . . . . . . . (24) (13) (15)Debt related costs and other transactions . . . . . . . . . . . . . . . . . . . . . . . . . . . . . . . . . . . . . . . (21) (21) (22)
Total Cash Flows from Financing Activities . . . . . . . . . . . . . . . . . . . . . . . . . . . . . . . . . 994 179 (654)Effect of Exchange Rate Changes on Cash and Cash Equivalents . . . . . . . . . . . . . . . . . . . . . . . . (98) (161) 48
Net Change in Cash and Cash Equivalents . . . . . . . . . . . . . . . . . . . . . . . . . . . . . . . . . . . . . . . 767 83 28Cash and Cash Equivalents at Beginning of the Year . . . . . . . . . . . . . . . . . . . . . . . . . . . . . . . . . . 2,005 1,922 1,894
Cash and Cash Equivalents at End of the Year . . . . . . . . . . . . . . . . . . . . . . . . . . . . . . . . . . . . $ 2,772 $ 2,005 $ 1,922
The accompanying notes are an integral part of these consolidated financial statements.
42
THE GOODYEAR TIRE & RUBBER COMPANY AND SUBSIDIARIES
NOTES TO CONSOLIDATED FINANCIAL STATEMENTS
Note 1. Accounting Policies
A summary of the significant accounting policies used in the preparation of the accompanying consolidatedfinancial statements follows:
Basis of Presentation
Recently Issued Accounting Standards
In May 2011 the Financial Accounting Standards Board (“FASB”) issued an accounting standards update withnew guidance on fair value measurement and disclosure requirements. The standards update does not extend theuse of fair value accounting beyond that currently required under U.S. GAAP, but instead provides guidance onthe application of fair value accounting where it is already required or permitted by other standards. Thestandards update also requires additional disclosures related to transfers of financial instruments within the fairvalue hierarchy and quantitative and qualitative disclosures related to significant unobservable inputs. Thestandards update is effective for fiscal years beginning after December 15, 2011. We do not expect the adoptionof this standard to have a material impact on our consolidated financial statements.
In June 2011 the FASB issued an accounting standards update with new guidance on the presentation ofother comprehensive income. The standards update eliminates the option of presenting other comprehensiveincome and its components in the statement of shareholders’ equity. The standards update now requires an entityto either present components of net income and other comprehensive income in one continuous statement or intwo separate but consecutive statements. The standard will require us to change the presentation of othercomprehensive income in our financial statements effective for fiscal years beginning after December 15, 2011.
In December 2011 the FASB issued an accounting standards update requiring new disclosures aboutfinancial instruments and derivative instruments that are either offset by or subject to an enforceable masternetting arrangement or similar agreement. The standards update is effective for fiscal years beginning afterDecember 15, 2012. We are currently evaluating the impact of adopting this standard on our consolidatedfinancial statements.
Recently Adopted Accounting Standards
In September 2011 the FASB issued an accounting standards update with new guidance on annual goodwillimpairment testing. The standards update allows an entity to first assess qualitative factors to determine if it ismore likely than not that the fair value of a reporting unit is less than its carrying amount. If based on itsqualitative assessment an entity concludes it is more likely than not that the fair value of a reporting unit is lessthan its carrying amount, quantitative impairment testing is required. However, if an entity concludes otherwise,quantitative impairment testing is not required. The standards update is effective for annual and interim goodwillimpairment tests performed for fiscal years beginning after December 15, 2011, with early adoption permitted.We have elected to early adopt the standards update effective July 1, 2011. We completed a qualitativeassessment of goodwill at July 31, 2011 and concluded it is more likely than not that the fair value of eachreporting unit is not less than its carrying value and, therefore, did not perform a quantitative assessment.
Other
We are a party to shareholder agreements concerning certain of our less-than-wholly-owned consolidatedsubsidiaries. Under the terms of certain of these agreements, the minority shareholders have the right to requireus to purchase their ownership interests in the respective subsidiaries if there is a change in control of theCompany or a bankruptcy of the Company. Accordingly, we have reported the minority equity in thosesubsidiaries outside of shareholders’ equity.
43
THE GOODYEAR TIRE & RUBBER COMPANY AND SUBSIDIARIES
Principles of Consolidation
The consolidated financial statements include the accounts of all majority-owned subsidiaries and variableinterest entities in which we are the primary beneficiary. Investments in companies in which we do not own amajority interest and we have the ability to exercise significant influence over operating and financial policies areaccounted for using the equity method. Investments in other companies are carried at cost. All intercompanybalances and transactions have been eliminated in consolidation.
Use of Estimates
The preparation of financial statements in conformity with generally accepted accounting principles requiresmanagement to make estimates and assumptions that affect the amounts reported in the consolidated financialstatements and related notes to financial statements. Actual results could differ from those estimates. On anongoing basis, management reviews its estimates, including those related to:
• recoverability of intangibles and other long-lived assets,
• deferred tax asset valuation allowances and uncertain income tax positions,
• workers’ compensation,
• general and product liabilities and other litigation,
• pension and other postretirement benefits, and
• various other operating allowances and accruals, based on currently available information.
Changes in facts and circumstances may alter such estimates and affect results of operations and financialposition in future periods.
Revenue Recognition and Accounts Receivable Valuation
Revenues are recognized when finished products are shipped to unaffiliated customers, both title and the risksand rewards of ownership are transferred or services have been rendered and accepted, and collectability isreasonably assured. A provision for sales returns, discounts and allowances is recorded at the time of sale.Appropriate provisions are made for uncollectible accounts based on historical loss experience, portfolioduration, economic conditions and credit risk. The adequacy of the allowances are assessed quarterly.
Shipping and Handling Costs
Costs incurred for transportation of products to customers are recorded as a component of Cost of Goods Sold(“CGS”).
Research and Development Costs
Research and development costs include, among other things, materials, equipment, compensation and contractservices. These costs are expensed as incurred and included as a component of CGS. Research and developmentexpenditures were $369 million, $342 million, and $337 million in 2011, 2010, and 2009, respectively.
Warranty
Warranties are provided on the sale of certain of our products and services and an accrual for estimated futureclaims is recorded at the time revenue is recognized. Tire replacement under most of the warranties we offer is ona prorated basis. Warranty reserves are based on past claims experience, sales history and other considerations.Refer to Note 19.
44
THE GOODYEAR TIRE & RUBBER COMPANY AND SUBSIDIARIES
Environmental Cleanup Matters
We expense environmental costs related to existing conditions resulting from past or current operations and fromwhich no current or future benefit is discernible. Expenditures that extend the life of the related property ormitigate or prevent future environmental contamination are capitalized. We determine our liability on a site bysite basis and record a liability at the time when it is probable and can be reasonably estimated. Our estimatedliability is reduced to reflect the anticipated participation of other potentially responsible parties in thoseinstances where it is probable that such parties are legally responsible and financially capable of paying theirrespective shares of the relevant costs. Our estimated liability is not discounted or reduced for possible recoveriesfrom insurance carriers. Refer to Note 19.
Legal Costs
We record a liability for estimated legal and defense costs related to pending general and product liability claims,environmental matters and workers’ compensation claims. Refer to Note 19.
Advertising Costs
Costs incurred for producing and communicating advertising are generally expensed when incurred as acomponent of Selling, Administrative and General Expense (“SAG”). Costs incurred under our cooperativeadvertising program with dealers and franchisees are generally recorded as reductions of sales as related revenuesare recognized. Advertising costs, including costs for our cooperative advertising programs with dealers andfranchisees, were $471 million, $396 million, and $294 million in 2011, 2010, and 2009, respectively.
Rationalizations
We record costs for rationalization actions implemented to reduce excess and high-cost manufacturing capacity,and to reduce associate headcount. Associate-related costs include severance, supplemental unemploymentcompensation and benefits, medical benefits, pension curtailments, postretirement benefits, and other terminationbenefits. For ongoing benefit arrangements, a liability is recognized when it is probable that employees will beentitled to benefits and the amount can be reasonably estimated. These conditions are generally met when therestructuring plan is approved by management. For one-time benefit arrangements, a liability is incurred andmust be accrued at the date the plan is communicated to employees, unless they will be retained beyond aminimum retention period. In this case, the liability is calculated at the date the plan is communicated toemployees and is accrued ratably over the future service period. Other costs generally include non-cancelablelease costs, contract terminations, and relocation costs. A liability for these costs is recognized in the period inwhich the liability is incurred. Rationalization charges related to accelerated depreciation and asset impairmentsare recorded in CGS or SAG. Refer to Note 2.
Income Taxes
Income taxes are recognized during the year in which transactions enter into the determination of financialstatement income, with deferred taxes being provided for temporary differences between amounts of assets andliabilities for financial reporting purposes and such amounts as measured under applicable tax laws. The effect ondeferred tax assets or liabilities of a change in the tax law or tax rate is recognized in the period the change isenacted. Valuation allowances are recorded to reduce net deferred tax assets to the amount that is more likelythan not to be realized. The calculation of our tax liabilities also involves dealing with uncertainties in theapplication of complex tax regulations. We recognize liabilities for uncertain income tax positions based on ourestimate of whether it is more likely than not that additional taxes will be required. We also report interest andpenalties related to uncertain income tax positions as income taxes. Refer to Note 6.
45

THE GOODYEAR TIRE & RUBBER COMPANY AND SUBSIDIARIES
Cash and Cash Equivalents / Consolidated Statements of Cash Flows
Cash and cash equivalents consist of cash on hand and marketable securities with original maturities of threemonths or less. Substantially all of our cash and short-term investment securities are held with investment-graderated counterparties. At December 31, 2011, our cash investments with any single counterparty did not exceed$490 million.
Cash flows associated with derivative financial instruments designated as hedges of identifiable transactionsor events are classified in the same category as the cash flows from the related hedged items. Cash flowsassociated with derivative financial instruments not designated as hedges are classified as operating activities.Bank overdrafts are recorded within Notes payable and overdrafts. Cash flows associated with bank overdraftsare classified as financing activities.
Customer prepayments for products and government grants received that are related to operations arereported as operating activities. Government grants received that are solely related to capital expenditures arereported as investing activities. The Consolidated Statement of Cash Flows is presented net of $17 million of newcapital leases in 2011. Investing activities included a $21 million decrease in accrued capital expenditures in2011 as compared to 2010.
Restricted Net Assets
In certain countries where we operate, transfers of funds into or out of such countries by way of dividends, loansor advances are generally or periodically subject to various restrictive governmental regulations. In addition,certain of our credit agreements and other debt instruments restrict the ability of foreign subsidiaries to makecash distributions. At December 31, 2011, approximately $647 million of net assets were subject to suchrestrictions.
Inventories
Inventories are stated at the lower of cost or market. Cost is determined using the first-in, first-out or the averagecost method. Costs include direct material, direct labor and applicable manufacturing and engineering overhead.We allocate fixed manufacturing overheads based on normal production capacity and recognize abnormalmanufacturing costs as period costs. We determine a provision for excess and obsolete inventory based onmanagement’s review of inventories on hand compared to estimated future usage and sales. Refer to Note 10.
Goodwill and Other Intangible Assets
Goodwill is recorded when the cost of acquired businesses exceeds the fair value of the identifiable net assetsacquired. Goodwill has an indefinite useful life and is not amortized, but is assessed for impairment annually asof July 31. In the third quarter of 2011, in conjunction with our July 31, 2011 goodwill assessment, we adoptednew accounting guidance that allows an entity to first assess qualitative factors to determine if it is more likelythan not that the fair value of a reporting unit is less than its carrying amount and if a quantitative assessmentshould be performed. We performed a qualitative analysis and concluded it is more likely than not that the fairvalue of each reporting unit is not less than its carrying value and, therefore, did not perform a quantitativeanalysis. Accordingly, the annual impairment assessment at July 31, 2011 indicated there is no impairment ofgoodwill. In addition to the annual assessment, an impairment assessment of goodwill is conducted when eventsoccur or circumstances change that would more likely than not reduce the fair value of a reporting unit below itscarrying amount. Qualitative factors considered during our assessment include the capital markets environment,global economic conditions, tire industry competition and trends, changes in our results of operations, themagnitude of the excess of fair value over the carrying amount of each reporting unit as determined in prioryears’ quantitative testing, and other factors.
Intangible assets with indefinite useful lives also are not amortized but are tested for impairment annuallyeach year as of July 31, or when events or circumstances change that would more likely than not reduce the fair
46
THE GOODYEAR TIRE & RUBBER COMPANY AND SUBSIDIARIES
value of an asset below its carrying amount. The impairment test as of July 31, 2011 indicated no impairment forour intangible assets with indefinite useful lives. Goodwill and intangible assets with indefinite useful liveswould be written down to fair value if considered impaired. Intangible assets with finite useful lives areamortized to their estimated residual values over such finite lives, and reviewed for impairment whenever eventsor circumstances warrant such a review. Costs of acquisition, renewal and extension of intangible assets arecapitalized. There are no significant renewal or extension provisions associated with our intangible assets. Referto Note 11.
Investments
Investments in marketable securities are stated at fair value. Fair value is determined using quoted market pricesat the end of the reporting period and, when appropriate, exchange rates at that date. Unrealized gains and losseson marketable securities classified as available-for-sale are recorded in Accumulated Other Comprehensive Loss(“AOCL”), net of tax. We regularly review our investments to determine whether a decline in fair value belowthe cost basis is other than temporary. If the decline in fair value is judged to be other than temporary, the costbasis of the security is written down to fair value and the amount of the write-down is included in theConsolidated Statements of Operations. Refer to Notes 12 and 21.
Property, Plant and Equipment
Property, plant and equipment are stated at cost. Depreciation is computed using the straight-line method.Additions and improvements that substantially extend the useful life of property, plant and equipment, andinterest costs incurred during the construction period of major projects are capitalized. Government grants to usthat are solely related to capital expenditures are recorded as reductions of the cost of the associated assets.Repair and maintenance costs are expensed as incurred. Property, plant and equipment are depreciated to theirestimated residual values over their estimated useful lives, and reviewed for impairment whenever events orcircumstances warrant such a review. Refer to Notes 5 and 13.
Foreign Currency Translation
The functional currency for most subsidiaries outside the United States is the local currency. Financial statementsof these subsidiaries are translated into U.S. dollars using the exchange rate at each balance sheet date for assetsand liabilities and a weighted average exchange rate for each period for revenues, expenses, gains and losses.Transaction gains and losses are recorded in the Consolidated Statement of Operations. Translation adjustmentsare recorded in AOCL. Income taxes are generally not provided for foreign currency translation adjustments.
Derivative Financial Instruments and Hedging Activities
To qualify for hedge accounting, hedging instruments must be designated as hedges and meet defined correlationand effectiveness criteria. These criteria require that the anticipated cash flows and/or changes in fair value of thehedging instrument substantially offset those of the position being hedged.
Derivative contracts are reported at fair value on the Consolidated Balance Sheets as both current and longterm Accounts Receivable or Other Liabilities. Deferred gains and losses on contracts designated as cash flowhedges are recorded net of tax in AOCL. Ineffectiveness in hedging relationships is recorded in Other Expense inthe current period.
Interest Rate Contracts — Gains and losses on contracts designated as cash flow hedges are initially deferred andrecorded in AOCL. Amounts are transferred from AOCL and recognized in income as Interest Expense in thesame period that the hedged item is recognized in income. Gains and losses on contracts designated as fair valuehedges are recognized in income in the current period as Interest Expense. Gains and losses on contracts with nohedging designation are recorded in the current period in Other Expense.
47

THE GOODYEAR TIRE & RUBBER COMPANY AND SUBSIDIARIES
Foreign Currency Contracts — Gains and losses on contracts designated as cash flow hedges are initiallydeferred and recorded in AOCL. Amounts are transferred from AOCL and recognized in income in the sameperiod and on the same line that the hedged item is recognized in income. Gains and losses on contractsdesignated as fair value hedges, excluding premiums, are recorded in Other Expense in the current period. Gainsand losses on contracts with no hedging designation are also recorded in Other Expense in the current period. Wedo not include premiums paid on forward currency contracts in our assessment of hedge effectiveness. Premiumson contracts designated as hedges are recognized in Other Expense over the life of the contract.
Net Investment Hedging — Nonderivative instruments denominated in foreign currencies are used from time totime to hedge net investments in foreign subsidiaries. Gains and losses on these instruments are deferred andrecorded in AOCL as Foreign Currency Translation Adjustments. These gains and losses are only recognized inincome upon the complete or partial sale of the related investment or the complete liquidation of the investment.
Termination of Contracts — Gains and losses (including deferred gains and losses in AOCL) are recognized inOther Expense when contracts are terminated concurrently with the termination of the hedged position. To theextent that such position remains outstanding, gains and losses are amortized to Interest Expense or to OtherExpense over the remaining life of that position. Gains and losses on contracts that we temporarily continue tohold after the early termination of a hedged position, or that otherwise no longer qualify for hedge accounting,are recognized in income in Other Expense. Refer to Note 15.
Stock-Based Compensation
We measure compensation cost arising from the grant of share-based awards to employees at fair value andrecognize such cost in income over the period during which the service is provided, usually the vesting period.We recognize compensation expense using the straight-line approach.
Share-based awards to employees include grants of performance share units and stock options. We measurethe fair value of grants of performance share units based primarily on the closing market price of a share of ourcommon stock on the date of the grant, modified as appropriate to take into account the features of such grants.
We estimate the fair value of stock options using the Black-Scholes valuation model. Assumptions used toestimate compensation expense are determined as follows:
• Expected term is determined using a weighted average of the contractual term and vesting period of theaward under the simplified method, as historical data was not sufficient to provide a reasonable estimate;
• Expected volatility is measured using the weighted average of historical daily changes in the market priceof our common stock over the expected term of the award and implied volatility calculated for ourexchange traded options with an expiration date greater than one year;
• Risk-free interest rate is equivalent to the implied yield on zero-coupon U.S. Treasury bonds with aremaining maturity equal to the expected term of the awards; and
• Forfeitures are based substantially on the history of cancellations of similar awards granted in prior years.
Refer to Note 18.
Earnings Per Share of Common Stock
Basic earnings per share are computed based on the weighted average number of common shares outstanding.Diluted earnings per share primarily reflects the dilutive impact of outstanding stock options, our mandatoryconvertible preferred stock and related dividends. All earnings per share amounts in these notes to theconsolidated financial statements are diluted, unless otherwise noted. Refer to Note 7.
48
THE GOODYEAR TIRE & RUBBER COMPANY AND SUBSIDIARIES
Fair Value Measurements
Valuation Hierarchy
Assets and liabilities measured at fair value are classified using the following hierarchy, which is based upon thetransparency of inputs to the valuation as of the measurement date.
• Level 1 — Valuation is based upon quoted prices (unadjusted) for identical assets or liabilities in activemarkets.
• Level 2 — Valuation is based upon quoted prices for similar assets and liabilities in active markets, orother inputs that are observable for the asset or liability, either directly or indirectly, for substantially thefull term of the financial instrument.
• Level 3 — Valuation is based upon other unobservable inputs that are significant to the fair valuemeasurement.
The classification of fair value measurements within the hierarchy is based upon the lowest level of input that issignificant to the measurement. Valuation methodologies used for assets and liabilities measured at fair value areas follows.
Investments
Where quoted prices are available in an active market, investments are classified within Level 1 of the valuationhierarchy. Level 1 securities include highly liquid government bonds, certain mortgage products and exchange-traded equities. If quoted market prices are not available, fair values are estimated using quoted prices ofsecurities with similar characteristics or inputs other than quoted prices that are observable for the security, andwould be classified within Level 2 of the valuation hierarchy. In certain cases where there is limited activity orless transparency around inputs to the valuation, securities would be classified within Level 3 of the valuationhierarchy.
Derivative Financial Instruments
Exchange-traded derivative financial instruments that are valued using quoted prices would be classified withinLevel 1 of the valuation hierarchy. Derivative financial instruments valued using internally-developed modelsthat use as their basis readily observable market parameters are classified within Level 2 of the valuationhierarchy. Derivative financial instruments that are valued based upon models with significant unobservablemarket parameters, and that are normally traded less actively, would be classified within Level 3 of the valuationhierarchy.
Refer to Notes 16 and 17.
Reclassifications
Certain items previously reported in specific financial statement captions have been reclassified to conform to the2011 presentation.
Note 2. Costs Associated with Rationalization Programs
In order to maintain our global competitiveness, we have implemented rationalization actions over the pastseveral years to reduce excess and high-cost manufacturing capacity and to reduce associate headcount. The netrationalization charges included in Income (Loss) before Income Taxes are as follows:
(In millions) 2011 2010 2009
New charges . . . . . . . . . . . . . . . . . . . . . . . . . . . . . . . . . . . . . . . . . . . . . . . . . . . . . . $106 $261 $246
Reversals . . . . . . . . . . . . . . . . . . . . . . . . . . . . . . . . . . . . . . . . . . . . . . . . . . . . . . . . . (3) (21) (19)
$103 $240 $227
49
THE GOODYEAR TIRE & RUBBER COMPANY AND SUBSIDIARIES
The following table presents the roll-forward of the liability balance between periods:
(In millions)Associate-related
Costs
Other ThanAssociate-related
Costs Total
Balance at December 31, 2008 . . . . . . . . . . . . . . . . . . . . . . . $ 118 $ 18 $ 136
2009 charges . . . . . . . . . . . . . . . . . . . . . . . . . . . . . . . . . . . . . . 217 29 246
Incurred . . . . . . . . . . . . . . . . . . . . . . . . . . . . . . . . . . . . . . . . . . (199) (19) (218)
Reversed to the Statement of Operations . . . . . . . . . . . . . . . . (16) (3) (19)
Balance at December 31, 2009 . . . . . . . . . . . . . . . . . . . . . . . $ 120 $ 25 $ 145
2010 charges . . . . . . . . . . . . . . . . . . . . . . . . . . . . . . . . . . . . . . 237 24 261
Incurred . . . . . . . . . . . . . . . . . . . . . . . . . . . . . . . . . . . . . . . . . . (129) (26) (155)
Reversed to the Statement of Operations . . . . . . . . . . . . . . . . (16) (5) (21)
Balance at December 31, 2010 . . . . . . . . . . . . . . . . . . . . . . . $ 212 $ 18 $ 230
2011 charges . . . . . . . . . . . . . . . . . . . . . . . . . . . . . . . . . . . . . . 60 46 106
Incurred . . . . . . . . . . . . . . . . . . . . . . . . . . . . . . . . . . . . . . . . . . (104) (45) (149)
Reversed to the Statement of Operations . . . . . . . . . . . . . . . . (2) (1) (3)
Balance at December 31, 2011 . . . . . . . . . . . . . . . . . . . . . . . $ 166 $ 18 $ 184
Rationalization actions initiated in 2011 related to plans to reduce manufacturing, selling, administrative andgeneral expenses through headcount reductions in Europe, Middle East and Africa Tire (“EMEA”) and AsiaPacific Tire. In addition, Asia Pacific Tire initiated a plan related to the relocation of its manufacturing facility inDalian, China to Pulandian, China.
During 2011, net rationalization charges of $103 million were recorded. New charges of $106 million werecomprised of $25 million for plans initiated in 2011, consisting of $19 million for associate severance andpension costs and $6 million for other exit and non-cancelable lease costs, and $81 million for plans initiatedprimarily in 2010, consisting of $41 million for associate severance costs and $40 million for other exit andnon-cancelable lease costs primarily related to the closure of our Union City, Tennessee manufacturing facility inJuly 2011. These amounts include $104 million related to future cash outflows and $2 million for pensionsettlements, curtailments and termination benefits. The net charges in 2011 also included the reversal of $3million of reserves for actions no longer needed for their originally-intended purposes. Approximately 500associates will be released under 2011 plans of which 100 were released in 2011. We expect to record additionalcharges in 2012 totaling approximately $21 million related to the 2011 plans, primarily in connection with therelocation of our Dalian, China manufacturing facility.
The accrual balance of $184 million at December 31, 2011 consists of $166 million for associate severancecosts that are expected to be substantially utilized within the next twelve months and $18 million primarily forlong term non-cancelable lease costs. At December 31, 2011, $46 million and $102 million, respectively, of theaccrual balance relates to plans associated with the closure of our Union City, Tennessee manufacturing facilityand the announced discontinuation of consumer tire production at one of our facilities in Amiens, France.
Asset write-offs and accelerated depreciation charges of $50 million were recorded in CGS in 2011 andwere related primarily to property and equipment in our Union City, Tennessee manufacturing facility. Weexpect to record approximately $9 million of accelerated depreciation and asset write-offs in 2012 related to therelocation of our Dalian, China manufacturing facility.
In 2010, North American Tire initiated plans to close its manufacturing facility in Union City, Tennessee toreduce high-cost manufacturing capacity and to consolidate several warehouses to further improve its supply
50
THE GOODYEAR TIRE & RUBBER COMPANY AND SUBSIDIARIES
chain. EMEA increased the cost related to the discontinuation of consumer tire production at one of our facilitiesin Amiens, France. Asia Pacific Tire initiated and substantially completed the closure of a manufacturing facilityin Taipei, Taiwan.
During 2010, net rationalization charges of $240 million were recorded. New charges of $261 million werecomprised of $195 million for plans initiated in 2010, consisting of $191 million for associate severance andpension costs and $4 million for other exit and non-cancelable lease costs, and $66 million for plans initiated in2009, consisting of $46 million of associate severance costs and $20 million for other exit costs andnon-cancelable lease costs. These amounts include $177 million related to future cash outflows and $84 millionfor other non-cash exit costs, including $83 million for pension settlements, curtailments and other terminationbenefits. The net charges in 2010 also included the reversal of $21 million of reserves for actions no longerneeded for their originally-intended purposes. Approximately 2,200 associates were to be released under 2010plans, all of which were released by December 31, 2011, primarily in connection with the closure of our UnionCity, Tennessee facility.
Asset write-offs and accelerated depreciation charges of $15 million were recorded in CGS in 2010 andwere related primarily to the closure of our Taiwan facility.
In 2009, North American Tire initiated manufacturing headcount reductions at several facilities, includingUnion City, Tennessee, Danville, Virginia and Topeka, Kansas, to respond to lower production demand.Additional salaried headcount reductions were initiated at our corporate offices in Akron, Ohio, in NorthAmerican Tire and throughout EMEA. We also initiated the discontinuation of consumer tire production at oneof our facilities in Amiens, France. Latin American Tire initiated manufacturing headcount reductions at each ofits two facilities in Brazil.
During 2009, net rationalization charges of $227 million were recorded. New charges of $246 million werecomprised of $208 million for plans initiated in 2009, consisting of $194 million of associate severance andpension costs and $14 million for other exit and non-cancelable lease costs, and $38 million for plans initiated in2008, consisting of $23 million of associate severance costs and $15 million for other exit and non-cancelablelease costs. These amounts include $229 million related to future cash outflows and $17 million for othernon-cash exit costs, including $14 million for pension settlements, curtailments and other termination benefits.The net charges in 2009 also included the reversal of $19 million of charges for actions no longer needed fortheir originally-intended purposes. Approximately 4,100 associates will be released under 2009 plans, of which3,500 were released by December 31, 2011.
Asset write-offs and accelerated depreciation charges of $43 million were recorded in CGS in 2009 andrelated primarily to the closure of our Las Pinas, Philippines and Somerton, Australia manufacturing facilitiesand the discontinuation of a line of tires at one our plants in North America.
Note 3. Other Expense
(In millions) Expense(Income) 2011 2010 2009
Financing fees and financial instruments . . . . . . . . . . . . . . . . . . . . . . . . . . . . . . . . . $ 89 $ 95 $ 39
Royalty income . . . . . . . . . . . . . . . . . . . . . . . . . . . . . . . . . . . . . . . . . . . . . . . . . . . . . (47) (30) (28)
Net foreign currency exchange losses . . . . . . . . . . . . . . . . . . . . . . . . . . . . . . . . . . . 27 159 7
General and product liability — discontinued products . . . . . . . . . . . . . . . . . . . . . . 21 11 9
Interest income . . . . . . . . . . . . . . . . . . . . . . . . . . . . . . . . . . . . . . . . . . . . . . . . . . . . . (16) (11) (17)
Net (gains) losses on asset sales . . . . . . . . . . . . . . . . . . . . . . . . . . . . . . . . . . . . . . . . (16) (73) 30
Miscellaneous expense . . . . . . . . . . . . . . . . . . . . . . . . . . . . . . . . . . . . . . . . . . . . . . . 15 35 —
$ 73 $186 $ 40
51
THE GOODYEAR TIRE & RUBBER COMPANY AND SUBSIDIARIES
Financing fees and financial instruments expense was $89 million in 2011, compared to $95 million in 2010 and$39 million in 2009. Financing fees in 2011 included $53 million of charges in the second quarter related to theredemption of $350 million in aggregate principal amount of our outstanding 10.5% senior notes due 2016, ofwhich $37 million related to cash premiums paid on the redemption and $16 million related to the write-off ofdeferred financing fees and unamortized discount. Financing fees in 2010 included $56 million of charges on theredemption of $973 million of long term debt, including a $50 million cash premium paid on the redemption and$6 million of financing fees which were written off. Financing fees and financial instruments expense consists ofthe amortization of deferred financing fees, commitment fees and charges incurred in connection with financingtransactions.
Royalty income is derived primarily from licensing arrangements related to divested businesses. Royaltyincome in 2011 increased due primarily to the recognition of $6 million related to a non-recurring transaction.
Net foreign currency exchange losses in 2011 were $27 million, compared to $159 million and $7 million oflosses in 2010 and 2009, respectively. Foreign currency exchange in all periods reflected net gains and lossesresulting from the effect of exchange rate changes on various foreign currency transactions worldwide. Losses in2010 included a first quarter loss of $110 million resulting from the January 8, 2010 devaluation of theVenezuelan bolivar fuerte against the U.S. dollar and the establishment of a two-tier exchange rate structure, anda fourth quarter foreign currency exchange loss of $24 million in connection with the January 1, 2011 eliminationof the two-tier exchange rate structure.
Effective January 1, 2010, Venezuela’s economy was considered to be highly inflationary underU.S. generally accepted accounting principles since it experienced a rate of general inflation in excess of 100%over the latest three year period, based upon the blended Consumer Price Index and National Consumer PriceIndex. Accordingly, the U.S. dollar was determined to be the functional currency of our Venezuelan subsidiary.All gains and losses resulting from the remeasurement of its financial statements since January 1, 2010 weredetermined using official exchange rates.
On January 8, 2010, Venezuela established a two-tier exchange rate structure for essential and non-essentialgoods. For essential goods the official exchange rate was 2.6 bolivares fuertes to the U.S. dollar and fornon-essential goods the official exchange rate was 4.3 bolivares fuertes to the U.S. dollar. On January 1, 2011,the two-tier exchange rate structure was eliminated. For our unsettled amounts at December 31, 2010 and goingforward, the official exchange rate of 4.3 bolivares fuertes to the U.S. dollar was established for substantially allgoods.
The $110 million foreign currency exchange loss in the first quarter of 2010 primarily consisted of a $157million remeasurement loss on bolivar-denominated net monetary assets and liabilities, including deferred taxes,at the time of the January 2010 devaluation. The loss was primarily related to cash deposits in Venezuela thatwere remeasured at the official exchange rate of 4.3 bolivares fuertes applicable to non-essential goods, and waspartially offset by $47 million subsidy receivable related to U.S. dollar-denominated payables that were expectedto be settled at the official subsidy exchange rate of 2.6 bolivares fuertes applicable to essential goods. Since weexpected these payables to be settled at the subsidy essential goods rate, we established a subsidy receivable toreflect the expected benefit to be received in the form of the difference between the essential and non-essentialgoods exchange rates. Throughout 2010, we periodically assessed our ability to realize the benefit of the subsidyreceivable, and a substantial portion of purchases by our Venezuelan subsidiary had qualified and settled at theofficial exchange rate for essential goods. As a result of the elimination of the official subsidy exchange rate foressential goods, we recorded a foreign currency exchange loss of $24 million in the fourth quarter of 2010 relatedto the reversal of the subsidy receivable at December 31, 2010.
General and product liability — discontinued products includes charges for claims against us relatedprimarily to asbestos personal injury claims, net of probable insurance recoveries. We recorded $17 million, $17million and $24 million of expense related to asbestos claims in 2011, 2010 and 2009, respectively. In addition,
52
THE GOODYEAR TIRE & RUBBER COMPANY AND SUBSIDIARIES
we recorded income of $9 million, $5 million and $10 million related to probable insurance recoveries in 2011,2010 and 2009, respectively. We also recorded $13 million of expense in 2011 related to an adjustment for priorperiods and a gain of $4 million in 2009 on an insurance settlement.
Net gains on asset sales were $16 million in 2011 and included gains of $9 million in Asia Pacific Tire,primarily on the sale of land in Malaysia, and gains of $4 million in Latin American Tire, primarily on the sale ofthe farm tire business.
Net gains on asset sales were $73 million in 2010 and included gains of $58 million in Asia Pacific Tire,primarily on the sale of a closed manufacturing facility in Taiwan and land in Thailand; gains of $7 million inLatin American Tire, including the recognition of a deferred gain from the sale of a warehouse in 2008; gains of$6 million in EMEA, due primarily to the sale of land; and gains of $2 million in North American Tire on thesales of other assets.
Net losses on asset sales in 2009 were $30 million and were due primarily to the sale of certain of ourproperties in Akron, Ohio that comprise our current headquarters to Industrial Realty Group (“IRG”) inconnection with the development of a new headquarters in Akron, Ohio. Prior to the sale, the facilities remainedclassified as held and used. Due to significant uncertainties related to the completion of the transaction resultingfrom then prevailing conditions in the credit markets and the ability of IRG to obtain financing, we concluded thesale was not probable and, accordingly, did not write down the facilities to their net realizable value. Theheadquarters properties were corporate facilities that did not have identifiable cash flows that were largelyindependent of other assets and liabilities and, accordingly, were tested for impairment at the total companylevel. No impairment was indicated as a result of that testing.
Interest income consisted primarily of amounts earned on cash deposits. Miscellaneous expense in 2011included a loss of $9 million related to our insurance deductible with respect to losses as a result of flooding inThailand. Miscellaneous expense in 2010 included a charge of $25 million related to a claim regarding the use ofvalue-added tax credits in prior years. Miscellaneous expense in 2009 included a loss of $18 million on theliquidation of our subsidiary in Guatemala due primarily to accumulated foreign currency translation losses. Inaddition, in 2009 we recognized $26 million of insurance proceeds in income related to the settlement of a claimas a result of a fire in 2007 in our Thailand facility.
Note 4. Sale of Farm Tire and Wire Businesses
On December 13, 2010, we entered into agreements with Titan Tire Corporation, a subsidiary of TitanInternational Inc., to sell our European and Latin American farm tire businesses, including licensing agreementsthat would allow Titan to manufacture and sell Goodyear-brand farm tires in Europe, Latin America and NorthAmerica. The Latin American portion of the transaction was completed on April 1, 2011. Proceeds from the salewere $99 million, before withholding taxes of $5 million. We recorded a pre-tax gain of $6 million on the sale in2011. The European portion of the transaction was subject to the exercise of a put option by us followingcompletion of a social plan related to the previously announced discontinuation of consumer tire production atone of our facilities in Amiens, France and required consultation with various works councils. The put optionexpired on November 30, 2011. Titan is no longer obligated to purchase our European farm tire business, and wedo not have an anticipated time frame in which we expect to complete the sale of that business.
The assets and liabilities of the Latin American farm tire business were classified as held-for-sale atDecember 31, 2010. The carrying amount of the net assets at that date totaled $33 million, and included $44million of property, plant and equipment, $16 million of inventories, $14 million of deferred income, $10 millionof compensation and benefit liabilities, and $5 million of deferred income taxes. Due to uncertainty surroundingthe timing of the completion of the Amiens social plan, the European farm tire business was classified asheld-and-used at December 31, 2010 and through the expiration of the put option on November 30, 2011.
On July 1, 2011, we sold our steel tire cord (wire) manufacturing business to Hyosung Corporation. Thetransaction consisted primarily of inventories and manufacturing equipment at our facilities in Asheboro, North
53
THE GOODYEAR TIRE & RUBBER COMPANY AND SUBSIDIARIES
Carolina and Colmar-Berg, Luxembourg, and a licensing agreement allowing Hyosung to use certain of ourpatents and know-how associated with the acquired business. In addition, we entered into an agreement underwhich Hyosung will supply us with finished wire products. Proceeds from the transaction were $50 million. Werecorded a pre-tax gain of approximately $1 million on the transaction.
Note 5. Interest Expense
Interest expense includes interest and amortization of debt discounts, less amounts capitalized as follows:
(In millions) 2011 2010 2009
Interest expense before capitalization . . . . . . . . . . . . . . . . . . . . . . . . . . . . . . . . . . . $361 $342 $325
Capitalized interest . . . . . . . . . . . . . . . . . . . . . . . . . . . . . . . . . . . . . . . . . . . . . . . . . (31) (26) (14)
$330 $316 $311
Cash payments for interest, net of amounts capitalized were $309 million, $301 million and $290 million in2011, 2010 and 2009, respectively.
Note 6. Income Taxes
The components of Income (Loss) before Income Taxes follow:
(In millions) 2011 2010 2009
U.S. . . . . . . . . . . . . . . . . . . . . . . . . . . . . . . . . . . . . . . . . . . . . . . . . . . . . . . . . . . . $(111) $(529) $(631)
Foreign . . . . . . . . . . . . . . . . . . . . . . . . . . . . . . . . . . . . . . . . . . . . . . . . . . . . . . . . 729 537 274
$ 618 $ 8 $(357)
A reconciliation of income taxes at the U.S. statutory rate to income taxes provided on Income (Loss):
(In millions) 2011 2010 2009
U.S. Federal income tax expense (benefit) at the statutory rate of 35% . . . . . . . . $216 $ 3 $(125)
Adjustment for foreign income taxed at different rates . . . . . . . . . . . . . . . . . . . . . (28) 4 (1)
U.S. loss with no tax benefit . . . . . . . . . . . . . . . . . . . . . . . . . . . . . . . . . . . . . . . . . 41 178 123
Net foreign operating losses with no tax due to valuation allowances . . . . . . . . . 5 18 51
Net (release) establishment of valuation allowances . . . . . . . . . . . . . . . . . . . . . . . (59) (1) (22)
Net (resolution) establishment of uncertain tax positions . . . . . . . . . . . . . . . . . . . 24 (15) (18)
Deferred tax impact of enacted tax rate and law changes . . . . . . . . . . . . . . . . . . . — (16) (2)
Other . . . . . . . . . . . . . . . . . . . . . . . . . . . . . . . . . . . . . . . . . . . . . . . . . . . . . . . . . . . 2 1 1
United States and Foreign Taxes . . . . . . . . . . . . . . . . . . . . . . . . . . . . . . . . . . . . . . $201 $172 $ 7
54
THE GOODYEAR TIRE & RUBBER COMPANY AND SUBSIDIARIES
The components of the provision (benefit) for taxes on Income (Loss), by taxing jurisdiction, follow:
(In millions) 2011 2010 2009
Current:
Federal . . . . . . . . . . . . . . . . . . . . . . . . . . . . . . . . . . . . . . . . . . . . . . . . . . . . . . . . $ — $ (15) $ (8)
Foreign . . . . . . . . . . . . . . . . . . . . . . . . . . . . . . . . . . . . . . . . . . . . . . . . . . . . . . . . 253 180 144
State . . . . . . . . . . . . . . . . . . . . . . . . . . . . . . . . . . . . . . . . . . . . . . . . . . . . . . . . . . 3 1 (3)
256 166 133
Deferred:
Federal . . . . . . . . . . . . . . . . . . . . . . . . . . . . . . . . . . . . . . . . . . . . . . . . . . . . . . . . 2 (7) (96)
Foreign . . . . . . . . . . . . . . . . . . . . . . . . . . . . . . . . . . . . . . . . . . . . . . . . . . . . . . . . (56) 12 (31)
State . . . . . . . . . . . . . . . . . . . . . . . . . . . . . . . . . . . . . . . . . . . . . . . . . . . . . . . . . . (1) 1 1
(55) 6 (126)
United States and Foreign Taxes . . . . . . . . . . . . . . . . . . . . . . . . . . . . . . . . . . . . $201 $172 $ 7
In 2011, income tax expense included net tax benefits of $36 million primarily related to a $64 million benefitfrom the release of a valuation allowance on our Canadian operations and a $24 million charge related to thesettlement of prior tax years and to increase tax reserves as a result of negative tax court rulings in a foreignjurisdiction.
In 2010, our income tax expense or benefit was allocated among operations and items charged or crediteddirectly to shareholders’ equity. Pursuant to this allocation requirement, a $9 million non-cash tax benefit wasallocated to the loss from our U.S. operations, with offsetting tax expense allocated to items, primarilyattributable to employee benefits, charged directly to shareholders’ equity. Income tax expense in 2010 alsoincluded net tax benefits of $33 million primarily related to a $16 million benefit for enacted tax law changes and$20 million of tax benefits related to the settlement of tax audits and the expiration of statutes of limitations inmultiple tax jurisdictions.
In 2009, our income tax expense or benefit was allocated among operations and items charged or crediteddirectly to shareholders’ equity. Pursuant to this allocation requirement, a $100 million non-cash tax benefit wasallocated to the loss from our U.S. operations, with offsetting tax expense allocated to items, primarilyattributable to employee benefits, charged directly to shareholders’ equity. Income tax expense in 2009 alsoincluded net tax benefits of $42 million, primarily related to a $29 million benefit resulting from the release of avaluation allowance on our Australian operations and a $19 million benefit resulting from the settlement of our1997 through 2003 Competent Authority claim between the United States and Canada.
55
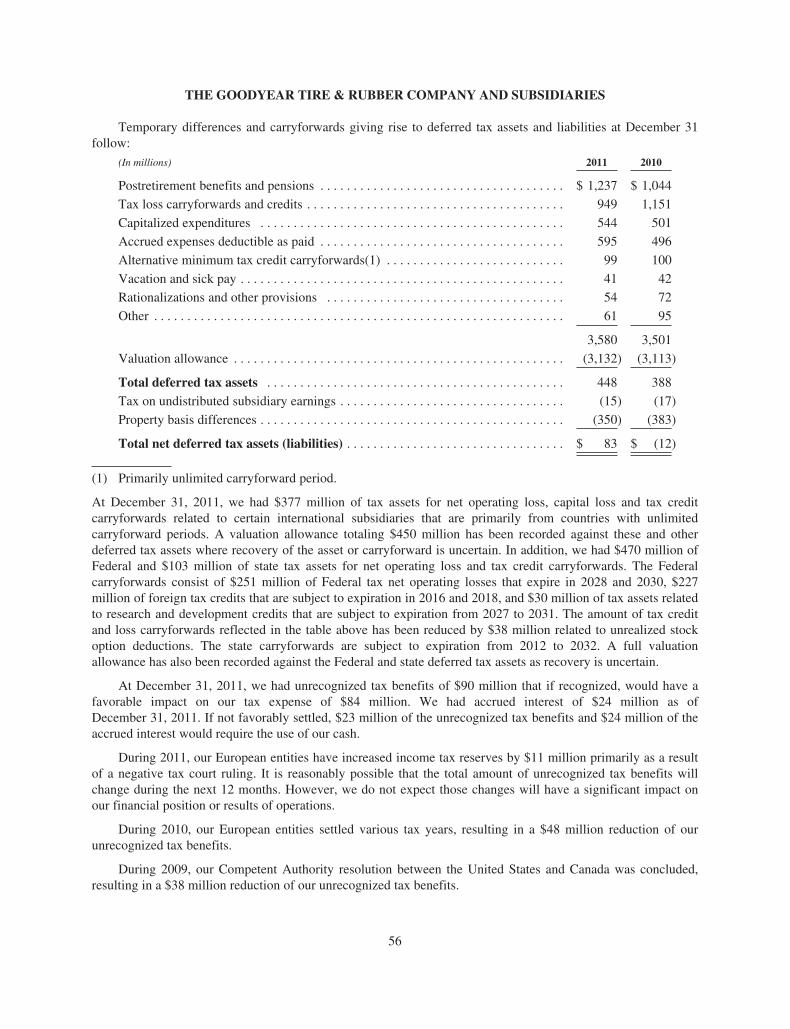
THE GOODYEAR TIRE & RUBBER COMPANY AND SUBSIDIARIES
Temporary differences and carryforwards giving rise to deferred tax assets and liabilities at December 31follow:
(In millions) 2011 2010
Postretirement benefits and pensions . . . . . . . . . . . . . . . . . . . . . . . . . . . . . . . . . . . . . $ 1,237 $ 1,044
Tax loss carryforwards and credits . . . . . . . . . . . . . . . . . . . . . . . . . . . . . . . . . . . . . . . 949 1,151
Capitalized expenditures . . . . . . . . . . . . . . . . . . . . . . . . . . . . . . . . . . . . . . . . . . . . . . 544 501
Accrued expenses deductible as paid . . . . . . . . . . . . . . . . . . . . . . . . . . . . . . . . . . . . . 595 496
Alternative minimum tax credit carryforwards(1) . . . . . . . . . . . . . . . . . . . . . . . . . . . 99 100
Vacation and sick pay . . . . . . . . . . . . . . . . . . . . . . . . . . . . . . . . . . . . . . . . . . . . . . . . . 41 42
Rationalizations and other provisions . . . . . . . . . . . . . . . . . . . . . . . . . . . . . . . . . . . . 54 72
Other . . . . . . . . . . . . . . . . . . . . . . . . . . . . . . . . . . . . . . . . . . . . . . . . . . . . . . . . . . . . . . 61 95
3,580 3,501
Valuation allowance . . . . . . . . . . . . . . . . . . . . . . . . . . . . . . . . . . . . . . . . . . . . . . . . . . (3,132) (3,113)
Total deferred tax assets . . . . . . . . . . . . . . . . . . . . . . . . . . . . . . . . . . . . . . . . . . . . . 448 388
Tax on undistributed subsidiary earnings . . . . . . . . . . . . . . . . . . . . . . . . . . . . . . . . . . (15) (17)
Property basis differences . . . . . . . . . . . . . . . . . . . . . . . . . . . . . . . . . . . . . . . . . . . . . . (350) (383)
Total net deferred tax assets (liabilities) . . . . . . . . . . . . . . . . . . . . . . . . . . . . . . . . . $ 83 $ (12)
(1) Primarily unlimited carryforward period.
At December 31, 2011, we had $377 million of tax assets for net operating loss, capital loss and tax creditcarryforwards related to certain international subsidiaries that are primarily from countries with unlimitedcarryforward periods. A valuation allowance totaling $450 million has been recorded against these and otherdeferred tax assets where recovery of the asset or carryforward is uncertain. In addition, we had $470 million ofFederal and $103 million of state tax assets for net operating loss and tax credit carryforwards. The Federalcarryforwards consist of $251 million of Federal tax net operating losses that expire in 2028 and 2030, $227million of foreign tax credits that are subject to expiration in 2016 and 2018, and $30 million of tax assets relatedto research and development credits that are subject to expiration from 2027 to 2031. The amount of tax creditand loss carryforwards reflected in the table above has been reduced by $38 million related to unrealized stockoption deductions. The state carryforwards are subject to expiration from 2012 to 2032. A full valuationallowance has also been recorded against the Federal and state deferred tax assets as recovery is uncertain.
At December 31, 2011, we had unrecognized tax benefits of $90 million that if recognized, would have afavorable impact on our tax expense of $84 million. We had accrued interest of $24 million as ofDecember 31, 2011. If not favorably settled, $23 million of the unrecognized tax benefits and $24 million of theaccrued interest would require the use of our cash.
During 2011, our European entities have increased income tax reserves by $11 million primarily as a resultof a negative tax court ruling. It is reasonably possible that the total amount of unrecognized tax benefits willchange during the next 12 months. However, we do not expect those changes will have a significant impact onour financial position or results of operations.
During 2010, our European entities settled various tax years, resulting in a $48 million reduction of ourunrecognized tax benefits.
During 2009, our Competent Authority resolution between the United States and Canada was concluded,resulting in a $38 million reduction of our unrecognized tax benefits.
56
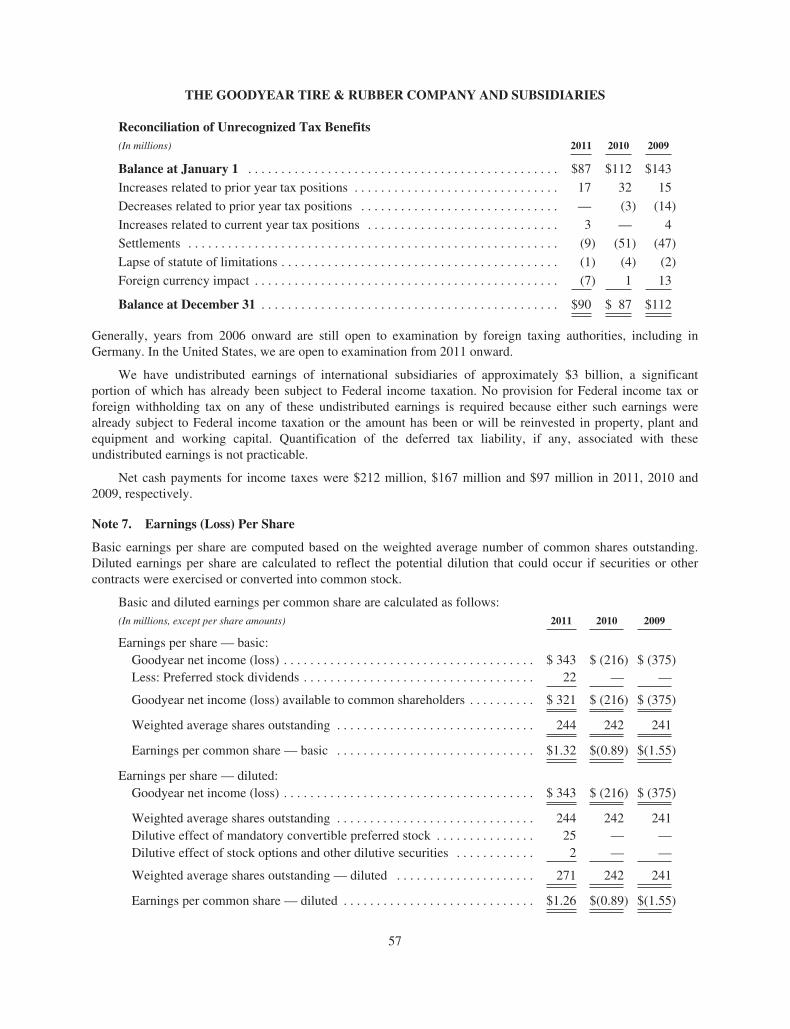
THE GOODYEAR TIRE & RUBBER COMPANY AND SUBSIDIARIES
Reconciliation of Unrecognized Tax Benefits(In millions) 2011 2010 2009
Balance at January 1 . . . . . . . . . . . . . . . . . . . . . . . . . . . . . . . . . . . . . . . . . . . . . . . $87 $112 $143
Increases related to prior year tax positions . . . . . . . . . . . . . . . . . . . . . . . . . . . . . . . 17 32 15
Decreases related to prior year tax positions . . . . . . . . . . . . . . . . . . . . . . . . . . . . . . — (3) (14)
Increases related to current year tax positions . . . . . . . . . . . . . . . . . . . . . . . . . . . . . 3 — 4
Settlements . . . . . . . . . . . . . . . . . . . . . . . . . . . . . . . . . . . . . . . . . . . . . . . . . . . . . . . . (9) (51) (47)
Lapse of statute of limitations . . . . . . . . . . . . . . . . . . . . . . . . . . . . . . . . . . . . . . . . . . (1) (4) (2)
Foreign currency impact . . . . . . . . . . . . . . . . . . . . . . . . . . . . . . . . . . . . . . . . . . . . . . (7) 1 13
Balance at December 31 . . . . . . . . . . . . . . . . . . . . . . . . . . . . . . . . . . . . . . . . . . . . . $90 $ 87 $112
Generally, years from 2006 onward are still open to examination by foreign taxing authorities, including inGermany. In the United States, we are open to examination from 2011 onward.
We have undistributed earnings of international subsidiaries of approximately $3 billion, a significantportion of which has already been subject to Federal income taxation. No provision for Federal income tax orforeign withholding tax on any of these undistributed earnings is required because either such earnings werealready subject to Federal income taxation or the amount has been or will be reinvested in property, plant andequipment and working capital. Quantification of the deferred tax liability, if any, associated with theseundistributed earnings is not practicable.
Net cash payments for income taxes were $212 million, $167 million and $97 million in 2011, 2010 and2009, respectively.
Note 7. Earnings (Loss) Per Share
Basic earnings per share are computed based on the weighted average number of common shares outstanding.Diluted earnings per share are calculated to reflect the potential dilution that could occur if securities or othercontracts were exercised or converted into common stock.
Basic and diluted earnings per common share are calculated as follows:(In millions, except per share amounts) 2011 2010 2009
Earnings per share — basic:Goodyear net income (loss) . . . . . . . . . . . . . . . . . . . . . . . . . . . . . . . . . . . . . . $ 343 $ (216) $ (375)Less: Preferred stock dividends . . . . . . . . . . . . . . . . . . . . . . . . . . . . . . . . . . . 22 — —
Goodyear net income (loss) available to common shareholders . . . . . . . . . . $ 321 $ (216) $ (375)
Weighted average shares outstanding . . . . . . . . . . . . . . . . . . . . . . . . . . . . . . 244 242 241
Earnings per common share — basic . . . . . . . . . . . . . . . . . . . . . . . . . . . . . . $1.32 $(0.89) $(1.55)
Earnings per share — diluted:Goodyear net income (loss) . . . . . . . . . . . . . . . . . . . . . . . . . . . . . . . . . . . . . . $ 343 $ (216) $ (375)
Weighted average shares outstanding . . . . . . . . . . . . . . . . . . . . . . . . . . . . . . 244 242 241Dilutive effect of mandatory convertible preferred stock . . . . . . . . . . . . . . . 25 — —Dilutive effect of stock options and other dilutive securities . . . . . . . . . . . . 2 — —
Weighted average shares outstanding — diluted . . . . . . . . . . . . . . . . . . . . . 271 242 241
Earnings per common share — diluted . . . . . . . . . . . . . . . . . . . . . . . . . . . . . $1.26 $(0.89) $(1.55)
57
THE GOODYEAR TIRE & RUBBER COMPANY AND SUBSIDIARIES
Weighted average shares outstanding — diluted excludes approximately 6 million, 10 million and 11 millionpotential common shares related to options with exercise prices greater than the average market price of ourcommon stock (i.e., “underwater” options), for 2011, 2010 and 2009, respectively.
Additionally, weighted average shares outstanding — diluted for 2010 and 2009 both excludeapproximately 4 million potential common shares related to options with exercise prices less than the averagemarket price of our common stock (i.e., “in-the-money” options), as their inclusion would have been anti-dilutivedue to the Goodyear net loss in those years.
Note 8. Business Segments
Segment information reflects our strategic business units (“SBUs”), which are organized to meet customerrequirements and global competition. We operate our business through four operating segments representing ourregional tire businesses: North American Tire; Europe, Middle East and Africa Tire; Latin American Tire; andAsia Pacific Tire. Segment information is reported on the basis used for reporting to our Chairman of the Board,Chief Executive Officer and President. Each of the four regional business segments is involved in thedevelopment, manufacture, distribution and sale of tires. Certain of the business segments also provide relatedproducts and services, which include retreads, automotive repair services and merchandise purchased for resale.Each segment also exports tires to other segments.
North American Tire manufactures and sells tires for automobiles, trucks, motorcycles, buses, earthmovingand mining equipment, commercial and military aviation, and industrial equipment in the United States andCanada. North American Tire also provides related products and services including retread tires, tread rubber,automotive maintenance and repair services, as well as sells chemical and natural rubber products to our otherbusiness segments and to unaffiliated customers.
Europe, Middle East and Africa Tire manufactures and sells tires for automobiles, trucks, motorcycles, farmimplements, and construction equipment throughout Europe, the Middle East and Africa. EMEA also sells newand retreaded aviation tires, retreading and related services for commercial truck and OTR tires, and automotivemaintenance and repair services.
Latin American Tire manufactures and sells tires for automobiles, trucks, and aviation and constructionequipment throughout Central and South America and in Mexico. Latin American Tire also provides relatedproducts and services including retreaded tires and tread rubber for truck tires.
Asia Pacific Tire manufactures and sells tires for automobiles, trucks, farm, construction and miningequipment, and the aviation industry throughout the Asia Pacific region. Asia Pacific Tire also provides relatedproducts and services including retreaded truck and aviation tires, tread rubber, and automotive maintenance andrepair services.
58
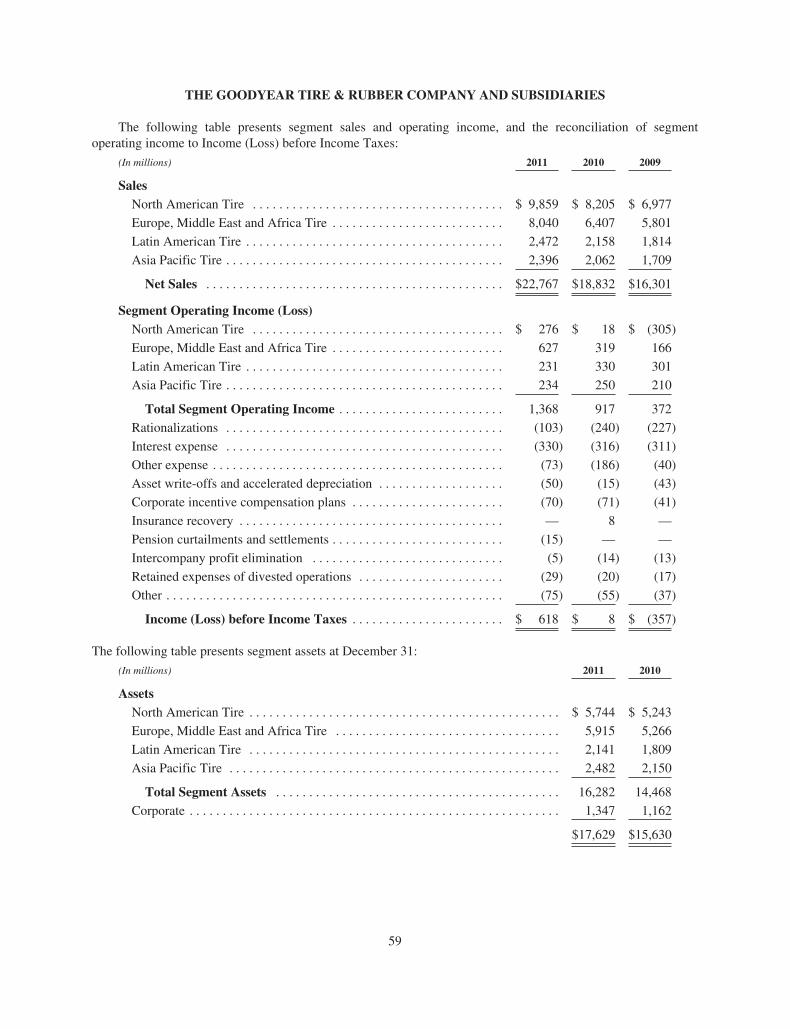
THE GOODYEAR TIRE & RUBBER COMPANY AND SUBSIDIARIES
The following table presents segment sales and operating income, and the reconciliation of segmentoperating income to Income (Loss) before Income Taxes:
(In millions) 2011 2010 2009
SalesNorth American Tire . . . . . . . . . . . . . . . . . . . . . . . . . . . . . . . . . . . . . . $ 9,859 $ 8,205 $ 6,977
Europe, Middle East and Africa Tire . . . . . . . . . . . . . . . . . . . . . . . . . . 8,040 6,407 5,801
Latin American Tire . . . . . . . . . . . . . . . . . . . . . . . . . . . . . . . . . . . . . . . 2,472 2,158 1,814
Asia Pacific Tire . . . . . . . . . . . . . . . . . . . . . . . . . . . . . . . . . . . . . . . . . . 2,396 2,062 1,709
Net Sales . . . . . . . . . . . . . . . . . . . . . . . . . . . . . . . . . . . . . . . . . . . . . $22,767 $18,832 $16,301
Segment Operating Income (Loss)North American Tire . . . . . . . . . . . . . . . . . . . . . . . . . . . . . . . . . . . . . . $ 276 $ 18 $ (305)
Europe, Middle East and Africa Tire . . . . . . . . . . . . . . . . . . . . . . . . . . 627 319 166
Latin American Tire . . . . . . . . . . . . . . . . . . . . . . . . . . . . . . . . . . . . . . . 231 330 301
Asia Pacific Tire . . . . . . . . . . . . . . . . . . . . . . . . . . . . . . . . . . . . . . . . . . 234 250 210
Total Segment Operating Income . . . . . . . . . . . . . . . . . . . . . . . . . 1,368 917 372
Rationalizations . . . . . . . . . . . . . . . . . . . . . . . . . . . . . . . . . . . . . . . . . . (103) (240) (227)
Interest expense . . . . . . . . . . . . . . . . . . . . . . . . . . . . . . . . . . . . . . . . . . (330) (316) (311)
Other expense . . . . . . . . . . . . . . . . . . . . . . . . . . . . . . . . . . . . . . . . . . . . (73) (186) (40)
Asset write-offs and accelerated depreciation . . . . . . . . . . . . . . . . . . . (50) (15) (43)
Corporate incentive compensation plans . . . . . . . . . . . . . . . . . . . . . . . (70) (71) (41)
Insurance recovery . . . . . . . . . . . . . . . . . . . . . . . . . . . . . . . . . . . . . . . . — 8 —
Pension curtailments and settlements . . . . . . . . . . . . . . . . . . . . . . . . . . (15) — —
Intercompany profit elimination . . . . . . . . . . . . . . . . . . . . . . . . . . . . . (5) (14) (13)
Retained expenses of divested operations . . . . . . . . . . . . . . . . . . . . . . (29) (20) (17)
Other . . . . . . . . . . . . . . . . . . . . . . . . . . . . . . . . . . . . . . . . . . . . . . . . . . . (75) (55) (37)
Income (Loss) before Income Taxes . . . . . . . . . . . . . . . . . . . . . . . $ 618 $ 8 $ (357)
The following table presents segment assets at December 31:
(In millions) 2011 2010
AssetsNorth American Tire . . . . . . . . . . . . . . . . . . . . . . . . . . . . . . . . . . . . . . . . . . . . . . . $ 5,744 $ 5,243
Europe, Middle East and Africa Tire . . . . . . . . . . . . . . . . . . . . . . . . . . . . . . . . . . 5,915 5,266
Latin American Tire . . . . . . . . . . . . . . . . . . . . . . . . . . . . . . . . . . . . . . . . . . . . . . . 2,141 1,809
Asia Pacific Tire . . . . . . . . . . . . . . . . . . . . . . . . . . . . . . . . . . . . . . . . . . . . . . . . . . 2,482 2,150
Total Segment Assets . . . . . . . . . . . . . . . . . . . . . . . . . . . . . . . . . . . . . . . . . . . 16,282 14,468
Corporate . . . . . . . . . . . . . . . . . . . . . . . . . . . . . . . . . . . . . . . . . . . . . . . . . . . . . . . . 1,347 1,162
$17,629 $15,630
59
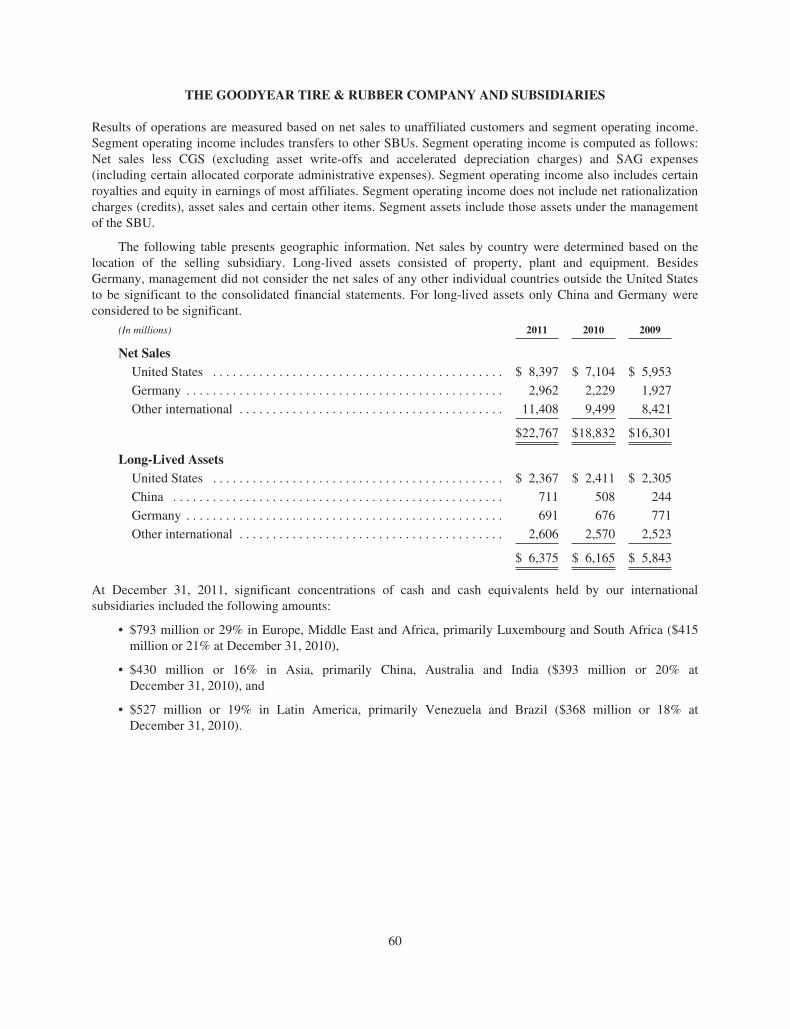
THE GOODYEAR TIRE & RUBBER COMPANY AND SUBSIDIARIES
Results of operations are measured based on net sales to unaffiliated customers and segment operating income.Segment operating income includes transfers to other SBUs. Segment operating income is computed as follows:Net sales less CGS (excluding asset write-offs and accelerated depreciation charges) and SAG expenses(including certain allocated corporate administrative expenses). Segment operating income also includes certainroyalties and equity in earnings of most affiliates. Segment operating income does not include net rationalizationcharges (credits), asset sales and certain other items. Segment assets include those assets under the managementof the SBU.
The following table presents geographic information. Net sales by country were determined based on thelocation of the selling subsidiary. Long-lived assets consisted of property, plant and equipment. BesidesGermany, management did not consider the net sales of any other individual countries outside the United Statesto be significant to the consolidated financial statements. For long-lived assets only China and Germany wereconsidered to be significant.
(In millions) 2011 2010 2009
Net SalesUnited States . . . . . . . . . . . . . . . . . . . . . . . . . . . . . . . . . . . . . . . . . . . . $ 8,397 $ 7,104 $ 5,953
Germany . . . . . . . . . . . . . . . . . . . . . . . . . . . . . . . . . . . . . . . . . . . . . . . . 2,962 2,229 1,927
Other international . . . . . . . . . . . . . . . . . . . . . . . . . . . . . . . . . . . . . . . . 11,408 9,499 8,421
$22,767 $18,832 $16,301
Long-Lived AssetsUnited States . . . . . . . . . . . . . . . . . . . . . . . . . . . . . . . . . . . . . . . . . . . . $ 2,367 $ 2,411 $ 2,305
China . . . . . . . . . . . . . . . . . . . . . . . . . . . . . . . . . . . . . . . . . . . . . . . . . . 711 508 244
Germany . . . . . . . . . . . . . . . . . . . . . . . . . . . . . . . . . . . . . . . . . . . . . . . . 691 676 771
Other international . . . . . . . . . . . . . . . . . . . . . . . . . . . . . . . . . . . . . . . . 2,606 2,570 2,523
$ 6,375 $ 6,165 $ 5,843
At December 31, 2011, significant concentrations of cash and cash equivalents held by our internationalsubsidiaries included the following amounts:
• $793 million or 29% in Europe, Middle East and Africa, primarily Luxembourg and South Africa ($415million or 21% at December 31, 2010),
• $430 million or 16% in Asia, primarily China, Australia and India ($393 million or 20% atDecember 31, 2010), and
• $527 million or 19% in Latin America, primarily Venezuela and Brazil ($368 million or 18% atDecember 31, 2010).
60
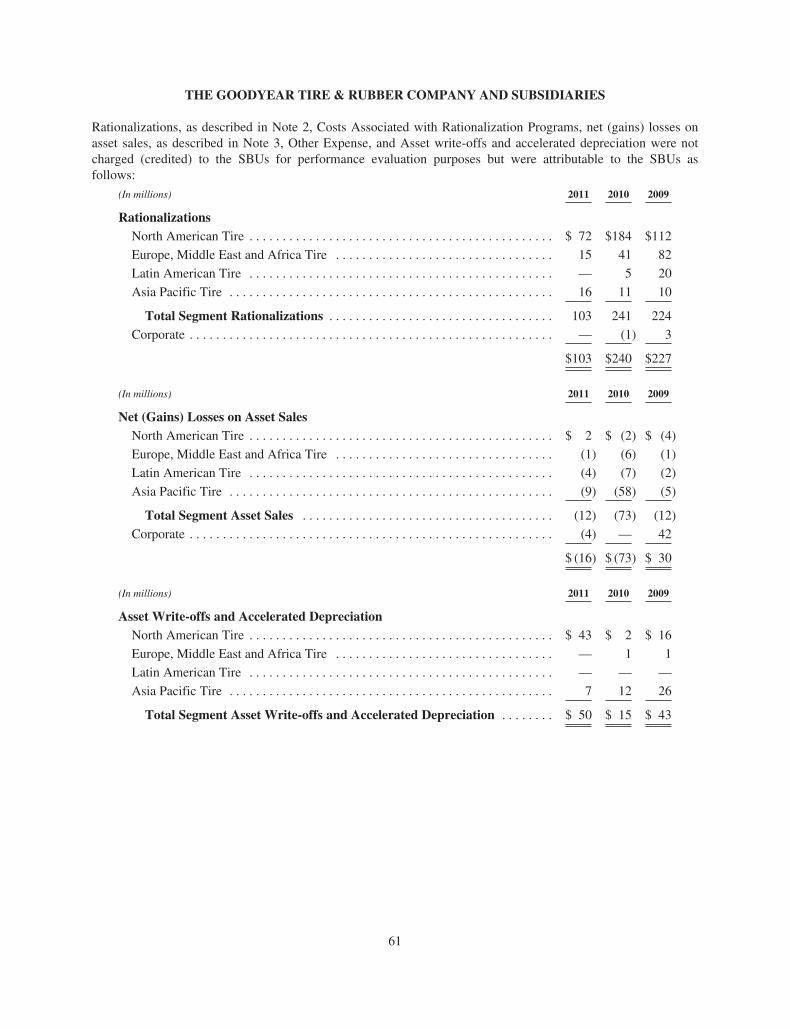
THE GOODYEAR TIRE & RUBBER COMPANY AND SUBSIDIARIES
Rationalizations, as described in Note 2, Costs Associated with Rationalization Programs, net (gains) losses onasset sales, as described in Note 3, Other Expense, and Asset write-offs and accelerated depreciation were notcharged (credited) to the SBUs for performance evaluation purposes but were attributable to the SBUs asfollows:
(In millions) 2011 2010 2009
RationalizationsNorth American Tire . . . . . . . . . . . . . . . . . . . . . . . . . . . . . . . . . . . . . . . . . . . . . . $ 72 $184 $112
Europe, Middle East and Africa Tire . . . . . . . . . . . . . . . . . . . . . . . . . . . . . . . . . 15 41 82
Latin American Tire . . . . . . . . . . . . . . . . . . . . . . . . . . . . . . . . . . . . . . . . . . . . . . — 5 20
Asia Pacific Tire . . . . . . . . . . . . . . . . . . . . . . . . . . . . . . . . . . . . . . . . . . . . . . . . . 16 11 10
Total Segment Rationalizations . . . . . . . . . . . . . . . . . . . . . . . . . . . . . . . . . . 103 241 224
Corporate . . . . . . . . . . . . . . . . . . . . . . . . . . . . . . . . . . . . . . . . . . . . . . . . . . . . . . . — (1) 3
$103 $240 $227
(In millions) 2011 2010 2009
Net (Gains) Losses on Asset SalesNorth American Tire . . . . . . . . . . . . . . . . . . . . . . . . . . . . . . . . . . . . . . . . . . . . . . $ 2 $ (2) $ (4)
Europe, Middle East and Africa Tire . . . . . . . . . . . . . . . . . . . . . . . . . . . . . . . . . (1) (6) (1)
Latin American Tire . . . . . . . . . . . . . . . . . . . . . . . . . . . . . . . . . . . . . . . . . . . . . . (4) (7) (2)
Asia Pacific Tire . . . . . . . . . . . . . . . . . . . . . . . . . . . . . . . . . . . . . . . . . . . . . . . . . (9) (58) (5)
Total Segment Asset Sales . . . . . . . . . . . . . . . . . . . . . . . . . . . . . . . . . . . . . . (12) (73) (12)
Corporate . . . . . . . . . . . . . . . . . . . . . . . . . . . . . . . . . . . . . . . . . . . . . . . . . . . . . . . (4) — 42
$ (16) $ (73) $ 30
(In millions) 2011 2010 2009
Asset Write-offs and Accelerated DepreciationNorth American Tire . . . . . . . . . . . . . . . . . . . . . . . . . . . . . . . . . . . . . . . . . . . . . . $ 43 $ 2 $ 16
Europe, Middle East and Africa Tire . . . . . . . . . . . . . . . . . . . . . . . . . . . . . . . . . — 1 1
Latin American Tire . . . . . . . . . . . . . . . . . . . . . . . . . . . . . . . . . . . . . . . . . . . . . . — — —
Asia Pacific Tire . . . . . . . . . . . . . . . . . . . . . . . . . . . . . . . . . . . . . . . . . . . . . . . . . 7 12 26
Total Segment Asset Write-offs and Accelerated Depreciation . . . . . . . . $ 50 $ 15 $ 43
61
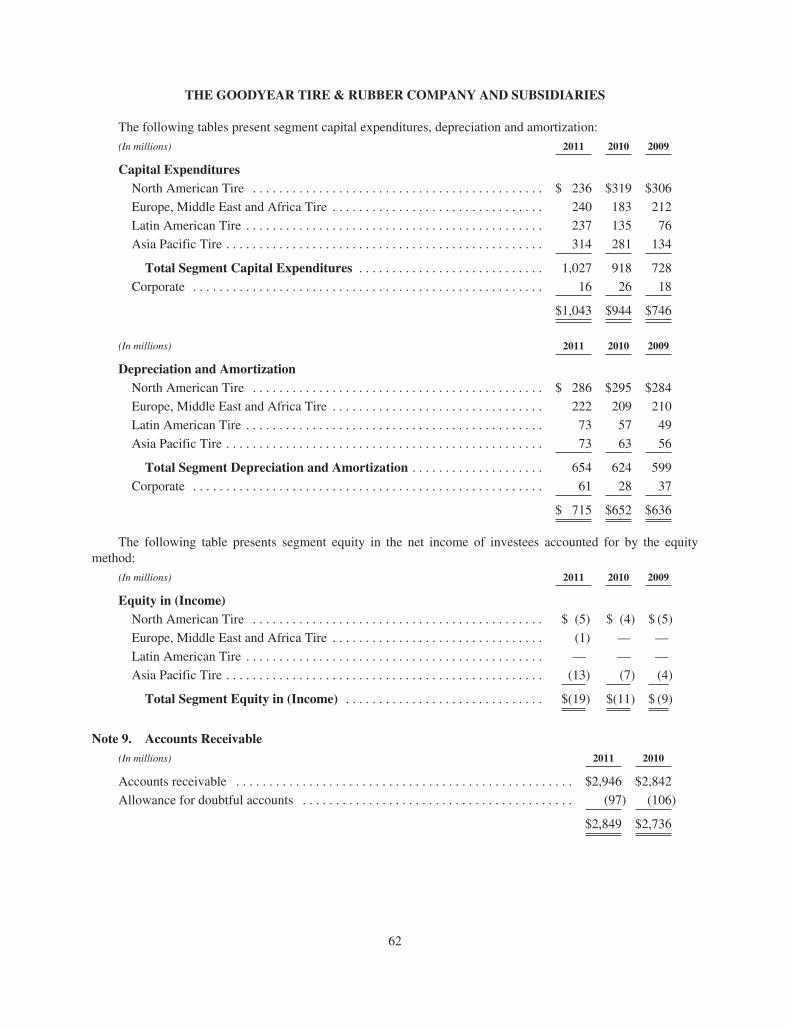
THE GOODYEAR TIRE & RUBBER COMPANY AND SUBSIDIARIES
The following tables present segment capital expenditures, depreciation and amortization:
(In millions) 2011 2010 2009
Capital ExpendituresNorth American Tire . . . . . . . . . . . . . . . . . . . . . . . . . . . . . . . . . . . . . . . . . . . . $ 236 $319 $306
Europe, Middle East and Africa Tire . . . . . . . . . . . . . . . . . . . . . . . . . . . . . . . . 240 183 212
Latin American Tire . . . . . . . . . . . . . . . . . . . . . . . . . . . . . . . . . . . . . . . . . . . . . 237 135 76
Asia Pacific Tire . . . . . . . . . . . . . . . . . . . . . . . . . . . . . . . . . . . . . . . . . . . . . . . . 314 281 134
Total Segment Capital Expenditures . . . . . . . . . . . . . . . . . . . . . . . . . . . . 1,027 918 728
Corporate . . . . . . . . . . . . . . . . . . . . . . . . . . . . . . . . . . . . . . . . . . . . . . . . . . . . . 16 26 18
$1,043 $944 $746
(In millions) 2011 2010 2009
Depreciation and AmortizationNorth American Tire . . . . . . . . . . . . . . . . . . . . . . . . . . . . . . . . . . . . . . . . . . . . $ 286 $295 $284
Europe, Middle East and Africa Tire . . . . . . . . . . . . . . . . . . . . . . . . . . . . . . . . 222 209 210
Latin American Tire . . . . . . . . . . . . . . . . . . . . . . . . . . . . . . . . . . . . . . . . . . . . . 73 57 49
Asia Pacific Tire . . . . . . . . . . . . . . . . . . . . . . . . . . . . . . . . . . . . . . . . . . . . . . . . 73 63 56
Total Segment Depreciation and Amortization . . . . . . . . . . . . . . . . . . . . 654 624 599
Corporate . . . . . . . . . . . . . . . . . . . . . . . . . . . . . . . . . . . . . . . . . . . . . . . . . . . . . 61 28 37
$ 715 $652 $636
The following table presents segment equity in the net income of investees accounted for by the equitymethod:
(In millions) 2011 2010 2009
Equity in (Income)North American Tire . . . . . . . . . . . . . . . . . . . . . . . . . . . . . . . . . . . . . . . . . . . . $ (5) $ (4) $ (5)
Europe, Middle East and Africa Tire . . . . . . . . . . . . . . . . . . . . . . . . . . . . . . . . (1) — —
Latin American Tire . . . . . . . . . . . . . . . . . . . . . . . . . . . . . . . . . . . . . . . . . . . . . — — —
Asia Pacific Tire . . . . . . . . . . . . . . . . . . . . . . . . . . . . . . . . . . . . . . . . . . . . . . . . (13) (7) (4)
Total Segment Equity in (Income) . . . . . . . . . . . . . . . . . . . . . . . . . . . . . . $(19) $(11) $ (9)
Note 9. Accounts Receivable(In millions) 2011 2010
Accounts receivable . . . . . . . . . . . . . . . . . . . . . . . . . . . . . . . . . . . . . . . . . . . . . . . . . . . $2,946 $2,842
Allowance for doubtful accounts . . . . . . . . . . . . . . . . . . . . . . . . . . . . . . . . . . . . . . . . . (97) (106)
$2,849 $2,736
62
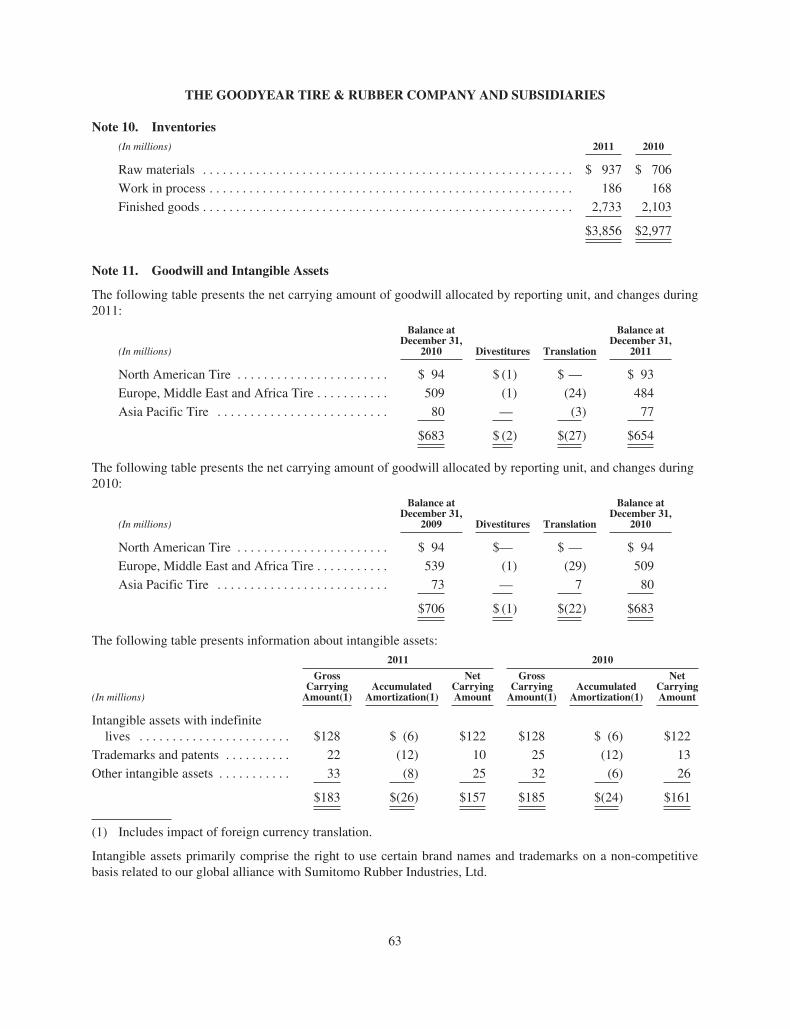
THE GOODYEAR TIRE & RUBBER COMPANY AND SUBSIDIARIES
Note 10. Inventories(In millions) 2011 2010
Raw materials . . . . . . . . . . . . . . . . . . . . . . . . . . . . . . . . . . . . . . . . . . . . . . . . . . . . . . . . $ 937 $ 706
Work in process . . . . . . . . . . . . . . . . . . . . . . . . . . . . . . . . . . . . . . . . . . . . . . . . . . . . . . . 186 168
Finished goods . . . . . . . . . . . . . . . . . . . . . . . . . . . . . . . . . . . . . . . . . . . . . . . . . . . . . . . . 2,733 2,103
$3,856 $2,977
Note 11. Goodwill and Intangible Assets
The following table presents the net carrying amount of goodwill allocated by reporting unit, and changes during2011:
(In millions)
Balance atDecember 31,
2010 Divestitures Translation
Balance atDecember 31,
2011
North American Tire . . . . . . . . . . . . . . . . . . . . . . . $ 94 $ (1) $ — $ 93
Europe, Middle East and Africa Tire . . . . . . . . . . . 509 (1) (24) 484
Asia Pacific Tire . . . . . . . . . . . . . . . . . . . . . . . . . . 80 — (3) 77
$683 $ (2) $(27) $654
The following table presents the net carrying amount of goodwill allocated by reporting unit, and changes during2010:
(In millions)
Balance atDecember 31,
2009 Divestitures Translation
Balance atDecember 31,
2010
North American Tire . . . . . . . . . . . . . . . . . . . . . . . $ 94 $— $ — $ 94
Europe, Middle East and Africa Tire . . . . . . . . . . . 539 (1) (29) 509
Asia Pacific Tire . . . . . . . . . . . . . . . . . . . . . . . . . . 73 — 7 80
$706 $ (1) $(22) $683
The following table presents information about intangible assets:
2011 2010
(In millions)
GrossCarryingAmount(1)
AccumulatedAmortization(1)
NetCarryingAmount
GrossCarryingAmount(1)
AccumulatedAmortization(1)
NetCarryingAmount
Intangible assets with indefinitelives . . . . . . . . . . . . . . . . . . . . . . . $128 $ (6) $122 $128 $ (6) $122
Trademarks and patents . . . . . . . . . . 22 (12) 10 25 (12) 13
Other intangible assets . . . . . . . . . . . 33 (8) 25 32 (6) 26
$183 $(26) $157 $185 $(24) $161
(1) Includes impact of foreign currency translation.
Intangible assets primarily comprise the right to use certain brand names and trademarks on a non-competitivebasis related to our global alliance with Sumitomo Rubber Industries, Ltd.
63
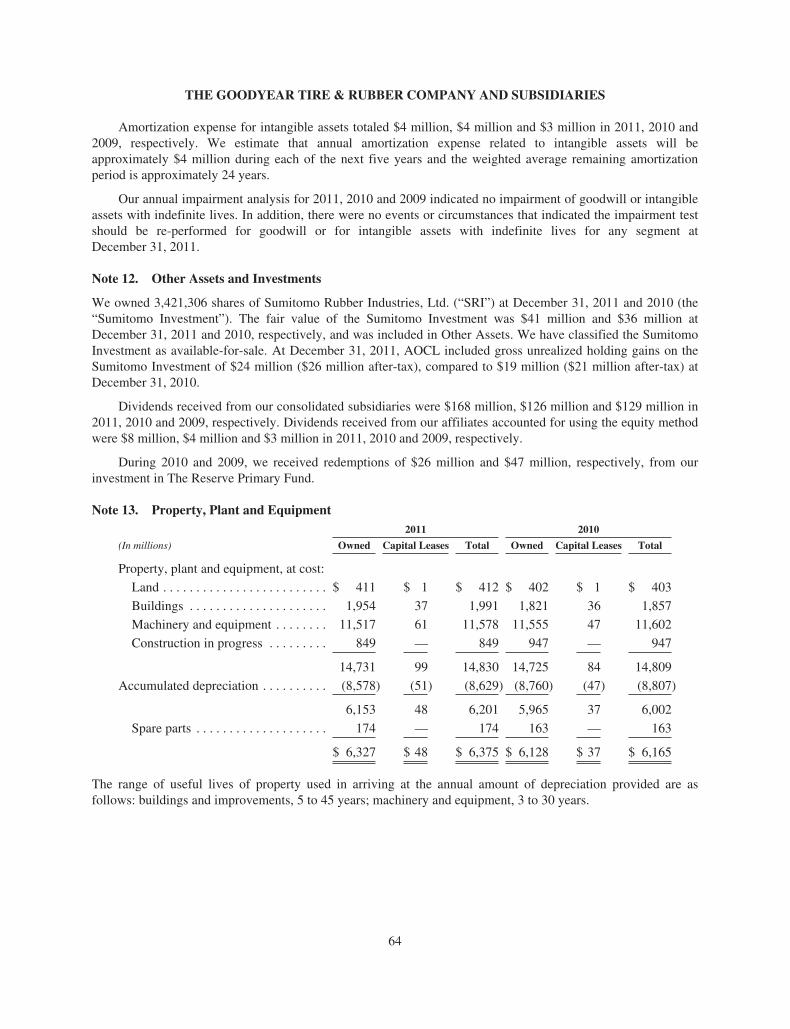
THE GOODYEAR TIRE & RUBBER COMPANY AND SUBSIDIARIES
Amortization expense for intangible assets totaled $4 million, $4 million and $3 million in 2011, 2010 and2009, respectively. We estimate that annual amortization expense related to intangible assets will beapproximately $4 million during each of the next five years and the weighted average remaining amortizationperiod is approximately 24 years.
Our annual impairment analysis for 2011, 2010 and 2009 indicated no impairment of goodwill or intangibleassets with indefinite lives. In addition, there were no events or circumstances that indicated the impairment testshould be re-performed for goodwill or for intangible assets with indefinite lives for any segment atDecember 31, 2011.
Note 12. Other Assets and Investments
We owned 3,421,306 shares of Sumitomo Rubber Industries, Ltd. (“SRI”) at December 31, 2011 and 2010 (the“Sumitomo Investment”). The fair value of the Sumitomo Investment was $41 million and $36 million atDecember 31, 2011 and 2010, respectively, and was included in Other Assets. We have classified the SumitomoInvestment as available-for-sale. At December 31, 2011, AOCL included gross unrealized holding gains on theSumitomo Investment of $24 million ($26 million after-tax), compared to $19 million ($21 million after-tax) atDecember 31, 2010.
Dividends received from our consolidated subsidiaries were $168 million, $126 million and $129 million in2011, 2010 and 2009, respectively. Dividends received from our affiliates accounted for using the equity methodwere $8 million, $4 million and $3 million in 2011, 2010 and 2009, respectively.
During 2010 and 2009, we received redemptions of $26 million and $47 million, respectively, from ourinvestment in The Reserve Primary Fund.
Note 13. Property, Plant and Equipment2011 2010
(In millions) Owned Capital Leases Total Owned Capital Leases Total
Property, plant and equipment, at cost:
Land . . . . . . . . . . . . . . . . . . . . . . . . . $ 411 $ 1 $ 412 $ 402 $ 1 $ 403
Buildings . . . . . . . . . . . . . . . . . . . . . 1,954 37 1,991 1,821 36 1,857
Machinery and equipment . . . . . . . . 11,517 61 11,578 11,555 47 11,602
Construction in progress . . . . . . . . . 849 — 849 947 — 947
14,731 99 14,830 14,725 84 14,809
Accumulated depreciation . . . . . . . . . . (8,578) (51) (8,629) (8,760) (47) (8,807)
6,153 48 6,201 5,965 37 6,002
Spare parts . . . . . . . . . . . . . . . . . . . . 174 — 174 163 — 163
$ 6,327 $ 48 $ 6,375 $ 6,128 $ 37 $ 6,165
The range of useful lives of property used in arriving at the annual amount of depreciation provided are asfollows: buildings and improvements, 5 to 45 years; machinery and equipment, 3 to 30 years.
64
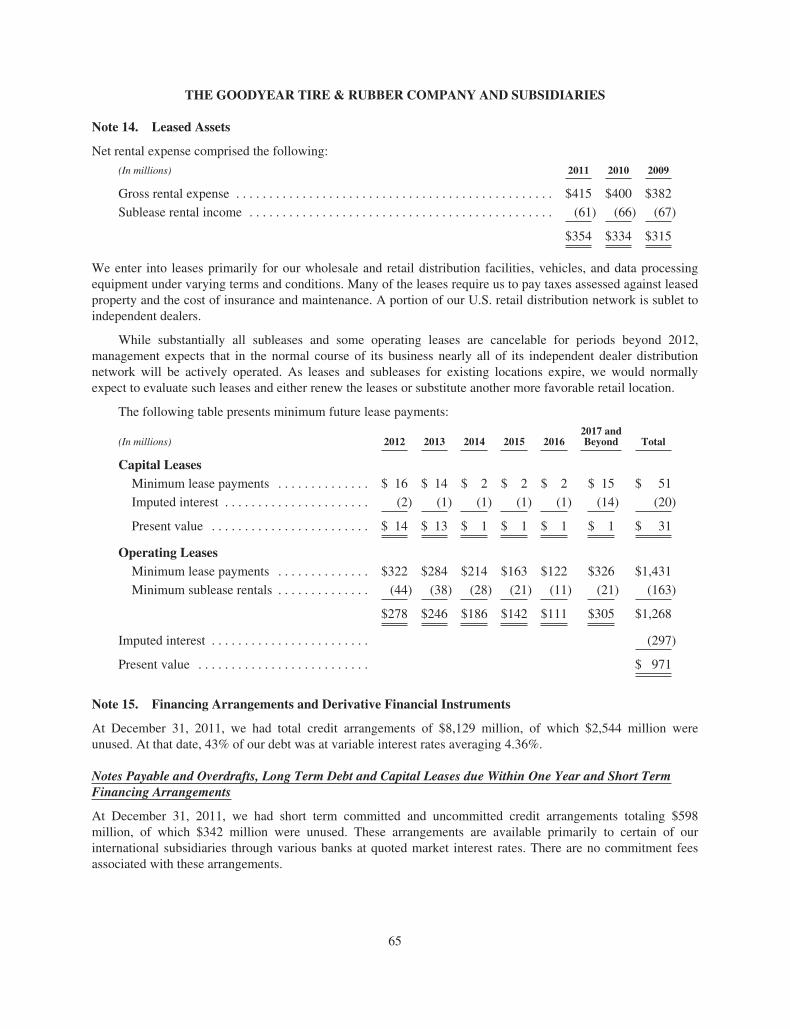
THE GOODYEAR TIRE & RUBBER COMPANY AND SUBSIDIARIES
Note 14. Leased Assets
Net rental expense comprised the following:
(In millions) 2011 2010 2009
Gross rental expense . . . . . . . . . . . . . . . . . . . . . . . . . . . . . . . . . . . . . . . . . . . . . . . . $415 $400 $382
Sublease rental income . . . . . . . . . . . . . . . . . . . . . . . . . . . . . . . . . . . . . . . . . . . . . . (61) (66) (67)
$354 $334 $315
We enter into leases primarily for our wholesale and retail distribution facilities, vehicles, and data processingequipment under varying terms and conditions. Many of the leases require us to pay taxes assessed against leasedproperty and the cost of insurance and maintenance. A portion of our U.S. retail distribution network is sublet toindependent dealers.
While substantially all subleases and some operating leases are cancelable for periods beyond 2012,management expects that in the normal course of its business nearly all of its independent dealer distributionnetwork will be actively operated. As leases and subleases for existing locations expire, we would normallyexpect to evaluate such leases and either renew the leases or substitute another more favorable retail location.
The following table presents minimum future lease payments:
(In millions) 2012 2013 2014 2015 20162017 andBeyond Total
Capital LeasesMinimum lease payments . . . . . . . . . . . . . . $ 16 $ 14 $ 2 $ 2 $ 2 $ 15 $ 51
Imputed interest . . . . . . . . . . . . . . . . . . . . . . (2) (1) (1) (1) (1) (14) (20)
Present value . . . . . . . . . . . . . . . . . . . . . . . . $ 14 $ 13 $ 1 $ 1 $ 1 $ 1 $ 31
Operating LeasesMinimum lease payments . . . . . . . . . . . . . . $322 $284 $214 $163 $122 $326 $1,431
Minimum sublease rentals . . . . . . . . . . . . . . (44) (38) (28) (21) (11) (21) (163)
$278 $246 $186 $142 $111 $305 $1,268
Imputed interest . . . . . . . . . . . . . . . . . . . . . . . . (297)
Present value . . . . . . . . . . . . . . . . . . . . . . . . . . $ 971
Note 15. Financing Arrangements and Derivative Financial Instruments
At December 31, 2011, we had total credit arrangements of $8,129 million, of which $2,544 million wereunused. At that date, 43% of our debt was at variable interest rates averaging 4.36%.
Notes Payable and Overdrafts, Long Term Debt and Capital Leases due Within One Year and Short TermFinancing Arrangements
At December 31, 2011, we had short term committed and uncommitted credit arrangements totaling $598million, of which $342 million were unused. These arrangements are available primarily to certain of ourinternational subsidiaries through various banks at quoted market interest rates. There are no commitment feesassociated with these arrangements.
65
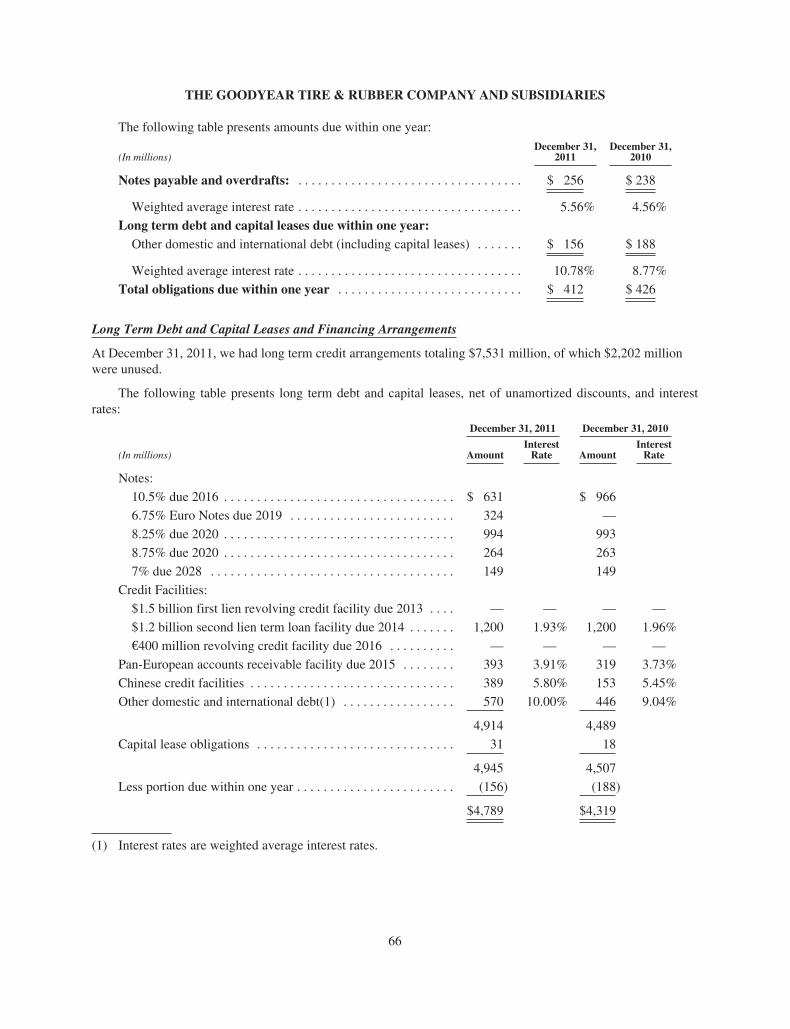
THE GOODYEAR TIRE & RUBBER COMPANY AND SUBSIDIARIES
The following table presents amounts due within one year:
(In millions)December 31,
2011December 31,
2010
Notes payable and overdrafts: . . . . . . . . . . . . . . . . . . . . . . . . . . . . . . . . . . $ 256 $ 238
Weighted average interest rate . . . . . . . . . . . . . . . . . . . . . . . . . . . . . . . . . . 5.56% 4.56%
Long term debt and capital leases due within one year:Other domestic and international debt (including capital leases) . . . . . . . $ 156 $ 188
Weighted average interest rate . . . . . . . . . . . . . . . . . . . . . . . . . . . . . . . . . . 10.78% 8.77%
Total obligations due within one year . . . . . . . . . . . . . . . . . . . . . . . . . . . . $ 412 $ 426
Long Term Debt and Capital Leases and Financing Arrangements
At December 31, 2011, we had long term credit arrangements totaling $7,531 million, of which $2,202 millionwere unused.
The following table presents long term debt and capital leases, net of unamortized discounts, and interestrates:
December 31, 2011 December 31, 2010
(In millions) AmountInterestRate Amount
InterestRate
Notes:
10.5% due 2016 . . . . . . . . . . . . . . . . . . . . . . . . . . . . . . . . . . . $ 631 $ 966
6.75% Euro Notes due 2019 . . . . . . . . . . . . . . . . . . . . . . . . . 324 —
8.25% due 2020 . . . . . . . . . . . . . . . . . . . . . . . . . . . . . . . . . . . 994 993
8.75% due 2020 . . . . . . . . . . . . . . . . . . . . . . . . . . . . . . . . . . . 264 263
7% due 2028 . . . . . . . . . . . . . . . . . . . . . . . . . . . . . . . . . . . . . 149 149
Credit Facilities:
$1.5 billion first lien revolving credit facility due 2013 . . . . — — — —
$1.2 billion second lien term loan facility due 2014 . . . . . . . 1,200 1.93% 1,200 1.96%
€400 million revolving credit facility due 2016 . . . . . . . . . . — — — —
Pan-European accounts receivable facility due 2015 . . . . . . . . 393 3.91% 319 3.73%
Chinese credit facilities . . . . . . . . . . . . . . . . . . . . . . . . . . . . . . . 389 5.80% 153 5.45%
Other domestic and international debt(1) . . . . . . . . . . . . . . . . . 570 10.00% 446 9.04%
4,914 4,489
Capital lease obligations . . . . . . . . . . . . . . . . . . . . . . . . . . . . . . 31 18
4,945 4,507
Less portion due within one year . . . . . . . . . . . . . . . . . . . . . . . . (156) (188)
$4,789 $4,319
(1) Interest rates are weighted average interest rates.
66
THE GOODYEAR TIRE & RUBBER COMPANY AND SUBSIDIARIES
NOTES
$650 million 10.5% Senior Notes due 2016
At December 31, 2011, $650 million aggregate principal amount of our 10.5% senior notes due 2016 wereoutstanding. These notes were sold in the second quarter of 2009 at 95.846% of the principal amount at aneffective yield of 11.375% and will mature on May 15, 2016. On May 27, 2011, we redeemed $350 million inaggregate principal amount of our outstanding 10.5% senior notes due 2016 at an aggregate redemption price of$387 million, including a $37 million prepayment premium, plus accrued and unpaid interest to the redemptiondate. We also recorded $16 million of expense for the write-off of unamortized discounts and deferred financingfees as a result of the redemption. These notes are unsecured senior obligations and are guaranteed by our U.S.and Canadian subsidiaries that also guarantee our obligations under our senior secured credit facilities describedbelow.
We have the option to redeem these notes, in whole or in part, at any time on or after May 15, 2012 at aredemption price of 107.875%, 105.25%, 102.625% and 100% during the 12-month periods commencing onMay 15, 2012, 2013, 2014 and 2015, respectively, plus accrued and unpaid interest to the redemption date. Priorto May 15, 2012, we may redeem these notes, in whole or in part, at a redemption price equal to 100% of theprincipal amount plus a make-whole premium and accrued and unpaid interest to the redemption date.
The terms of the indenture for these notes, among other things, limit our ability and the ability of certain ofour subsidiaries to (i) incur additional debt or issue redeemable preferred stock, (ii) pay dividends, or makecertain other restricted payments or investments, (iii) incur liens, (iv) sell assets, (v) incur restrictions on theability of our subsidiaries to pay dividends to us, (vi) enter into affiliate transactions, (vii) engage in sale andleaseback transactions, and (viii) consolidate, merge, sell or otherwise dispose of all or substantially all of ourassets. These covenants are subject to significant exceptions and qualifications. For example, if these notes areassigned an investment grade rating by Moody’s and Standard & Poor’s (“S&P”) and no default has occurred oris continuing, certain covenants will be suspended. The indenture has customary defaults, including across-default to material indebtedness of Goodyear and our subsidiaries.
€250 million 6.75% Senior Notes due 2019 of Goodyear Dunlop Tires Europe B.V. (“GDTE”)
On April 20, 2011, GDTE issued €250 million aggregate principal amount of 6.75% senior notes due 2019.These notes were sold at 100% of the principal amount and will mature on April 15, 2019. These notes areunsecured senior obligations of GDTE and are guaranteed, on an unsecured senior basis, by the Company andour U.S. and Canadian subsidiaries that also guarantee our obligations under our senior secured credit facilitiesdescribed below.
We have the option to redeem these notes, in whole or in part, at any time on or after April 15, 2015 at aredemption price of 103.375%, 101.688% and 100% during the 12-month periods commencing on April 15,2015, 2016 and 2017 and thereafter, respectively, plus accrued and unpaid interest to the redemption date. Priorto April 15, 2015, we may redeem these notes, in whole or in part, at a redemption price equal to 100% of theprincipal amount plus a make-whole premium and accrued and unpaid interest to the redemption date. Inaddition, prior to April 15, 2014, we may redeem up to 35% of the original aggregate principal amount of thesenotes from the net cash proceeds of certain equity offerings at a redemption price equal to 106.75% of theprincipal amount plus accrued and unpaid interest to the redemption date.
The terms of the indenture for these notes, among other things, limit the ability of the Company and certainof its subsidiaries, including GDTE, (i) to incur additional debt or issue redeemable preferred stock, (ii) paydividends or make certain other restricted payments or investments, (iii) incur liens, (iv) sell assets, (v) incurrestrictions on the ability of our subsidiaries to pay dividends to us, (vi) enter into affiliate transactions,(vii) engage in sale and leaseback transactions, and (viii) consolidate, merge, sell or otherwise dispose of all orsubstantially all of our assets. These covenants are subject to significant exceptions and qualifications. For
67
THE GOODYEAR TIRE & RUBBER COMPANY AND SUBSIDIARIES
example, if these notes are assigned an investment grade rating by Moody’s and S&P and no default has occurredor is continuing, certain covenants will be suspended. The indenture has customary defaults, including a cross-default to material indebtedness of Goodyear and our subsidiaries.
$1.0 billion 8.25% Senior Notes due 2020
At December 31, 2011, $1.0 billion aggregate principal amount of 8.25% senior notes due 2020 wereoutstanding. These notes had an effective yield of 8.349% at issuance. These notes are unsecured seniorobligations, are guaranteed by our U.S. and Canadian subsidiaries that also guarantee our obligations under oursenior secured credit facilities described below, and will mature on August 15, 2020.
We have the option to redeem these notes, in whole or in part, at any time on or after August 15, 2015 at aredemption price of 104.125%, 102.750%, 101.375% and 100% during the 12-month periods commencing onAugust 15, 2015, 2016, 2017 and 2018 and thereafter, respectively, plus accrued and unpaid interest to theredemption date. Prior to August 15, 2015, we may redeem these notes, in whole or in part, at a redemption priceequal to 100% of the principal amount plus a make-whole premium and accrued and unpaid interest to theredemption date. In addition, prior to August 15, 2013, we may redeem up to 35% of these notes from the netcash proceeds of certain equity offerings at a redemption price equal to 108.25% of the principal amount plusaccrued and unpaid interest to the redemption date.
The indenture for these notes includes covenants that are substantially similar to those contained in theindenture governing our 10.5% senior notes due 2016, described above.
$282 million 8.75% Notes due 2020
At December 31, 2011, $282 million in aggregate principal amount of 8.75% notes due 2020 were outstanding.These notes are unsecured senior obligations, are guaranteed by our U.S. and Canadian subsidiaries that alsoguarantee our obligations under our senior secured credit facilities described below, and will mature onAugust 15, 2020.
We have the option to redeem these notes, in whole or in part, at any time at a redemption price equal to thegreater of 100% of the principal amount of these notes or the sum of the present values of the remainingscheduled payments on these notes, discounted using a defined treasury rate plus 50 basis points, plus in eithercase accrued and unpaid interest to the redemption date.
The terms of the indenture for these notes, among other things, limit our ability and the ability of certain ofour subsidiaries to (i) incur secured debt, (ii) engage in sale and leaseback transactions, and (iii) consolidate,merge, sell or otherwise dispose of all or substantially all of our assets. These covenants are subject to significantexceptions and qualifications.
$150 million 7% Notes due 2028
At December 31, 2011, $150 million aggregate principal amount of our 7% notes due 2028 were outstanding.These notes are unsecured senior obligations and will mature on March 15, 2028.
We have the option to redeem these notes, in whole or in part, at any time at a redemption price equal to thegreater of 100% of the principal amount thereof or the sum of the present values of the remaining scheduledpayments thereon, discounted using a defined treasury rate plus 15 basis points, plus in either case accrued andunpaid interest to the redemption date.
The terms of the indenture for these notes, among other things, limit our ability and the ability of certain ofour subsidiaries to (i) incur secured debt, (ii) engage in sale and leaseback transactions, and (iii) consolidate,merge, sell or otherwise dispose of all or substantially all of our assets. These covenants are subject to significantexceptions and qualifications.
68
THE GOODYEAR TIRE & RUBBER COMPANY AND SUBSIDIARIES
CREDIT FACILITIES
$1.5 billion Amended and Restated First Lien Revolving Credit Facility due 2013
Our amended and restated first lien revolving credit facility is available in the form of loans or letters of credit,with letter of credit availability limited to $800 million. Subject to the consent of the lenders whose commitmentsare to be increased, we may request that the facility be increased by up to $250 million. Our obligations under thefacility are guaranteed by most of our wholly-owned U.S. and Canadian subsidiaries. Our obligations under thefacility and our subsidiaries’ obligations under the related guarantees are secured by first priority securityinterests in collateral that includes, subject to certain exceptions:
• U.S. and Canadian accounts receivable and inventory;
• certain of our U.S. manufacturing facilities;
• equity interests in our U.S. subsidiaries and up to 65% of the equity interests in our foreign subsidiaries,excluding GDTE and its subsidiaries; and
• substantially all other tangible and intangible assets, including equipment, contract rights and intellectualproperty.
Availability under the facility is subject to a borrowing base, which is based on eligible accounts receivable andinventory of The Goodyear Tire & Rubber Company (the “Parent Company”) and certain of its U.S. andCanadian subsidiaries, after adjusting for customary factors that are subject to modification from time to time bythe administrative agent and the majority lenders at their discretion (not to be exercised unreasonably).Modifications are based on the results of periodic collateral and borrowing base evaluations and appraisals. Tothe extent that our eligible accounts receivable and inventory decline, our borrowing base will decrease and theavailability under the facility may decrease below $1.5 billion. In addition, if the amount of outstandingborrowings and letters of credit under the facility exceeds the borrowing base, we are required to prepayborrowings and/or cash collateralize letters of credit sufficient to eliminate the excess. As of December 31, 2011,our borrowing base was above the facility’s stated amount of $1.5 billion.
The facility, which matures on April 30, 2013, contains certain covenants that, among other things, limit ourability to incur additional debt or issue redeemable preferred stock, make certain restricted payments orinvestments, incur liens, sell assets (excluding the sale of properties located in Akron, Ohio), incur restrictions onthe ability of our subsidiaries to pay dividends to us, enter into affiliate transactions, engage in sale and leasebacktransactions, and consolidate, merge, sell or otherwise dispose of all or substantially all of our assets. Thesecovenants are subject to significant exceptions and qualifications. In addition, in the event that the availabilityunder the facility plus the aggregate amount of our Available Cash is less than $150 million, we will not bepermitted to allow our ratio of EBITDA to Consolidated Interest Expense to be less than 2.0 to 1.0 for any periodof four consecutive fiscal quarters. “Available Cash,” “EBITDA” and “Consolidated Interest Expense” have themeanings given them in the facility.
The facility has customary representations and warranties including, as a condition to borrowing, that allsuch representations and warranties are true and correct, in all material respects, on the date of the borrowing,including representations as to no material adverse change in our financial condition since December 31, 2006.The facility also has customary defaults, including a cross-default to material indebtedness of Goodyear and oursubsidiaries.
If Available Cash plus the availability under the facility is greater than $400 million, amounts drawn underthe facility will bear interest either (i) at a rate of 125 basis points over LIBOR or (ii) 25 basis points over analternative base rate (the higher of the prime rate or the federal funds rate plus 50 basis points), and undrawnamounts under the facility will be subject to an annual commitment fee of 37.5 basis points. If Available Cashplus the availability under the facility is equal to or less than $400 million, then amounts drawn under the facilitywill bear interest either (i) at a rate of 150 basis points over LIBOR or (ii) 50 basis points over an alternative baserate, and undrawn amounts under the facility will be subject to an annual commitment fee of 25 basis points.
69
THE GOODYEAR TIRE & RUBBER COMPANY AND SUBSIDIARIES
At December 31, 2011, we had no borrowings and $407 million of letters of credit issued under therevolving credit facility. At December 31, 2010, we had no borrowings and $474 million of letters of creditissued under the revolving credit facility.
$1.2 billion Amended and Restated Second Lien Term Loan Facility due 2014
Our amended and restated second lien term loan facility may be increased by up to $300 million at our request,subject to the consent of the lenders making such additional term loans. Our obligations under this facility areguaranteed by most of our wholly-owned U.S. and Canadian subsidiaries and are secured by second prioritysecurity interests in the same collateral securing the $1.5 billion first lien revolving credit facility. The secondlien term loan facility, which matures on April 30, 2014, contains covenants, representations, warranties anddefaults similar to those in the $1.5 billion first lien revolving credit facility. However, if our Pro Forma SeniorSecured Leverage Ratio (the ratio of Consolidated Net Secured Indebtedness to EBITDA) for any period of fourconsecutive fiscal quarters is greater than 3.0 to 1.0, before we may use cash proceeds from certain asset sales torepay any junior lien, senior unsecured or subordinated indebtedness, we must first offer to prepay borrowingsunder the second lien term loan facility. “Pro Forma Senior Secured Leverage Ratio,” “Consolidated Net SecuredIndebtedness” and “EBITDA” have the meanings given them in the facility.
Loans under this facility bear interest, at our option, at LIBOR plus 150 basis points or an alternative baserate plus 50 basis points. If our corporate ratings by Moody’s and S&P were to decline to less than Ba3 and BB-,respectively (in each case with at least a stable outlook), then loans under this facility will bear interest, at ouroption, at LIBOR plus 175 basis points or an alternative base rate plus 75 basis points.
At December 31, 2011 and 2010, this facility was fully drawn.
€400 million Amended and Restated Senior Secured European Revolving Credit Facility due 2016
On April 20, 2011, we amended and restated our existing €505 million European revolving credit facility.Significant changes to that facility include the extension of the maturity to 2016, the reduction of the availablecommitments thereunder from €505 million to €400 million and a decrease of the commitment fee by 12.5 basispoints to 50 basis points. Loans will bear interest at LIBOR plus 250 basis points for loans denominated in U.S.dollars or pounds sterling and EURIBOR plus 250 basis points for loans denominated in euros.
The facility consists of (i) a €100 million German tranche that is available only to Goodyear Dunlop TiresGermany GmbH (the “German borrower”) and (ii) a €300 million all-borrower tranche that is available to GDTE,the German borrower and certain of GDTE’s other subsidiaries. Up to €50 million in letters of credit areavailable for issuance under the all-borrower tranche.
GDTE and certain of its subsidiaries in the United Kingdom, Luxembourg, France and Germany provideguarantees to support the facility. GDTE’s obligations under the facility and the obligations of its subsidiariesunder the related guarantees are secured by security interests in collateral that includes, subject to certainexceptions:
• the capital stock of the principal subsidiaries of GDTE; and
• a substantial portion of the tangible and intangible assets of GDTE and GDTE’s subsidiaries in the UnitedKingdom, Luxembourg, France and Germany, including certain accounts receivable, inventory, realproperty, equipment, contract rights and cash accounts, but excluding certain accounts receivable and cashaccounts in subsidiaries that are or may become parties to securitization programs.
The German guarantors secure the German tranche on a first-lien basis and the all-borrower tranche on a second-lien basis. GDTE and its other subsidiaries that provide guarantees secure the all-borrower tranche on a first-lienbasis and do not provide collateral support for the German tranche. The Company and its U.S. and Canadiansubsidiaries that guarantee our U.S. senior secured credit facilities also provide unsecured guarantees in supportof the facility.
70
THE GOODYEAR TIRE & RUBBER COMPANY AND SUBSIDIARIES
The facility, which matures on April 20, 2016, contains covenants similar to those in our first lien revolvingcredit facility, with additional limitations applicable to GDTE and its subsidiaries. In addition, under the facility,GDTE’s ratio of Consolidated Net J.V. Indebtedness to Consolidated European J.V. EBITDA for a period of fourconsecutive fiscal quarters is not permitted to be greater than 3.0 to 1.0 at the end of any fiscal quarter.Consolidated Net J.V. Indebtedness is determined net of the sum of (1) cash and cash equivalents in excess of$100 million held by GDTE and its subsidiaries, (2) cash and cash equivalents in excess of $150 million held bythe Company and its U.S. subsidiaries and (3) availability under our first lien revolving credit facility if availableborrowings under our first lien revolving credit facility plus Available Cash (as defined thereunder) is equal to orgreater than $150 million and the conditions to borrowing thereunder are met. Consolidated Net J.V.Indebtedness also excludes loans from other consolidated Goodyear entities. “Consolidated Net J.V.Indebtedness” and “Consolidated European J.V. EBITDA” have the meanings given them in the facility.
The facility has customary representations and warranties including, as a condition to borrowing, that allsuch representations and warranties are true and correct, in all material respects, on the date of the borrowing,including representations as to no material adverse change in our financial condition since December 31, 2010.The facility also has customary defaults, including a cross-default to material indebtedness of Goodyear and oursubsidiaries.
At December 31, 2011 and 2010 there were no borrowings outstanding under the German and theall-borrower tranches. Letters of credit issued under the all-borrower tranche totaled $8 million (€6 million) atDecember 31, 2011 and $12 million (€9 million) at December 31, 2010.
International Accounts Receivable Securitization Facilities (On-Balance Sheet)
GDTE and certain of its subsidiaries are parties to a pan-European accounts receivable securitization facility thatprovides up to €450 million of funding and expires in 2015. Utilization under this facility is based on currentavailable receivable balances. The facility is subject to customary annual renewal of back-up liquiditycommitments.
The facility involves an ongoing daily sale of substantially all of the trade accounts receivable of certainGDTE subsidiaries to a bankruptcy-remote French company controlled by one of the liquidity banks in thefacility. These subsidiaries retain servicing responsibilities. It is an event of default under the facility if the ratioof GDTE’s consolidated net indebtedness to its consolidated EBITDA is greater than 3.0 to 1.0. This financialcovenant is substantially similar to the covenant included in the European revolving credit facility.
At December 31, 2011 and 2010, the amount available, and fully utilized under this program, totaled $393million (€303 million) and $319 million (€238 million), respectively. The program did not qualify for saleaccounting, and accordingly, these amounts are included in Long term debt and capital leases.
In addition to the pan-European accounts receivable securitization facility discussed above, subsidiaries inAustralia have an accounts receivable securitization program totaling $75 million and $72 million atDecember 31, 2011 and 2010, respectively. The receivables sold under this program also serve as collateral forthe related facility. We retain the risk of loss related to these receivables in the event of non-payment. Theseamounts are included in Notes payable and overdrafts.
Accounts Receivable Factoring Facilities (Off-Balance Sheet)
Various subsidiaries sold certain of their trade receivables under off-balance sheet programs during 2011 and2010. For these programs, we have concluded that there is generally no risk of loss to us from non-payment ofthe sold receivables. At December 31, 2011 and 2010, the gross amount of receivables sold was $190 million and$126 million, respectively.
71
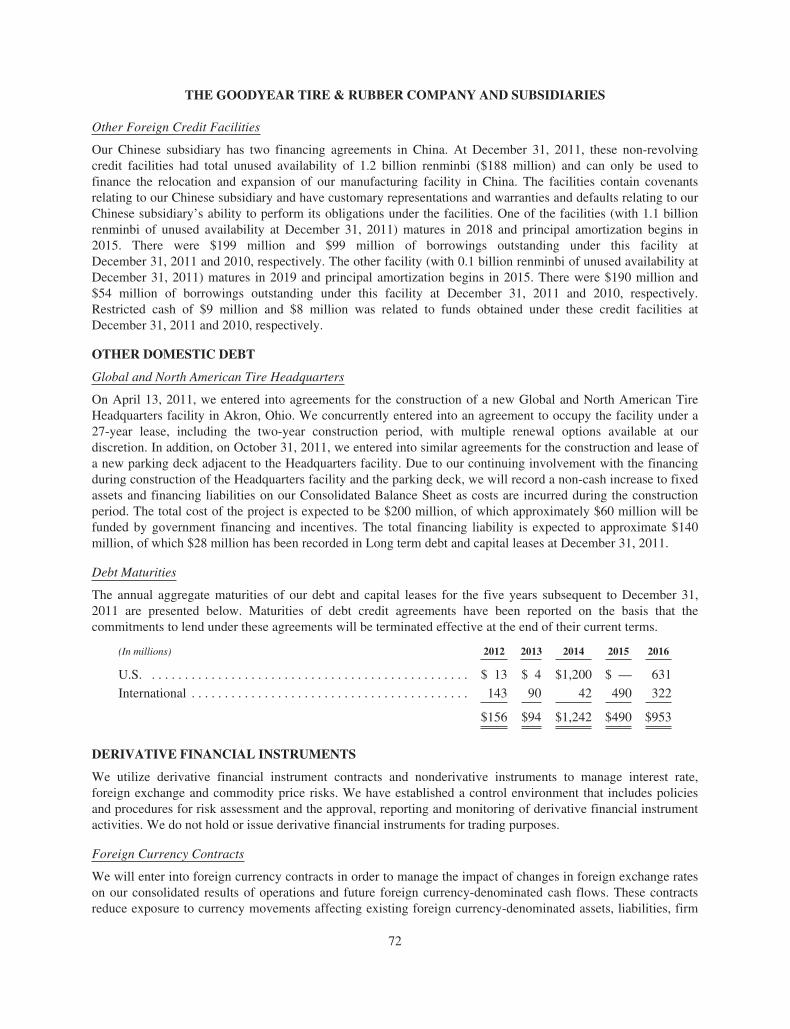
THE GOODYEAR TIRE & RUBBER COMPANY AND SUBSIDIARIES
Other Foreign Credit Facilities
Our Chinese subsidiary has two financing agreements in China. At December 31, 2011, these non-revolvingcredit facilities had total unused availability of 1.2 billion renminbi ($188 million) and can only be used tofinance the relocation and expansion of our manufacturing facility in China. The facilities contain covenantsrelating to our Chinese subsidiary and have customary representations and warranties and defaults relating to ourChinese subsidiary’s ability to perform its obligations under the facilities. One of the facilities (with 1.1 billionrenminbi of unused availability at December 31, 2011) matures in 2018 and principal amortization begins in2015. There were $199 million and $99 million of borrowings outstanding under this facility atDecember 31, 2011 and 2010, respectively. The other facility (with 0.1 billion renminbi of unused availability atDecember 31, 2011) matures in 2019 and principal amortization begins in 2015. There were $190 million and$54 million of borrowings outstanding under this facility at December 31, 2011 and 2010, respectively.Restricted cash of $9 million and $8 million was related to funds obtained under these credit facilities atDecember 31, 2011 and 2010, respectively.
OTHER DOMESTIC DEBT
Global and North American Tire Headquarters
On April 13, 2011, we entered into agreements for the construction of a new Global and North American TireHeadquarters facility in Akron, Ohio. We concurrently entered into an agreement to occupy the facility under a27-year lease, including the two-year construction period, with multiple renewal options available at ourdiscretion. In addition, on October 31, 2011, we entered into similar agreements for the construction and lease ofa new parking deck adjacent to the Headquarters facility. Due to our continuing involvement with the financingduring construction of the Headquarters facility and the parking deck, we will record a non-cash increase to fixedassets and financing liabilities on our Consolidated Balance Sheet as costs are incurred during the constructionperiod. The total cost of the project is expected to be $200 million, of which approximately $60 million will befunded by government financing and incentives. The total financing liability is expected to approximate $140million, of which $28 million has been recorded in Long term debt and capital leases at December 31, 2011.
Debt Maturities
The annual aggregate maturities of our debt and capital leases for the five years subsequent to December 31,2011 are presented below. Maturities of debt credit agreements have been reported on the basis that thecommitments to lend under these agreements will be terminated effective at the end of their current terms.
(In millions) 2012 2013 2014 2015 2016
U.S. . . . . . . . . . . . . . . . . . . . . . . . . . . . . . . . . . . . . . . . . . . . . . . . . $ 13 $ 4 $1,200 $ — 631
International . . . . . . . . . . . . . . . . . . . . . . . . . . . . . . . . . . . . . . . . . . 143 90 42 490 322
$156 $94 $1,242 $490 $953
DERIVATIVE FINANCIAL INSTRUMENTS
We utilize derivative financial instrument contracts and nonderivative instruments to manage interest rate,foreign exchange and commodity price risks. We have established a control environment that includes policiesand procedures for risk assessment and the approval, reporting and monitoring of derivative financial instrumentactivities. We do not hold or issue derivative financial instruments for trading purposes.
Foreign Currency Contracts
We will enter into foreign currency contracts in order to manage the impact of changes in foreign exchange rateson our consolidated results of operations and future foreign currency-denominated cash flows. These contractsreduce exposure to currency movements affecting existing foreign currency-denominated assets, liabilities, firm
72
THE GOODYEAR TIRE & RUBBER COMPANY AND SUBSIDIARIES
commitments and forecasted transactions resulting primarily from trade purchases and sales, equipmentacquisitions, intercompany loans and royalty agreements. Contracts hedging short term trade receivables andpayables normally have no hedging designation.
The following table presents fair values for foreign currency contracts not designated as hedging instruments:
(In millions)December 31,
2011December 31,
2010
Fair Values — asset (liability):
Accounts receivable . . . . . . . . . . . . . . . . . . . . . . . . . . . . . . . . . . . . . . . . . . $26 $ 25
Other assets . . . . . . . . . . . . . . . . . . . . . . . . . . . . . . . . . . . . . . . . . . . . . . . . — 1
Other current liabilities . . . . . . . . . . . . . . . . . . . . . . . . . . . . . . . . . . . . . . . (5) (15)
Other long term liabilities . . . . . . . . . . . . . . . . . . . . . . . . . . . . . . . . . . . . . (1) —
At December 31, 2011 and 2010, these outstanding foreign currency derivatives had notional amounts of $1,056million and $1,324 million, respectively, and were primarily related to intercompany loans. Other Expenseincluded net transaction gains of $30 million and $47 million in 2011 and 2010, respectively, on foreign currencyderivatives. These amounts were substantially offset in Other Expense by the effect of changing exchange rateson the underlying currency exposures.
The following table presents fair values for foreign currency contracts designated as cash flow hedginginstruments:
(In millions)December 31,
2011December 31,
2010
Fair Values — asset (liability):
Accounts receivable . . . . . . . . . . . . . . . . . . . . . . . . . . . . . . . . . . . . . . . . . . $11 $—
Other current liabilities . . . . . . . . . . . . . . . . . . . . . . . . . . . . . . . . . . . . . . . — (2)
At December 31, 2011 and 2010, these outstanding foreign currency derivatives had notional amounts of $171million and $75 million, respectively, and primarily related to intercompany transactions.
The following table presents the classification of changes in fair values of foreign currency contractsdesignated as cash flow hedging instruments (before tax and minority):
Twelve MonthsEnded
December 31,
(In millions) (Income) Expense 2011 2010
Amounts deferred to AOCL . . . . . . . . . . . . . . . . . . . . . . . . . . . . . . . . . . . . . . . . . . . . . . . . $ (5) $ 2
Amount of deferred loss reclassified from AOCL into CGS . . . . . . . . . . . . . . . . . . . . . . . 10 —
Amounts excluded from effectiveness testing . . . . . . . . . . . . . . . . . . . . . . . . . . . . . . . . . . 2 —
The estimated net amount of the deferred gains at December 31, 2011 that is expected to be reclassified toearnings within the next twelve months is $13 million.
The counterparties to our foreign currency contracts were considered by us to be substantial andcreditworthy financial institutions that are recognized market makers at the time we entered into those contracts.We seek to control our credit exposure to these counterparties by diversifying across multiple counterparties, bysetting counterparty credit limits based on long term credit ratings and other indicators of counterparty credit risksuch as credit default swap spreads, and by monitoring the financial strength of these counterparties on a regularbasis. We also enter into master netting agreements with counterparties when possible. By controlling andmonitoring exposure to counterparties in this manner, we believe that we effectively manage the risk of loss due
73
THE GOODYEAR TIRE & RUBBER COMPANY AND SUBSIDIARIES
to nonperformance by a counterparty. However, the inability of a counterparty to fulfill its contractualobligations to us could have a material adverse effect on our liquidity, financial position or results of operationsin the period in which it occurs.
Note 16. Fair Value Measurements
The following table presents information about assets and liabilities recorded at fair value on the ConsolidatedBalance Sheet at December 31, 2011 and December 31, 2010:
Total Carrying Valuein the Consolidated
Balance Sheet
Quoted Prices in ActiveMarkets for IdenticalAssets/Liabilities
(Level 1)
Significant OtherObservable Inputs
(Level 2)
SignificantUnobservable
Inputs(Level 3)
(In millions) 2011 2010 2011 2010 2011 2010 2011 2010
Assets:Investments . . . . . . . . . . . . . . . . . . . . . . $44 $38 $44 $38 $— $— $— $—
Foreign Exchange Contracts . . . . . . . . . 37 26 — — 37 25 — 1
Total Assets at Fair Value . . . . . . . . . . $81 $64 $44 $38 $37 $25 $— $ 1
Liabilities:Foreign Exchange Contracts . . . . . . . . . $ 6 $17 $— $— $ 5 $17 $ 1 $—
Total Liabilities at Fair Value . . . . . . . . $ 6 $17 $— $— $ 5 $17 $ 1 $—
Derivative financial instrument valuations classified as Level 3 included embedded currency derivatives in long-dated operating leases. The valuation of the embedded currency derivatives is based on an extrapolation offorward rates to the assumed expiration of the leases. Realized and unrealized gains and losses related to theembedded currency derivatives are included in Other Expense.
The following table presents supplemental fair value information about long term fixed rate and variablerate debt, excluding capital leases, at December 31, 2011 and December 31, 2010. The fair value was estimatedusing quoted market prices or discounted future cash flows.
(In millions)December 31,
2011December 31,
2010
Fixed Rate Debt:Carrying amount — liability . . . . . . . . . . . . . . . . . . . . . . . . . . . . . . . . . . . . . . $2,843 $2,691
Fair value — liability . . . . . . . . . . . . . . . . . . . . . . . . . . . . . . . . . . . . . . . . . . . 2,891 2,791
Variable Rate Debt:Carrying amount — liability . . . . . . . . . . . . . . . . . . . . . . . . . . . . . . . . . . . . . . $2,071 $1,798
Fair value — liability . . . . . . . . . . . . . . . . . . . . . . . . . . . . . . . . . . . . . . . . . . . 2,029 1,770
Note 17. Pension, Other Postretirement Benefits and Savings Plans
We provide employees with defined benefit pension or defined contribution savings plans. Our principalU.S. hourly pension plans provide benefits based on length of service. Effective August 29, 2009, the U.S. hourlypension plans were closed to newly hired employees covered by the United Steelworkers (“USW”) master laborcontract. The principal U.S. salaried pension plans provide benefits based on final five-year average earningsformulas. Salaried employees who made voluntary contributions to these plans receive higher benefits. EffectiveDecember 31, 2008, we froze our U.S. salaried pension plans and implemented improvements to our definedcontribution savings plan for these employees.
74
THE GOODYEAR TIRE & RUBBER COMPANY AND SUBSIDIARIES
In addition, we provide certain U.S. employees and employees at certain non-U.S. subsidiaries with healthcare benefits or life insurance benefits upon retirement. Substantial portions of the health care benefits forU.S. salaried retirees are not insured and are funded from operations.
During 2011, we recognized settlement charges of $15 million related to one of our U.S. pension plans.These settlement charges resulted from total lump sum payments exceeding annual service and interest cost forthe plan.
During 2010, we recognized curtailment and termination benefit charges for pensions of $76 million inconnection with our plan to close our manufacturing facility in Union City, Tennessee. Also in 2010, werecognized a settlement charge of $15 million related to the purchase of annuities from existing plan assets tosettle obligations of certain Canadian pension plans.
Total benefits cost and amounts recognized in other comprehensive (income) loss follows:
Pension Plans OtherPostretirement
BenefitsU.S. Non-U.S.
(In millions) 2011 2010 2009 2011 2010 2009 2011 2010 2009
Benefits cost:Service cost . . . . . . . . . . . . . . . . . . . . . . . . . . . . . . . $ 41 $ 39 $ 34 $ 32 $ 25 $ 26 $ 6 $ 5 $ 6
Interest cost . . . . . . . . . . . . . . . . . . . . . . . . . . . . . . . 283 296 314 150 145 142 30 33 32
Expected return on plan assets . . . . . . . . . . . . . . . . . (306) (280) (235) (131) (126) (115) — (1) (1)
Amortization of prior service cost (credit) . . . . . . . . 23 31 33 2 2 2 (37) (37) (38)
Amortization of net losses . . . . . . . . . . . . . . . . . . . . 134 133 154 38 35 32 10 9 5
Net periodic cost . . . . . . . . . . . . . . . . . . . . . . . . . 175 219 300 91 81 87 9 9 4
Curtailments/settlements . . . . . . . . . . . . . . . . . . . . . 15 33 — 1 15 17 — 8 —
Termination benefits . . . . . . . . . . . . . . . . . . . . . . . . — 43 — 1 — 1 — — —
Total benefits cost . . . . . . . . . . . . . . . . . . . . . . . . $ 190 $ 295 $ 300 $ 93 $ 96 $ 105 $ 9 $ 17 $ 4
Recognized in other comprehensive (income)loss before tax and minority:
Prior service cost from plan amendments . . . . . . . . $ — $ — $ 21 $ — $ 1 $ 2 $ — $ — $ 1
Increase (decrease) in net actuarial losses . . . . . . . . 735 143 (85 ) 45 (12 ) 367 15 59 35
Amortization of prior service (cost) credit in netperiodic cost . . . . . . . . . . . . . . . . . . . . . . . . . . . . . (23) (31) (33) (2) (2) (1) 37 37 38
Amortization of net losses in net periodic cost . . . . (134) (133) (154) (38) (35) (30) (10) (9) (5)
Immediate recognition of prior service cost andunrecognized gains and losses due tocurtailments, settlements, and divestitures . . . . . (15) (40) — (4) (16) (55) — (8) —
Total recognized in other comprehensive(income) loss before tax and minority . . . . . . . 563 (61) (251) 1 (64) 283 42 79 69
Total recognized in total benefits cost andother comprehensive (income) loss beforetax and minority . . . . . . . . . . . . . . . . . . . . . . . $ 753 $ 234 $ 49 $ 94 $ 32 $ 388 $ 51 $ 96 $ 73
Total benefits (credit) cost for our other postretirement benefits was $(12) million, $(1) million and $(10) millionfor our U.S. plans in 2011, 2010 and 2009, respectively, and $21 million, $18 million and $14 million for ournon-U.S. plans in 2011, 2010 and 2009, respectively. Total benefits cost for our other postretirement benefitsincludes a settlement charge of $7 million in 2010 for participant data for our U.S. plans related to prior periods.
75
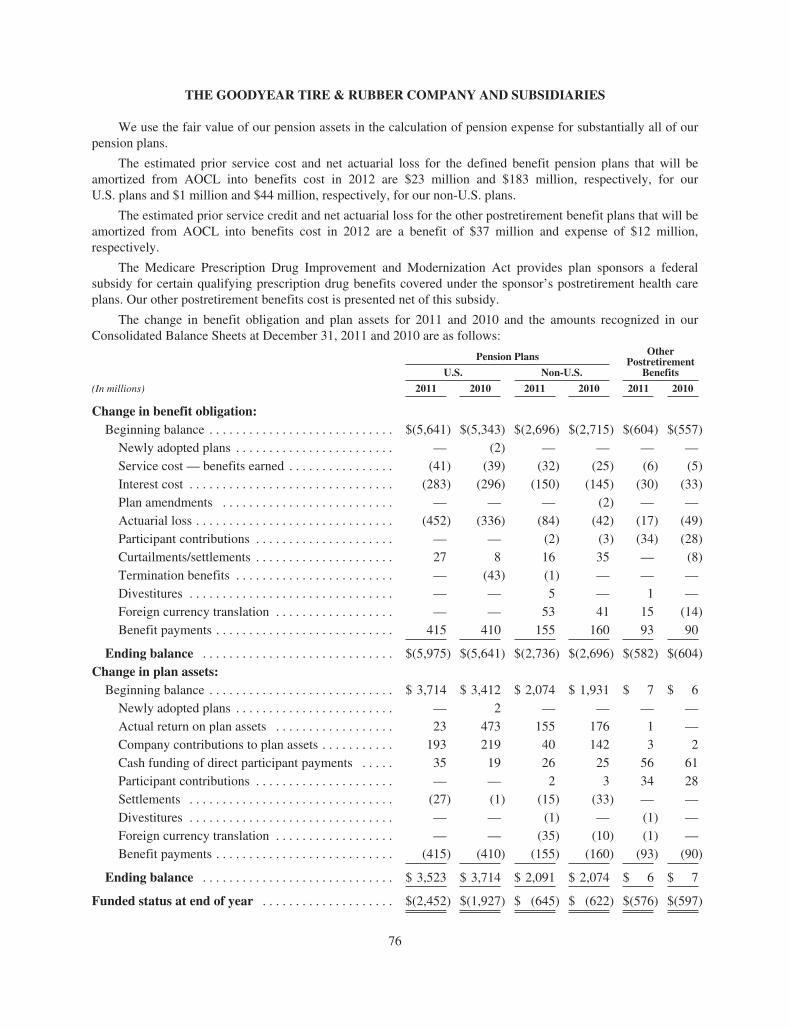
THE GOODYEAR TIRE & RUBBER COMPANY AND SUBSIDIARIES
We use the fair value of our pension assets in the calculation of pension expense for substantially all of ourpension plans.
The estimated prior service cost and net actuarial loss for the defined benefit pension plans that will beamortized from AOCL into benefits cost in 2012 are $23 million and $183 million, respectively, for ourU.S. plans and $1 million and $44 million, respectively, for our non-U.S. plans.
The estimated prior service credit and net actuarial loss for the other postretirement benefit plans that will beamortized from AOCL into benefits cost in 2012 are a benefit of $37 million and expense of $12 million,respectively.
The Medicare Prescription Drug Improvement and Modernization Act provides plan sponsors a federalsubsidy for certain qualifying prescription drug benefits covered under the sponsor’s postretirement health careplans. Our other postretirement benefits cost is presented net of this subsidy.
The change in benefit obligation and plan assets for 2011 and 2010 and the amounts recognized in ourConsolidated Balance Sheets at December 31, 2011 and 2010 are as follows:
Pension Plans OtherPostretirement
BenefitsU.S. Non-U.S.
(In millions) 2011 2010 2011 2010 2011 2010
Change in benefit obligation:Beginning balance . . . . . . . . . . . . . . . . . . . . . . . . . . . . $(5,641) $(5,343) $(2,696) $(2,715) $(604) $(557)
Newly adopted plans . . . . . . . . . . . . . . . . . . . . . . . . — (2) — — — —Service cost — benefits earned . . . . . . . . . . . . . . . . (41) (39) (32) (25) (6) (5)Interest cost . . . . . . . . . . . . . . . . . . . . . . . . . . . . . . . (283) (296) (150) (145) (30) (33)Plan amendments . . . . . . . . . . . . . . . . . . . . . . . . . . — — — (2) — —Actuarial loss . . . . . . . . . . . . . . . . . . . . . . . . . . . . . . (452) (336) (84) (42) (17) (49)Participant contributions . . . . . . . . . . . . . . . . . . . . . — — (2) (3) (34) (28)Curtailments/settlements . . . . . . . . . . . . . . . . . . . . . 27 8 16 35 — (8)Termination benefits . . . . . . . . . . . . . . . . . . . . . . . . — (43) (1) — — —Divestitures . . . . . . . . . . . . . . . . . . . . . . . . . . . . . . . — — 5 — 1 —Foreign currency translation . . . . . . . . . . . . . . . . . . — — 53 41 15 (14)Benefit payments . . . . . . . . . . . . . . . . . . . . . . . . . . . 415 410 155 160 93 90
Ending balance . . . . . . . . . . . . . . . . . . . . . . . . . . . . . $(5,975) $(5,641) $(2,736) $(2,696) $(582) $(604)Change in plan assets:
Beginning balance . . . . . . . . . . . . . . . . . . . . . . . . . . . . $ 3,714 $ 3,412 $ 2,074 $ 1,931 $ 7 $ 6Newly adopted plans . . . . . . . . . . . . . . . . . . . . . . . . — 2 — — — —Actual return on plan assets . . . . . . . . . . . . . . . . . . 23 473 155 176 1 —Company contributions to plan assets . . . . . . . . . . . 193 219 40 142 3 2Cash funding of direct participant payments . . . . . 35 19 26 25 56 61Participant contributions . . . . . . . . . . . . . . . . . . . . . — — 2 3 34 28Settlements . . . . . . . . . . . . . . . . . . . . . . . . . . . . . . . (27) (1) (15) (33) — —Divestitures . . . . . . . . . . . . . . . . . . . . . . . . . . . . . . . — — (1) — (1) —Foreign currency translation . . . . . . . . . . . . . . . . . . — — (35) (10) (1) —Benefit payments . . . . . . . . . . . . . . . . . . . . . . . . . . . (415) (410) (155) (160) (93) (90)
Ending balance . . . . . . . . . . . . . . . . . . . . . . . . . . . . . $ 3,523 $ 3,714 $ 2,091 $ 2,074 $ 6 $ 7
Funded status at end of year . . . . . . . . . . . . . . . . . . . . $(2,452) $(1,927) $ (645) $ (622) $(576) $(597)
76
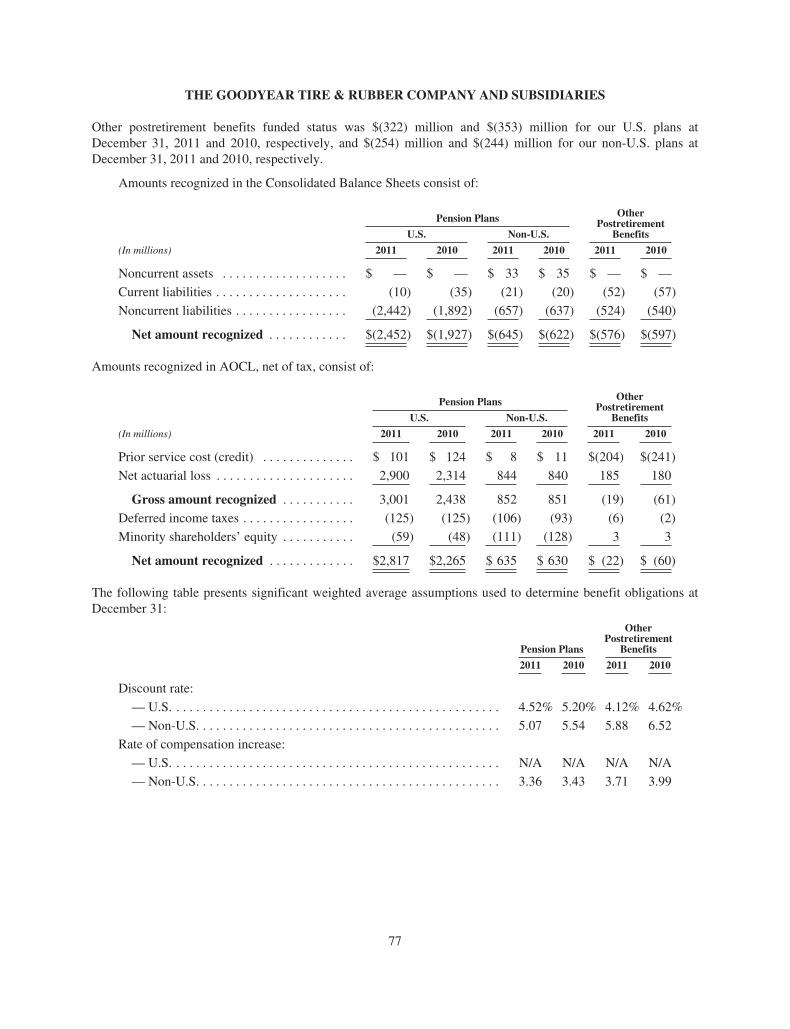
THE GOODYEAR TIRE & RUBBER COMPANY AND SUBSIDIARIES
Other postretirement benefits funded status was $(322) million and $(353) million for our U.S. plans atDecember 31, 2011 and 2010, respectively, and $(254) million and $(244) million for our non-U.S. plans atDecember 31, 2011 and 2010, respectively.
Amounts recognized in the Consolidated Balance Sheets consist of:
Pension Plans OtherPostretirement
BenefitsU.S. Non-U.S.
(In millions) 2011 2010 2011 2010 2011 2010
Noncurrent assets . . . . . . . . . . . . . . . . . . . $ — $ — $ 33 $ 35 $ — $ —
Current liabilities . . . . . . . . . . . . . . . . . . . . (10) (35) (21) (20) (52) (57)
Noncurrent liabilities . . . . . . . . . . . . . . . . . (2,442) (1,892) (657) (637) (524) (540)
Net amount recognized . . . . . . . . . . . . $(2,452) $(1,927) $(645) $(622) $(576) $(597)
Amounts recognized in AOCL, net of tax, consist of:
Pension Plans OtherPostretirement
BenefitsU.S. Non-U.S.
(In millions) 2011 2010 2011 2010 2011 2010
Prior service cost (credit) . . . . . . . . . . . . . . $ 101 $ 124 $ 8 $ 11 $(204) $(241)
Net actuarial loss . . . . . . . . . . . . . . . . . . . . . 2,900 2,314 844 840 185 180
Gross amount recognized . . . . . . . . . . . 3,001 2,438 852 851 (19) (61)
Deferred income taxes . . . . . . . . . . . . . . . . . (125) (125) (106) (93) (6) (2)
Minority shareholders’ equity . . . . . . . . . . . (59) (48) (111) (128) 3 3
Net amount recognized . . . . . . . . . . . . . $2,817 $2,265 $ 635 $ 630 $ (22) $ (60)
The following table presents significant weighted average assumptions used to determine benefit obligations atDecember 31:
Pension Plans
OtherPostretirement
Benefits
2011 2010 2011 2010
Discount rate:
— U.S. . . . . . . . . . . . . . . . . . . . . . . . . . . . . . . . . . . . . . . . . . . . . . . . . . 4.52% 5.20% 4.12% 4.62%
— Non-U.S. . . . . . . . . . . . . . . . . . . . . . . . . . . . . . . . . . . . . . . . . . . . . . 5.07 5.54 5.88 6.52
Rate of compensation increase:
— U.S. . . . . . . . . . . . . . . . . . . . . . . . . . . . . . . . . . . . . . . . . . . . . . . . . . N/A N/A N/A N/A
— Non-U.S. . . . . . . . . . . . . . . . . . . . . . . . . . . . . . . . . . . . . . . . . . . . . . 3.36 3.43 3.71 3.99
77
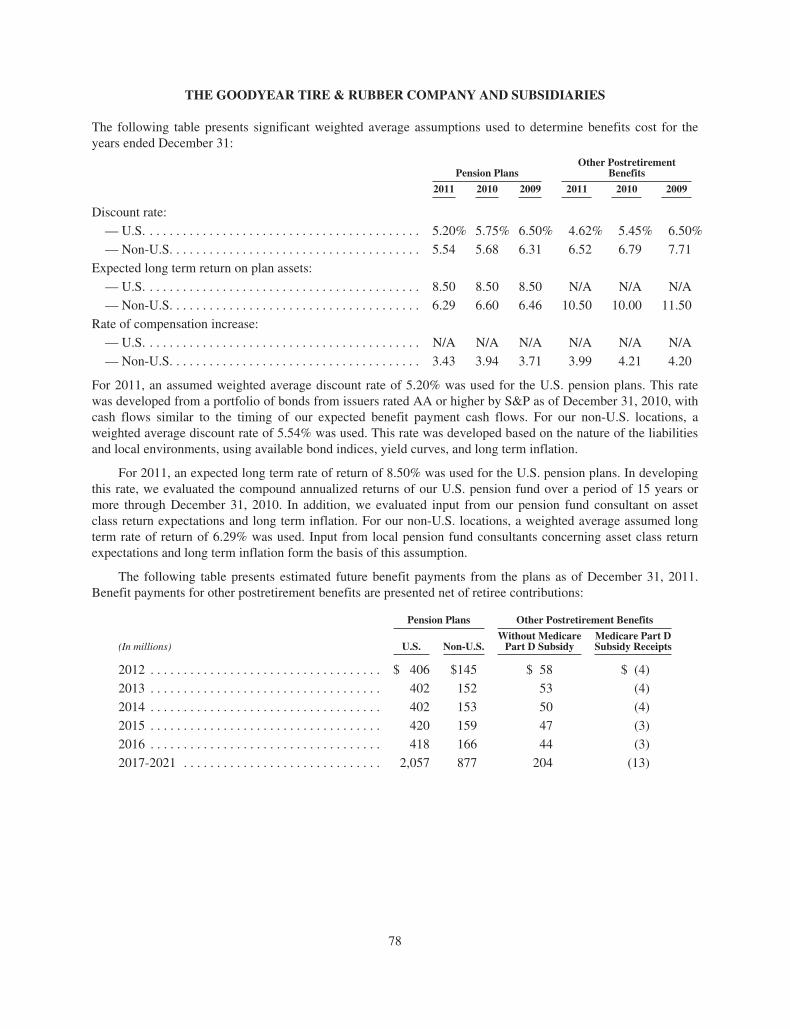
THE GOODYEAR TIRE & RUBBER COMPANY AND SUBSIDIARIES
The following table presents significant weighted average assumptions used to determine benefits cost for theyears ended December 31:
Pension PlansOther Postretirement
Benefits
2011 2010 2009 2011 2010 2009
Discount rate:
— U.S. . . . . . . . . . . . . . . . . . . . . . . . . . . . . . . . . . . . . . . . . . 5.20% 5.75% 6.50% 4.62% 5.45% 6.50%
— Non-U.S. . . . . . . . . . . . . . . . . . . . . . . . . . . . . . . . . . . . . . 5.54 5.68 6.31 6.52 6.79 7.71
Expected long term return on plan assets:
— U.S. . . . . . . . . . . . . . . . . . . . . . . . . . . . . . . . . . . . . . . . . . 8.50 8.50 8.50 N/A N/A N/A
— Non-U.S. . . . . . . . . . . . . . . . . . . . . . . . . . . . . . . . . . . . . . 6.29 6.60 6.46 10.50 10.00 11.50
Rate of compensation increase:
— U.S. . . . . . . . . . . . . . . . . . . . . . . . . . . . . . . . . . . . . . . . . . N/A N/A N/A N/A N/A N/A
— Non-U.S. . . . . . . . . . . . . . . . . . . . . . . . . . . . . . . . . . . . . . 3.43 3.94 3.71 3.99 4.21 4.20
For 2011, an assumed weighted average discount rate of 5.20% was used for the U.S. pension plans. This ratewas developed from a portfolio of bonds from issuers rated AA or higher by S&P as of December 31, 2010, withcash flows similar to the timing of our expected benefit payment cash flows. For our non-U.S. locations, aweighted average discount rate of 5.54% was used. This rate was developed based on the nature of the liabilitiesand local environments, using available bond indices, yield curves, and long term inflation.
For 2011, an expected long term rate of return of 8.50% was used for the U.S. pension plans. In developingthis rate, we evaluated the compound annualized returns of our U.S. pension fund over a period of 15 years ormore through December 31, 2010. In addition, we evaluated input from our pension fund consultant on assetclass return expectations and long term inflation. For our non-U.S. locations, a weighted average assumed longterm rate of return of 6.29% was used. Input from local pension fund consultants concerning asset class returnexpectations and long term inflation form the basis of this assumption.
The following table presents estimated future benefit payments from the plans as of December 31, 2011.Benefit payments for other postretirement benefits are presented net of retiree contributions:
Pension Plans Other Postretirement Benefits
(In millions) U.S. Non-U.S.Without MedicarePart D Subsidy
Medicare Part DSubsidy Receipts
2012 . . . . . . . . . . . . . . . . . . . . . . . . . . . . . . . . . . . $ 406 $145 $ 58 $ (4)
2013 . . . . . . . . . . . . . . . . . . . . . . . . . . . . . . . . . . . 402 152 53 (4)
2014 . . . . . . . . . . . . . . . . . . . . . . . . . . . . . . . . . . . 402 153 50 (4)
2015 . . . . . . . . . . . . . . . . . . . . . . . . . . . . . . . . . . . 420 159 47 (3)
2016 . . . . . . . . . . . . . . . . . . . . . . . . . . . . . . . . . . . 418 166 44 (3)
2017-2021 . . . . . . . . . . . . . . . . . . . . . . . . . . . . . . 2,057 877 204 (13)
78
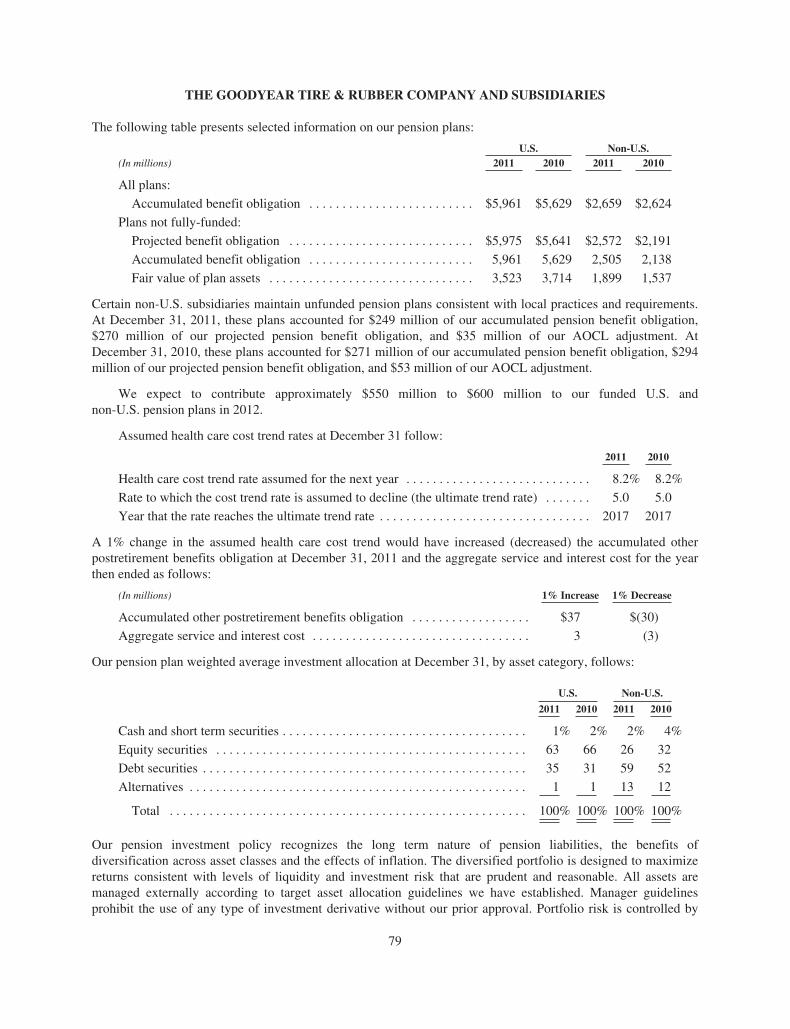
THE GOODYEAR TIRE & RUBBER COMPANY AND SUBSIDIARIES
The following table presents selected information on our pension plans:
U.S. Non-U.S.(In millions) 2011 2010 2011 2010
All plans:
Accumulated benefit obligation . . . . . . . . . . . . . . . . . . . . . . . . . $5,961 $5,629 $2,659 $2,624
Plans not fully-funded:
Projected benefit obligation . . . . . . . . . . . . . . . . . . . . . . . . . . . . $5,975 $5,641 $2,572 $2,191
Accumulated benefit obligation . . . . . . . . . . . . . . . . . . . . . . . . . 5,961 5,629 2,505 2,138
Fair value of plan assets . . . . . . . . . . . . . . . . . . . . . . . . . . . . . . . 3,523 3,714 1,899 1,537
Certain non-U.S. subsidiaries maintain unfunded pension plans consistent with local practices and requirements.At December 31, 2011, these plans accounted for $249 million of our accumulated pension benefit obligation,$270 million of our projected pension benefit obligation, and $35 million of our AOCL adjustment. AtDecember 31, 2010, these plans accounted for $271 million of our accumulated pension benefit obligation, $294million of our projected pension benefit obligation, and $53 million of our AOCL adjustment.
We expect to contribute approximately $550 million to $600 million to our funded U.S. andnon-U.S. pension plans in 2012.
Assumed health care cost trend rates at December 31 follow:
2011 2010
Health care cost trend rate assumed for the next year . . . . . . . . . . . . . . . . . . . . . . . . . . . . 8.2% 8.2%
Rate to which the cost trend rate is assumed to decline (the ultimate trend rate) . . . . . . . 5.0 5.0
Year that the rate reaches the ultimate trend rate . . . . . . . . . . . . . . . . . . . . . . . . . . . . . . . . 2017 2017
A 1% change in the assumed health care cost trend would have increased (decreased) the accumulated otherpostretirement benefits obligation at December 31, 2011 and the aggregate service and interest cost for the yearthen ended as follows:
(In millions) 1% Increase 1% Decrease
Accumulated other postretirement benefits obligation . . . . . . . . . . . . . . . . . . $37 $(30)
Aggregate service and interest cost . . . . . . . . . . . . . . . . . . . . . . . . . . . . . . . . . 3 (3)
Our pension plan weighted average investment allocation at December 31, by asset category, follows:
U.S. Non-U.S.
2011 2010 2011 2010
Cash and short term securities . . . . . . . . . . . . . . . . . . . . . . . . . . . . . . . . . . . . . 1% 2% 2% 4%
Equity securities . . . . . . . . . . . . . . . . . . . . . . . . . . . . . . . . . . . . . . . . . . . . . . . 63 66 26 32
Debt securities . . . . . . . . . . . . . . . . . . . . . . . . . . . . . . . . . . . . . . . . . . . . . . . . . 35 31 59 52
Alternatives . . . . . . . . . . . . . . . . . . . . . . . . . . . . . . . . . . . . . . . . . . . . . . . . . . . 1 1 13 12
Total . . . . . . . . . . . . . . . . . . . . . . . . . . . . . . . . . . . . . . . . . . . . . . . . . . . . . . 100% 100% 100% 100%
Our pension investment policy recognizes the long term nature of pension liabilities, the benefits ofdiversification across asset classes and the effects of inflation. The diversified portfolio is designed to maximizereturns consistent with levels of liquidity and investment risk that are prudent and reasonable. All assets aremanaged externally according to target asset allocation guidelines we have established. Manager guidelinesprohibit the use of any type of investment derivative without our prior approval. Portfolio risk is controlled by
79
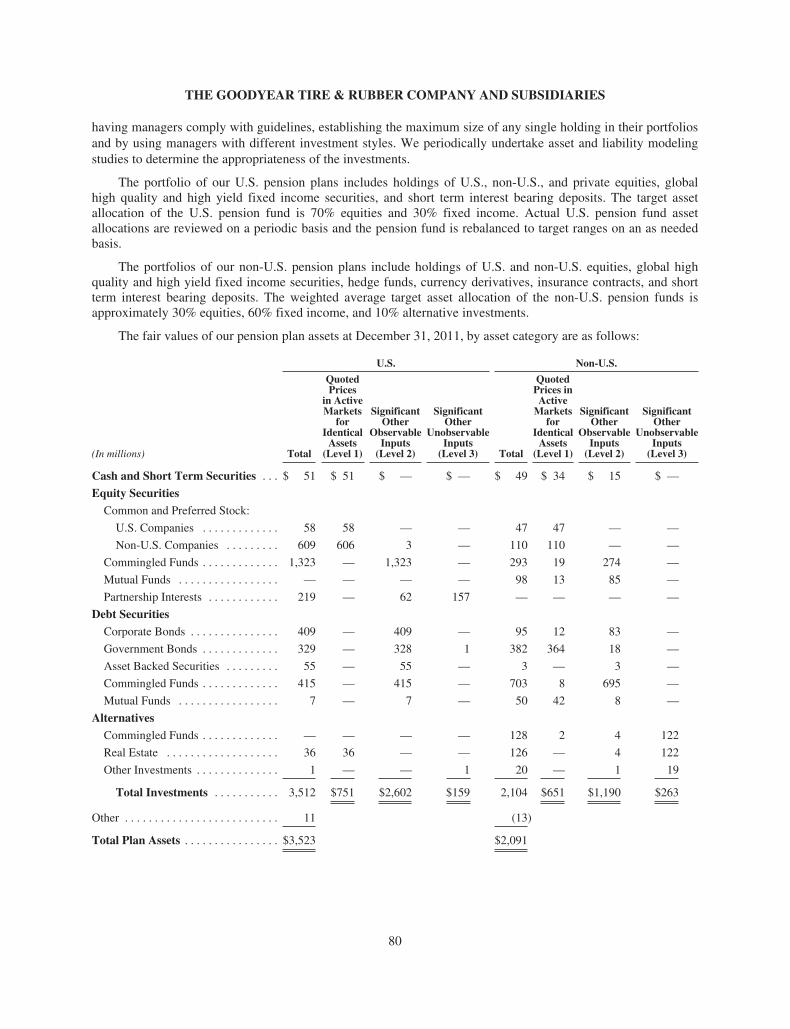
THE GOODYEAR TIRE & RUBBER COMPANY AND SUBSIDIARIES
having managers comply with guidelines, establishing the maximum size of any single holding in their portfoliosand by using managers with different investment styles. We periodically undertake asset and liability modelingstudies to determine the appropriateness of the investments.
The portfolio of our U.S. pension plans includes holdings of U.S., non-U.S., and private equities, globalhigh quality and high yield fixed income securities, and short term interest bearing deposits. The target assetallocation of the U.S. pension fund is 70% equities and 30% fixed income. Actual U.S. pension fund assetallocations are reviewed on a periodic basis and the pension fund is rebalanced to target ranges on an as neededbasis.
The portfolios of our non-U.S. pension plans include holdings of U.S. and non-U.S. equities, global highquality and high yield fixed income securities, hedge funds, currency derivatives, insurance contracts, and shortterm interest bearing deposits. The weighted average target asset allocation of the non-U.S. pension funds isapproximately 30% equities, 60% fixed income, and 10% alternative investments.
The fair values of our pension plan assets at December 31, 2011, by asset category are as follows:
U.S. Non-U.S.
(In millions) Total
QuotedPrices
in ActiveMarkets
forIdenticalAssets
(Level 1)
SignificantOther
ObservableInputs(Level 2)
SignificantOther
UnobservableInputs(Level 3) Total
QuotedPrices inActiveMarkets
forIdenticalAssets
(Level 1)
SignificantOther
ObservableInputs(Level 2)
SignificantOther
UnobservableInputs(Level 3)
Cash and Short Term Securities . . . $ 51 $ 51 $ — $ — $ 49 $ 34 $ 15 $ —
Equity Securities
Common and Preferred Stock:
U.S. Companies . . . . . . . . . . . . . 58 58 — — 47 47 — —
Non-U.S. Companies . . . . . . . . . 609 606 3 — 110 110 — —
Commingled Funds . . . . . . . . . . . . . 1,323 — 1,323 — 293 19 274 —
Mutual Funds . . . . . . . . . . . . . . . . . — — — — 98 13 85 —
Partnership Interests . . . . . . . . . . . . 219 — 62 157 — — — —
Debt Securities
Corporate Bonds . . . . . . . . . . . . . . . 409 — 409 — 95 12 83 —
Government Bonds . . . . . . . . . . . . . 329 — 328 1 382 364 18 —
Asset Backed Securities . . . . . . . . . 55 — 55 — 3 — 3 —
Commingled Funds . . . . . . . . . . . . . 415 — 415 — 703 8 695 —
Mutual Funds . . . . . . . . . . . . . . . . . 7 — 7 — 50 42 8 —
Alternatives
Commingled Funds . . . . . . . . . . . . . — — — — 128 2 4 122
Real Estate . . . . . . . . . . . . . . . . . . . 36 36 — — 126 — 4 122
Other Investments . . . . . . . . . . . . . . 1 — — 1 20 — 1 19
Total Investments . . . . . . . . . . . 3,512 $751 $2,602 $159 2,104 $651 $1,190 $263
Other . . . . . . . . . . . . . . . . . . . . . . . . . . 11 (13)
Total Plan Assets . . . . . . . . . . . . . . . . $3,523 $2,091
80
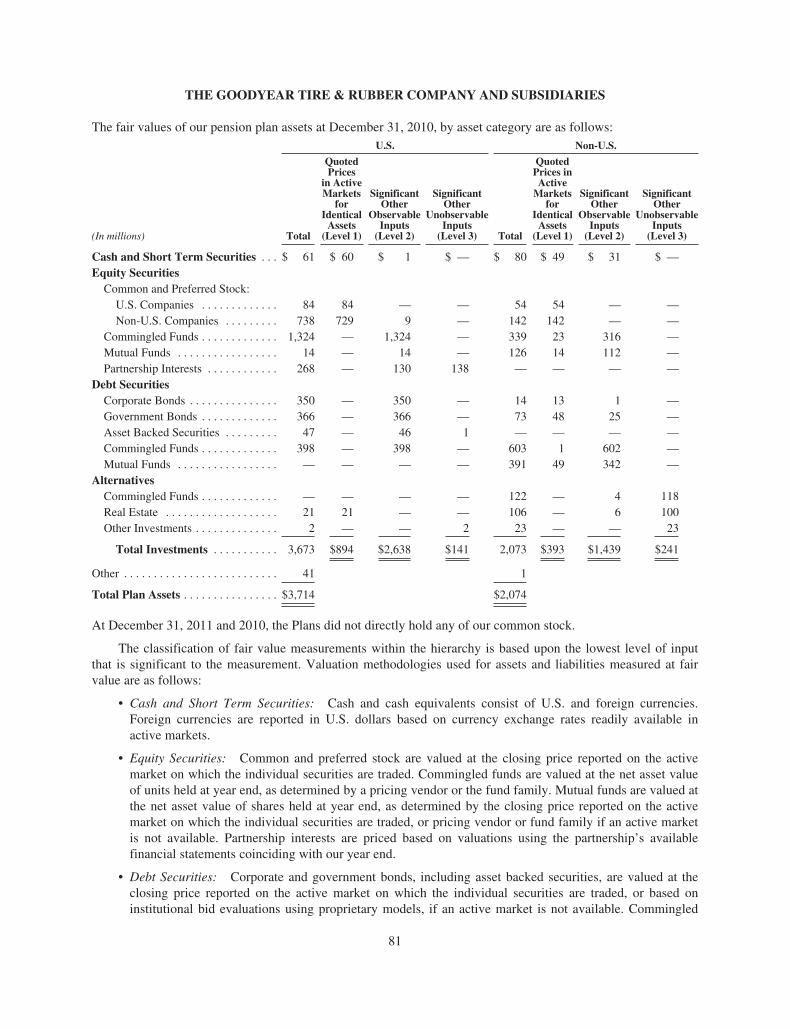
THE GOODYEAR TIRE & RUBBER COMPANY AND SUBSIDIARIES
The fair values of our pension plan assets at December 31, 2010, by asset category are as follows:U.S. Non-U.S.
(In millions) Total
QuotedPrices
in ActiveMarkets
forIdenticalAssets
(Level 1)
SignificantOther
ObservableInputs(Level 2)
SignificantOther
UnobservableInputs(Level 3) Total
QuotedPrices inActiveMarkets
forIdenticalAssets
(Level 1)
SignificantOther
ObservableInputs(Level 2)
SignificantOther
UnobservableInputs(Level 3)
Cash and Short Term Securities . . . $ 61 $ 60 $ 1 $ — $ 80 $ 49 $ 31 $ —Equity Securities
Common and Preferred Stock:U.S. Companies . . . . . . . . . . . . . 84 84 — — 54 54 — —Non-U.S. Companies . . . . . . . . . 738 729 9 — 142 142 — —
Commingled Funds . . . . . . . . . . . . . 1,324 — 1,324 — 339 23 316 —Mutual Funds . . . . . . . . . . . . . . . . . 14 — 14 — 126 14 112 —Partnership Interests . . . . . . . . . . . . 268 — 130 138 — — — —
Debt SecuritiesCorporate Bonds . . . . . . . . . . . . . . . 350 — 350 — 14 13 1 —Government Bonds . . . . . . . . . . . . . 366 — 366 — 73 48 25 —Asset Backed Securities . . . . . . . . . 47 — 46 1 — — — —Commingled Funds . . . . . . . . . . . . . 398 — 398 — 603 1 602 —Mutual Funds . . . . . . . . . . . . . . . . . — — — — 391 49 342 —
AlternativesCommingled Funds . . . . . . . . . . . . . — — — — 122 — 4 118Real Estate . . . . . . . . . . . . . . . . . . . 21 21 — — 106 — 6 100Other Investments . . . . . . . . . . . . . . 2 — — 2 23 — — 23
Total Investments . . . . . . . . . . . 3,673 $894 $2,638 $141 2,073 $393 $1,439 $241
Other . . . . . . . . . . . . . . . . . . . . . . . . . . 41 1
Total Plan Assets . . . . . . . . . . . . . . . . $3,714 $2,074
At December 31, 2011 and 2010, the Plans did not directly hold any of our common stock.
The classification of fair value measurements within the hierarchy is based upon the lowest level of inputthat is significant to the measurement. Valuation methodologies used for assets and liabilities measured at fairvalue are as follows:
• Cash and Short Term Securities: Cash and cash equivalents consist of U.S. and foreign currencies.Foreign currencies are reported in U.S. dollars based on currency exchange rates readily available inactive markets.
• Equity Securities: Common and preferred stock are valued at the closing price reported on the activemarket on which the individual securities are traded. Commingled funds are valued at the net asset valueof units held at year end, as determined by a pricing vendor or the fund family. Mutual funds are valued atthe net asset value of shares held at year end, as determined by the closing price reported on the activemarket on which the individual securities are traded, or pricing vendor or fund family if an active marketis not available. Partnership interests are priced based on valuations using the partnership’s availablefinancial statements coinciding with our year end.
• Debt Securities: Corporate and government bonds, including asset backed securities, are valued at theclosing price reported on the active market on which the individual securities are traded, or based oninstitutional bid evaluations using proprietary models, if an active market is not available. Commingled
81
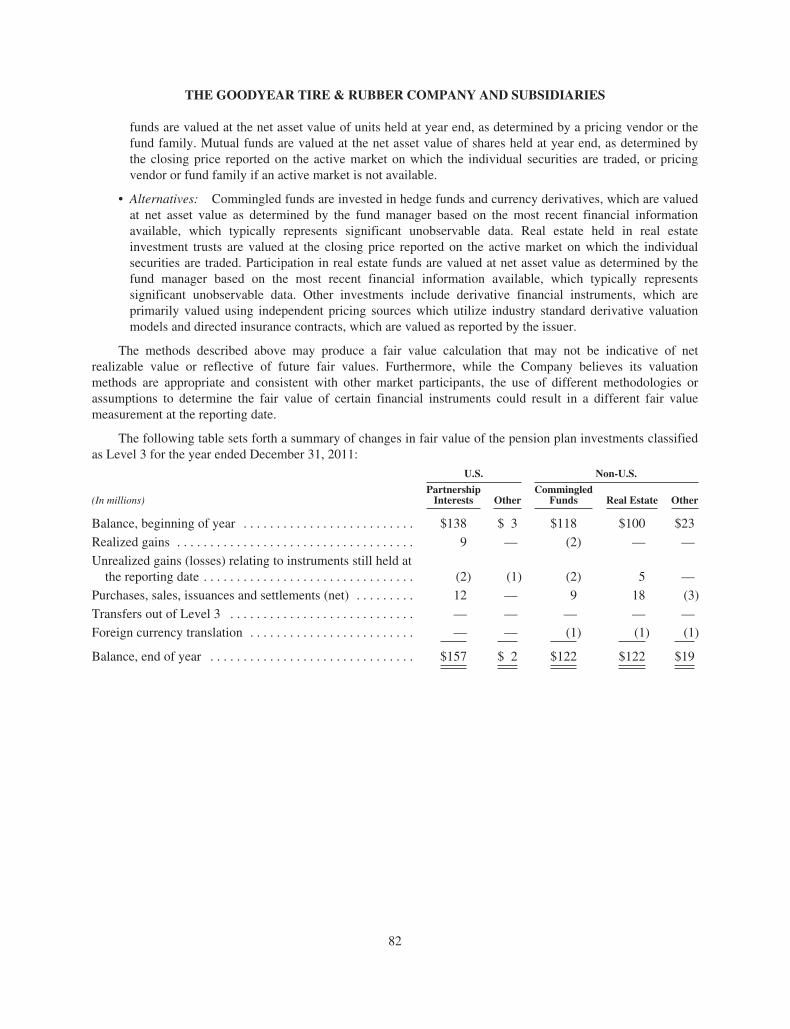
THE GOODYEAR TIRE & RUBBER COMPANY AND SUBSIDIARIES
funds are valued at the net asset value of units held at year end, as determined by a pricing vendor or thefund family. Mutual funds are valued at the net asset value of shares held at year end, as determined bythe closing price reported on the active market on which the individual securities are traded, or pricingvendor or fund family if an active market is not available.
• Alternatives: Commingled funds are invested in hedge funds and currency derivatives, which are valuedat net asset value as determined by the fund manager based on the most recent financial informationavailable, which typically represents significant unobservable data. Real estate held in real estateinvestment trusts are valued at the closing price reported on the active market on which the individualsecurities are traded. Participation in real estate funds are valued at net asset value as determined by thefund manager based on the most recent financial information available, which typically representssignificant unobservable data. Other investments include derivative financial instruments, which areprimarily valued using independent pricing sources which utilize industry standard derivative valuationmodels and directed insurance contracts, which are valued as reported by the issuer.
The methods described above may produce a fair value calculation that may not be indicative of netrealizable value or reflective of future fair values. Furthermore, while the Company believes its valuationmethods are appropriate and consistent with other market participants, the use of different methodologies orassumptions to determine the fair value of certain financial instruments could result in a different fair valuemeasurement at the reporting date.
The following table sets forth a summary of changes in fair value of the pension plan investments classifiedas Level 3 for the year ended December 31, 2011:
U.S. Non-U.S.
(In millions)PartnershipInterests Other
CommingledFunds Real Estate Other
Balance, beginning of year . . . . . . . . . . . . . . . . . . . . . . . . . . $138 $ 3 $118 $100 $23
Realized gains . . . . . . . . . . . . . . . . . . . . . . . . . . . . . . . . . . . . 9 — (2) — —
Unrealized gains (losses) relating to instruments still held atthe reporting date . . . . . . . . . . . . . . . . . . . . . . . . . . . . . . . . (2) (1) (2) 5 —
Purchases, sales, issuances and settlements (net) . . . . . . . . . 12 — 9 18 (3)
Transfers out of Level 3 . . . . . . . . . . . . . . . . . . . . . . . . . . . . — — — — —
Foreign currency translation . . . . . . . . . . . . . . . . . . . . . . . . . — — (1) (1) (1)
Balance, end of year . . . . . . . . . . . . . . . . . . . . . . . . . . . . . . . $157 $ 2 $122 $122 $19
82
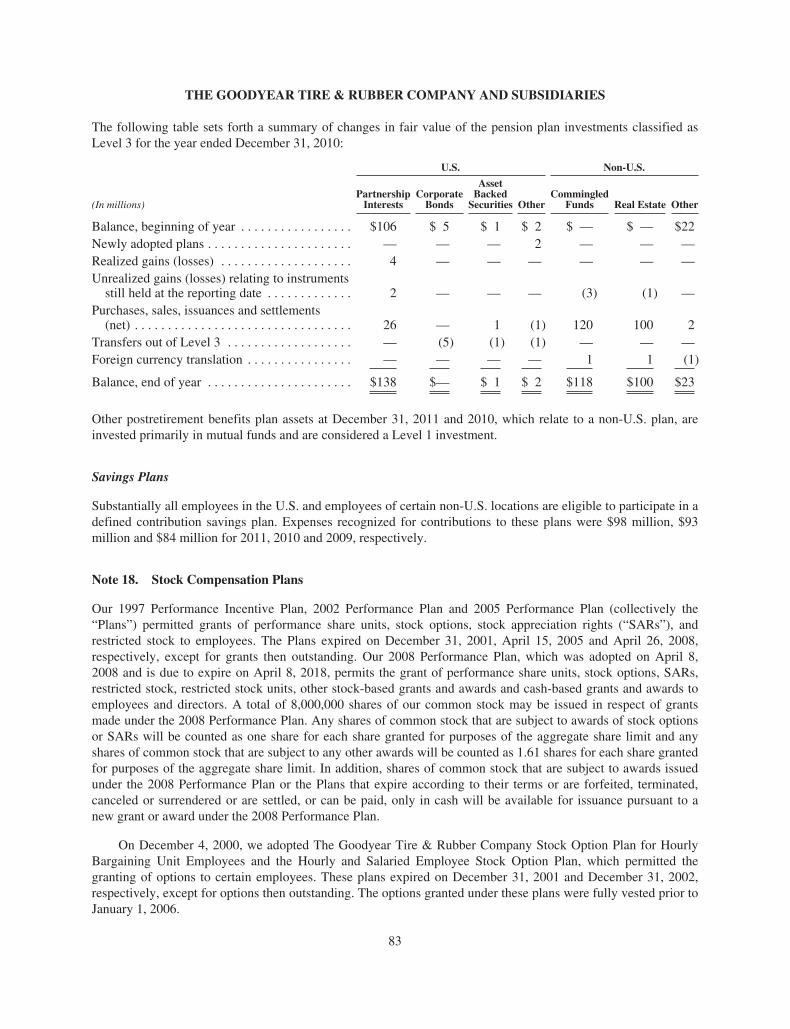
THE GOODYEAR TIRE & RUBBER COMPANY AND SUBSIDIARIES
The following table sets forth a summary of changes in fair value of the pension plan investments classified asLevel 3 for the year ended December 31, 2010:
U.S. Non-U.S.
(In millions)PartnershipInterests
CorporateBonds
AssetBackedSecurities Other
CommingledFunds Real Estate Other
Balance, beginning of year . . . . . . . . . . . . . . . . . $106 $ 5 $ 1 $ 2 $ — $ — $22Newly adopted plans . . . . . . . . . . . . . . . . . . . . . . — — — 2 — — —Realized gains (losses) . . . . . . . . . . . . . . . . . . . . 4 — — — — — —Unrealized gains (losses) relating to instruments
still held at the reporting date . . . . . . . . . . . . . 2 — — — (3) (1) —Purchases, sales, issuances and settlements
(net) . . . . . . . . . . . . . . . . . . . . . . . . . . . . . . . . . 26 — 1 (1) 120 100 2Transfers out of Level 3 . . . . . . . . . . . . . . . . . . . — (5) (1) (1) — — —Foreign currency translation . . . . . . . . . . . . . . . . — — — — 1 1 (1)
Balance, end of year . . . . . . . . . . . . . . . . . . . . . . $138 $— $ 1 $ 2 $118 $100 $23
Other postretirement benefits plan assets at December 31, 2011 and 2010, which relate to a non-U.S. plan, areinvested primarily in mutual funds and are considered a Level 1 investment.
Savings Plans
Substantially all employees in the U.S. and employees of certain non-U.S. locations are eligible to participate in adefined contribution savings plan. Expenses recognized for contributions to these plans were $98 million, $93million and $84 million for 2011, 2010 and 2009, respectively.
Note 18. Stock Compensation Plans
Our 1997 Performance Incentive Plan, 2002 Performance Plan and 2005 Performance Plan (collectively the“Plans”) permitted grants of performance share units, stock options, stock appreciation rights (“SARs”), andrestricted stock to employees. The Plans expired on December 31, 2001, April 15, 2005 and April 26, 2008,respectively, except for grants then outstanding. Our 2008 Performance Plan, which was adopted on April 8,2008 and is due to expire on April 8, 2018, permits the grant of performance share units, stock options, SARs,restricted stock, restricted stock units, other stock-based grants and awards and cash-based grants and awards toemployees and directors. A total of 8,000,000 shares of our common stock may be issued in respect of grantsmade under the 2008 Performance Plan. Any shares of common stock that are subject to awards of stock optionsor SARs will be counted as one share for each share granted for purposes of the aggregate share limit and anyshares of common stock that are subject to any other awards will be counted as 1.61 shares for each share grantedfor purposes of the aggregate share limit. In addition, shares of common stock that are subject to awards issuedunder the 2008 Performance Plan or the Plans that expire according to their terms or are forfeited, terminated,canceled or surrendered or are settled, or can be paid, only in cash will be available for issuance pursuant to anew grant or award under the 2008 Performance Plan.
On December 4, 2000, we adopted The Goodyear Tire & Rubber Company Stock Option Plan for HourlyBargaining Unit Employees and the Hourly and Salaried Employee Stock Option Plan, which permitted thegranting of options to certain employees. These plans expired on December 31, 2001 and December 31, 2002,respectively, except for options then outstanding. The options granted under these plans were fully vested prior toJanuary 1, 2006.
83
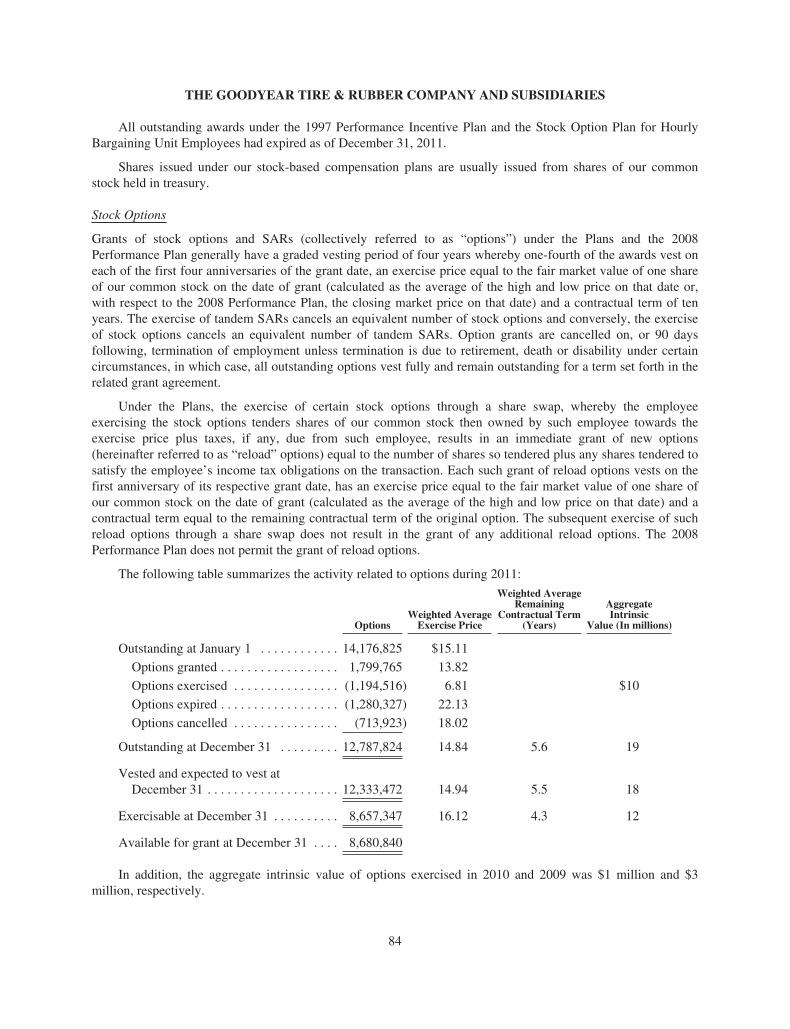
THE GOODYEAR TIRE & RUBBER COMPANY AND SUBSIDIARIES
All outstanding awards under the 1997 Performance Incentive Plan and the Stock Option Plan for HourlyBargaining Unit Employees had expired as of December 31, 2011.
Shares issued under our stock-based compensation plans are usually issued from shares of our commonstock held in treasury.
Stock Options
Grants of stock options and SARs (collectively referred to as “options”) under the Plans and the 2008Performance Plan generally have a graded vesting period of four years whereby one-fourth of the awards vest oneach of the first four anniversaries of the grant date, an exercise price equal to the fair market value of one shareof our common stock on the date of grant (calculated as the average of the high and low price on that date or,with respect to the 2008 Performance Plan, the closing market price on that date) and a contractual term of tenyears. The exercise of tandem SARs cancels an equivalent number of stock options and conversely, the exerciseof stock options cancels an equivalent number of tandem SARs. Option grants are cancelled on, or 90 daysfollowing, termination of employment unless termination is due to retirement, death or disability under certaincircumstances, in which case, all outstanding options vest fully and remain outstanding for a term set forth in therelated grant agreement.
Under the Plans, the exercise of certain stock options through a share swap, whereby the employeeexercising the stock options tenders shares of our common stock then owned by such employee towards theexercise price plus taxes, if any, due from such employee, results in an immediate grant of new options(hereinafter referred to as “reload” options) equal to the number of shares so tendered plus any shares tendered tosatisfy the employee’s income tax obligations on the transaction. Each such grant of reload options vests on thefirst anniversary of its respective grant date, has an exercise price equal to the fair market value of one share ofour common stock on the date of grant (calculated as the average of the high and low price on that date) and acontractual term equal to the remaining contractual term of the original option. The subsequent exercise of suchreload options through a share swap does not result in the grant of any additional reload options. The 2008Performance Plan does not permit the grant of reload options.
The following table summarizes the activity related to options during 2011:
OptionsWeighted AverageExercise Price
Weighted AverageRemaining
Contractual Term(Years)
AggregateIntrinsic
Value (In millions)
Outstanding at January 1 . . . . . . . . . . . . 14,176,825 $15.11
Options granted . . . . . . . . . . . . . . . . . . 1,799,765 13.82
Options exercised . . . . . . . . . . . . . . . . (1,194,516) 6.81 $10
Options expired . . . . . . . . . . . . . . . . . . (1,280,327) 22.13
Options cancelled . . . . . . . . . . . . . . . . (713,923) 18.02
Outstanding at December 31 . . . . . . . . . 12,787,824 14.84 5.6 19
Vested and expected to vest atDecember 31 . . . . . . . . . . . . . . . . . . . . 12,333,472 14.94 5.5 18
Exercisable at December 31 . . . . . . . . . . 8,657,347 16.12 4.3 12
Available for grant at December 31 . . . . 8,680,840
In addition, the aggregate intrinsic value of options exercised in 2010 and 2009 was $1 million and $3million, respectively.
84
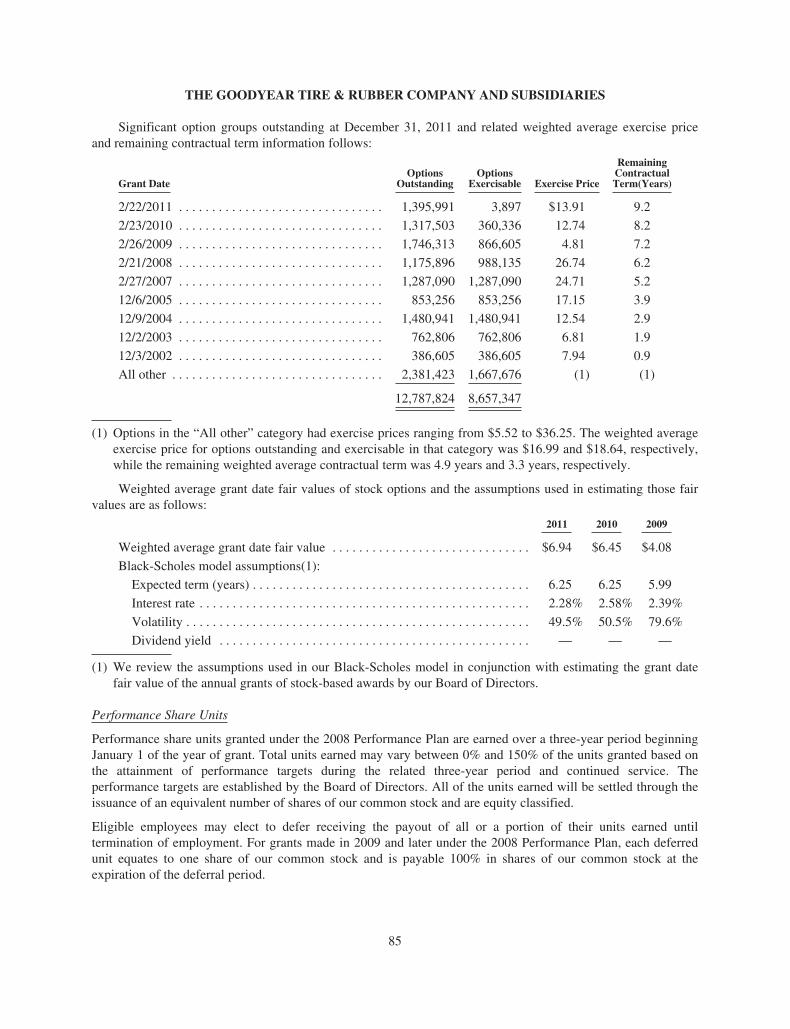
THE GOODYEAR TIRE & RUBBER COMPANY AND SUBSIDIARIES
Significant option groups outstanding at December 31, 2011 and related weighted average exercise priceand remaining contractual term information follows:
Grant DateOptions
OutstandingOptions
Exercisable Exercise Price
RemainingContractualTerm(Years)
2/22/2011 . . . . . . . . . . . . . . . . . . . . . . . . . . . . . . . 1,395,991 3,897 $13.91 9.2
2/23/2010 . . . . . . . . . . . . . . . . . . . . . . . . . . . . . . . 1,317,503 360,336 12.74 8.2
2/26/2009 . . . . . . . . . . . . . . . . . . . . . . . . . . . . . . . 1,746,313 866,605 4.81 7.2
2/21/2008 . . . . . . . . . . . . . . . . . . . . . . . . . . . . . . . 1,175,896 988,135 26.74 6.2
2/27/2007 . . . . . . . . . . . . . . . . . . . . . . . . . . . . . . . 1,287,090 1,287,090 24.71 5.2
12/6/2005 . . . . . . . . . . . . . . . . . . . . . . . . . . . . . . . 853,256 853,256 17.15 3.9
12/9/2004 . . . . . . . . . . . . . . . . . . . . . . . . . . . . . . . 1,480,941 1,480,941 12.54 2.9
12/2/2003 . . . . . . . . . . . . . . . . . . . . . . . . . . . . . . . 762,806 762,806 6.81 1.9
12/3/2002 . . . . . . . . . . . . . . . . . . . . . . . . . . . . . . . 386,605 386,605 7.94 0.9
All other . . . . . . . . . . . . . . . . . . . . . . . . . . . . . . . . 2,381,423 1,667,676 (1) (1)
12,787,824 8,657,347
(1) Options in the “All other” category had exercise prices ranging from $5.52 to $36.25. The weighted averageexercise price for options outstanding and exercisable in that category was $16.99 and $18.64, respectively,while the remaining weighted average contractual term was 4.9 years and 3.3 years, respectively.
Weighted average grant date fair values of stock options and the assumptions used in estimating those fairvalues are as follows:
2011 2010 2009
Weighted average grant date fair value . . . . . . . . . . . . . . . . . . . . . . . . . . . . . . $6.94 $6.45 $4.08
Black-Scholes model assumptions(1):
Expected term (years) . . . . . . . . . . . . . . . . . . . . . . . . . . . . . . . . . . . . . . . . . . 6.25 6.25 5.99
Interest rate . . . . . . . . . . . . . . . . . . . . . . . . . . . . . . . . . . . . . . . . . . . . . . . . . . 2.28% 2.58% 2.39%
Volatility . . . . . . . . . . . . . . . . . . . . . . . . . . . . . . . . . . . . . . . . . . . . . . . . . . . . 49.5% 50.5% 79.6%
Dividend yield . . . . . . . . . . . . . . . . . . . . . . . . . . . . . . . . . . . . . . . . . . . . . . . — — —
(1) We review the assumptions used in our Black-Scholes model in conjunction with estimating the grant datefair value of the annual grants of stock-based awards by our Board of Directors.
Performance Share Units
Performance share units granted under the 2008 Performance Plan are earned over a three-year period beginningJanuary 1 of the year of grant. Total units earned may vary between 0% and 150% of the units granted based onthe attainment of performance targets during the related three-year period and continued service. Theperformance targets are established by the Board of Directors. All of the units earned will be settled through theissuance of an equivalent number of shares of our common stock and are equity classified.
Eligible employees may elect to defer receiving the payout of all or a portion of their units earned untiltermination of employment. For grants made in 2009 and later under the 2008 Performance Plan, each deferredunit equates to one share of our common stock and is payable 100% in shares of our common stock at theexpiration of the deferral period.
85

THE GOODYEAR TIRE & RUBBER COMPANY AND SUBSIDIARIES
The following table summarizes the activity related to performance share units during 2011:Number of Shares
Unvested at January 1 . . . . . . . . . . . . . . . . . . . . . . . . . . . . . . . . . . . . . . . . . . . . . . . . . . . . . . . . . . . 302,240
Granted . . . . . . . . . . . . . . . . . . . . . . . . . . . . . . . . . . . . . . . . . . . . . . . . . . . . . . . . . . . . . . . . . . . . . . 161,876
Vested . . . . . . . . . . . . . . . . . . . . . . . . . . . . . . . . . . . . . . . . . . . . . . . . . . . . . . . . . . . . . . . . . . . . . . . (163,593)
Forfeited . . . . . . . . . . . . . . . . . . . . . . . . . . . . . . . . . . . . . . . . . . . . . . . . . . . . . . . . . . . . . . . . . . . . . (5,063)
Unvested at December 31 . . . . . . . . . . . . . . . . . . . . . . . . . . . . . . . . . . . . . . . . . . . . . . . . . . . . . . . . 295,460
We measure the fair value of grants of performance share units based primarily on the closing market price of ashare of our common stock on the date of the grant, modified as appropriate to take into account the features ofsuch grants. The weighted average fair value per share was $15.58, $12.58, and $5.33 for performance shareunits granted in 2011, 2010 and 2009, respectively.
Other Information
Stock-based compensation expense, cash payments made to settle SARs and performance share units, and cashreceived from the exercise of stock options follows:
(In millions) 2011 2010 2009
Stock-based compensation expense recognized . . . . . . . . . . . . . . . . . . . . . . . . . . . . . $18 $26 $29
Tax impact . . . . . . . . . . . . . . . . . . . . . . . . . . . . . . . . . . . . . . . . . . . . . . . . . . . . . . . . . . — — (2)
After-tax stock-based compensation expense . . . . . . . . . . . . . . . . . . . . . . . . . . . . . . . $18 $26 $27
Cash payments to settle SARs and performance share units . . . . . . . . . . . . . . . . . . . . $— $— $—
Cash received from stock option exercises . . . . . . . . . . . . . . . . . . . . . . . . . . . . . . . . . 8 1 2
As of December 31, 2011, unearned compensation cost related to the unvested portion of all stock-based awardswas approximately $27 million and is expected to be recognized over the remaining vesting period of therespective grants, through December 31, 2015.
Note 19. Commitments and Contingent Liabilities
Environmental Matters
We have recorded liabilities totaling $46 million and $44 million at December 31, 2011 and December 31, 2010,respectively, for anticipated costs related to various environmental matters, primarily the remediation ofnumerous waste disposal sites and certain properties sold by us. Of these amounts, $11 million and $12 millionwere included in Other Current Liabilities at December 31, 2011 and December 31, 2010, respectively. The costsinclude legal and consulting fees, site studies, the design and implementation of remediation plans, post-remediation monitoring and related activities, and will be paid over several years. The amount of our ultimateliability in respect of these matters may be affected by several uncertainties, primarily the ultimate cost ofrequired remediation and the extent to which other responsible parties contribute. We have limited potentialinsurance coverage for future environmental claims.
Workers’ Compensation
We have recorded liabilities, on a discounted basis, totaling $302 million and $291 million for anticipated costsrelated to workers’ compensation at December 31, 2011 and December 31, 2010, respectively. Of these amounts,$63 million and $71 million were included in Current Liabilities as part of Compensation and Benefits atDecember 31, 2011 and December 31, 2010, respectively. The costs include an estimate of expected settlementson pending claims, defense costs and a provision for claims incurred but not reported. These estimates are based
86
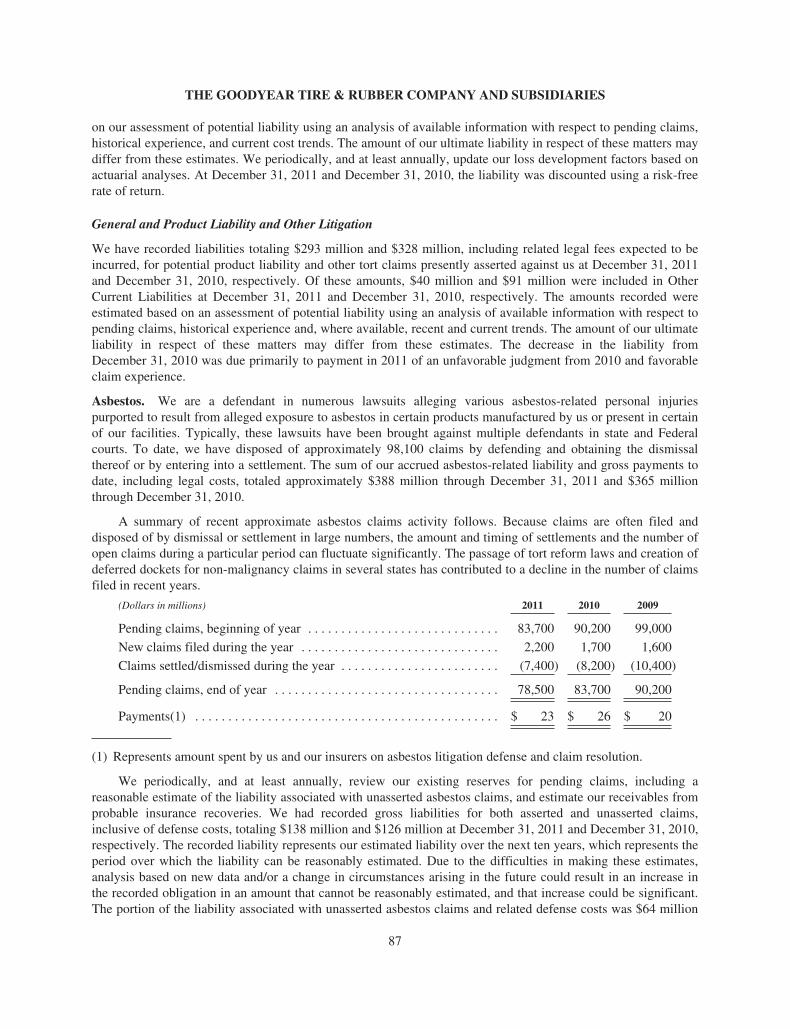
THE GOODYEAR TIRE & RUBBER COMPANY AND SUBSIDIARIES
on our assessment of potential liability using an analysis of available information with respect to pending claims,historical experience, and current cost trends. The amount of our ultimate liability in respect of these matters maydiffer from these estimates. We periodically, and at least annually, update our loss development factors based onactuarial analyses. At December 31, 2011 and December 31, 2010, the liability was discounted using a risk-freerate of return.
General and Product Liability and Other Litigation
We have recorded liabilities totaling $293 million and $328 million, including related legal fees expected to beincurred, for potential product liability and other tort claims presently asserted against us at December 31, 2011and December 31, 2010, respectively. Of these amounts, $40 million and $91 million were included in OtherCurrent Liabilities at December 31, 2011 and December 31, 2010, respectively. The amounts recorded wereestimated based on an assessment of potential liability using an analysis of available information with respect topending claims, historical experience and, where available, recent and current trends. The amount of our ultimateliability in respect of these matters may differ from these estimates. The decrease in the liability fromDecember 31, 2010 was due primarily to payment in 2011 of an unfavorable judgment from 2010 and favorableclaim experience.
Asbestos. We are a defendant in numerous lawsuits alleging various asbestos-related personal injuriespurported to result from alleged exposure to asbestos in certain products manufactured by us or present in certainof our facilities. Typically, these lawsuits have been brought against multiple defendants in state and Federalcourts. To date, we have disposed of approximately 98,100 claims by defending and obtaining the dismissalthereof or by entering into a settlement. The sum of our accrued asbestos-related liability and gross payments todate, including legal costs, totaled approximately $388 million through December 31, 2011 and $365 millionthrough December 31, 2010.
A summary of recent approximate asbestos claims activity follows. Because claims are often filed anddisposed of by dismissal or settlement in large numbers, the amount and timing of settlements and the number ofopen claims during a particular period can fluctuate significantly. The passage of tort reform laws and creation ofdeferred dockets for non-malignancy claims in several states has contributed to a decline in the number of claimsfiled in recent years.
(Dollars in millions) 2011 2010 2009
Pending claims, beginning of year . . . . . . . . . . . . . . . . . . . . . . . . . . . . . 83,700 90,200 99,000
New claims filed during the year . . . . . . . . . . . . . . . . . . . . . . . . . . . . . . 2,200 1,700 1,600
Claims settled/dismissed during the year . . . . . . . . . . . . . . . . . . . . . . . . (7,400) (8,200) (10,400)
Pending claims, end of year . . . . . . . . . . . . . . . . . . . . . . . . . . . . . . . . . . 78,500 83,700 90,200
Payments(1) . . . . . . . . . . . . . . . . . . . . . . . . . . . . . . . . . . . . . . . . . . . . . . $ 23 $ 26 $ 20
(1) Represents amount spent by us and our insurers on asbestos litigation defense and claim resolution.
We periodically, and at least annually, review our existing reserves for pending claims, including areasonable estimate of the liability associated with unasserted asbestos claims, and estimate our receivables fromprobable insurance recoveries. We had recorded gross liabilities for both asserted and unasserted claims,inclusive of defense costs, totaling $138 million and $126 million at December 31, 2011 and December 31, 2010,respectively. The recorded liability represents our estimated liability over the next ten years, which represents theperiod over which the liability can be reasonably estimated. Due to the difficulties in making these estimates,analysis based on new data and/or a change in circumstances arising in the future could result in an increase inthe recorded obligation in an amount that cannot be reasonably estimated, and that increase could be significant.The portion of the liability associated with unasserted asbestos claims and related defense costs was $64 million
87
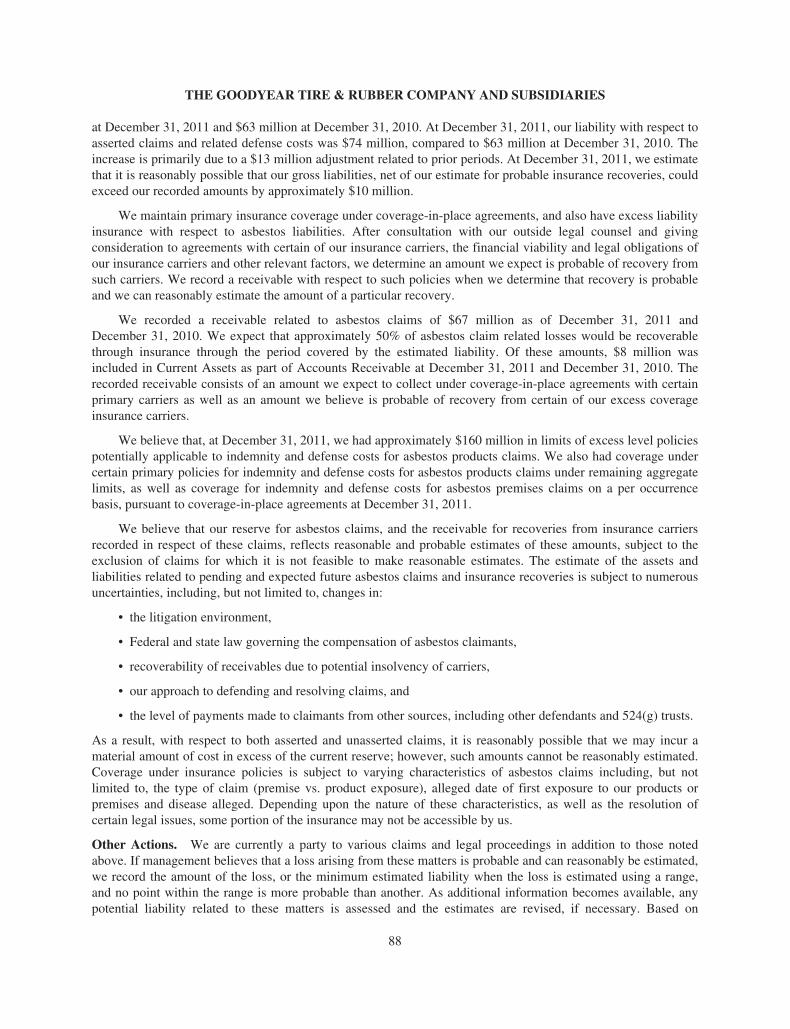
THE GOODYEAR TIRE & RUBBER COMPANY AND SUBSIDIARIES
at December 31, 2011 and $63 million at December 31, 2010. At December 31, 2011, our liability with respect toasserted claims and related defense costs was $74 million, compared to $63 million at December 31, 2010. Theincrease is primarily due to a $13 million adjustment related to prior periods. At December 31, 2011, we estimatethat it is reasonably possible that our gross liabilities, net of our estimate for probable insurance recoveries, couldexceed our recorded amounts by approximately $10 million.
We maintain primary insurance coverage under coverage-in-place agreements, and also have excess liabilityinsurance with respect to asbestos liabilities. After consultation with our outside legal counsel and givingconsideration to agreements with certain of our insurance carriers, the financial viability and legal obligations ofour insurance carriers and other relevant factors, we determine an amount we expect is probable of recovery fromsuch carriers. We record a receivable with respect to such policies when we determine that recovery is probableand we can reasonably estimate the amount of a particular recovery.
We recorded a receivable related to asbestos claims of $67 million as of December 31, 2011 andDecember 31, 2010. We expect that approximately 50% of asbestos claim related losses would be recoverablethrough insurance through the period covered by the estimated liability. Of these amounts, $8 million wasincluded in Current Assets as part of Accounts Receivable at December 31, 2011 and December 31, 2010. Therecorded receivable consists of an amount we expect to collect under coverage-in-place agreements with certainprimary carriers as well as an amount we believe is probable of recovery from certain of our excess coverageinsurance carriers.
We believe that, at December 31, 2011, we had approximately $160 million in limits of excess level policiespotentially applicable to indemnity and defense costs for asbestos products claims. We also had coverage undercertain primary policies for indemnity and defense costs for asbestos products claims under remaining aggregatelimits, as well as coverage for indemnity and defense costs for asbestos premises claims on a per occurrencebasis, pursuant to coverage-in-place agreements at December 31, 2011.
We believe that our reserve for asbestos claims, and the receivable for recoveries from insurance carriersrecorded in respect of these claims, reflects reasonable and probable estimates of these amounts, subject to theexclusion of claims for which it is not feasible to make reasonable estimates. The estimate of the assets andliabilities related to pending and expected future asbestos claims and insurance recoveries is subject to numerousuncertainties, including, but not limited to, changes in:
• the litigation environment,
• Federal and state law governing the compensation of asbestos claimants,
• recoverability of receivables due to potential insolvency of carriers,
• our approach to defending and resolving claims, and
• the level of payments made to claimants from other sources, including other defendants and 524(g) trusts.
As a result, with respect to both asserted and unasserted claims, it is reasonably possible that we may incur amaterial amount of cost in excess of the current reserve; however, such amounts cannot be reasonably estimated.Coverage under insurance policies is subject to varying characteristics of asbestos claims including, but notlimited to, the type of claim (premise vs. product exposure), alleged date of first exposure to our products orpremises and disease alleged. Depending upon the nature of these characteristics, as well as the resolution ofcertain legal issues, some portion of the insurance may not be accessible by us.
Other Actions. We are currently a party to various claims and legal proceedings in addition to those notedabove. If management believes that a loss arising from these matters is probable and can reasonably be estimated,we record the amount of the loss, or the minimum estimated liability when the loss is estimated using a range,and no point within the range is more probable than another. As additional information becomes available, anypotential liability related to these matters is assessed and the estimates are revised, if necessary. Based on
88
THE GOODYEAR TIRE & RUBBER COMPANY AND SUBSIDIARIES
currently available information, management believes that the ultimate outcome of these matters, individuallyand in the aggregate, will not have a material adverse effect on our financial position or overall trends in resultsof operations. However, litigation is subject to inherent uncertainties, and unfavorable rulings could occur. Anunfavorable ruling could include monetary damages or an injunction prohibiting us from selling one or moreproducts. If an unfavorable ruling were to occur, there exists the possibility of a material adverse impact on thefinancial position and results of operations of the period in which the ruling occurs, or in future periods.
Income Tax and Other Tax Matters
The calculation of our tax liabilities involves dealing with uncertainties in the application of complex taxregulations. We recognize liabilities for anticipated tax audit issues based on our estimate of whether, and theextent to which, additional taxes will be due. If we ultimately determine that payment of these amounts isunnecessary, we reverse the liability and recognize a tax benefit during the period in which we determine that theliability is no longer necessary. We also recognize tax benefits to the extent that it is more likely than not that ourpositions will be sustained when challenged by the taxing authorities. We derecognize tax benefits when basedon new information we determine that it is no longer more likely than not that our position will be sustained. Tothe extent we prevail in matters for which liabilities have been established, or determine we need to derecognizetax benefits recorded in prior periods, or we are required to pay amounts in excess of our liabilities, our effectivetax rate in a given period could be materially affected. An unfavorable tax settlement would require use of ourcash, and result in an increase in our effective tax rate in the period of resolution. A favorable tax settlementwould be recognized as a reduction in our effective tax rate in the period of resolution.
In September 2011, the State of Sao Paulo, Brazil issued an assessment to us for allegedly improperly takingtax credits for value-added taxes paid to a supplier of natural rubber during the period from January 2006 toAugust 2008. The assessment, including interest and penalties, totals 92 million Brazilian real (approximately$50 million). We received similar assessments from the State of Sao Paulo, Brazil in December 2010 forallegedly improperly taking tax credits for value-added taxes paid to other suppliers of natural rubber during theperiod from January 2006 to October 2009. These assessments, including interest and penalties, totaled88 million Brazilian real (approximately $47 million). We have filed responses contesting all of the assessmentsand are defending these matters. In the event we are unsuccessful in defending one or more of these assessments,our results of operations could be materially affected.
Binding Commitments and Guarantees
At December 31, 2011, we had binding commitments for raw materials, capital expenditures, utilities, andvarious other types of contracts. Total commitments on contracts that extend beyond 2012 are expected to totalapproximately $2.7 billion. In addition, we have other contractual commitments, the amounts of which cannot beestimated, pursuant to certain long term agreements under which we will purchase varying amounts of certainraw materials and finished goods at agreed upon base prices that may be subject to periodic adjustments forchanges in raw material costs and market price adjustments, or in quantities that may be subject to periodicadjustments for changes in our or our suppliers’ production levels.
We have off-balance sheet financial guarantees written and other commitments totaling approximately $105million at December 31, 2011, compared to $26 million at December 31, 2010. The increase primarily relates toour obligations in connection with the financing of the construction of our new Global and North American TireHeadquarters facility. In addition, we will from time to time issue guarantees to financial institutions or otherentities on behalf of certain of our affiliates, lessors or customers. Normally there is no separate premiumreceived by us as consideration for the issuance of guarantees. We also generally do not require collateral inconnection with the issuance of these guarantees. If our performance under these guarantees is triggered bynon-payment or another specified event, we would be obligated to make payment to the financial institution orthe other entity, and would typically have recourse to the affiliate, lessor or customer. The guarantees expire atvarious times through 2023. We are unable to estimate the extent to which our affiliates’, lessors’ or customers’assets would be adequate to recover any payments made by us under the related guarantees.
89
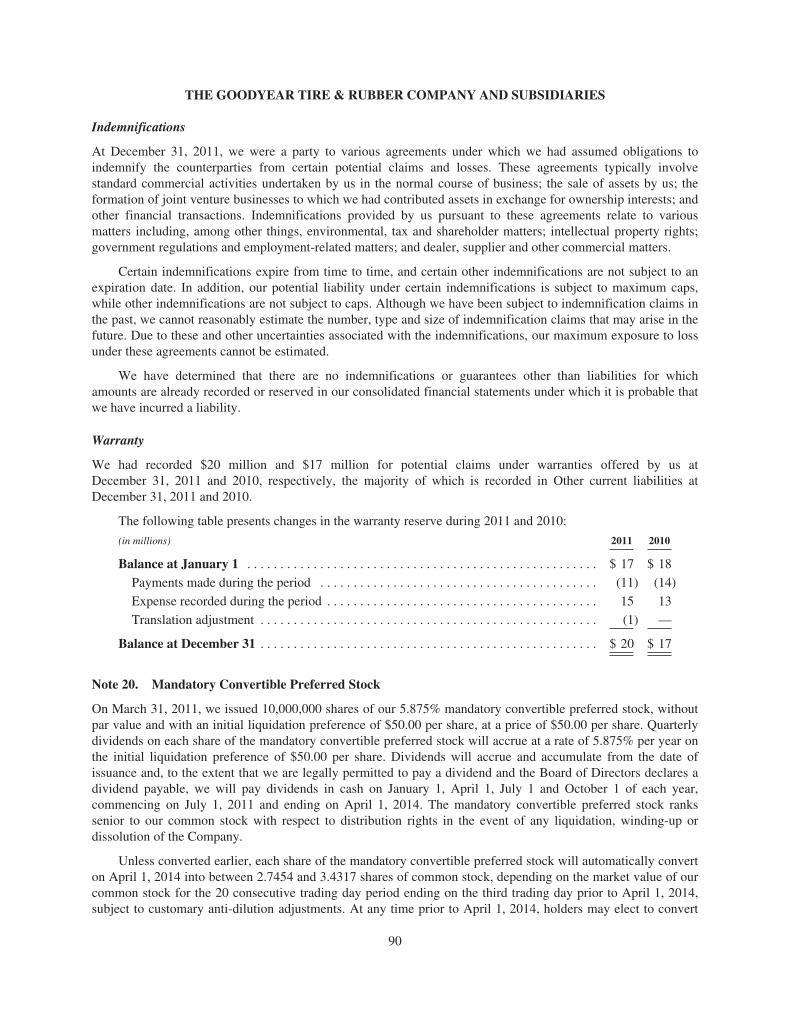
THE GOODYEAR TIRE & RUBBER COMPANY AND SUBSIDIARIES
Indemnifications
At December 31, 2011, we were a party to various agreements under which we had assumed obligations toindemnify the counterparties from certain potential claims and losses. These agreements typically involvestandard commercial activities undertaken by us in the normal course of business; the sale of assets by us; theformation of joint venture businesses to which we had contributed assets in exchange for ownership interests; andother financial transactions. Indemnifications provided by us pursuant to these agreements relate to variousmatters including, among other things, environmental, tax and shareholder matters; intellectual property rights;government regulations and employment-related matters; and dealer, supplier and other commercial matters.
Certain indemnifications expire from time to time, and certain other indemnifications are not subject to anexpiration date. In addition, our potential liability under certain indemnifications is subject to maximum caps,while other indemnifications are not subject to caps. Although we have been subject to indemnification claims inthe past, we cannot reasonably estimate the number, type and size of indemnification claims that may arise in thefuture. Due to these and other uncertainties associated with the indemnifications, our maximum exposure to lossunder these agreements cannot be estimated.
We have determined that there are no indemnifications or guarantees other than liabilities for whichamounts are already recorded or reserved in our consolidated financial statements under which it is probable thatwe have incurred a liability.
Warranty
We had recorded $20 million and $17 million for potential claims under warranties offered by us atDecember 31, 2011 and 2010, respectively, the majority of which is recorded in Other current liabilities atDecember 31, 2011 and 2010.
The following table presents changes in the warranty reserve during 2011 and 2010:
(in millions) 2011 2010
Balance at January 1 . . . . . . . . . . . . . . . . . . . . . . . . . . . . . . . . . . . . . . . . . . . . . . . . . . . . . $ 17 $ 18
Payments made during the period . . . . . . . . . . . . . . . . . . . . . . . . . . . . . . . . . . . . . . . . . . (11) (14)
Expense recorded during the period . . . . . . . . . . . . . . . . . . . . . . . . . . . . . . . . . . . . . . . . . 15 13
Translation adjustment . . . . . . . . . . . . . . . . . . . . . . . . . . . . . . . . . . . . . . . . . . . . . . . . . . . (1) —
Balance at December 31 . . . . . . . . . . . . . . . . . . . . . . . . . . . . . . . . . . . . . . . . . . . . . . . . . . . $ 20 $ 17
Note 20. Mandatory Convertible Preferred Stock
On March 31, 2011, we issued 10,000,000 shares of our 5.875% mandatory convertible preferred stock, withoutpar value and with an initial liquidation preference of $50.00 per share, at a price of $50.00 per share. Quarterlydividends on each share of the mandatory convertible preferred stock will accrue at a rate of 5.875% per year onthe initial liquidation preference of $50.00 per share. Dividends will accrue and accumulate from the date ofissuance and, to the extent that we are legally permitted to pay a dividend and the Board of Directors declares adividend payable, we will pay dividends in cash on January 1, April 1, July 1 and October 1 of each year,commencing on July 1, 2011 and ending on April 1, 2014. The mandatory convertible preferred stock rankssenior to our common stock with respect to distribution rights in the event of any liquidation, winding-up ordissolution of the Company.
Unless converted earlier, each share of the mandatory convertible preferred stock will automatically converton April 1, 2014 into between 2.7454 and 3.4317 shares of common stock, depending on the market value of ourcommon stock for the 20 consecutive trading day period ending on the third trading day prior to April 1, 2014,subject to customary anti-dilution adjustments. At any time prior to April 1, 2014, holders may elect to convert
90
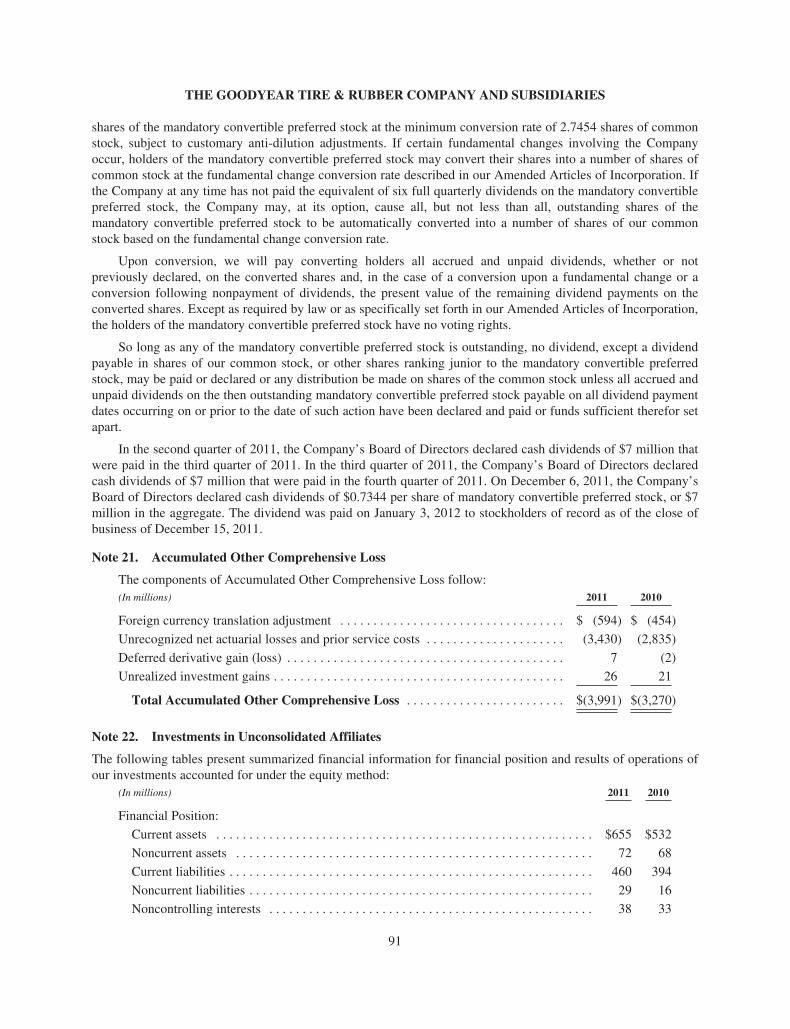
THE GOODYEAR TIRE & RUBBER COMPANY AND SUBSIDIARIES
shares of the mandatory convertible preferred stock at the minimum conversion rate of 2.7454 shares of commonstock, subject to customary anti-dilution adjustments. If certain fundamental changes involving the Companyoccur, holders of the mandatory convertible preferred stock may convert their shares into a number of shares ofcommon stock at the fundamental change conversion rate described in our Amended Articles of Incorporation. Ifthe Company at any time has not paid the equivalent of six full quarterly dividends on the mandatory convertiblepreferred stock, the Company may, at its option, cause all, but not less than all, outstanding shares of themandatory convertible preferred stock to be automatically converted into a number of shares of our commonstock based on the fundamental change conversion rate.
Upon conversion, we will pay converting holders all accrued and unpaid dividends, whether or notpreviously declared, on the converted shares and, in the case of a conversion upon a fundamental change or aconversion following nonpayment of dividends, the present value of the remaining dividend payments on theconverted shares. Except as required by law or as specifically set forth in our Amended Articles of Incorporation,the holders of the mandatory convertible preferred stock have no voting rights.
So long as any of the mandatory convertible preferred stock is outstanding, no dividend, except a dividendpayable in shares of our common stock, or other shares ranking junior to the mandatory convertible preferredstock, may be paid or declared or any distribution be made on shares of the common stock unless all accrued andunpaid dividends on the then outstanding mandatory convertible preferred stock payable on all dividend paymentdates occurring on or prior to the date of such action have been declared and paid or funds sufficient therefor setapart.
In the second quarter of 2011, the Company’s Board of Directors declared cash dividends of $7 million thatwere paid in the third quarter of 2011. In the third quarter of 2011, the Company’s Board of Directors declaredcash dividends of $7 million that were paid in the fourth quarter of 2011. On December 6, 2011, the Company’sBoard of Directors declared cash dividends of $0.7344 per share of mandatory convertible preferred stock, or $7million in the aggregate. The dividend was paid on January 3, 2012 to stockholders of record as of the close ofbusiness of December 15, 2011.
Note 21. Accumulated Other Comprehensive Loss
The components of Accumulated Other Comprehensive Loss follow:(In millions) 2011 2010
Foreign currency translation adjustment . . . . . . . . . . . . . . . . . . . . . . . . . . . . . . . . . . $ (594) $ (454)
Unrecognized net actuarial losses and prior service costs . . . . . . . . . . . . . . . . . . . . . (3,430) (2,835)
Deferred derivative gain (loss) . . . . . . . . . . . . . . . . . . . . . . . . . . . . . . . . . . . . . . . . . . 7 (2)
Unrealized investment gains . . . . . . . . . . . . . . . . . . . . . . . . . . . . . . . . . . . . . . . . . . . . 26 21
Total Accumulated Other Comprehensive Loss . . . . . . . . . . . . . . . . . . . . . . . . $(3,991) $(3,270)
Note 22. Investments in Unconsolidated Affiliates
The following tables present summarized financial information for financial position and results of operations ofour investments accounted for under the equity method:
(In millions) 2011 2010
Financial Position:
Current assets . . . . . . . . . . . . . . . . . . . . . . . . . . . . . . . . . . . . . . . . . . . . . . . . . . . . . . . . . $655 $532
Noncurrent assets . . . . . . . . . . . . . . . . . . . . . . . . . . . . . . . . . . . . . . . . . . . . . . . . . . . . . . 72 68
Current liabilities . . . . . . . . . . . . . . . . . . . . . . . . . . . . . . . . . . . . . . . . . . . . . . . . . . . . . . . 460 394
Noncurrent liabilities . . . . . . . . . . . . . . . . . . . . . . . . . . . . . . . . . . . . . . . . . . . . . . . . . . . . 29 16
Noncontrolling interests . . . . . . . . . . . . . . . . . . . . . . . . . . . . . . . . . . . . . . . . . . . . . . . . . 38 33
91
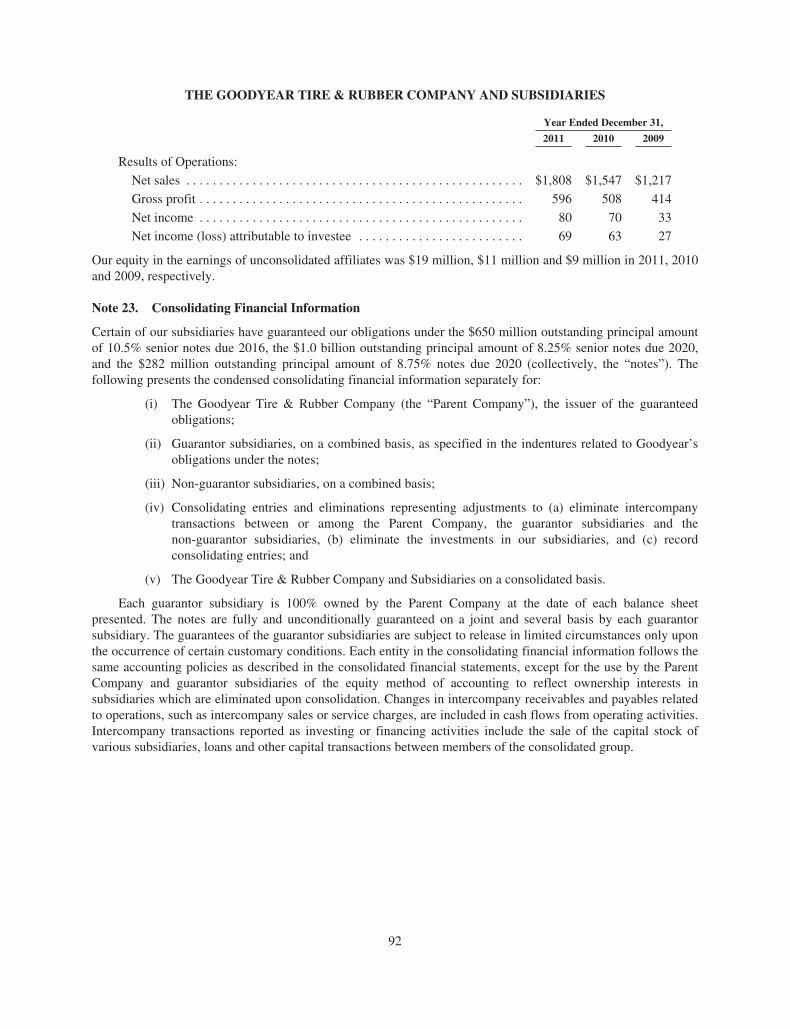
THE GOODYEAR TIRE & RUBBER COMPANY AND SUBSIDIARIES
Year Ended December 31,
2011 2010 2009
Results of Operations:
Net sales . . . . . . . . . . . . . . . . . . . . . . . . . . . . . . . . . . . . . . . . . . . . . . . . . . . $1,808 $1,547 $1,217
Gross profit . . . . . . . . . . . . . . . . . . . . . . . . . . . . . . . . . . . . . . . . . . . . . . . . . 596 508 414
Net income . . . . . . . . . . . . . . . . . . . . . . . . . . . . . . . . . . . . . . . . . . . . . . . . . 80 70 33
Net income (loss) attributable to investee . . . . . . . . . . . . . . . . . . . . . . . . . 69 63 27
Our equity in the earnings of unconsolidated affiliates was $19 million, $11 million and $9 million in 2011, 2010and 2009, respectively.
Note 23. Consolidating Financial Information
Certain of our subsidiaries have guaranteed our obligations under the $650 million outstanding principal amountof 10.5% senior notes due 2016, the $1.0 billion outstanding principal amount of 8.25% senior notes due 2020,and the $282 million outstanding principal amount of 8.75% notes due 2020 (collectively, the “notes”). Thefollowing presents the condensed consolidating financial information separately for:
(i) The Goodyear Tire & Rubber Company (the “Parent Company”), the issuer of the guaranteedobligations;
(ii) Guarantor subsidiaries, on a combined basis, as specified in the indentures related to Goodyear’sobligations under the notes;
(iii) Non-guarantor subsidiaries, on a combined basis;
(iv) Consolidating entries and eliminations representing adjustments to (a) eliminate intercompanytransactions between or among the Parent Company, the guarantor subsidiaries and thenon-guarantor subsidiaries, (b) eliminate the investments in our subsidiaries, and (c) recordconsolidating entries; and
(v) The Goodyear Tire & Rubber Company and Subsidiaries on a consolidated basis.
Each guarantor subsidiary is 100% owned by the Parent Company at the date of each balance sheetpresented. The notes are fully and unconditionally guaranteed on a joint and several basis by each guarantorsubsidiary. The guarantees of the guarantor subsidiaries are subject to release in limited circumstances only uponthe occurrence of certain customary conditions. Each entity in the consolidating financial information follows thesame accounting policies as described in the consolidated financial statements, except for the use by the ParentCompany and guarantor subsidiaries of the equity method of accounting to reflect ownership interests insubsidiaries which are eliminated upon consolidation. Changes in intercompany receivables and payables relatedto operations, such as intercompany sales or service charges, are included in cash flows from operating activities.Intercompany transactions reported as investing or financing activities include the sale of the capital stock ofvarious subsidiaries, loans and other capital transactions between members of the consolidated group.
92
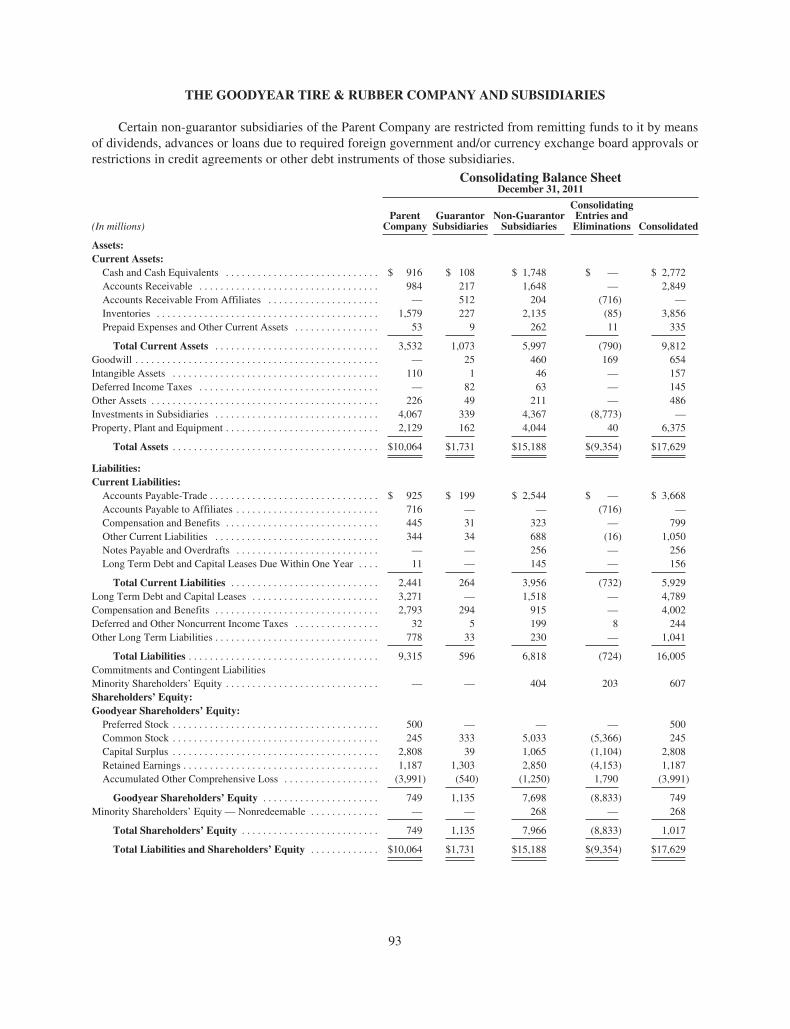
THE GOODYEAR TIRE & RUBBER COMPANY AND SUBSIDIARIES
Certain non-guarantor subsidiaries of the Parent Company are restricted from remitting funds to it by meansof dividends, advances or loans due to required foreign government and/or currency exchange board approvals orrestrictions in credit agreements or other debt instruments of those subsidiaries.
Consolidating Balance SheetDecember 31, 2011
(In millions)Parent
CompanyGuarantorSubsidiaries
Non-GuarantorSubsidiaries
ConsolidatingEntries andEliminations Consolidated
Assets:Current Assets:
Cash and Cash Equivalents . . . . . . . . . . . . . . . . . . . . . . . . . . . . . $ 916 $ 108 $ 1,748 $ — $ 2,772Accounts Receivable . . . . . . . . . . . . . . . . . . . . . . . . . . . . . . . . . . 984 217 1,648 — 2,849Accounts Receivable From Affiliates . . . . . . . . . . . . . . . . . . . . . — 512 204 (716) —Inventories . . . . . . . . . . . . . . . . . . . . . . . . . . . . . . . . . . . . . . . . . . 1,579 227 2,135 (85) 3,856Prepaid Expenses and Other Current Assets . . . . . . . . . . . . . . . . 53 9 262 11 335
Total Current Assets . . . . . . . . . . . . . . . . . . . . . . . . . . . . . . . 3,532 1,073 5,997 (790) 9,812Goodwill . . . . . . . . . . . . . . . . . . . . . . . . . . . . . . . . . . . . . . . . . . . . . . — 25 460 169 654Intangible Assets . . . . . . . . . . . . . . . . . . . . . . . . . . . . . . . . . . . . . . . 110 1 46 — 157Deferred Income Taxes . . . . . . . . . . . . . . . . . . . . . . . . . . . . . . . . . . — 82 63 — 145Other Assets . . . . . . . . . . . . . . . . . . . . . . . . . . . . . . . . . . . . . . . . . . . 226 49 211 — 486Investments in Subsidiaries . . . . . . . . . . . . . . . . . . . . . . . . . . . . . . . 4,067 339 4,367 (8,773) —Property, Plant and Equipment . . . . . . . . . . . . . . . . . . . . . . . . . . . . . 2,129 162 4,044 40 6,375
Total Assets . . . . . . . . . . . . . . . . . . . . . . . . . . . . . . . . . . . . . . . $10,064 $1,731 $15,188 $(9,354) $17,629
Liabilities:Current Liabilities:
Accounts Payable-Trade . . . . . . . . . . . . . . . . . . . . . . . . . . . . . . . . $ 925 $ 199 $ 2,544 $ — $ 3,668Accounts Payable to Affiliates . . . . . . . . . . . . . . . . . . . . . . . . . . . 716 — — (716) —Compensation and Benefits . . . . . . . . . . . . . . . . . . . . . . . . . . . . . 445 31 323 — 799Other Current Liabilities . . . . . . . . . . . . . . . . . . . . . . . . . . . . . . . 344 34 688 (16) 1,050Notes Payable and Overdrafts . . . . . . . . . . . . . . . . . . . . . . . . . . . — — 256 — 256Long Term Debt and Capital Leases Due Within One Year . . . . 11 — 145 — 156
Total Current Liabilities . . . . . . . . . . . . . . . . . . . . . . . . . . . . 2,441 264 3,956 (732) 5,929Long Term Debt and Capital Leases . . . . . . . . . . . . . . . . . . . . . . . . 3,271 — 1,518 — 4,789Compensation and Benefits . . . . . . . . . . . . . . . . . . . . . . . . . . . . . . . 2,793 294 915 — 4,002Deferred and Other Noncurrent Income Taxes . . . . . . . . . . . . . . . . 32 5 199 8 244Other Long Term Liabilities . . . . . . . . . . . . . . . . . . . . . . . . . . . . . . . 778 33 230 — 1,041
Total Liabilities . . . . . . . . . . . . . . . . . . . . . . . . . . . . . . . . . . . . 9,315 596 6,818 (724) 16,005Commitments and Contingent LiabilitiesMinority Shareholders’ Equity . . . . . . . . . . . . . . . . . . . . . . . . . . . . . — — 404 203 607Shareholders’ Equity:Goodyear Shareholders’ Equity:
Preferred Stock . . . . . . . . . . . . . . . . . . . . . . . . . . . . . . . . . . . . . . . 500 — — — 500Common Stock . . . . . . . . . . . . . . . . . . . . . . . . . . . . . . . . . . . . . . . 245 333 5,033 (5,366) 245Capital Surplus . . . . . . . . . . . . . . . . . . . . . . . . . . . . . . . . . . . . . . . 2,808 39 1,065 (1,104) 2,808Retained Earnings . . . . . . . . . . . . . . . . . . . . . . . . . . . . . . . . . . . . . 1,187 1,303 2,850 (4,153) 1,187Accumulated Other Comprehensive Loss . . . . . . . . . . . . . . . . . . (3,991) (540) (1,250) 1,790 (3,991)
Goodyear Shareholders’ Equity . . . . . . . . . . . . . . . . . . . . . . 749 1,135 7,698 (8,833) 749Minority Shareholders’ Equity — Nonredeemable . . . . . . . . . . . . . — — 268 — 268
Total Shareholders’ Equity . . . . . . . . . . . . . . . . . . . . . . . . . . 749 1,135 7,966 (8,833) 1,017
Total Liabilities and Shareholders’ Equity . . . . . . . . . . . . . $10,064 $1,731 $15,188 $(9,354) $17,629
93
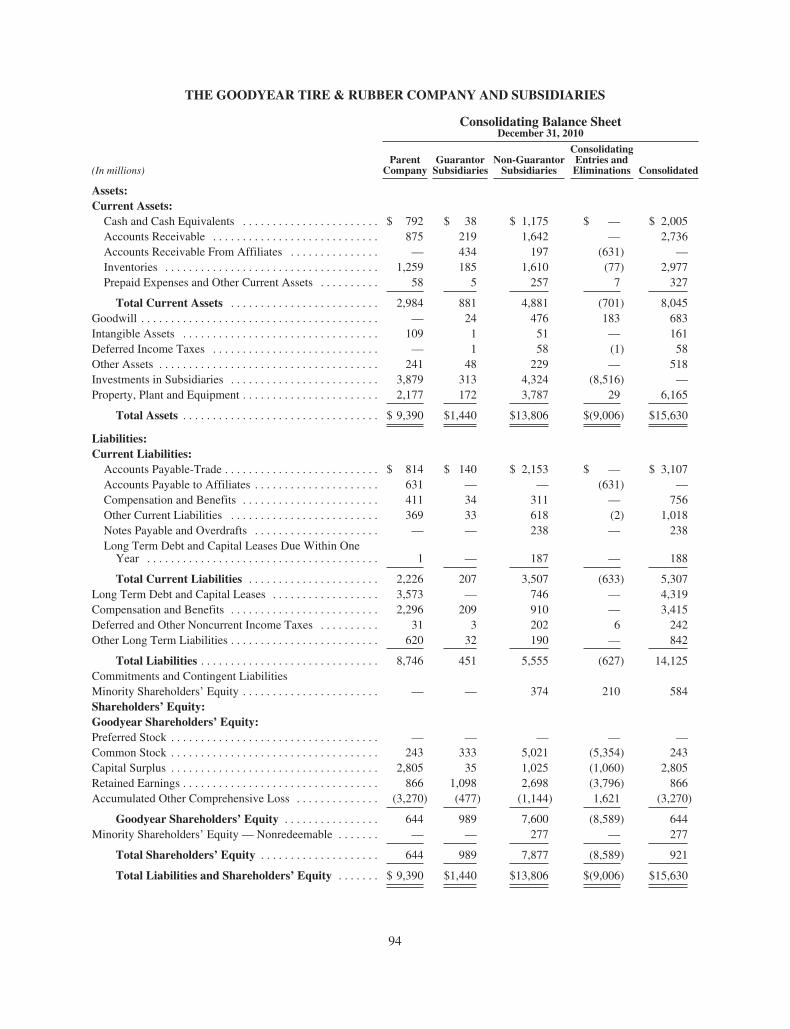
THE GOODYEAR TIRE & RUBBER COMPANY AND SUBSIDIARIES
Consolidating Balance SheetDecember 31, 2010
(In millions)Parent
CompanyGuarantorSubsidiaries
Non-GuarantorSubsidiaries
ConsolidatingEntries andEliminations Consolidated
Assets:Current Assets:
Cash and Cash Equivalents . . . . . . . . . . . . . . . . . . . . . . . $ 792 $ 38 $ 1,175 $ — $ 2,005Accounts Receivable . . . . . . . . . . . . . . . . . . . . . . . . . . . . 875 219 1,642 — 2,736Accounts Receivable From Affiliates . . . . . . . . . . . . . . . — 434 197 (631) —Inventories . . . . . . . . . . . . . . . . . . . . . . . . . . . . . . . . . . . . 1,259 185 1,610 (77) 2,977Prepaid Expenses and Other Current Assets . . . . . . . . . . 58 5 257 7 327
Total Current Assets . . . . . . . . . . . . . . . . . . . . . . . . . 2,984 881 4,881 (701) 8,045Goodwill . . . . . . . . . . . . . . . . . . . . . . . . . . . . . . . . . . . . . . . . — 24 476 183 683Intangible Assets . . . . . . . . . . . . . . . . . . . . . . . . . . . . . . . . . 109 1 51 — 161Deferred Income Taxes . . . . . . . . . . . . . . . . . . . . . . . . . . . . — 1 58 (1) 58Other Assets . . . . . . . . . . . . . . . . . . . . . . . . . . . . . . . . . . . . . 241 48 229 — 518Investments in Subsidiaries . . . . . . . . . . . . . . . . . . . . . . . . . 3,879 313 4,324 (8,516) —Property, Plant and Equipment . . . . . . . . . . . . . . . . . . . . . . . 2,177 172 3,787 29 6,165
Total Assets . . . . . . . . . . . . . . . . . . . . . . . . . . . . . . . . . $ 9,390 $1,440 $13,806 $(9,006) $15,630
Liabilities:Current Liabilities:
Accounts Payable-Trade . . . . . . . . . . . . . . . . . . . . . . . . . . $ 814 $ 140 $ 2,153 $ — $ 3,107Accounts Payable to Affiliates . . . . . . . . . . . . . . . . . . . . . 631 — — (631) —Compensation and Benefits . . . . . . . . . . . . . . . . . . . . . . . 411 34 311 — 756Other Current Liabilities . . . . . . . . . . . . . . . . . . . . . . . . . 369 33 618 (2) 1,018Notes Payable and Overdrafts . . . . . . . . . . . . . . . . . . . . . — — 238 — 238Long Term Debt and Capital Leases Due Within One
Year . . . . . . . . . . . . . . . . . . . . . . . . . . . . . . . . . . . . . . . 1 — 187 — 188
Total Current Liabilities . . . . . . . . . . . . . . . . . . . . . . 2,226 207 3,507 (633) 5,307Long Term Debt and Capital Leases . . . . . . . . . . . . . . . . . . 3,573 — 746 — 4,319Compensation and Benefits . . . . . . . . . . . . . . . . . . . . . . . . . 2,296 209 910 — 3,415Deferred and Other Noncurrent Income Taxes . . . . . . . . . . 31 3 202 6 242Other Long Term Liabilities . . . . . . . . . . . . . . . . . . . . . . . . . 620 32 190 — 842
Total Liabilities . . . . . . . . . . . . . . . . . . . . . . . . . . . . . . 8,746 451 5,555 (627) 14,125Commitments and Contingent LiabilitiesMinority Shareholders’ Equity . . . . . . . . . . . . . . . . . . . . . . . — — 374 210 584Shareholders’ Equity:Goodyear Shareholders’ Equity:Preferred Stock . . . . . . . . . . . . . . . . . . . . . . . . . . . . . . . . . . . — — — — —Common Stock . . . . . . . . . . . . . . . . . . . . . . . . . . . . . . . . . . . 243 333 5,021 (5,354) 243Capital Surplus . . . . . . . . . . . . . . . . . . . . . . . . . . . . . . . . . . . 2,805 35 1,025 (1,060) 2,805Retained Earnings . . . . . . . . . . . . . . . . . . . . . . . . . . . . . . . . . 866 1,098 2,698 (3,796) 866Accumulated Other Comprehensive Loss . . . . . . . . . . . . . . (3,270) (477) (1,144) 1,621 (3,270)
Goodyear Shareholders’ Equity . . . . . . . . . . . . . . . . 644 989 7,600 (8,589) 644Minority Shareholders’ Equity — Nonredeemable . . . . . . . — — 277 — 277
Total Shareholders’ Equity . . . . . . . . . . . . . . . . . . . . 644 989 7,877 (8,589) 921
Total Liabilities and Shareholders’ Equity . . . . . . . $ 9,390 $1,440 $13,806 $(9,006) $15,630
94
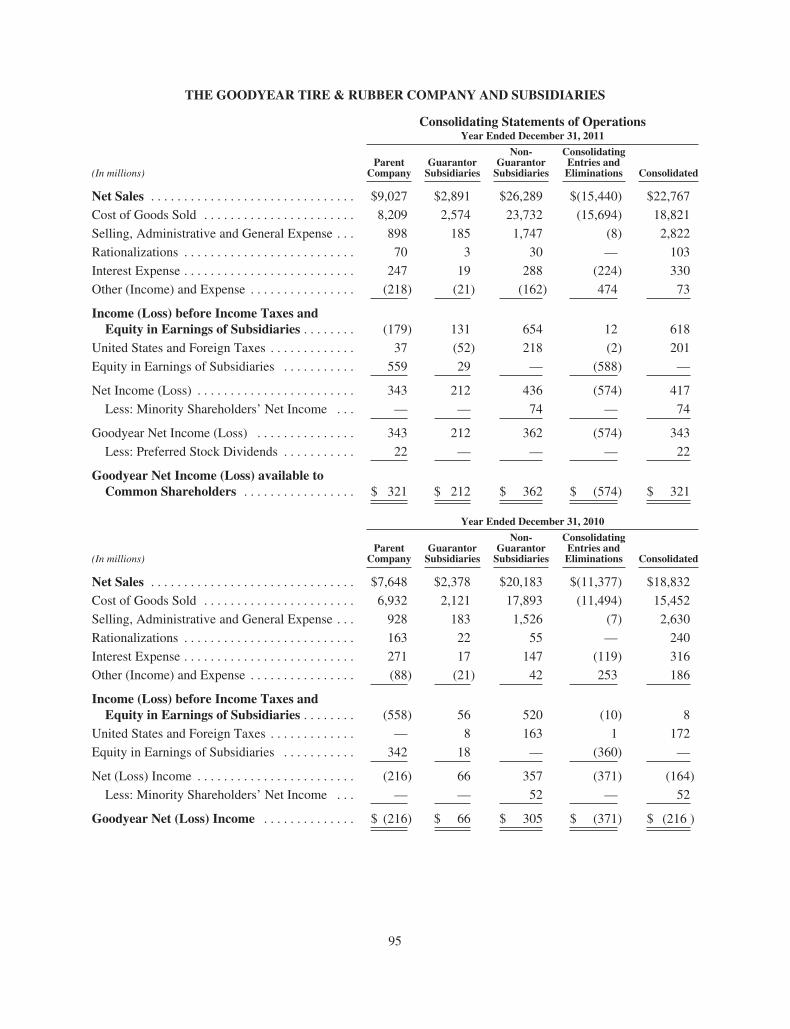
THE GOODYEAR TIRE & RUBBER COMPANY AND SUBSIDIARIES
Consolidating Statements of OperationsYear Ended December 31, 2011
(In millions)Parent
CompanyGuarantorSubsidiaries
Non-GuarantorSubsidiaries
ConsolidatingEntries andEliminations Consolidated
Net Sales . . . . . . . . . . . . . . . . . . . . . . . . . . . . . . . $9,027 $2,891 $26,289 $(15,440) $22,767
Cost of Goods Sold . . . . . . . . . . . . . . . . . . . . . . . 8,209 2,574 23,732 (15,694) 18,821
Selling, Administrative and General Expense . . . 898 185 1,747 (8) 2,822
Rationalizations . . . . . . . . . . . . . . . . . . . . . . . . . . 70 3 30 — 103
Interest Expense . . . . . . . . . . . . . . . . . . . . . . . . . . 247 19 288 (224) 330
Other (Income) and Expense . . . . . . . . . . . . . . . . (218) (21) (162) 474 73
Income (Loss) before Income Taxes andEquity in Earnings of Subsidiaries . . . . . . . . (179) 131 654 12 618
United States and Foreign Taxes . . . . . . . . . . . . . 37 (52) 218 (2) 201
Equity in Earnings of Subsidiaries . . . . . . . . . . . 559 29 — (588) —
Net Income (Loss) . . . . . . . . . . . . . . . . . . . . . . . . 343 212 436 (574) 417
Less: Minority Shareholders’ Net Income . . . — — 74 — 74
Goodyear Net Income (Loss) . . . . . . . . . . . . . . . 343 212 362 (574) 343
Less: Preferred Stock Dividends . . . . . . . . . . . 22 — — — 22
Goodyear Net Income (Loss) available toCommon Shareholders . . . . . . . . . . . . . . . . . $ 321 $ 212 $ 362 $ (574) $ 321
Year Ended December 31, 2010
(In millions)Parent
CompanyGuarantorSubsidiaries
Non-GuarantorSubsidiaries
ConsolidatingEntries andEliminations Consolidated
Net Sales . . . . . . . . . . . . . . . . . . . . . . . . . . . . . . . $7,648 $2,378 $20,183 $(11,377) $18,832
Cost of Goods Sold . . . . . . . . . . . . . . . . . . . . . . . 6,932 2,121 17,893 (11,494) 15,452
Selling, Administrative and General Expense . . . 928 183 1,526 (7) 2,630
Rationalizations . . . . . . . . . . . . . . . . . . . . . . . . . . 163 22 55 — 240
Interest Expense . . . . . . . . . . . . . . . . . . . . . . . . . . 271 17 147 (119) 316
Other (Income) and Expense . . . . . . . . . . . . . . . . (88) (21) 42 253 186
Income (Loss) before Income Taxes andEquity in Earnings of Subsidiaries . . . . . . . . (558) 56 520 (10) 8
United States and Foreign Taxes . . . . . . . . . . . . . — 8 163 1 172
Equity in Earnings of Subsidiaries . . . . . . . . . . . 342 18 — (360) —
Net (Loss) Income . . . . . . . . . . . . . . . . . . . . . . . . (216) 66 357 (371) (164)
Less: Minority Shareholders’ Net Income . . . — — 52 — 52
Goodyear Net (Loss) Income . . . . . . . . . . . . . . $ (216) $ 66 $ 305 $ (371) $ (216 )
95
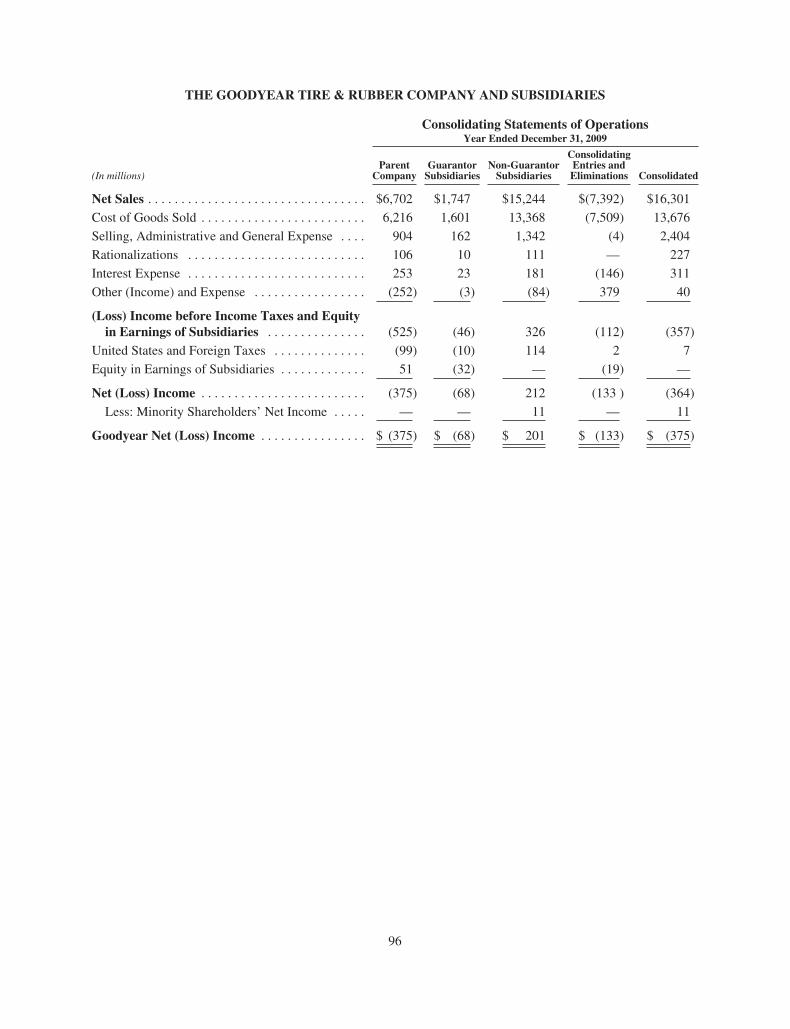
THE GOODYEAR TIRE & RUBBER COMPANY AND SUBSIDIARIES
Consolidating Statements of OperationsYear Ended December 31, 2009
(In millions)Parent
CompanyGuarantorSubsidiaries
Non-GuarantorSubsidiaries
ConsolidatingEntries andEliminations Consolidated
Net Sales . . . . . . . . . . . . . . . . . . . . . . . . . . . . . . . . . $6,702 $1,747 $15,244 $(7,392) $16,301
Cost of Goods Sold . . . . . . . . . . . . . . . . . . . . . . . . . 6,216 1,601 13,368 (7,509) 13,676
Selling, Administrative and General Expense . . . . 904 162 1,342 (4) 2,404
Rationalizations . . . . . . . . . . . . . . . . . . . . . . . . . . . 106 10 111 — 227
Interest Expense . . . . . . . . . . . . . . . . . . . . . . . . . . . 253 23 181 (146) 311
Other (Income) and Expense . . . . . . . . . . . . . . . . . (252) (3) (84) 379 40
(Loss) Income before Income Taxes and Equityin Earnings of Subsidiaries . . . . . . . . . . . . . . . (525) (46) 326 (112) (357)
United States and Foreign Taxes . . . . . . . . . . . . . . (99) (10) 114 2 7
Equity in Earnings of Subsidiaries . . . . . . . . . . . . . 51 (32) — (19) —
Net (Loss) Income . . . . . . . . . . . . . . . . . . . . . . . . . (375) (68) 212 (133 ) (364)
Less: Minority Shareholders’ Net Income . . . . . — — 11 — 11
Goodyear Net (Loss) Income . . . . . . . . . . . . . . . . $ (375) $ (68) $ 201 $ (133) $ (375)
96
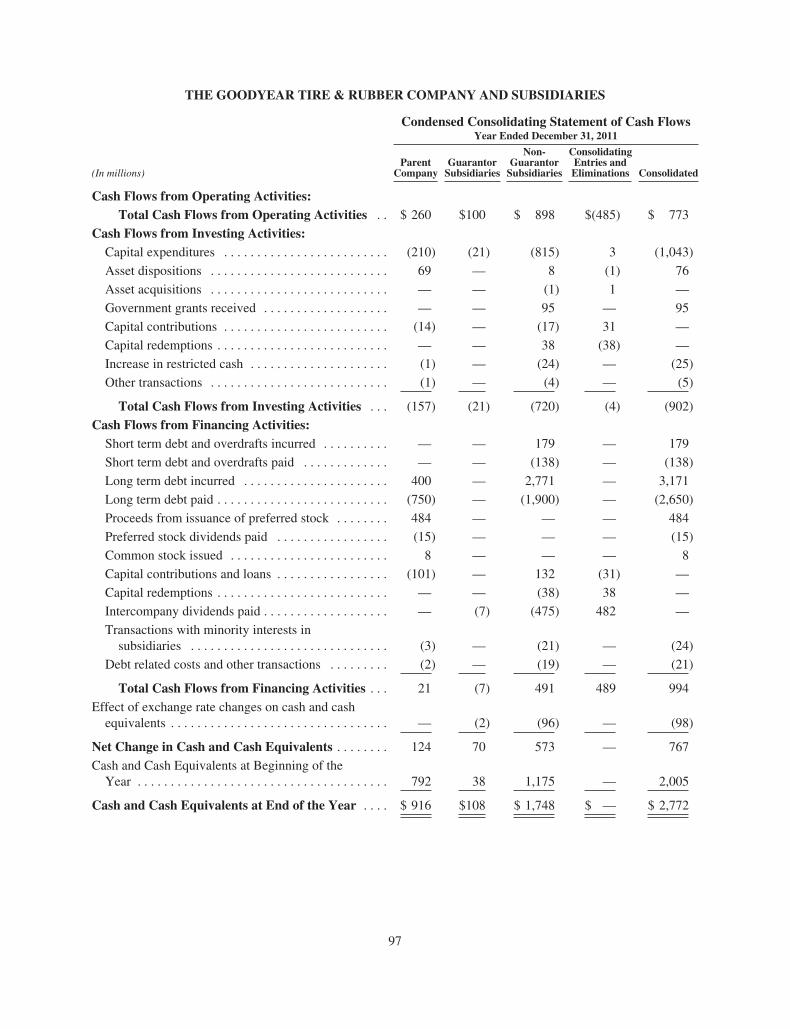
THE GOODYEAR TIRE & RUBBER COMPANY AND SUBSIDIARIES
Condensed Consolidating Statement of Cash FlowsYear Ended December 31, 2011
(In millions)Parent
CompanyGuarantorSubsidiaries
Non-GuarantorSubsidiaries
ConsolidatingEntries andEliminations Consolidated
Cash Flows from Operating Activities:Total Cash Flows from Operating Activities . . $ 260 $100 $ 898 $(485) $ 773
Cash Flows from Investing Activities:Capital expenditures . . . . . . . . . . . . . . . . . . . . . . . . . (210) (21) (815) 3 (1,043)
Asset dispositions . . . . . . . . . . . . . . . . . . . . . . . . . . . 69 — 8 (1) 76
Asset acquisitions . . . . . . . . . . . . . . . . . . . . . . . . . . . — — (1) 1 —
Government grants received . . . . . . . . . . . . . . . . . . . — — 95 — 95
Capital contributions . . . . . . . . . . . . . . . . . . . . . . . . . (14) — (17) 31 —
Capital redemptions . . . . . . . . . . . . . . . . . . . . . . . . . . — — 38 (38) —
Increase in restricted cash . . . . . . . . . . . . . . . . . . . . . (1) — (24) — (25)
Other transactions . . . . . . . . . . . . . . . . . . . . . . . . . . . (1) — (4) — (5)
Total Cash Flows from Investing Activities . . . (157) (21) (720) (4) (902)
Cash Flows from Financing Activities:Short term debt and overdrafts incurred . . . . . . . . . . — — 179 — 179
Short term debt and overdrafts paid . . . . . . . . . . . . . — — (138) — (138)
Long term debt incurred . . . . . . . . . . . . . . . . . . . . . . 400 — 2,771 — 3,171
Long term debt paid . . . . . . . . . . . . . . . . . . . . . . . . . . (750) — (1,900) — (2,650)
Proceeds from issuance of preferred stock . . . . . . . . 484 — — — 484
Preferred stock dividends paid . . . . . . . . . . . . . . . . . (15) — — — (15)
Common stock issued . . . . . . . . . . . . . . . . . . . . . . . . 8 — — — 8
Capital contributions and loans . . . . . . . . . . . . . . . . . (101) — 132 (31) —
Capital redemptions . . . . . . . . . . . . . . . . . . . . . . . . . . — — (38) 38 —
Intercompany dividends paid . . . . . . . . . . . . . . . . . . . — (7) (475) 482 —
Transactions with minority interests insubsidiaries . . . . . . . . . . . . . . . . . . . . . . . . . . . . . . (3) — (21) — (24)
Debt related costs and other transactions . . . . . . . . . (2) — (19) — (21)
Total Cash Flows from Financing Activities . . . 21 (7) 491 489 994
Effect of exchange rate changes on cash and cashequivalents . . . . . . . . . . . . . . . . . . . . . . . . . . . . . . . . . — (2) (96) — (98)
Net Change in Cash and Cash Equivalents . . . . . . . . 124 70 573 — 767
Cash and Cash Equivalents at Beginning of theYear . . . . . . . . . . . . . . . . . . . . . . . . . . . . . . . . . . . . . . 792 38 1,175 — 2,005
Cash and Cash Equivalents at End of the Year . . . . $ 916 $108 $ 1,748 $ — $ 2,772
97
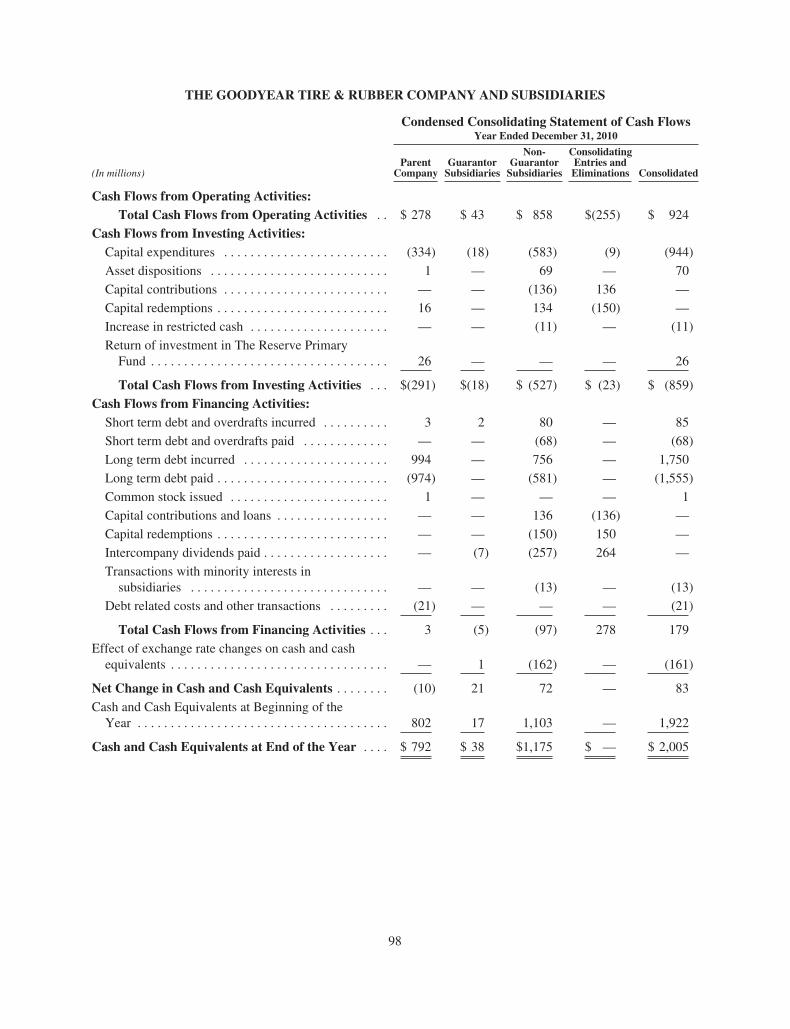
THE GOODYEAR TIRE & RUBBER COMPANY AND SUBSIDIARIES
Condensed Consolidating Statement of Cash FlowsYear Ended December 31, 2010
(In millions)Parent
CompanyGuarantorSubsidiaries
Non-GuarantorSubsidiaries
ConsolidatingEntries andEliminations Consolidated
Cash Flows from Operating Activities:Total Cash Flows from Operating Activities . . $ 278 $ 43 $ 858 $(255) $ 924
Cash Flows from Investing Activities:Capital expenditures . . . . . . . . . . . . . . . . . . . . . . . . . (334) (18) (583) (9) (944)
Asset dispositions . . . . . . . . . . . . . . . . . . . . . . . . . . . 1 — 69 — 70
Capital contributions . . . . . . . . . . . . . . . . . . . . . . . . . — — (136) 136 —
Capital redemptions . . . . . . . . . . . . . . . . . . . . . . . . . . 16 — 134 (150) —
Increase in restricted cash . . . . . . . . . . . . . . . . . . . . . — — (11) — (11)
Return of investment in The Reserve PrimaryFund . . . . . . . . . . . . . . . . . . . . . . . . . . . . . . . . . . . . 26 — — — 26
Total Cash Flows from Investing Activities . . . $(291) $(18) $ (527) $ (23) $ (859)
Cash Flows from Financing Activities:Short term debt and overdrafts incurred . . . . . . . . . . 3 2 80 — 85
Short term debt and overdrafts paid . . . . . . . . . . . . . — — (68) — (68)
Long term debt incurred . . . . . . . . . . . . . . . . . . . . . . 994 — 756 — 1,750
Long term debt paid . . . . . . . . . . . . . . . . . . . . . . . . . . (974) — (581) — (1,555)
Common stock issued . . . . . . . . . . . . . . . . . . . . . . . . 1 — — — 1
Capital contributions and loans . . . . . . . . . . . . . . . . . — — 136 (136) —
Capital redemptions . . . . . . . . . . . . . . . . . . . . . . . . . . — — (150) 150 —
Intercompany dividends paid . . . . . . . . . . . . . . . . . . . — (7) (257) 264 —
Transactions with minority interests insubsidiaries . . . . . . . . . . . . . . . . . . . . . . . . . . . . . . — — (13) — (13)
Debt related costs and other transactions . . . . . . . . . (21) — — — (21)
Total Cash Flows from Financing Activities . . . 3 (5) (97) 278 179
Effect of exchange rate changes on cash and cashequivalents . . . . . . . . . . . . . . . . . . . . . . . . . . . . . . . . . — 1 (162) — (161)
Net Change in Cash and Cash Equivalents . . . . . . . . (10) 21 72 — 83
Cash and Cash Equivalents at Beginning of theYear . . . . . . . . . . . . . . . . . . . . . . . . . . . . . . . . . . . . . . 802 17 1,103 — 1,922
Cash and Cash Equivalents at End of the Year . . . . $ 792 $ 38 $1,175 $ — $ 2,005
98
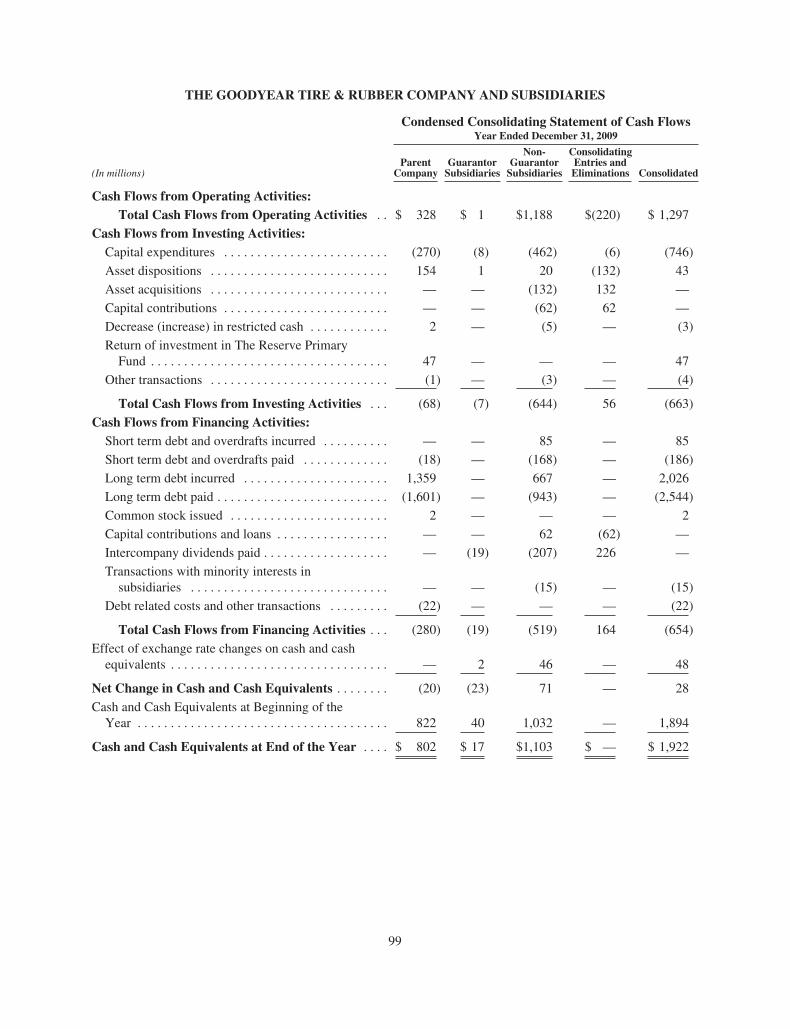
THE GOODYEAR TIRE & RUBBER COMPANY AND SUBSIDIARIES
Condensed Consolidating Statement of Cash FlowsYear Ended December 31, 2009
(In millions)Parent
CompanyGuarantorSubsidiaries
Non-GuarantorSubsidiaries
ConsolidatingEntries andEliminations Consolidated
Cash Flows from Operating Activities:Total Cash Flows from Operating Activities . . $ 328 $ 1 $1,188 $(220) $ 1,297
Cash Flows from Investing Activities:Capital expenditures . . . . . . . . . . . . . . . . . . . . . . . . . (270) (8) (462) (6) (746)
Asset dispositions . . . . . . . . . . . . . . . . . . . . . . . . . . . 154 1 20 (132) 43
Asset acquisitions . . . . . . . . . . . . . . . . . . . . . . . . . . . — — (132) 132 —
Capital contributions . . . . . . . . . . . . . . . . . . . . . . . . . — — (62) 62 —
Decrease (increase) in restricted cash . . . . . . . . . . . . 2 — (5) — (3)
Return of investment in The Reserve PrimaryFund . . . . . . . . . . . . . . . . . . . . . . . . . . . . . . . . . . . . 47 — — — 47
Other transactions . . . . . . . . . . . . . . . . . . . . . . . . . . . (1) — (3) — (4)
Total Cash Flows from Investing Activities . . . (68) (7) (644) 56 (663)
Cash Flows from Financing Activities:Short term debt and overdrafts incurred . . . . . . . . . . — — 85 — 85
Short term debt and overdrafts paid . . . . . . . . . . . . . (18) — (168) — (186)
Long term debt incurred . . . . . . . . . . . . . . . . . . . . . . 1,359 — 667 — 2,026
Long term debt paid . . . . . . . . . . . . . . . . . . . . . . . . . . (1,601) — (943) — (2,544)
Common stock issued . . . . . . . . . . . . . . . . . . . . . . . . 2 — — — 2
Capital contributions and loans . . . . . . . . . . . . . . . . . — — 62 (62) —
Intercompany dividends paid . . . . . . . . . . . . . . . . . . . — (19) (207) 226 —
Transactions with minority interests insubsidiaries . . . . . . . . . . . . . . . . . . . . . . . . . . . . . . — — (15) — (15)
Debt related costs and other transactions . . . . . . . . . (22) — — — (22)
Total Cash Flows from Financing Activities . . . (280) (19) (519) 164 (654)
Effect of exchange rate changes on cash and cashequivalents . . . . . . . . . . . . . . . . . . . . . . . . . . . . . . . . . — 2 46 — 48
Net Change in Cash and Cash Equivalents . . . . . . . . (20) (23) 71 — 28
Cash and Cash Equivalents at Beginning of theYear . . . . . . . . . . . . . . . . . . . . . . . . . . . . . . . . . . . . . . 822 40 1,032 — 1,894
Cash and Cash Equivalents at End of the Year . . . . $ 802 $ 17 $1,103 $ — $ 1,922
99
MANAGEMENT’S REPORT ON INTERNAL CONTROL OVER FINANCIAL REPORTING
Management of the Company is responsible for establishing and maintaining adequate internal control overfinancial reporting as such term is defined under Rule 13a-15(f) promulgated under the Securities Exchange Actof 1934, as amended.
Internal control over financial reporting is a process designed to provide reasonable assurance regarding thereliability of financial reporting and the preparation of the Company’s consolidated financial statements forexternal purposes in accordance with generally accepted accounting principles.
Internal control over financial reporting includes those policies and procedures that (i) pertain to themaintenance of records that, in reasonable detail, accurately and fairly reflect the transactions and dispositions ofthe assets of the Company; (ii) provide reasonable assurance that transactions are recorded as necessary to permitthe preparation of the consolidated financial statements in accordance with generally accepted accountingprinciples, and that receipts and expenditures of the Company are being made only in accordance withappropriate authorizations of management and directors of the Company; and (iii) provide reasonable assuranceregarding prevention or timely detection of unauthorized acquisition, use or disposition of the Company’s assetsthat could have a material effect on the consolidated financial statements.
Because of its inherent limitations, internal control over financial reporting may not prevent or detectmisstatements. Also, projections of any evaluation of effectiveness to future periods are subject to the risk thatcontrols may become inadequate because of changes in conditions, or that the degree of compliance with thepolicies or procedures may deteriorate.
Management conducted an assessment of the Company’s internal control over financial reporting as ofDecember 31, 2011 using the framework specified in Internal Control — Integrated Framework, published bythe Committee of Sponsoring Organizations of the Treadway Commission. Based on such assessment,management has concluded that the Company’s internal control over financial reporting was effective as ofDecember 31, 2011.
The effectiveness of the Company’s internal control over financial reporting as of December 31, 2011 hasbeen audited by PricewaterhouseCoopers LLP, an independent registered public accounting firm, as stated intheir report which is presented in this Annual Report.
100
REPORT OF INDEPENDENT REGISTERED PUBLIC ACCOUNTING FIRM
To The Board of Directors and Shareholders of The Goodyear Tire & Rubber Company
In our opinion, the accompanying consolidated balance sheets and the related consolidated statements ofoperations, shareholders’ equity and cash flows present fairly, in all material respects, the financial position ofThe Goodyear Tire & Rubber Company and its subsidiaries at December 31, 2011 and 2010, and the results oftheir operations and their cash flows for each of the three years in the period ended December 31, 2011 inconformity with accounting principles generally accepted in the United States of America. Also in our opinion,the Company maintained, in all material respects, effective internal control over financial reporting as ofDecember 31, 2011, based on criteria established in Internal Control — Integrated Framework issued by theCommittee of Sponsoring Organizations of the Treadway Commission (COSO). The Company’s management isresponsible for these financial statements, for maintaining effective internal control over financial reporting andfor its assessment of the effectiveness of internal control over financial reporting, included in the accompanyingManagement’s Report on Internal Control over Financial Reporting. Our responsibility is to express opinions onthese financial statements, and on the Company’s internal control over financial reporting based on our integratedaudits. We conducted our audits in accordance with the standards of the Public Company Accounting OversightBoard (United States). Those standards require that we plan and perform the audits to obtain reasonableassurance about whether the financial statements are free of material misstatement and whether effective internalcontrol over financial reporting was maintained in all material respects. Our audits of the financial statementsincluded examining, on a test basis, evidence supporting the amounts and disclosures in the financial statements,assessing the accounting principles used and significant estimates made by management, and evaluating theoverall financial statement presentation. Our audit of internal control over financial reporting included obtainingan understanding of internal control over financial reporting, assessing the risk that a material weakness exists,and testing and evaluating the design and operating effectiveness of internal control based on the assessed risk.Our audits also included performing such other procedures as we considered necessary in the circumstances. Webelieve that our audits provide a reasonable basis for our opinions.
A company’s internal control over financial reporting is a process designed to provide reasonable assuranceregarding the reliability of financial reporting and the preparation of financial statements for external purposes inaccordance with generally accepted accounting principles. A company’s internal control over financial reportingincludes those policies and procedures that (i) pertain to the maintenance of records that, in reasonable detail,accurately and fairly reflect the transactions and dispositions of the assets of the company; (ii) provide reasonableassurance that transactions are recorded as necessary to permit preparation of financial statements in accordancewith generally accepted accounting principles, and that receipts and expenditures of the company are being madeonly in accordance with authorizations of management and directors of the company; and (iii) provide reasonableassurance regarding prevention or timely detection of unauthorized acquisition, use, or disposition of thecompany’s assets that could have a material effect on the financial statements.
Because of its inherent limitations, internal control over financial reporting may not prevent or detectmisstatements. Also, projections of any evaluation of effectiveness to future periods are subject to the risk thatcontrols may become inadequate because of changes in conditions, or that the degree of compliance with thepolicies or procedures may deteriorate.
PRICEWATERHOUSECOOPERS LLP
Cleveland, Ohio
February 14, 2012
101

THE GOODYEAR TIRE & RUBBER COMPANY AND SUBSIDIARIESSupplementary Data
(Unaudited)
Quarterly Data and Market Price Information
Quarter
(In millions, except per share amounts) First Second Third Fourth Year
2011Net Sales . . . . . . . . . . . . . . . . . . . . . . . . . . . . . . . . . . . . . . . . . . . $ 5,402 $ 5,620 $ 6,062 $ 5,683 $22,767
Gross Profit . . . . . . . . . . . . . . . . . . . . . . . . . . . . . . . . . . . . . . . . 941 1,048 1,089 868 3,946
Net Income . . . . . . . . . . . . . . . . . . . . . . . . . . . . . . . . . . . . . . . . . 124 56 211 26 417
Less: Minority Shareholders’ Net Income . . . . . . . . . . . . . . . 21 9 43 1 74
Goodyear Net Income . . . . . . . . . . . . . . . . . . . . . . . . . . . . . . . . 103 47 168 25 343
Less: Preferred Stock Dividends . . . . . . . . . . . . . . . . . . . . . . — 7 7 7 22
Goodyear Net Income available to Common Shareholders . . . . $ 103 $ 40 $ 161 $ 18 $ 321
Goodyear Net Income available to Common Shareholders —Per Share of Common Stock:
— Basic . . . . . . . . . . . . . . . . . . . . . . . . . . . . . . . . . . . . . . . . . $ 0.42 $ 0.16 $ 0.66 $ 0.07 $ 1.32
— Diluted * . . . . . . . . . . . . . . . . . . . . . . . . . . . . . . . . . . . . . . $ 0.42 $ 0.16 $ 0.60 $ 0.07 $ 1.26
Weighted Average Shares Outstanding — Basic . . . . . . . . . . . . 243 244 244 244 244
— Diluted . . . . . . . . . . 246 247 281 247 271
Price Range of Common Stock:** High . . . . . . . . . . . . . . . . . . $ 15.71 $ 18.83 $ 18.25 $ 15.47 $ 18.83
Low . . . . . . . . . . . . . . . . . . . 11.42 14.44 9.15 8.53 8.53
Selected Balance Sheet Items at Quarter-End:
Total Assets . . . . . . . . . . . . . . . . . . . . . . . . . . . . . . . . . . . . . . $17,256 $17,642 $18,129 $17,629
Total Debt and Capital Leases . . . . . . . . . . . . . . . . . . . . . . . . 5,284 5,304 6,083 5,201
Goodyear Shareholders’ Equity . . . . . . . . . . . . . . . . . . . . . . . 1,327 1,475 1,499 749
Total Shareholders’ Equity . . . . . . . . . . . . . . . . . . . . . . . . . . . 1,616 1,759 1,775 1,017
* Due to the anti-dilutive impact of potentially dilutive securities, the quarterly earnings per share amounts donot add to the full year.
** New York Stock Exchange — Composite Transactions
All numbers presented below are after-tax and minority.
The first quarter of 2011 included net rationalization charges of $9 million and asset write-offs andaccelerated depreciation charges of $9 million. The quarter also included discrete tax charges of $6 million.
The second quarter of 2011 included net rationalization charges of $41 million, which included $32 millionof charges related to the closure of our Union City, Tennessee manufacturing facility in July 2011, and assetwrite-offs and accelerated depreciation charges of $24 million. The quarter also included net charges of$53 million related to cash premiums paid and write-offs of deferred financing fees due to the early redemptionof debt, $7 million of charges to increase tax reserves as a result of negative tax court rulings in a foreignjurisdiction and $3 million of charges related to tornado damage at our manufacturing facility in Fayetteville,North Carolina. Net gains on asset sales were $10 million for this quarter.
102
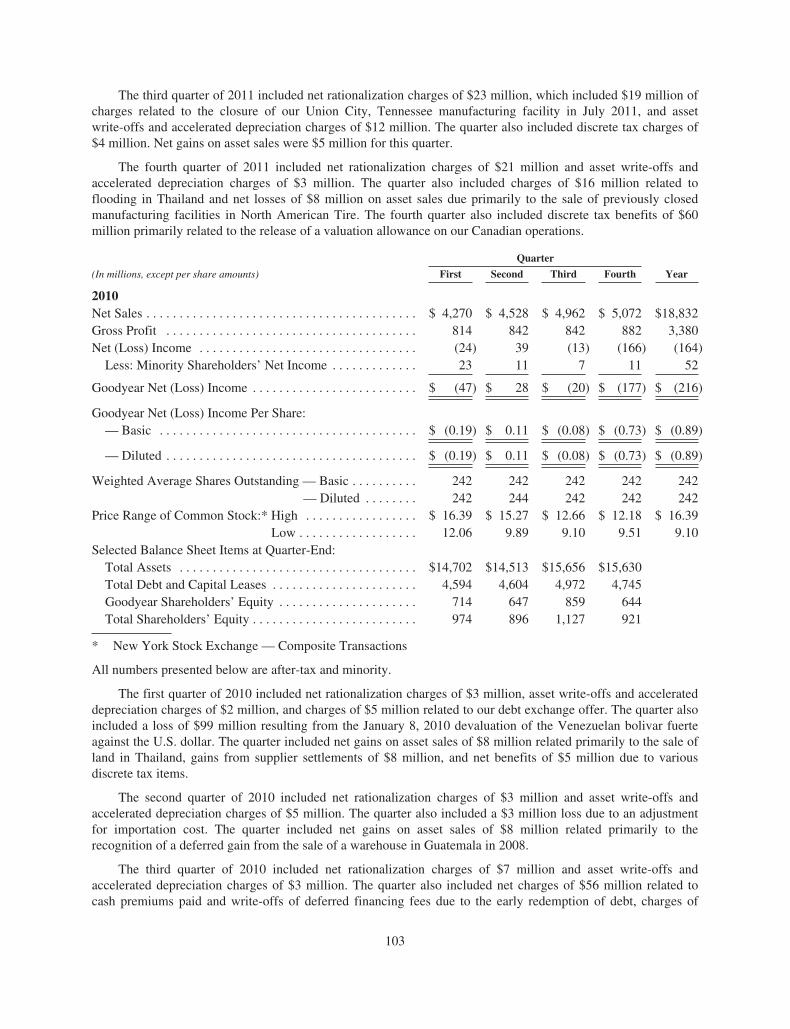
The third quarter of 2011 included net rationalization charges of $23 million, which included $19 million ofcharges related to the closure of our Union City, Tennessee manufacturing facility in July 2011, and assetwrite-offs and accelerated depreciation charges of $12 million. The quarter also included discrete tax charges of$4 million. Net gains on asset sales were $5 million for this quarter.
The fourth quarter of 2011 included net rationalization charges of $21 million and asset write-offs andaccelerated depreciation charges of $3 million. The quarter also included charges of $16 million related toflooding in Thailand and net losses of $8 million on asset sales due primarily to the sale of previously closedmanufacturing facilities in North American Tire. The fourth quarter also included discrete tax benefits of $60million primarily related to the release of a valuation allowance on our Canadian operations.
Quarter
(In millions, except per share amounts) First Second Third Fourth Year
2010Net Sales . . . . . . . . . . . . . . . . . . . . . . . . . . . . . . . . . . . . . . . . . $ 4,270 $ 4,528 $ 4,962 $ 5,072 $18,832Gross Profit . . . . . . . . . . . . . . . . . . . . . . . . . . . . . . . . . . . . . . 814 842 842 882 3,380Net (Loss) Income . . . . . . . . . . . . . . . . . . . . . . . . . . . . . . . . . (24) 39 (13) (166) (164)
Less: Minority Shareholders’ Net Income . . . . . . . . . . . . . 23 11 7 11 52
Goodyear Net (Loss) Income . . . . . . . . . . . . . . . . . . . . . . . . . $ (47) $ 28 $ (20) $ (177) $ (216)
Goodyear Net (Loss) Income Per Share:— Basic . . . . . . . . . . . . . . . . . . . . . . . . . . . . . . . . . . . . . . . $ (0.19) $ 0.11 $ (0.08) $ (0.73) $ (0.89)
— Diluted . . . . . . . . . . . . . . . . . . . . . . . . . . . . . . . . . . . . . . $ (0.19) $ 0.11 $ (0.08) $ (0.73) $ (0.89)
Weighted Average Shares Outstanding — Basic . . . . . . . . . . 242 242 242 242 242— Diluted . . . . . . . . 242 244 242 242 242
Price Range of Common Stock:* High . . . . . . . . . . . . . . . . . $ 16.39 $ 15.27 $ 12.66 $ 12.18 $ 16.39Low . . . . . . . . . . . . . . . . . . 12.06 9.89 9.10 9.51 9.10
Selected Balance Sheet Items at Quarter-End:Total Assets . . . . . . . . . . . . . . . . . . . . . . . . . . . . . . . . . . . . $14,702 $14,513 $15,656 $15,630Total Debt and Capital Leases . . . . . . . . . . . . . . . . . . . . . . 4,594 4,604 4,972 4,745Goodyear Shareholders’ Equity . . . . . . . . . . . . . . . . . . . . . 714 647 859 644Total Shareholders’ Equity . . . . . . . . . . . . . . . . . . . . . . . . . 974 896 1,127 921
* New York Stock Exchange — Composite Transactions
All numbers presented below are after-tax and minority.
The first quarter of 2010 included net rationalization charges of $3 million, asset write-offs and accelerateddepreciation charges of $2 million, and charges of $5 million related to our debt exchange offer. The quarter alsoincluded a loss of $99 million resulting from the January 8, 2010 devaluation of the Venezuelan bolivar fuerteagainst the U.S. dollar. The quarter included net gains on asset sales of $8 million related primarily to the sale ofland in Thailand, gains from supplier settlements of $8 million, and net benefits of $5 million due to variousdiscrete tax items.
The second quarter of 2010 included net rationalization charges of $3 million and asset write-offs andaccelerated depreciation charges of $5 million. The quarter also included a $3 million loss due to an adjustmentfor importation cost. The quarter included net gains on asset sales of $8 million related primarily to therecognition of a deferred gain from the sale of a warehouse in Guatemala in 2008.
The third quarter of 2010 included net rationalization charges of $7 million and asset write-offs andaccelerated depreciation charges of $3 million. The quarter also included net charges of $56 million related tocash premiums paid and write-offs of deferred financing fees due to the early redemption of debt, charges of
103
$4 million related to a supplier disruption, and charges of $3 million related to a strike in South Africa. Thequarter included non-cash tax benefits related to employee benefit plans of $13 million, a net gain of $8 millionrelated to an insurance recovery, and net gains on asset sales of $2 million.
The fourth quarter of 2010 included net rationalization charges of $212 million and asset write-offs andaccelerated depreciation charges of $1 million, primarily related to the closure of our Union City, Tennesseemanufacturing facility, the consolidation of our warehouses in North American Tire and an increase in costsrelated to the discontinuation of consumer tire production at one of our facilities in Amiens, France. The quarteralso included a net foreign currency exchange loss of $20 million resulting from the January 1, 2011 eliminationof the official exchange rate for essential goods in Venezuela, an $18 million charge related to a claim regardingthe use of value-added tax credits in prior years and a non-cash tax charge of $8 million related to employeebenefit plans. The quarter included $30 million of net tax benefits primarily related to a $15 million benefit forenacted tax law changes and $15 million of tax benefits related to the settlement of tax audits and the expirationof statutes of limitations in multiple tax jurisdictions, and net gains of $31 million on asset sales due primarily tothe sale of a closed manufacturing facility in Asia Pacific Tire.
104
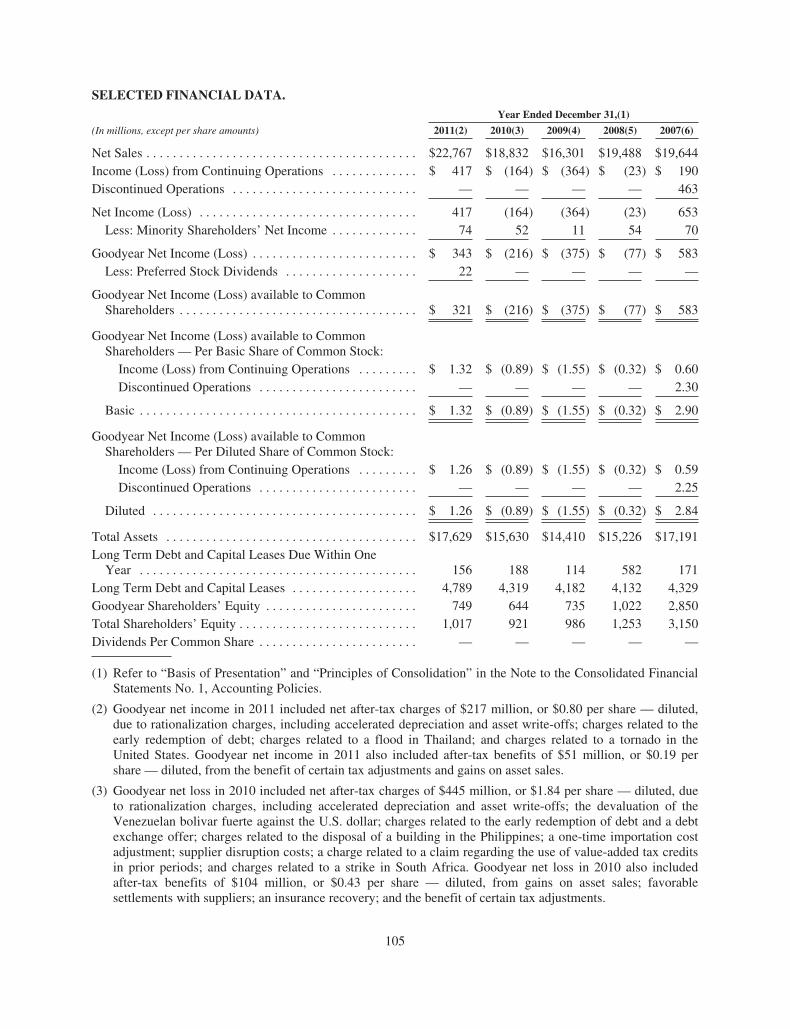
SELECTED FINANCIAL DATA.Year Ended December 31,(1)
(In millions, except per share amounts) 2011(2) 2010(3) 2009(4) 2008(5) 2007(6)
Net Sales . . . . . . . . . . . . . . . . . . . . . . . . . . . . . . . . . . . . . . . . . $22,767 $18,832 $16,301 $19,488 $19,644Income (Loss) from Continuing Operations . . . . . . . . . . . . . $ 417 $ (164) $ (364) $ (23) $ 190Discontinued Operations . . . . . . . . . . . . . . . . . . . . . . . . . . . . — — — — 463
Net Income (Loss) . . . . . . . . . . . . . . . . . . . . . . . . . . . . . . . . . 417 (164) (364) (23) 653Less: Minority Shareholders’ Net Income . . . . . . . . . . . . . 74 52 11 54 70
Goodyear Net Income (Loss) . . . . . . . . . . . . . . . . . . . . . . . . . $ 343 $ (216) $ (375) $ (77) $ 583Less: Preferred Stock Dividends . . . . . . . . . . . . . . . . . . . . 22 — — — —
Goodyear Net Income (Loss) available to CommonShareholders . . . . . . . . . . . . . . . . . . . . . . . . . . . . . . . . . . . . $ 321 $ (216) $ (375) $ (77) $ 583
Goodyear Net Income (Loss) available to CommonShareholders — Per Basic Share of Common Stock:
Income (Loss) from Continuing Operations . . . . . . . . . $ 1.32 $ (0.89) $ (1.55) $ (0.32) $ 0.60Discontinued Operations . . . . . . . . . . . . . . . . . . . . . . . . — — — — 2.30
Basic . . . . . . . . . . . . . . . . . . . . . . . . . . . . . . . . . . . . . . . . . . $ 1.32 $ (0.89) $ (1.55) $ (0.32) $ 2.90
Goodyear Net Income (Loss) available to CommonShareholders — Per Diluted Share of Common Stock:
Income (Loss) from Continuing Operations . . . . . . . . . $ 1.26 $ (0.89) $ (1.55) $ (0.32) $ 0.59Discontinued Operations . . . . . . . . . . . . . . . . . . . . . . . . — — — — 2.25
Diluted . . . . . . . . . . . . . . . . . . . . . . . . . . . . . . . . . . . . . . . . $ 1.26 $ (0.89) $ (1.55) $ (0.32) $ 2.84
Total Assets . . . . . . . . . . . . . . . . . . . . . . . . . . . . . . . . . . . . . . $17,629 $15,630 $14,410 $15,226 $17,191Long Term Debt and Capital Leases Due Within One
Year . . . . . . . . . . . . . . . . . . . . . . . . . . . . . . . . . . . . . . . . . . 156 188 114 582 171Long Term Debt and Capital Leases . . . . . . . . . . . . . . . . . . . 4,789 4,319 4,182 4,132 4,329Goodyear Shareholders’ Equity . . . . . . . . . . . . . . . . . . . . . . . 749 644 735 1,022 2,850Total Shareholders’ Equity . . . . . . . . . . . . . . . . . . . . . . . . . . . 1,017 921 986 1,253 3,150Dividends Per Common Share . . . . . . . . . . . . . . . . . . . . . . . . — — — — —
(1) Refer to “Basis of Presentation” and “Principles of Consolidation” in the Note to the Consolidated FinancialStatements No. 1, Accounting Policies.
(2) Goodyear net income in 2011 included net after-tax charges of $217 million, or $0.80 per share — diluted,due to rationalization charges, including accelerated depreciation and asset write-offs; charges related to theearly redemption of debt; charges related to a flood in Thailand; and charges related to a tornado in theUnited States. Goodyear net income in 2011 also included after-tax benefits of $51 million, or $0.19 pershare — diluted, from the benefit of certain tax adjustments and gains on asset sales.
(3) Goodyear net loss in 2010 included net after-tax charges of $445 million, or $1.84 per share — diluted, dueto rationalization charges, including accelerated depreciation and asset write-offs; the devaluation of theVenezuelan bolivar fuerte against the U.S. dollar; charges related to the early redemption of debt and a debtexchange offer; charges related to the disposal of a building in the Philippines; a one-time importation costadjustment; supplier disruption costs; a charge related to a claim regarding the use of value-added tax creditsin prior periods; and charges related to a strike in South Africa. Goodyear net loss in 2010 also includedafter-tax benefits of $104 million, or $0.43 per share — diluted, from gains on asset sales; favorablesettlements with suppliers; an insurance recovery; and the benefit of certain tax adjustments.
105
(4) Goodyear net loss in 2009 included net after-tax charges of $277 million, or $1.16 per share — diluted, dueto rationalization charges, including accelerated depreciation and asset write-offs; asset sales; the liquidationof our subsidiary in Guatemala; a legal reserve for a closed facility; and our USW labor contract. Goodyearnet loss in 2009 also included after-tax benefits of $156 million, or $0.65 per share — diluted, due tonon-cash tax benefits related to losses from our U.S. operations; benefits primarily resulting from certainincome tax items including the release of the valuation allowance on our Australian operations and thesettlement of our 1997 through 2003 Competent Authority claim between the United States and Canada; andthe recognition of insurance proceeds related to the settlement of a claim as a result of a fire at ourmanufacturing facility in Thailand.
(5) Goodyear net loss in 2008 included net after-tax charges of $311 million, or $1.29 per share — diluted, dueto rationalization charges, including accelerated depreciation and asset write-offs; costs related to theredemption of long-term debt; write-offs of deferred debt issuance costs associated with refinancing andredemption activities; general and product liability — discontinued products; VEBA-related charges; chargesrelated to Hurricanes Ike and Gustav; losses from the liquidation of our subsidiary in Jamaica; chargesrelated to the exit of our Moroccan business; and the valuation allowance on our investment in The ReservePrimary Fund. Goodyear net loss in 2008 also included after-tax benefits of $68 million, or $0.28 pershare — diluted, from asset sales; settlements with suppliers; and the benefit of certain tax adjustments.
(6) Goodyear net income in 2007 included a net after-tax gain of $508 million, or $2.48 per share — diluted,related to the sale of our Engineered Products business. Goodyear net income in 2007 also included netafter-tax charges of $332 million, or $1.62 per share — diluted, due to curtailment and settlement chargesrelated to our pension plans; asset sales, including the assets of North American Tire’s tire and wheelassembly operation; costs related to the redemption and conversion of long term debt; write-offs of deferreddebt issuance costs associated with refinancing, redemption and conversion activities; rationalizationcharges, including accelerated depreciation and asset write-offs; and the impact of the USW strike. Of theseamounts, discontinued operations in 2007 included net after-tax charges of $90 million, or $0.44 per share —diluted, due to curtailment and settlement charges related to pension plans; rationalization charges; and costsassociated with the USW strike.
106
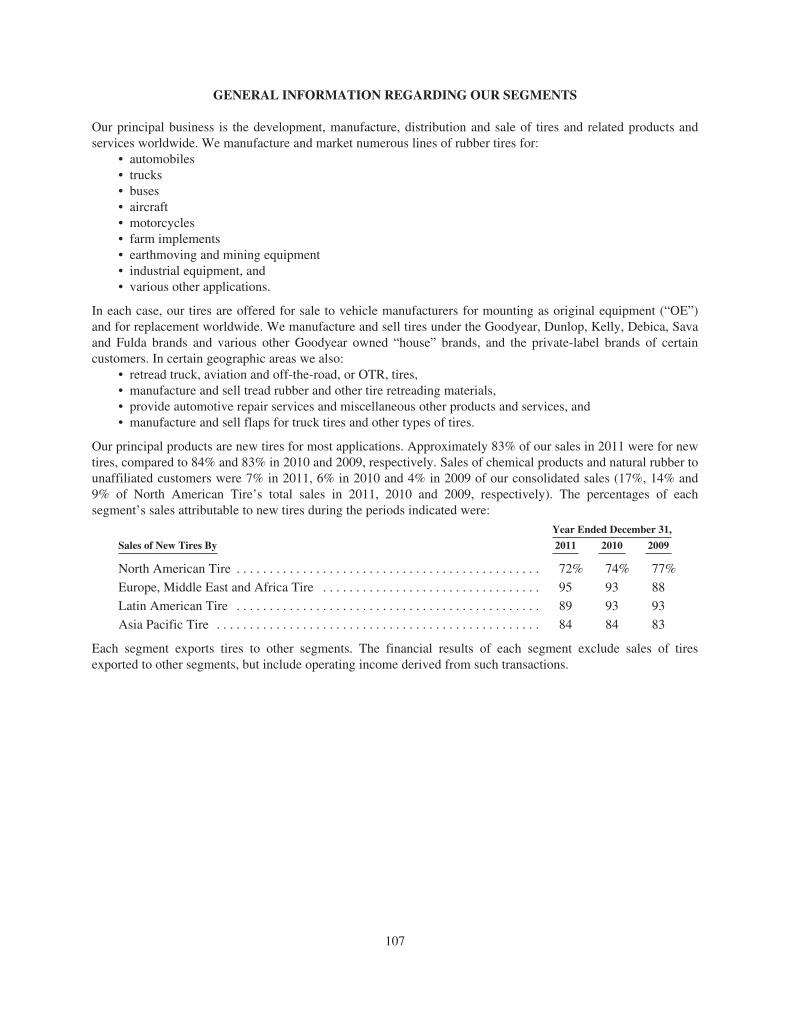
GENERAL INFORMATION REGARDING OUR SEGMENTS
Our principal business is the development, manufacture, distribution and sale of tires and related products andservices worldwide. We manufacture and market numerous lines of rubber tires for:
• automobiles• trucks• buses• aircraft• motorcycles• farm implements• earthmoving and mining equipment• industrial equipment, and• various other applications.
In each case, our tires are offered for sale to vehicle manufacturers for mounting as original equipment (“OE”)and for replacement worldwide. We manufacture and sell tires under the Goodyear, Dunlop, Kelly, Debica, Savaand Fulda brands and various other Goodyear owned “house” brands, and the private-label brands of certaincustomers. In certain geographic areas we also:
• retread truck, aviation and off-the-road, or OTR, tires,• manufacture and sell tread rubber and other tire retreading materials,• provide automotive repair services and miscellaneous other products and services, and• manufacture and sell flaps for truck tires and other types of tires.
Our principal products are new tires for most applications. Approximately 83% of our sales in 2011 were for newtires, compared to 84% and 83% in 2010 and 2009, respectively. Sales of chemical products and natural rubber tounaffiliated customers were 7% in 2011, 6% in 2010 and 4% in 2009 of our consolidated sales (17%, 14% and9% of North American Tire’s total sales in 2011, 2010 and 2009, respectively). The percentages of eachsegment’s sales attributable to new tires during the periods indicated were:
Year Ended December 31,
Sales of New Tires By 2011 2010 2009
North American Tire . . . . . . . . . . . . . . . . . . . . . . . . . . . . . . . . . . . . . . . . . . . . . . 72% 74% 77%
Europe, Middle East and Africa Tire . . . . . . . . . . . . . . . . . . . . . . . . . . . . . . . . . 95 93 88
Latin American Tire . . . . . . . . . . . . . . . . . . . . . . . . . . . . . . . . . . . . . . . . . . . . . . 89 93 93
Asia Pacific Tire . . . . . . . . . . . . . . . . . . . . . . . . . . . . . . . . . . . . . . . . . . . . . . . . . 84 84 83
Each segment exports tires to other segments. The financial results of each segment exclude sales of tiresexported to other segments, but include operating income derived from such transactions.
107
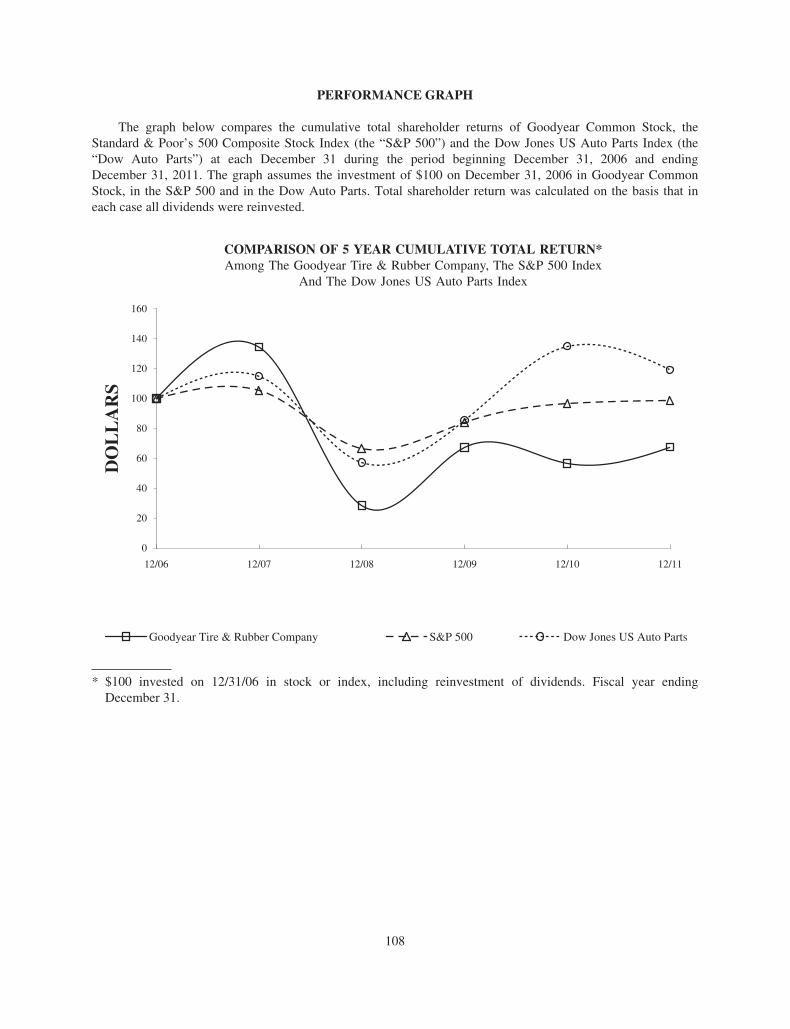
PERFORMANCE GRAPH
The graph below compares the cumulative total shareholder returns of Goodyear Common Stock, theStandard & Poor’s 500 Composite Stock Index (the “S&P 500”) and the Dow Jones US Auto Parts Index (the“Dow Auto Parts”) at each December 31 during the period beginning December 31, 2006 and endingDecember 31, 2011. The graph assumes the investment of $100 on December 31, 2006 in Goodyear CommonStock, in the S&P 500 and in the Dow Auto Parts. Total shareholder return was calculated on the basis that ineach case all dividends were reinvested.
COMPARISON OF 5 YEAR CUMULATIVE TOTAL RETURN*Among The Goodyear Tire & Rubber Company, The S&P 500 Index
And The Dow Jones US Auto Parts Index
0
20
40
60
80
100
120
140
160
12/06 12/07 12/08 12/09 12/10 12/11
Goodyear Tire & Rubber Company S&P 500 Dow Jones US Auto Parts
DOLLARS
* $100 invested on 12/31/06 in stock or index, including reinvestment of dividends. Fiscal year endingDecember 31.
108
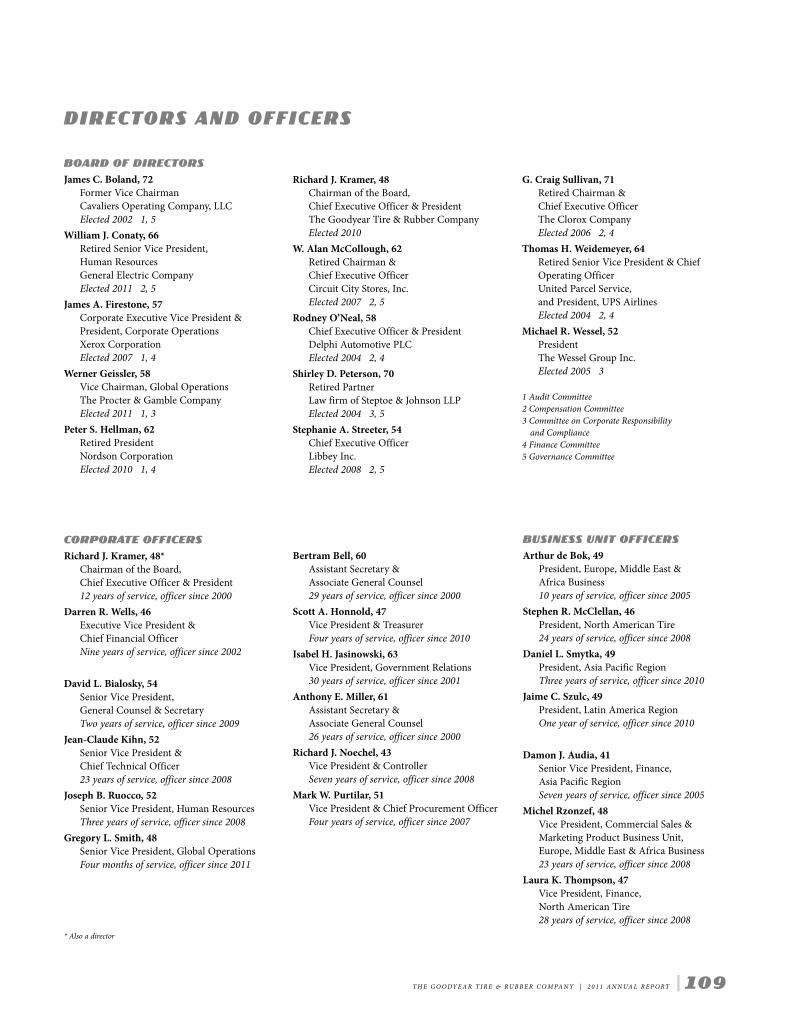
DIRECTORS AND OFFICERS
BOARD OF DIRECTORS
James C. Boland, 72Former Vice ChairmanCavaliers Operating Company, LLCElected 2002 1, 5
William J. Conaty, 66Retired Senior Vice President, Human ResourcesGeneral Electric CompanyElected 2011 2, 5
James A. Firestone, 57Corporate Executive Vice President &President, Corporate OperationsXerox CorporationElected 2007 1, 4
Werner Geissler, 58Vice Chairman, Global OperationsThe Procter & Gamble CompanyElected 2011 1, 3
Peter S. Hellman, 62Retired PresidentNordson CorporationElected 2010 1, 4
Richard J. Kramer, 48Chairman of the Board, Chief Executive Officer & PresidentThe Goodyear Tire & Rubber CompanyElected 2010
W. Alan McCollough, 62Retired Chairman & Chief Executive OfficerCircuit City Stores, Inc.Elected 2007 2, 5
Rodney O’Neal, 58Chief Executive Officer & PresidentDelphi Automotive PLCElected 2004 2, 4
Shirley D. Peterson, 70Retired PartnerLaw firm of Steptoe & Johnson LLPElected 2004 3, 5
Stephanie A. Streeter, 54Chief Executive OfficerLibbey Inc.Elected 2008 2, 5
G. Craig Sullivan, 71Retired Chairman & Chief Executive OfficerThe Clorox CompanyElected 2006 2, 4
Thomas H. Weidemeyer, 64Retired Senior Vice President & ChiefOperating OfficerUnited Parcel Service, and President, UPS AirlinesElected 2004 2, 4
Michael R. Wessel, 52PresidentThe Wessel Group Inc.Elected 2005 3
1 Audit Committee2 Compensation Committee3 Committee on Corporate Responsibility
and Compliance4 Finance Committee5 Governance Committee
CORPORATE OFFICERS
Richard J. Kramer, 48*Chairman of the Board, Chief Executive Officer & President12 years of service, officer since 2000
Darren R. Wells, 46Executive Vice President & Chief Financial OfficerNine years of service, officer since 2002
David L. Bialosky, 54Senior Vice President, General Counsel & SecretaryTwo years of service, officer since 2009
Jean-Claude Kihn, 52Senior Vice President & Chief Technical Officer 23 years of service, officer since 2008
Joseph B. Ruocco, 52Senior Vice President, Human ResourcesThree years of service, officer since 2008
Gregory L. Smith, 48Senior Vice President, Global OperationsFour months of service, officer since 2011
Bertram Bell, 60Assistant Secretary & Associate General Counsel29 years of service, officer since 2000
Scott A. Honnold, 47Vice President & TreasurerFour years of service, officer since 2010
Isabel H. Jasinowski, 63Vice President, Government Relations30 years of service, officer since 2001
Anthony E. Miller, 61Assistant Secretary & Associate General Counsel26 years of service, officer since 2000
Richard J. Noechel, 43Vice President & ControllerSeven years of service, officer since 2008
Mark W. Purtilar, 51Vice President & Chief Procurement OfficerFour years of service, officer since 2007
BUSINESS UNIT OFFICERS
Arthur de Bok, 49President, Europe, Middle East & Africa Business10 years of service, officer since 2005
Stephen R. McClellan, 46President, North American Tire24 years of service, officer since 2008
Daniel L. Smytka, 49President, Asia Pacific RegionThree years of service, officer since 2010
Jaime C. Szulc, 49President, Latin America RegionOne year of service, officer since 2010
Damon J. Audia, 41Senior Vice President, Finance, Asia Pacific RegionSeven years of service, officer since 2005
Michel Rzonzef, 48Vice President, Commercial Sales &Marketing Product Business Unit, Europe, Middle East & Africa Business 23 years of service, officer since 2008
Laura K. Thompson, 47Vice President, Finance, North American Tire28 years of service, officer since 2008
* Also a director
T H E G O O DY E A R T I R E & RU B B E R C O M PA N Y | 2 0 1 1 A N N UA L R E P O RT | 109
FACILITIES
NORTH AMERICA
United StatesAkron, Ohio
World headquarters, North American Tireheadquarters, innovation center, racing tires,chemicals, tire proving grounds, global pur-chasing, airship operations, research anddevelopment facilities
Bayport, Texas ChemicalsBeaumont, Texas Synthetic rubberCarson, California Airship operationsDanville, Virginia TiresFayetteville, North Carolina TiresGadsden, Alabama TiresHouston, Texas Synthetic rubberHuntsville, Alabama Tire proving groundsKingman, Arizona Aircraft tire retreadingLawton, Oklahoma TiresNiagara Falls, New York ChemicalsPompano Beach, Florida Airship operationsSan Angelo, Texas Tire proving groundsSocial Circle, Georgia Tread rubberStatesville, North Carolina Tire moldsStockbridge, Georgia Aircraft tire retreadingTonawanda, New York Tires, Goodyear Dunlop
Tires North America headquartersTopeka, Kansas TiresCanadaMedicine Hat, Alberta TiresNapanee, Ontario TiresValleyfield, Quebec Mixing center
EUROPE
BelgiumBrussels Goodyear Dunlop Tires Europe head-
quarters; Europe, Middle East & Africa Tireheadquarters
FranceAmiens TiresMireval Tire proving groundsMontlucon TiresRiom RetreadingGermanyFurstenwalde TiresFulda TiresHanau TiresPhilippsburg TiresRiesa TiresWittlich Tires, tire proving grounds, retreadingLuxembourgColmar-Berg Tires, innovation center, regional
calendaring center, tire proving grounds, tire molds
NetherlandsTilburg Aircraft tire retreadingPolandDebica TiresSloveniaKranj TiresUnited KingdomBirmingham TiresWolverhampton Mixing center, retreading
LATIN AMERICA
BrazilAmericana Tires, tire proving groundsSanta Barbara Retread materialsSao Paulo Latin American Tire headquarters,
aircraft tire retreadingChileSantiago TiresColombiaCali TiresPeruLima TiresVenezuelaValencia Tires
MIDDLE EAST & AFRICA
South AfricaUitenhage TiresTurkeyAdapazari TiresIzmit TiresUnited Arab EmiratesDubai Regional tire sales and distribution
ASIA
ChinaDalian TiresPulandian TiresShanghai Asia Pacific Tire headquartersIndiaAurangabad TiresBallabgarh TiresIndonesiaBogor TiresJapanTatsuno TiresMalaysiaKuala Lumpur TiresSingaporeSingapore Natural rubber purchasingThailandBangkok Tires, aircraft tire retreading
110| T H E G O O DY E A R T I R E & RU B B E R C O M PA N Y | 2 0 1 1 A N N UA L R E P O RT
CORPORATE OFFICES
The Goodyear Tire & Rubber Company1144 East Market StreetAkron, Ohio 44316-0001(330) 796-2121www.goodyear.com
GOODYEAR COMMON STOCK
The principal market for Goodyear common stock is the NewYork Stock Exchange (symbol GT).
On February 22, 2012, there were 19,580 shareholders of recordof Goodyear common stock. The closing price of Goodyear com-mon stock on the NYSE composite transactions tape on February22, 2012, was $13.15. Under Goodyear’s primary credit facilities,we are permitted to pay dividends on Goodyear common stockas long as no default will have occurred and be continuing, additional indebtedness can be incurred under the credit facilities following the payment, and certain financial tests are satisfied. So long as any of Goodyear’s mandatory convertiblepreferred stock is outstanding, no dividend, except a dividendpayable in shares of Goodyear common stock, or other sharesranking junior to the mandatory convertible preferred stock, may be paid or declared or any distribution be made on shares of Goodyear common stock unless all accrued and unpaid divi-dends on the then outstanding mandatory convertible preferredstock payable on all dividend payment dates occurring on orprior to the date of such action have been declared and paid orsufficient funds have been set aside for that payment. Goodyearhas not declared any cash dividends on its common stock in thethree most recent fiscal years.
ANNUAL MEETING
9 a.m., Tuesday, April 17, 2012, at the Corporate Offices.Please direct meeting inquiries to:Office of the Secretary, Dept. 822The Goodyear Tire & Rubber Company1144 East Market StreetAkron, Ohio 44316-0001
SHAREHOLDER INQUIRIES
Transfer Agent and Registrar:Computershare Trust Company, N.A.P.O. Box 43078Providence, RI 02940-3078(800) 317-4445www.computershare.comInquiries concerning the issuance or transfer of stock certificates or share account information should be directed to Computershare. Provide Social Security number, accountnumber and Goodyear’s ID, GTR.
Hearing-impaired shareholders can communicate directly withComputershare via a TDD by calling (800) 952-9245. Othershareholder inquiries should be directed to: Investor Relations, Dept. 635The Goodyear Tire & Rubber Company1144 East Market StreetAkron, Ohio 44316-0001(330) 796-3751E-mail: [email protected]
FORM 10-K AND OTHER REPORTS
Paper copies of Goodyear’s Annual Report on Form 10-K areavailable upon request. Quarterly reports on Form 10-Q are alsoavailable on request. Copies of any of the above or Goodyear’sProxy Statement may be obtained without charge by writing:Investor Relations, Dept. 635The Goodyear Tire & Rubber Company1144 East Market StreetAkron, Ohio 44316-0001or by calling our Financial Report Distribution Center at (330) 796-3751Copies of these reports may also be obtained from the company’sWeb site http://www.goodyear.com/investor.
Goodyear has included as Exhibits 31.1, 31.2 and 32.1 to itsAnnual Report on Form 10-K for the year ended December 31,2011, filed with the Securities and Exchange Commission, certificates of Goodyear’s Chief Executive Officer and ChiefFinancial Officer with respect to the Form 10-K. We have also filed with the New York Stock Exchange the most recentannual CEO certification as required by Section 303A.12(a) of the NYSE Listed Company Manual.
CD RECORDING
A CD recording of the 2011 Annual Report is available for visually impaired shareholders by contacting Goodyear InvestorRelations at (330) 796-3751.
INDEPENDENT REGISTERED
PUBLIC ACCOUNTING FIRM
PricewaterhouseCoopers LLP200 Public Square, 18th FloorCleveland, Ohio 44114-2301
CORPORATE RESPONSIBILITY REPORT
A report pertaining to Goodyear’s corporate responsibility initiatives may be obtained by contacting Goodyear GlobalEnvironmental Engineering at (330) 796-7377.
SHAREHOLDER INFORMATION
T H E G O O DY E A R T I R E & RU B B E R C O M PA N Y | 2 0 1 1 A N N UA L R E P O RT | 111