100
The Great Recession: Subprime Meltdown Michael Ka Yiu Fung Professor in Business Economics CUHK Business School 1
| Date post: | 15-Jan-2016 |
| Category: |
Documents |
| Upload: | arron-lawson |
| View: | 227 times |
| Download: | 1 times |

The Great Recession:Subprime Meltdown
Michael Ka Yiu Fung
Professor in Business Economics
CUHK Business School
1

The Great Depression
• August 1929 – March 1933:
1. Duration: 43 months
2. Highest unemployment rate: 24.9%
2

The Great Depression
• August 1929 – March 1933:
1.Highest unemployment rate: 24.9%
2.Change in real GDP: -28.8%
3

The Great Recession
• December 2007 – June 2009:
1. Duration: 18 months
2. Highest unemployment rate: 10%
3. Change in real GDP: - 5.1%
4

The Great Recession
“By many measures, the financial crisis of 2007 to 2009 caused the deepest recession in the U.S. and world economies in more than 50 years. … while a repeat of the Depression was avoided, the “Great Recession,” as it is coming to be called, shook the U.S. and World economies in ways that almost no one thought was possible.” (Jones 2011)
5

The Great Recession:Subprime Meltdown
6

Causes: Economic Growth
Source: The World Bank, http://data.worldbank.org/data-catalog
7

Causes: Economic Growth
Source: U.S. Department of Commerce, Bureau of Economics Analysis, http://www.bea.gov/national/index.htm#gdp
8

Causes: Economic Growth• Information Technology
• New Growth Theory: Importance of Technology/ Innovative Ideas (Jones 2011) -
1. Paul Romer: objects and ideas. Objects include most economic goods. Ideas are instructions, designs for making objects, or recipes.
1. Properties of “ideas” – Non-rivalry and Increasing returns
9

Causes: Globalization
Trade and Capital Flows
10
Causes: Globalization
• The average worldwide tariff on manufacturing goods fell from about 14 percent in the early 1960s to 4 percent by 2000. (Jones 2011)
11
Causes: Globalization
“The average cost of moving a ton a mile in 1890 was 18.5 cents
(in 2001 dollars). Today, this cost is 2.3 cents. … Two factors
have acted to decrease the importance of transportation costs for
goods. First, the technologies designed for moving goods have
improved. Second, the value of goods lies increasingly in quality,
rather than quantity, so that we are shipping far fewer tons of
goods relative to GDP than we have in the past.” (Glaeser and
Kohlhase 2003)
12
Causes: Globalization
• Trade and efficiency• Efficiency and economic growth
13
Causes: Globalization
• Both imports and exports have risen from under 5 percent of GDP in the 1950s to as much as 17 or 12 per cent of GDP before the financial crisis.
• Since 1975, the United States has experienced large trade deficits. Indeed, by 2006, the trade deficit had reached 5.7 percent of GDP.
14

Causes: Globalization
15

Causes: Globalization
Source: The World Bank, http://data.worldbank.org/data-catalog
16
Causes: Globalization
• The United States is now a net debtor to the rest of the world. Net foreign debt reached nearly 25 percent of GDP in 2009.
17

Causes: Globalization
The Global Saving Glut:
“While developing countries on net borrowed $88 billion in 1996 from the rest of the world, by 2003 they were instead saving a net $205 billion into the world’s capital markets. … This demand for investments contributed to rising asset markets in the United States, including the stock market and the housing market.”
(Jones 2011)
18
Causes: The US Interest Rates
The U.S. FED Fund Rate - liquidity
19

Causes: The US Interest Rates
Source: The Federal Reserve Bank, http://www.federalreserve.gov/monetarypolicy/openmarket.htm#2008
20
Causes: The US Interest Rate
• In the period from 1980 to 2001, the Federal Funds rate had generally tracked economic conditions. After 2001 and until July 2004, however, the Fed kept interest rates low in spite of signs of growth in output and prices. Perhaps fearing a recession that did not materialize, the Federal Funds rate was set to only 1 percent from July 2003 to July 2004. (Rotemberg 2008).
21

The US Housing Market
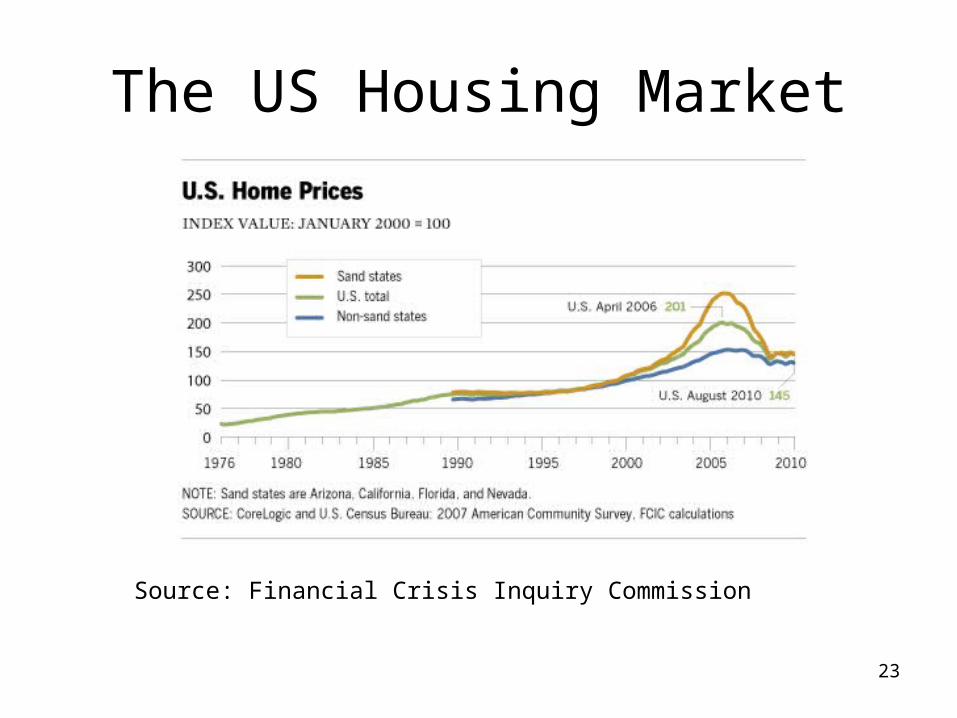
• Average house prices across the United States had risen steadily since 1975 and reached about 12 percent per annum in late 2005 and early 2006. (Rotemberg 2008).
22
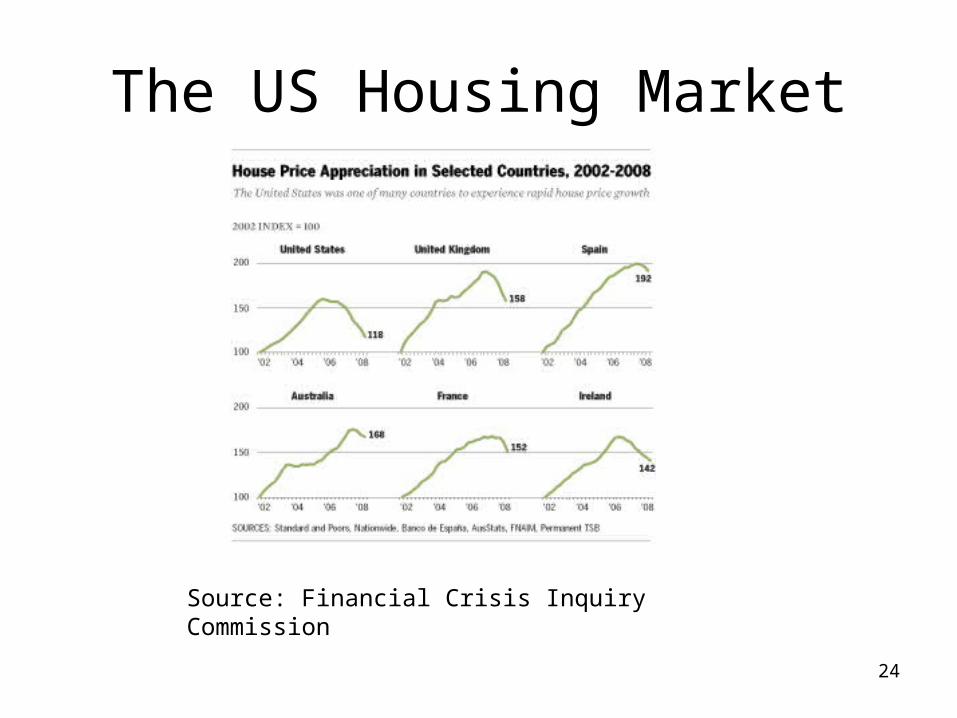
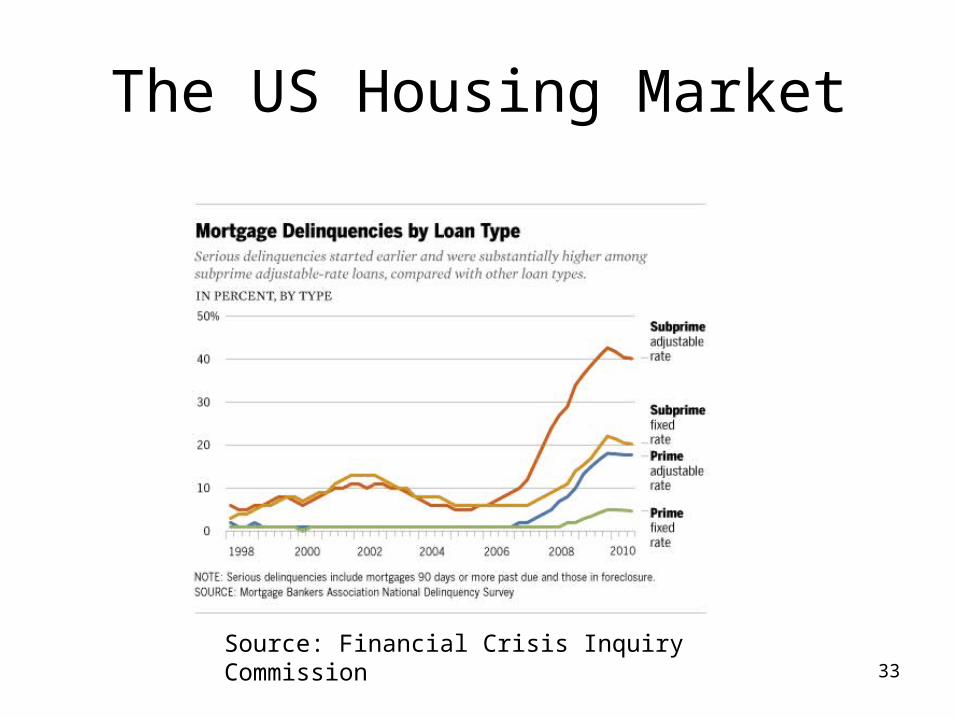
Source: Financial Crisis Inquiry Commission
The US Housing Market
23
Source: Financial Crisis Inquiry Commission
The US Housing Market
24

The US Housing Market
• Professor Chris Mayer of Columbia University: ”There is no natural law that says U.S. housing prices have to stop here. None.” (Rotemberg 2008).
25

The US Housing Market
• ”Traditional” fixed 30-year mortgage
• 2/28 mortgages
26

The US Housing Market
• “Subprime” borrowers: loan applications did not meet existing standards – poor credit records or high existing debt-to-income ratios.
27

The US Housing Market
• One obvious difference between “subprime” and “prime” loans was that the former had higher interest rates and fees: 29% of the home loans made in 2006 had high interest rates (Rotemberg 2008).
28
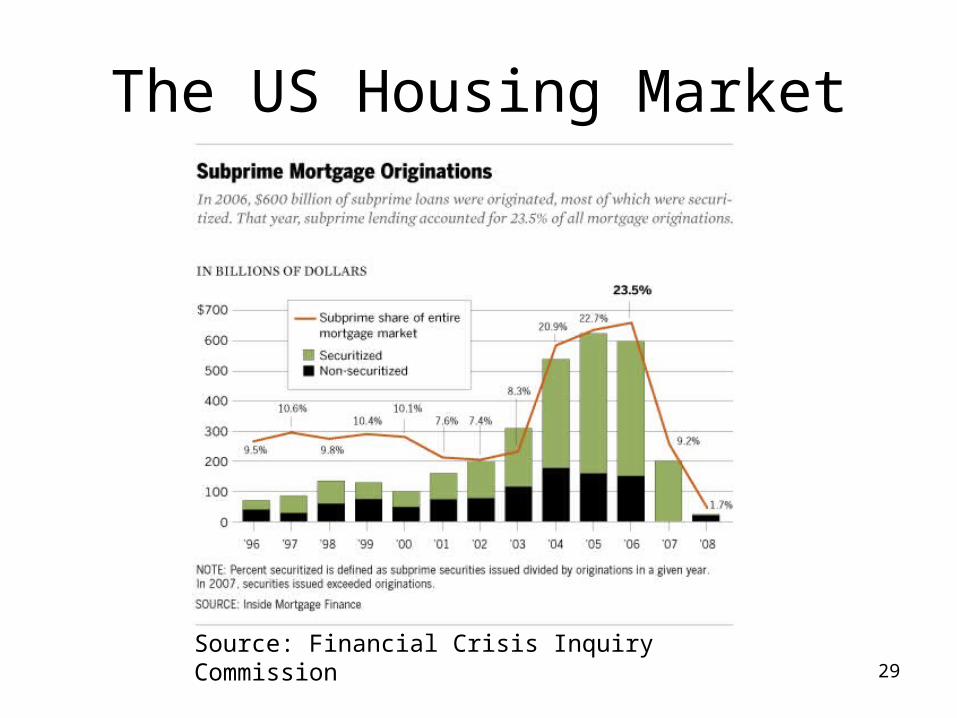
Source: Financial Crisis Inquiry Commission
The US Housing Market
29
The US Housing Market
• As long as housing prices increased, these mortgages were secure: the borrower rapidly accumulated equity in the house that could be taken out in a refinance, allowing the mortgage to be repaid. (Rotemberg 2008)
30

The US Housing Market
• Between May 2004 and May 2006, the Fed raised its interest rate from 1.25 percent to 5.25 percent in part because of concerns over increases in inflation.
31
The US Housing Market
• According to Bernanke, by August 2007, nearly
16% of subprime mortgages with adjustable
rates were in default. The problem then spiraled,
as low housing prices led to defaults, which, in a
vicious cycle, lowered housing prices even
more. (Jones 2011)
32
Source: Financial Crisis Inquiry Commission
The US Housing Market
33
Subprime Meltdown
Two questions:
1. Why was the shock of sub-prime mortgages in such a large scale?
2. How did the (U.S. housing sector) shock transmit to the U.S. financial sector and then other economies?
34

Causes: Financial Innovations• Securitization: Like a decadent buffet at an expensive
hotel, securitization involves lumping together large numbers of individual financial instruments such as mortgages and then slicing and dicing them into different pieces that appeal to different types of investors. A hedge fund may take the riskiest piece in the hope of realizing a high return. A pension fund may take a relatively safe portion, constrained by the rules under which it operates. (Jones 2011)
35
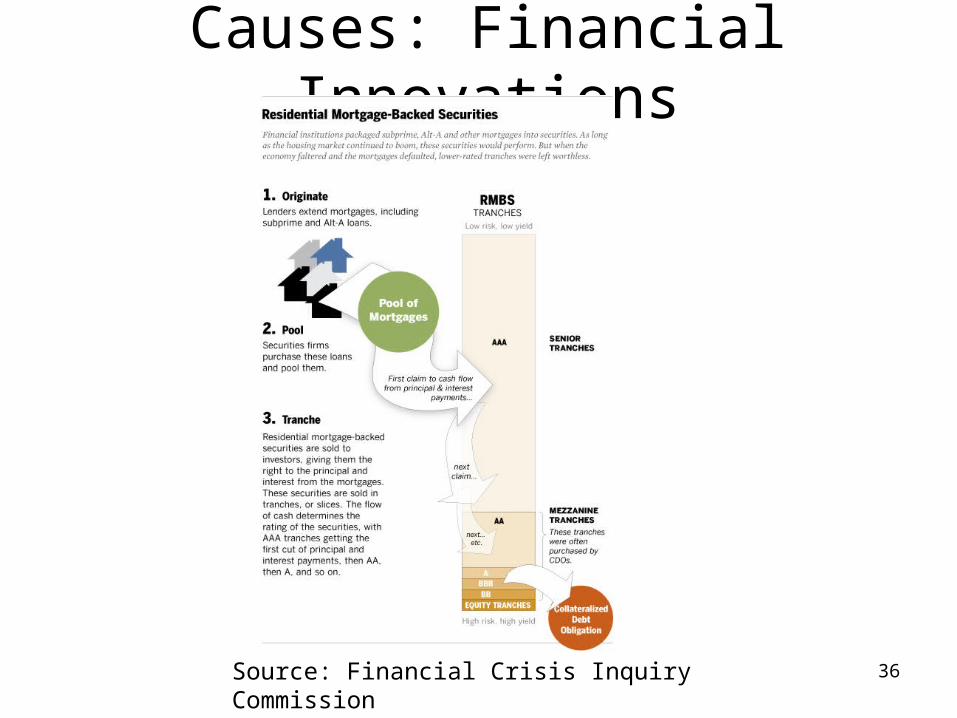
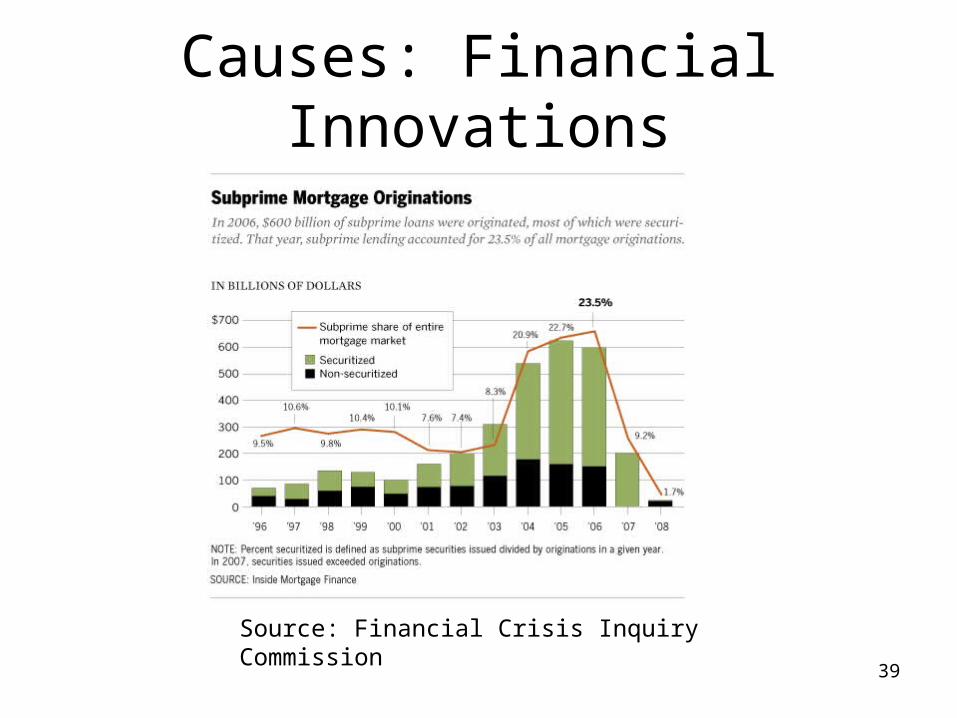
Causes: Financial Innovations
Source: Financial Crisis Inquiry Commission 36
Causes: Financial Innovations
• According to a Lehman Brothers report, a substantial fraction of subordinate MBS (Mortgage-backed Securities) securities (those rated below AAA) were held by collateralized debt obligation (CDO) entities in 2007. It was common for CDOs to hold assets of other CDOs. CDOs were also heavily involved in markets for derivatives securities (CDS). (Rotemberg 2008)
37

Source: Financial Crisis Inquiry Commission
Causes: Financial Innovations
38
Source: Financial Crisis Inquiry Commission
Causes: Financial Innovations
39
Causes: Financial Innovations
• Rating agencies generously applied favorable ratings to wide variety of assets. Since agencies profited at the issuance of an asset grade and were not paid based on the asset’s actual performance, the incentives of rating agencies were in question. Under criticism as well was their methodology for rating assets. One argument rating agencies, and also government regulators, was that they did not offer the compensation or prestige to attract top quality talent and so would always be a step behind financial innovation. (Segel and Creo 2010)
40
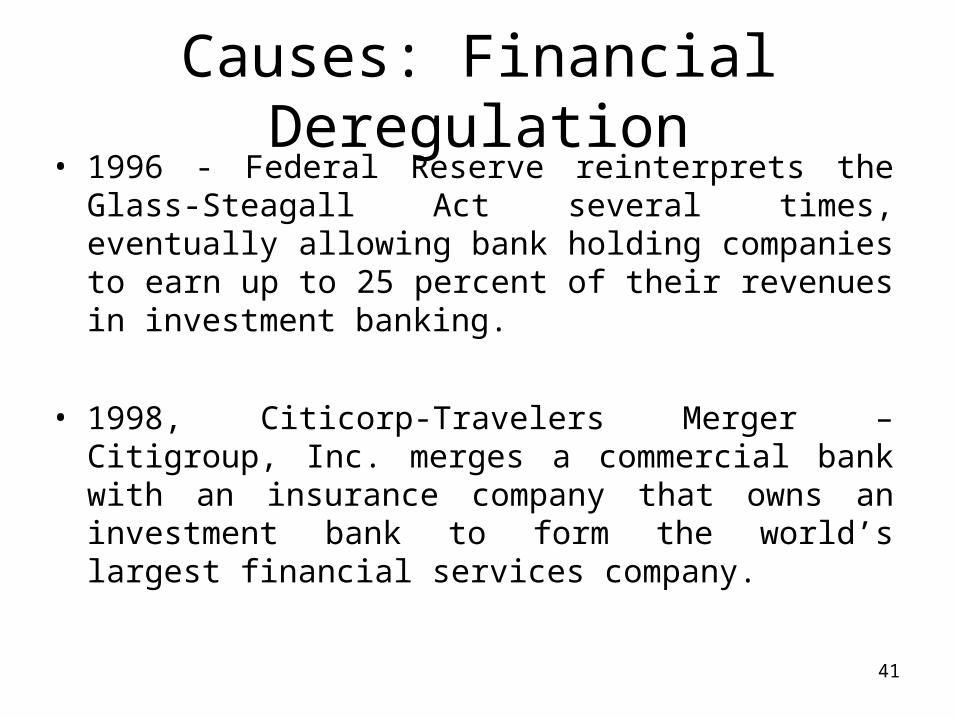
Causes: Financial Deregulation• 1996 - Federal Reserve reinterprets the Glass-Steagall
Act several times, eventually allowing bank holding companies to earn up to 25 percent of their revenues in investment banking.
• 1998, Citicorp-Travelers Merger – Citigroup, Inc. merges a commercial bank with an insurance company that owns an investment bank to form the world’s largest financial services company.
41
Causes: Financial Deregulation
• 2000 - Commodity Futures Modernization Act – The bill prevented the Commodity Futures Trading Commission from regulating most over-the-counter derivative contracts, including credit default swaps.
42
Causes: Financial Deregulation
• 2004 - Voluntary Regulation – The SEC proposes a system of voluntary regulation, allowing investment banks to hold less capital in reserve and increase leverage.
43

Subprime Meltdown
• The investors who were holding these mortgage-backed securities often turned out to be the large commercial and investment banks themselves.
44

Subprime Meltdown
• Liquidity crisis – a situation in which the volume of transactions in some financial markets falls sharply, making it difficult to value certain financial assets and thereby raising questions about the overall value of the firms holding those assets.
45

Subprime Meltdown
• Another important feature of the financial crisis is that it was global in scope. In 2009, real GDP declined for the world as a whole, the first time this has happened in many decades.
46

Balance-sheet Crisis
• A balance sheet consists of two columns. On the left are the assets of the institution – items of value that the institution owns. On the right are the liabilities – items of value that the institution owes to others.
47

A Hypothetical Bank’s Balance Sheet (billions of dollars)
Source: Jones (2011)
Assets Liabilities
Loans 1,000 Deposits 1,000
Investments 900 Short-term debt 400
Cash and reserves 100 Long-term debt 400
Total assets 2,000 Total liabilities 1,800
Equity (net worth) 200
48

Balance-sheet Crisis
• Banks are subject to various financial regulations:1. Reserve requirement mandates that banks keep a
certain percentage of their deposits in a special account (“on reserve”) with the central bank.
2. Capital requirement mandates that the capital (net worth) of the bank be at least a certain fraction of the bank’s total assets.
49

Balance-sheet Crisis
• Leverage is the ratio of total liabilities to net worth.
• If the leverage ratio is 9, for every $10 of assets the bank holds, $9 is essentially financed by borrowing. Leverage magnifies both the gains and losses on investments.
• Before the financial crisis, major investment banks had high leverage ratios. For example, when Bear Stearns collapsed, its leverage was 35 to 1. Roughly speaking, the major investment banks owned complex investment portfolios, including significant quantities of soon-to-be toxic assets, that were financed with $3 of their own equity and $97 of borrowing. Given this extraordinary leverage, major investment banks were in such a precarious position that a relatively small aggregate shock could send them over the insolvency edge. (Jones 2011)
50

Balance-sheet Crisis
• The bank is insolvent or bankrupt when the assets owned by the bank would be no longer be large enough to cover the liabilities that the bank owes to others.
51
Balance-sheet Crisis
• Financial institutions often have relatively large amounts of short-term
debt (commercial papers), in part to provide liquidity as they manage
their deposits, loans, and investments.
• In the last months of 2008 following the collapse of Lehman Brothers,
interest rates on commercial paper rose sharply by more than 5
percentage points, and access to this form of liquidity was sharply
curtailed. To fund their daily operations, banks might then have been
forced to sell some of their less liquid assets at “fire sale” prices,
reducing their net worth – potentially all the way to insolvency. (Jones
2011)52

Source: Jones (2011)
Bank B’s Balance Sheet
Assets Liabilities
Cash 1,000 Deposits 1,400
Loan to bank C 500
Total assets 1,500 Total liabilities 1,400
Equity (net worth) 100
Bank C’s Balance Sheet
Assets Liabilities
Mortgage-backed securities 800 Deposits 200
Loan from bank B 500
Total assets 800 Total liabilities 700
Equity (net worth) 10053
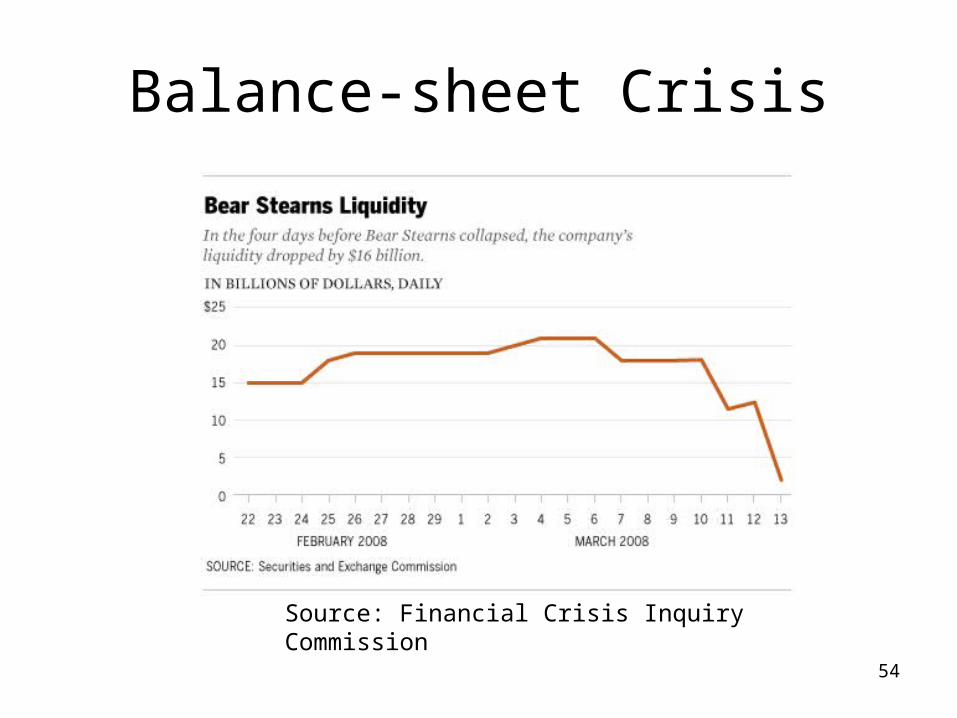
Source: Financial Crisis Inquiry Commission
Balance-sheet Crisis
54

Balance-sheet Crisis
• Systemic risk: The declines in housing prices and the
stock market combined with leverage to threaten the
solvency of many financial institutions. Because the
financial system is so integrated – financial institutions
borrow and lend large sums with each other every day in
normal times – problems in a few banks can create a
systemic risk for the global financial system as a whole.
(Jones 2011)
55

Source: Financial Crisis Inquiry Commission
Balance-sheet Crisis
56

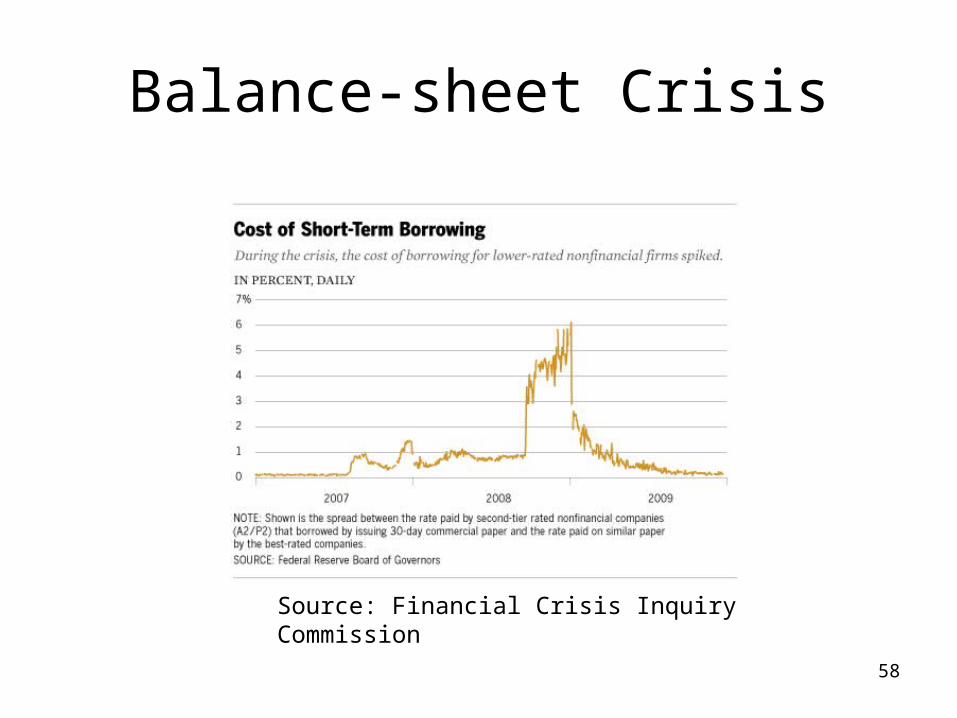
Source: Financial Crisis Inquiry Commission
Balance-sheet Crisis
57
Source: Financial Crisis Inquiry Commission
Balance-sheet Crisis
58

Subprime Meltdown
• December 2007 – June 2009:
1. Duration: 18 months
2. Highest unemployment rate: 10%
3. Change in real GDP: - 5.1%
59
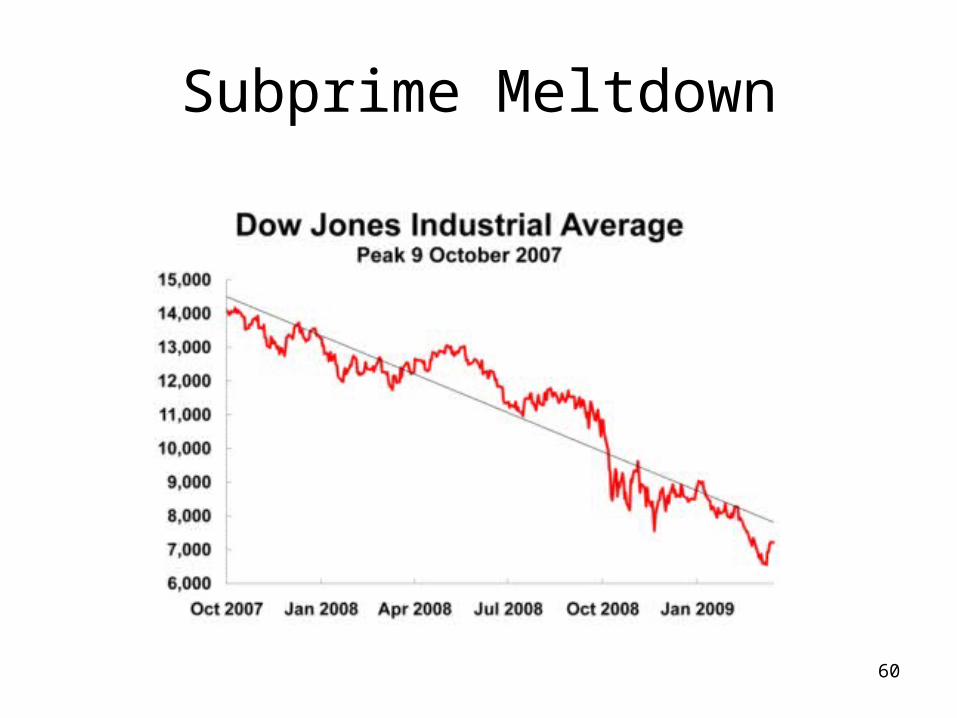
Subprime Meltdown
60

Subprime Meltdown
• September 29, 2008: The biggest single-day loss ever in the history of the Dow occurred on, when it dropped 777.68 points, or approximately $1.2 trillion in market value.
61

Source: Financial Crisis Inquiry Commission
Subprime Meltdown
62
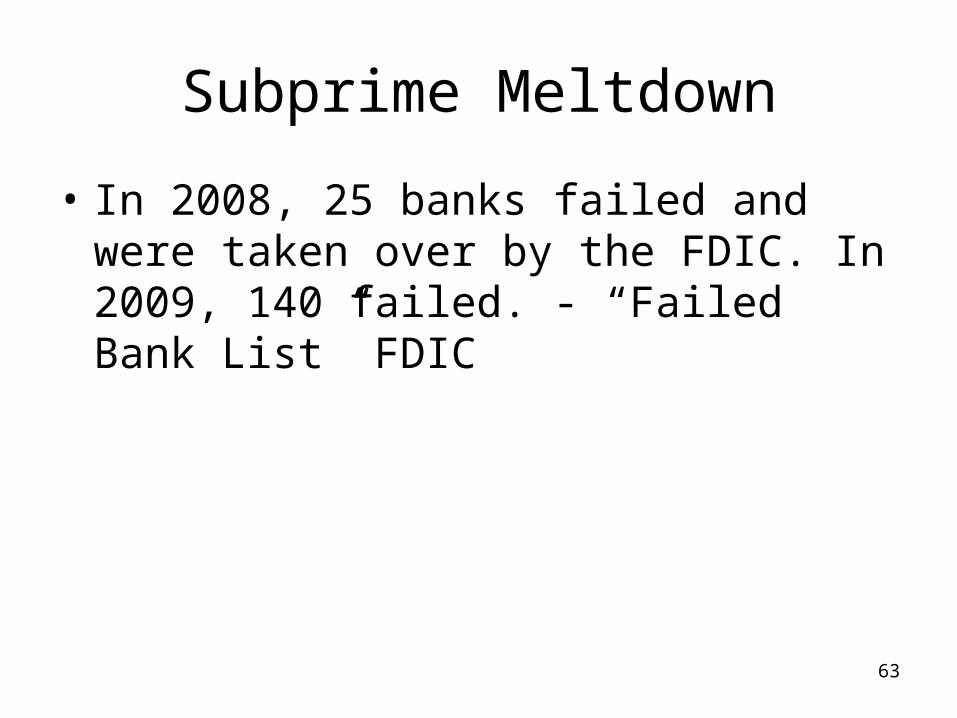
Subprime Meltdown
• In 2008, 25 banks failed and were taken over by the FDIC. In 2009, 140 failed. - “Failed Bank List” FDIC
63
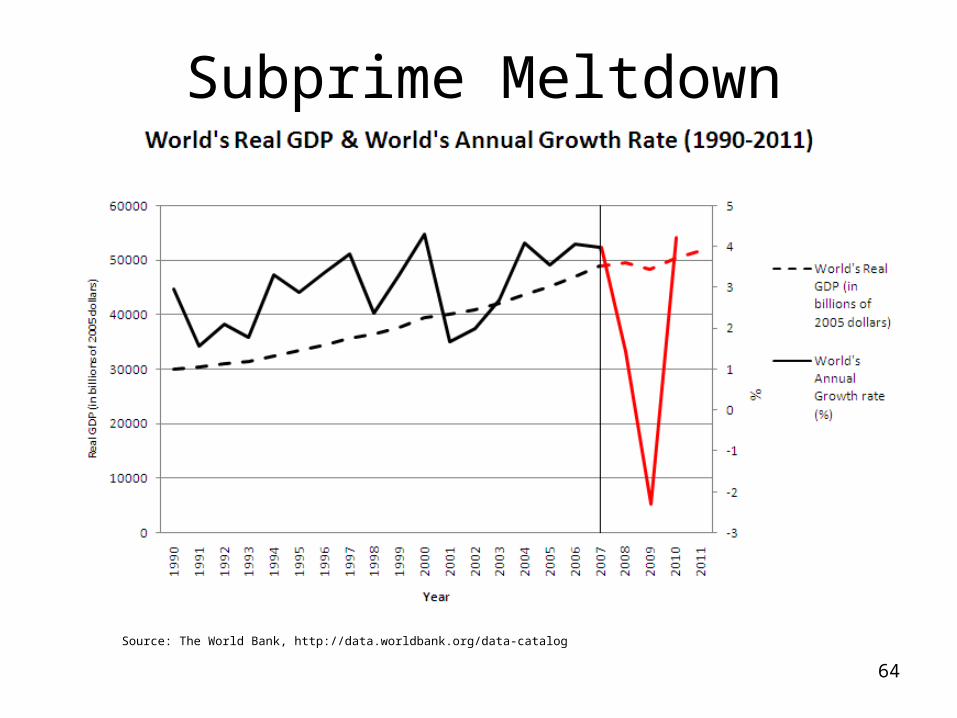
Subprime Meltdown
Source: The World Bank, http://data.worldbank.org/data-catalog
64

Policy
• In the course of two weeks in September 2008, the
government took over the mortgage companies Fannie
Mae and Fredic Mac, Lehman Brothers collapsed into
bankruptcy, Merrill Lynch was sold to Bank of America,
and the Federal Reserve organized an $85 billion bailout
of AIG. (Jones 2011)
65
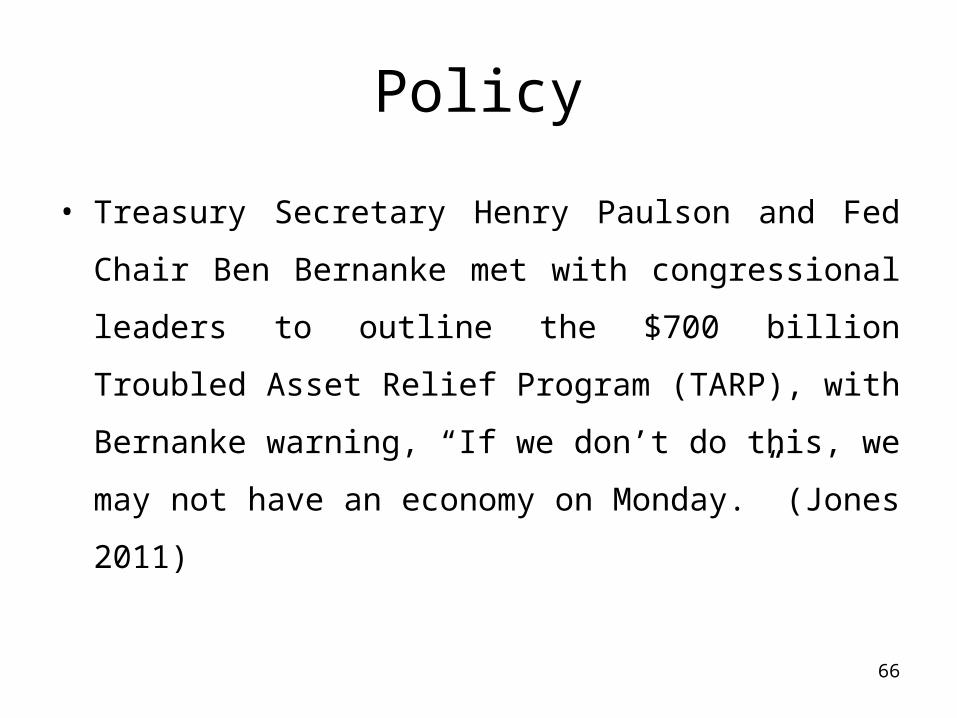
Policy
• Treasury Secretary Henry Paulson and Fed Chair Ben
Bernanke met with congressional leaders to outline the
$700 billion Troubled Asset Relief Program (TARP), with
Bernanke warning, “If we don’t do this, we may not have
an economy on Monday.” (Jones 2011)
66

Monetary Policy
Source: The Federal Reserve Bank, http://www.federalreserve.gov/monetarypolicy/openmarket.htm#2008
67
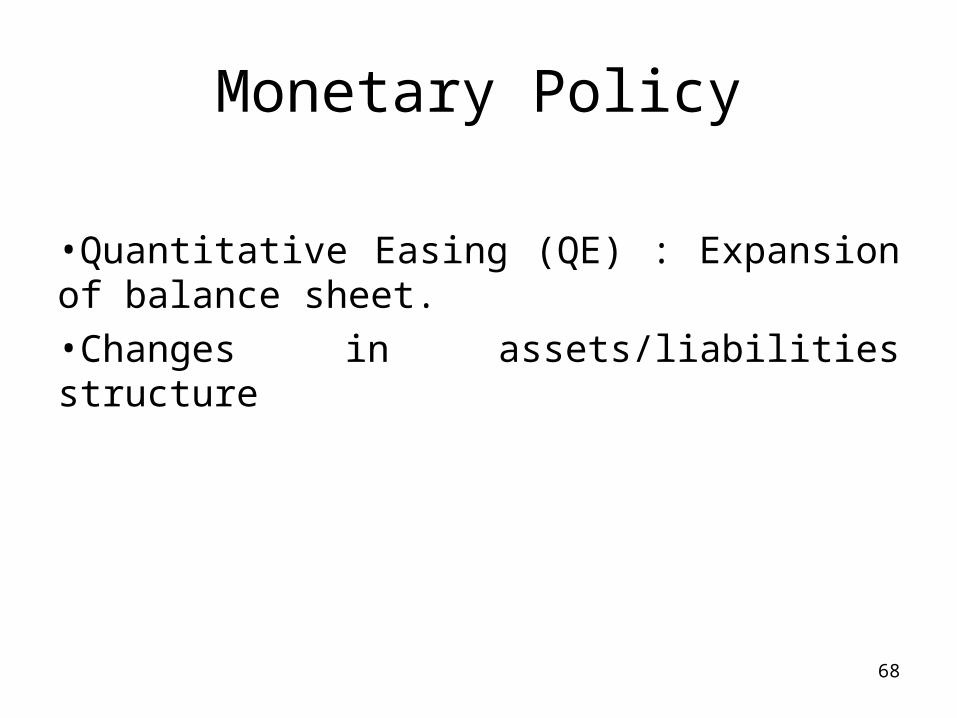
Monetary Policy
•Quantitative Easing (QE) : Expansion of balance sheet.•Changes in assets/liabilities structure
68

Monetary Policy
The Fed’s balance sheet (May 2007):•Total assets and total liabilities were $906 billion. •The bulk of the assets were U.S. Treasury securities, and the bulk of the liabilities consisted of currency held by the public.•This situation reflects the mechanics of monetary policy whereby the Fed essentially buys and sells U.S. government bonds in exchange for currency in order to set the Fed fund rate.
69
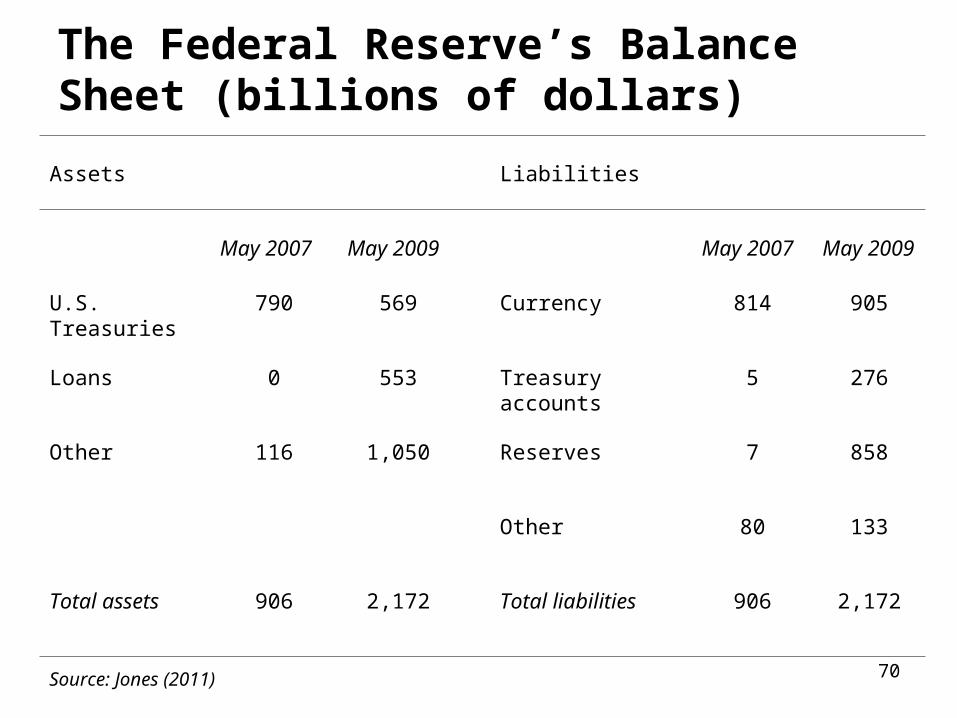
The Federal Reserve’s Balance Sheet (billions of dollars)
Assets Liabilities
May 2007 May 2009 May 2007 May 2009
U.S. Treasuries 790 569 Currency 814 905
Loans 0 553 Treasury accounts 5 276
Other 116 1,050 Reserves 7 858
Other 80 133
Total assets 906 2,172 Total liabilities 906 2,172
Source: Jones (2011) 70

Monetary Policy
The Fed’s balance sheet (May 2009):•Total assets and total liabilities were $2172 billion. •The Fed expanded its lending to the rest of the economy, not only to financial institutions but also to non-financial corporations. This lending came either in the form of loans or through the purchase of securities like commercial paper.
71
Monetary Policy
The Fed’s balance sheet (May 2009):•The Fed did not finance this additional lending by printing money. •These funds came from two sources: borrowing from the U.S. Treasury and excess reserves from the banks. •Banks kept the funds as reserves with the Fed rather than lending them out to the private sector.
72

Fiscal Policy
October 2008 - Troubled Asset Relief Program (TARP)
• This program established a $700 billion fund to be used by the Treasury to purchase and insure assets held by financial institutions in an effort to strengthen the financial system and encourage lending.
• AIG, Citigroup, Bank of America, JP Morgan, Goldman Sachs, Morgan Stanley, General Motors, Chrysler, …
73

Fiscal Policy
• February 2009 American Recovery and Reinvestment Act
• $787 billion package designed to stimulate aggregate demand in the economy.
• Tax cuts and new government spending on unemployment benefits, infrastructure, education, health care, and aid to state and local governments.
74

Financial Reform• What changes to the financial system will
minimize the likelihood of another financial crisis?
75
Financial Reform
• The economic cost of financial crisis was mainly borne by people outside the finance industry.
76

Financial Reform
• “Too big to fail”
• “Heads, I win; tails, the economy loses”
• Moral hazard
77

Source: Financial Crisis Inquiry Commission
Financial Reform
78

Financial Reform
• Link executive compensations to long-term performance.
79

Financial Reform
• BASEL III: capital requirements (2013 – 2019), leverage ratio (2011 – 2018) and liquidity requirements (2011 – 2018)
• Volcker Rule to restrict United States banks from making certain kinds of speculative investments that do not benefit their customers
80

Teaching Macro Principles after the Financial Crisis
Alan Blinder
81
Teaching Macroeconomics
• Interest in economics has grown, and our students will want, expect, and deserve explanations of these events for years to come. This is truly a teaching moment, and that moment is going to be a long one.
82

Teaching Macroeconomics
• The bad news is that the current curriculum fails to give students even imperfect answers. This means that the macro principles course will have to be changed.
83

Four Basic Pedagogical Decisions
• The first major pedagogical choice is the relative degree of emphasis on growth versus business cycles.
84

Four Basic Pedagogical Decisions
• A second and related decision that both textbook authors and instructors must make is how Keynesian to make their books or courses: the Keynesian multiplier model and consumption function.
85

Four Basic Pedagogical Decisions
• A third decision that textbook authors really must rethink is the one-interest-rate model.
86

Four Basic Pedagogical Decisions
• The fourth and final major pedagogical decision is how complex the model must be, especially in the financial domain, in order to convey the appropriate story to our students.
87

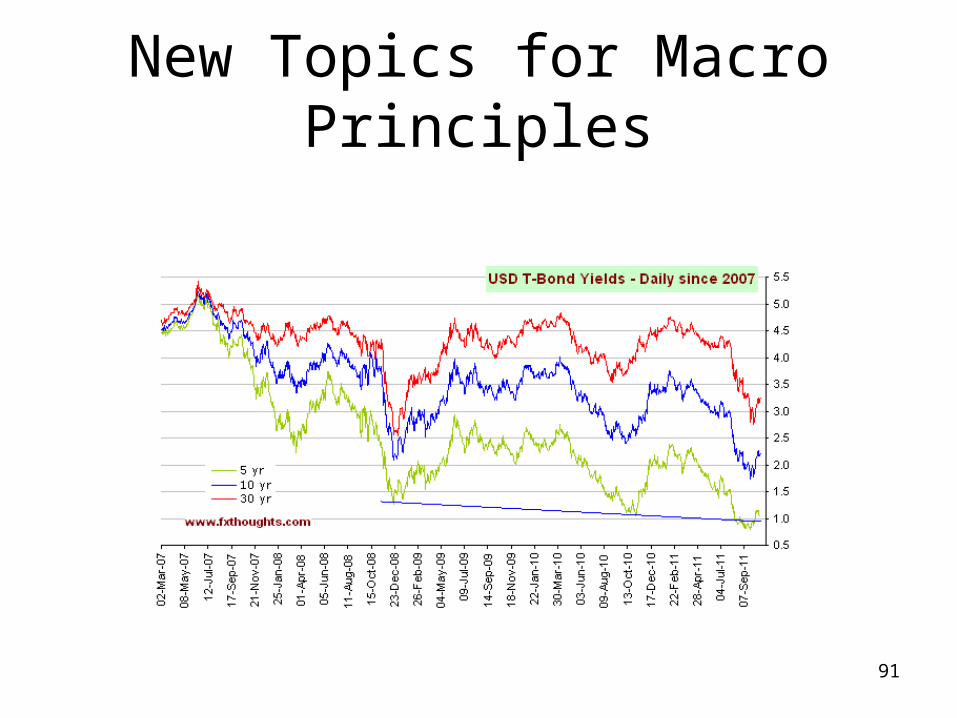
New Topics for Macro Principles
• Risk premiums in interest rates
88

New Topics for Macro Principles
89

New Topics for Macro Principles
• Asset-market bubbles
90
New Topics for Macro Principles
91

New Topics for Macro Principles
• Leverage
92

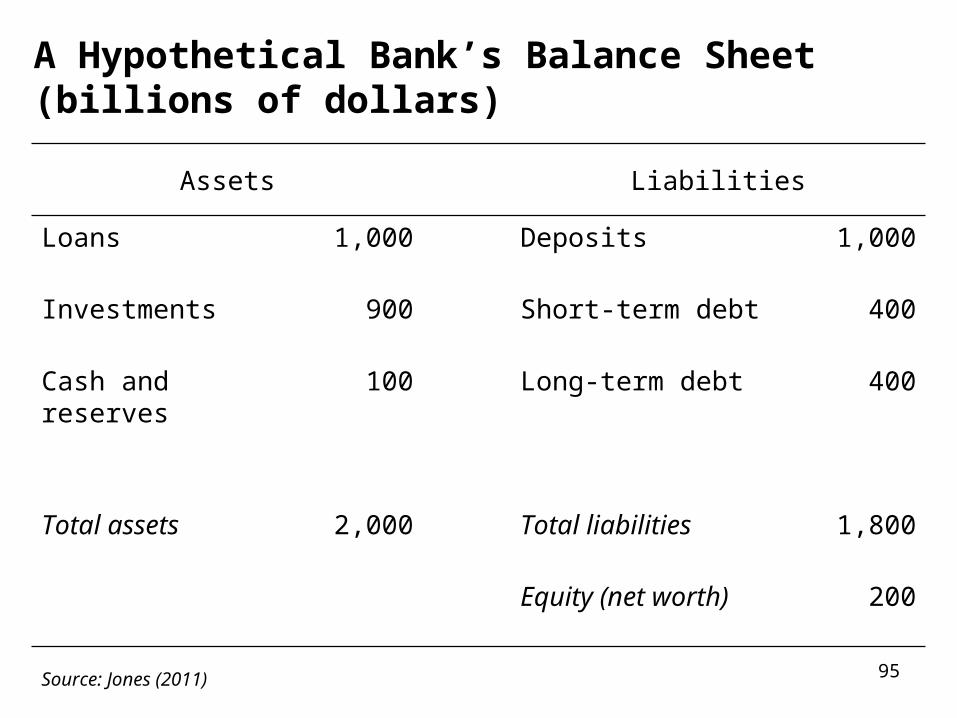
A Hypothetical Bank’s Balance Sheet (billions of dollars)
Source: Jones (2011)
Assets Liabilities
Loans 1,000 Deposits 1,000
Investments 900 Short-term debt 400
Cash and reserves 100 Long-term debt 400
Total assets 2,000 Total liabilities 1,800
Equity (net worth) 200
93

New Topics for Macro Principles
• Insolvency and illiquidity
94
A Hypothetical Bank’s Balance Sheet (billions of dollars)
Source: Jones (2011)
Assets Liabilities
Loans 1,000 Deposits 1,000
Investments 900 Short-term debt 400
Cash and reserves 100 Long-term debt 400
Total assets 2,000 Total liabilities 1,800
Equity (net worth) 200
95
New Topics for Macro Principles
• Too big to fail: systemic risk and moral hazard
96
References
Alan Blinder (2010): Teaching Macro Principles after the Financial Crisis, The Journal of Economic Education, 41:4, 385-390.
Charles I. Jones. Macroeconomics (W.W. Norton). 2010 (economic crisis update).
Julio Rotemberg. “Subprime Meltdown: American Housing and Global Financial Turnmoil.” Harvard Business School Teaching Case 9 – 708 – 042, 2008.
Segel, Arthur I., and Ben Creo. “Understanding the Credit Crisis of 2007 to 2008.” Harvard Business School Background Note 209-073, August 2010. (Revised from original October 2008 version.)
97

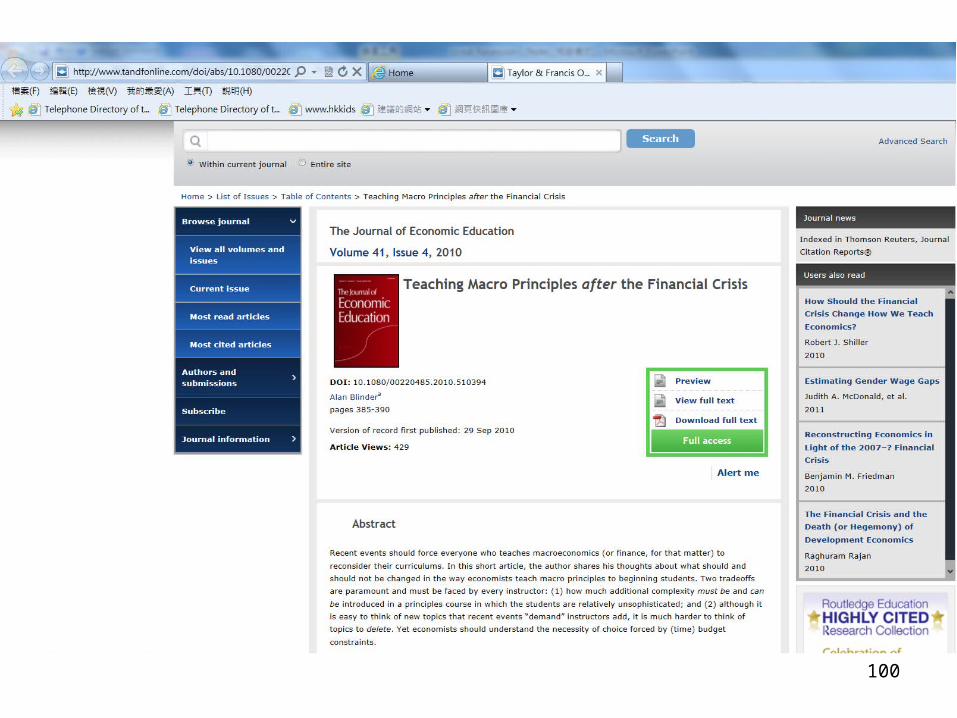
Suggested Reading
The Journal of Economic Education
• Publication details, including instructions for authors and
• subscription information:
• http://www.tandfonline.com/loi/vece20
Teaching Macro Principles after the
Financial Crisis
• Alan Blinder a
• a Princeton University
• Available online: 29 Sep 2010
98
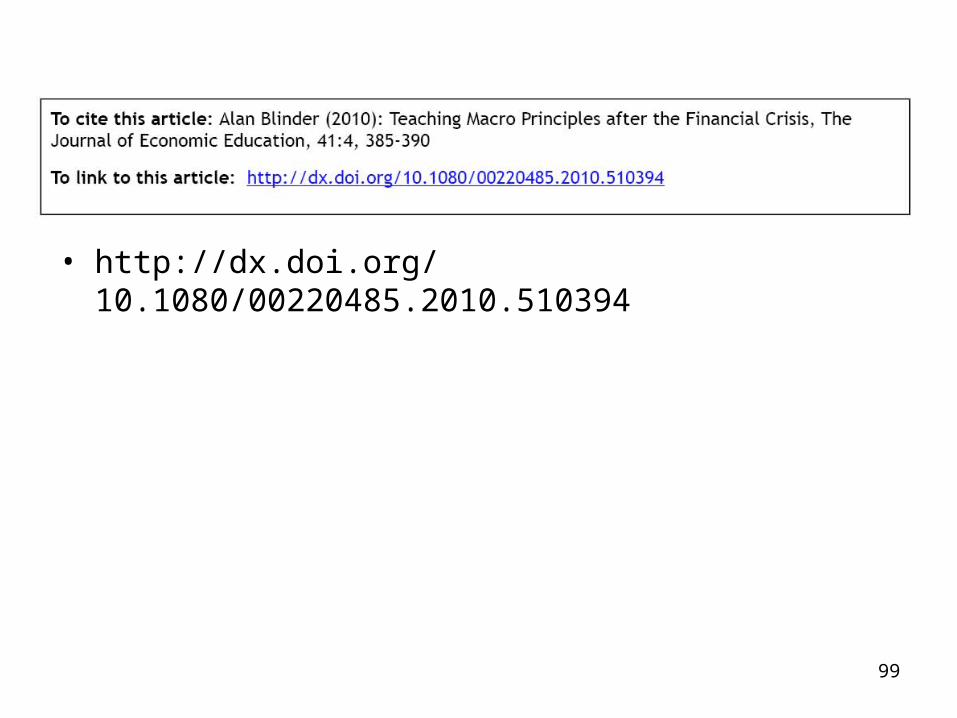
• http://dx.doi.org/10.1080/00220485.2010.510394
99
100


