The Greek Climate Change Action Plan contents, way to implement, monitor and outputs of application of mitigation measures set in CAPACITY BUILDING IN BALKAN COUNTRIES IN ORDER TO DEAL WITH CLIMATE CHANGE PROBLEM
Transcript
The Greek Climate Change Action Plan
contents, way to implement, monitor and outputs of application of mitigation measures set in
CAPACITY BUILDING IN BALKAN COUNTRIES IN ORDER TO DEAL WITH CLIMATE CHANGE PROBLEM
Brief history
1992: United Nations Framework Convention for Climate Change 1994: Ratification of the UNFCCC by the Greek Parliament.
Preparation of the 1st Greek Climate Change Action Plan and submission to the UNFCCC of the 1st National Communication.
The Greek government taking into consideration both economic and social parameters, agreed that a realistic objective for Greece is the restriction of the overall increase of GHG emissions to 15 3%.
1997: Submission to the UNFCCC of the 2nd Greek National Communication.
1997: Kyoto Protocol 2001: Preparation of the 2nd Greek Climate Change Action Plan
and the 3rd National Communication.
±
Greece is going to ratify Kyoto Protocol before June 2002
Obligations of all EU countries for the reduction of the emissions of 6 GHG in the period 2008-2012 compared to 1990 levels
Overseeing of the National Policy and the implementation of the FCCC
Overseeing of all the climate change related projects, programs and research activities
Ensuring the consistence of the climate change policies and the national development priorities
Ensuring the information of all the stakeholders Developing the negotiating positions and strategies for the Country Reviewing and finalizing the various components of the NC
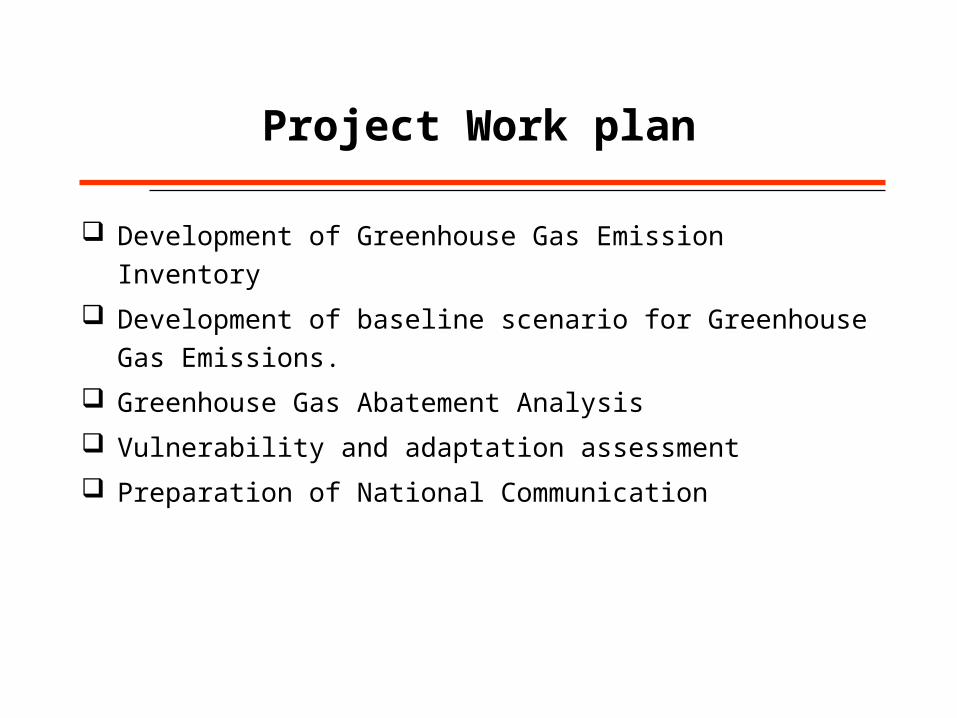
Project Work plan
Development of Greenhouse Gas Emission Inventory
Development of baseline scenario for Greenhouse Gas Emissions.
Greenhouse Gas Abatement Analysis
Vulnerability and adaptation assessment
Preparation of National Communication
Preparation of National Communication
Preparation of the draft National Communication
Circulation of the draft NC
Finalisation of the draft NC
Submission of the draft NC to national government
Finalisation, translation and publication of the NC
Submission of the initial NC to the UNFCC Secretariat
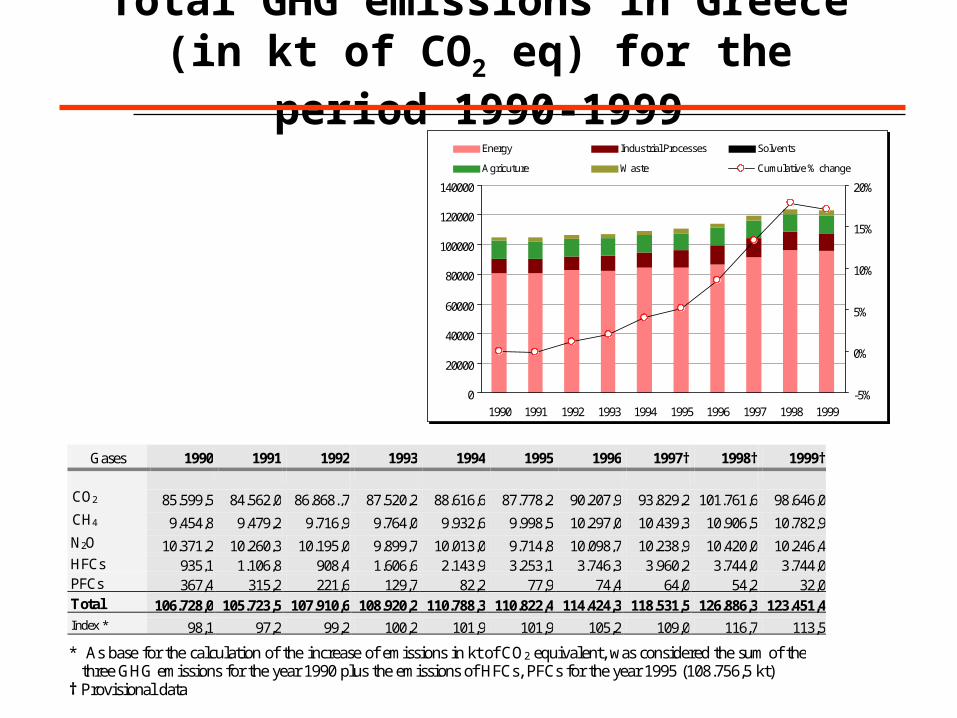
Total GHG emissions in Greece (in kt of CO2 eq) for the period 1990-1999
* As base for the calculation of the increase of emissions in kt of CO2 equivalent, was considered the sum of the three GHG emissions for the year 1990 plus the emissions of HFCs, PFCs for the year 1995 (108.756,5 kt)
† Provisional data
0
20000
40000
60000
80000
100000
120000
140000
1990 1991 1992 1993 1994 1995 1996 1997 1998 1999
-5%
0%
5%
10%
15%
20%
Energy Industrial Processes Solvents
Agricuture Waste Cumulative % change
Comparison with other EU countries
Carbon dioxide emissions from Energy per inhabitant in the European Union
0
5
10
15
20
25
EU AU BE DK FS FR GE GR IE IT LU NL PT SP SW UK
1990 1995 1997t CO2 / inhabitant
Carbon dioxide emissions from Energy per unit of GDP in the European Union
0,0
0,5
1,0
1,5
EU AU BE DK FR FS GE GR IE IT LU NL PT SP SW UK
1990 1995 1997
kt CO2 / MECU 1990
Energy projections: Basic assumptions• The ENPEP model has been used.• The study covers the period 1995-2020.• It is assumed that the population will increase with an average annual rate of 0.34% during the
period 2000-2020. The average household size is assumed to decrease by approximately 1% for the same time period .
• Regarding GDP, the average annual rate of growth for the period 2000-2005 is estimated to be approximately 4.3%, while this growth rate falls to 3.4% during the years 2005-2010. In the period after 2010 the annual economic expansion growth is projected to be around 3%.
• The following assumptions were adopted for the international fuel prices included in the analysis:– Solid fuel prices will remain at 1997 levels during the study period.– For oil prices the results obtained running the International Futures model for Greece have been used.
According to these results, oil prices will increase slightly during the study period reaching a price of 21.06 $1997/bbl in 2020.
– Natural gas prices will follow the fluctuations of oil prices.
• The current energy taxation system is maintained.• The formulated Business as Usual Scenario takes into account the existing and already decided
relevant policies and measures (e.g. liberalization of the electricity market, agreement between EU and ACEA for reduction of fuel consumption in new cars, etc.)
Energy projections: Baseline gross inland consumption (ktoe)
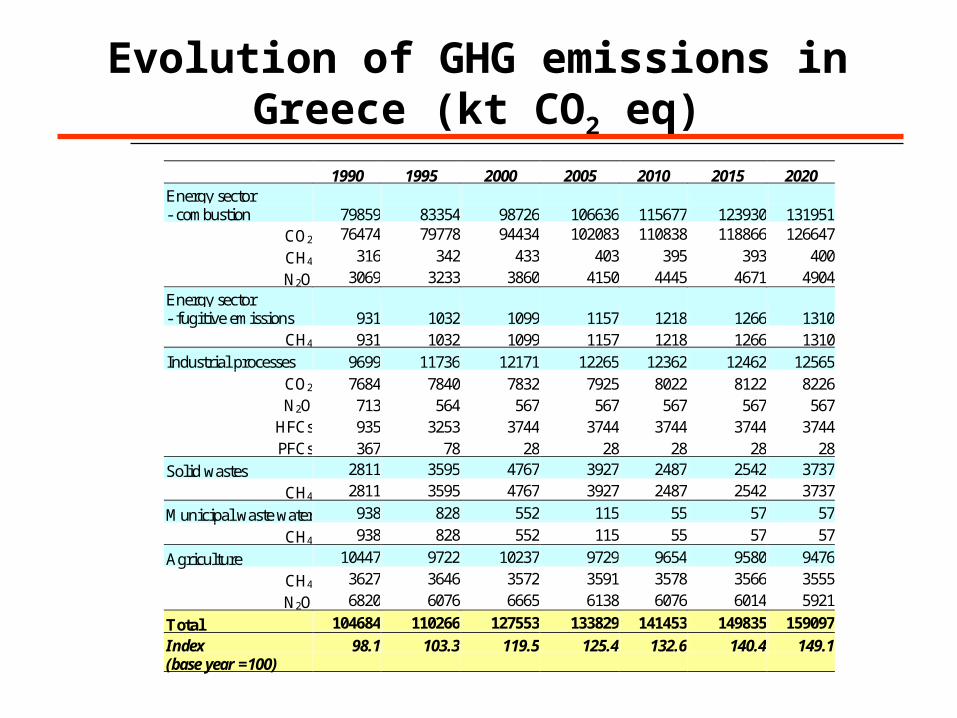
Total 104684 110266 127553 133829 141453 149835 159097
Index (base year =100)
98.1 103.3 119.5 125.4 132.6 140.4 149.1
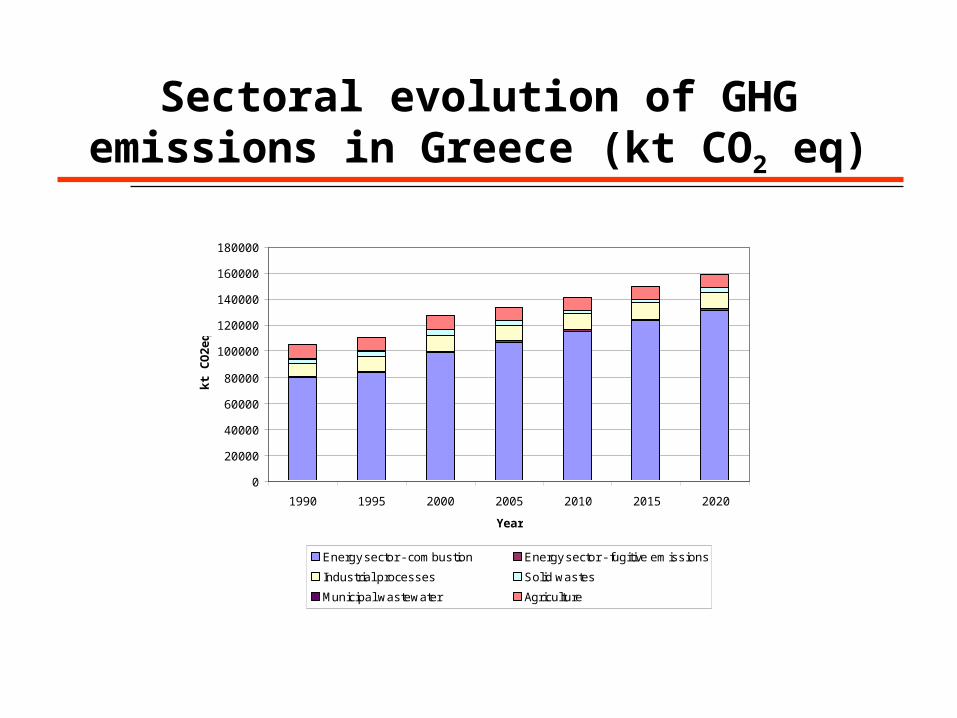
Sectoral evolution of GHG emissions in Greece (kt CO2 eq)
0
20000
40000
60000
80000
100000
120000
140000
160000
180000
1990 1995 2000 2005 2010 2015 2020
Year
kt
CO
2e
q
Energy sector - combustion Energy sector - fugitive emissions
Industrial processes Solid wastes
Municipal wastewater Agriculture
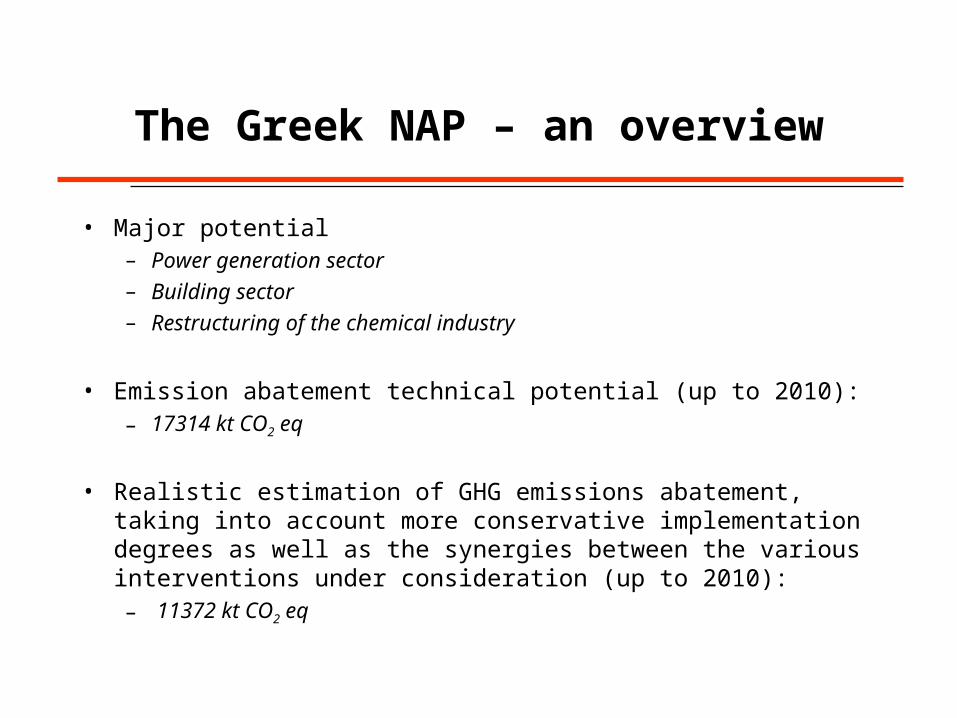
The Greek NAP – an overview
• Major potential– Power generation sector
– Building sector
– Restructuring of the chemical industry
• Emission abatement technical potential (up to 2010):– 17314 kt CO2 eq
• Realistic estimation of GHG emissions abatement, taking into account more conservative implementation degrees as well as the synergies between the various interventions under consideration (up to 2010):– 11372 kt CO2 eq
Building sector
Measure Emissions (kt CO2 eq)
Improvement of the thermal behavior of the buildings 106
Maintenance / replacement of diesel heaters 191
External shading, ventilation, etc. 57
Use of high efficiency equipment (air conditioning, appliances, light bulbs) 1874
Use of automated lighting systems 23
Solar collectors (water heating, space-water heating) 1302
Roof top photovoltaic systems 8
District heating (biomass) 318
Use of NG for space heating and cooling 188
TOTAL 4066
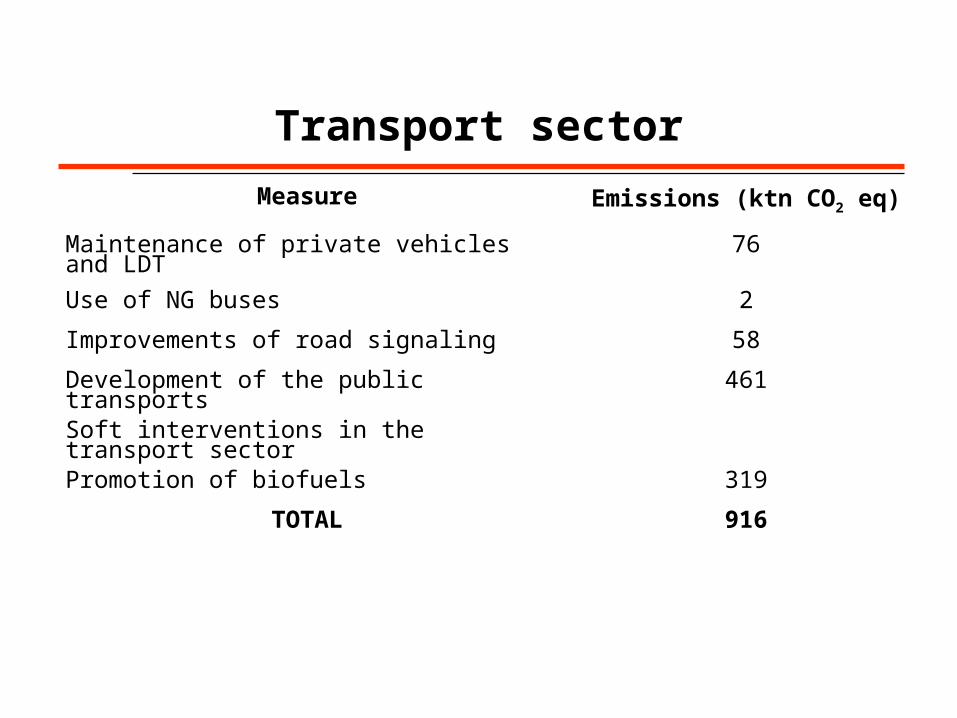
Transport sector
Measure Emissions (ktn CO2 eq)
Maintenance of private vehicles and LDT 76
Use of NG buses 2
Improvements of road signaling 58
Development of the public transports 461
Soft interventions in the transport sector
Promotion of biofuels 319
TOTAL 916
Power generation sector
Measure Emissions (ktn CO2 eq)
Use of RES 4027
• Wind energy 1850
• Small hydro 1033
• Central photovoltaic units 21
• Geothermal energy 50
• Biomass
Use of Natural gas 3350
Cogeneration with Natural Gas 222
TOTAL 7599
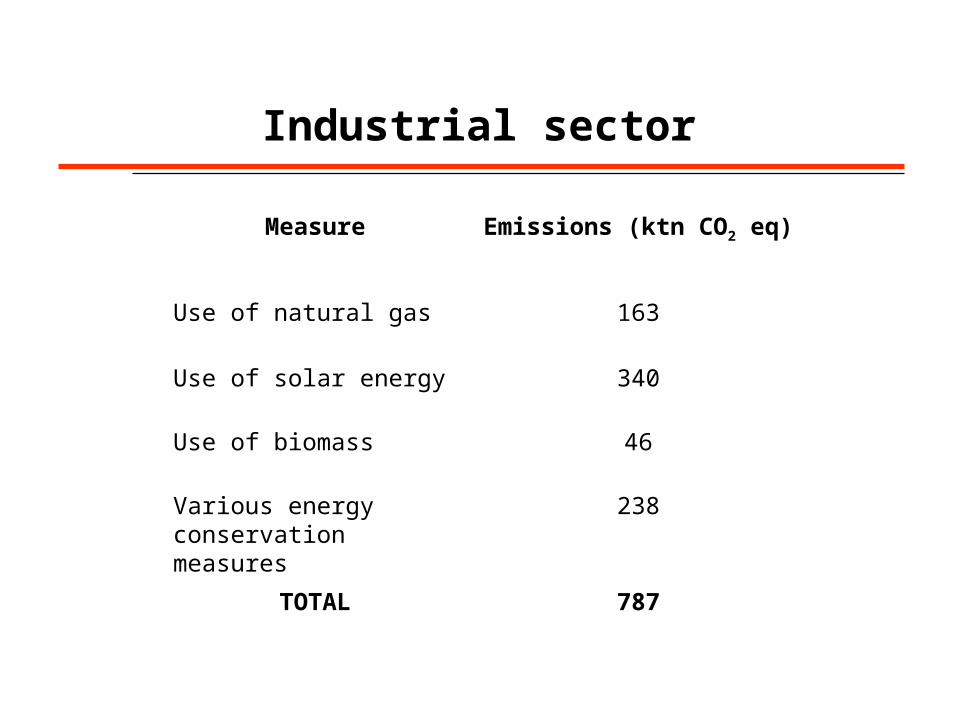
Industrial sector
Measure Emissions (ktn CO2 eq)
Use of natural gas 163
Use of solar energy 340
Use of biomass 46
Various energy conservation measures
238
TOTAL 787
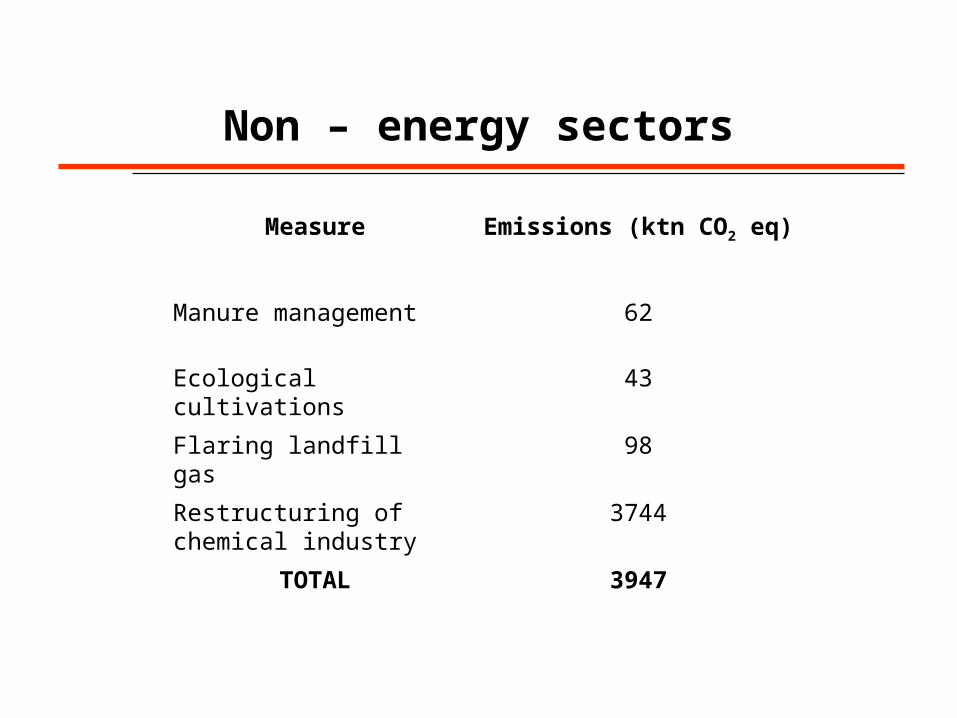
Non – energy sectors
Measure Emissions (ktn CO2 eq)
Manure management 62
Ecological cultivations 43
Flaring landfill gas 98
Restructuring of chemical industry
3744
TOTAL 3947
Evolution of GHG emissions in Greece and the Kyoto Protocol
95
100
105
110
115
120
125
130
135
140
145
1990 1995 2000 2005 2010
Total emissions - BaUTotal emissions - w ith measuresEmissions from the energy sector - BaUEmissions from the energy sector - w ith measuresKyoto target
Criteria for evaluation of measures (1)
GHG and Other Environmental Considerations
• GHG reduction potential (Tons of carbon equivalent)
• Other environmental considerations– Percentage change in emissions of other gases/particulates
– Biodiversity, soil conservation, watershed management, indoor air quality, etc.
Criteria for evaluation of measures (2)
Economic and Social Considerations
• Cost-effectiveness– Average and marginal costs
• Project-level considerations– Capital and operating costs, opportunity costs, incremental costs
• Macro-economic considerations– GDP, jobs created or lost, effects on inflation or interest rates, implications
for long-term development, foreign exchange and trade, other economic benefits or drawbacks
• Equity considerations– Differential impacts on countries, income groups or future generations
Criteria for evaluation of measures (3)
Administrative, Institutional and Political Considerations
• Administrative burden– Institutional capabilities to undertake necessary information collection,
monitoring, enforcement, permitting, etc.
• Political considerations– Capacity to pass through political and bureaucratic processes and sustain
political support
– Consistency with other public policies
• Replicability– Adaptability to different geographical and socio-economic-cultural
settings
Economic evaluation: Building sector
Measure Investment Cost
(million $)
Abatement Cost
$/t CO2 eq R 1 Insulation of buildings in the residential sector 442 126 R 2 Insulation of buildings in the services sector 23 2 R 3 Maintenance of central boiler systems 581 234 R 4 Replacement of old boiler systems 110 13 R 5 External shading, ventilation, etc. 52 -6 R 6 Promotion of high efficiency air-conditioning systems 376 203 R 7 Promotion of high efficiency electric devices 801 158 R 8 Replacement of incadescent light bulbs with low energy
ones 720 15
R 9 Automated lighting systems 4 -78 R10 Solar systems for water heating 1015 -17 R11 Solar systems for space and water heating 84 60 R12 Photovoltaic systems (roof-top) 33 248 R13 District heating with biomass 173 -49 R14 Promotion of natural gas for space heating 112 -124 R15 Promotion of air-conditioning systems fed by natural gas 327 237
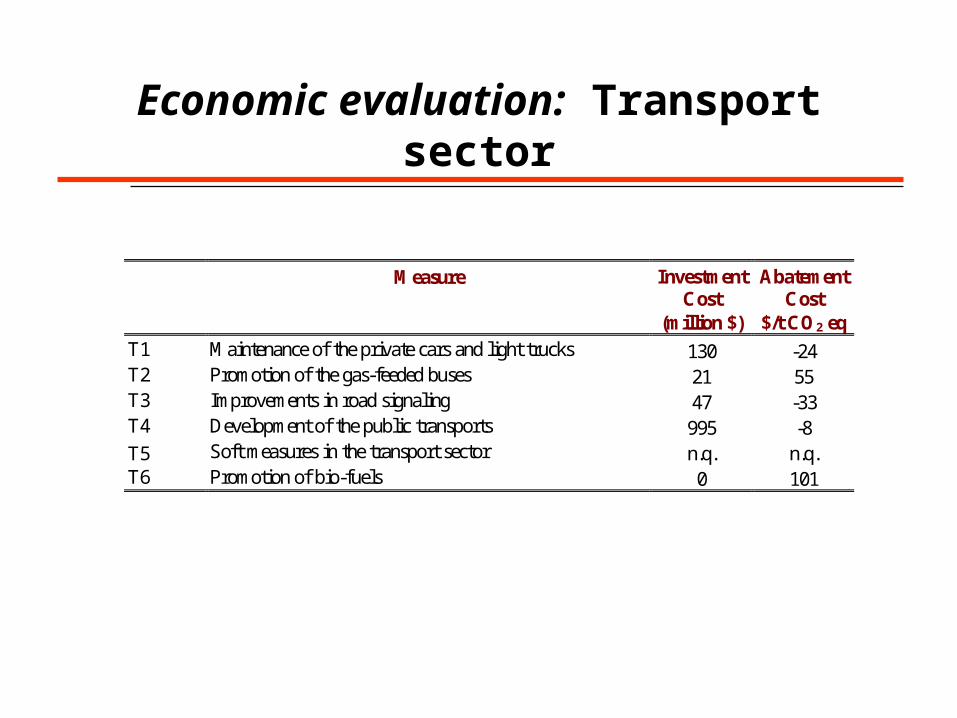
Economic evaluation: Transport sector
Measure Investment Cost
(million $)
Abatement Cost
$/t CO2 eq T1 Maintenance of the private cars and light trucks 130 -24 T2 Promotion of the gas-feeded buses 21 55 T3 Improvements in road signaling 47 -33 T4 Development of the public transports 995 -8 T5 Soft measures in the transport sector n.q. n.q. T6 Promotion of bio-fuels 0 101
Economic evaluation: Industrial sector
Measure Investment Cost
(million $)
Abatement Cost
$/t CO2 eq I1 Promotion of natural gas in thermal uses 55 -9 I2 Promotion of solar energy 1141 146 I3 Promotion of biomass in thermal uses 23 -29 I4 Various energy conservation measures 21 -54
Economic evaluation: Power generation sector
Measure Investment Cost
(million $)
Abatement Cost
$/t CO2 eq E1.1 Wind energy 640 3 E1.2 Small hydroelectric power plants 350 1 E1.3 Central photovoltaic units 45 154 E1.4 High enthalpy geothermal energy 25 17 E1.5 Biomass power plants 400 58 E2 Operation of the gas power plants as base load units 0 24 E3 Co-generation units 43 -22
Economic evaluation: Non-energy sectors
Measure Investment Cost
(million $)
Abatement Cost
$/t CO2 eq
A1 Manure management 1 11 A2 Ecological cultivations n.q. n.q. W1 Flaring landfill gas 3 24 CH1 Restructuring of chemical industry n.q. n.q.
Policy measures
• Energy or carbon taxes and subsidies
• Tradable permit systems
• Standards (e.g. energy efficiency standards)
• Law 2244/94 - promotion of RES
• Energy efficiency standards and energy labeling
• Operational program of Energy
Operational Program for Development (1)
• Support for the investments in cogeneration, RES and energy conservation– Dissemination of information actions
– Infrastructure development
– Financial incentives for private energy investments
– Special support status • Voluntary agreements
• Third Party Financing
Total budget foreseen: 1071 million Euros
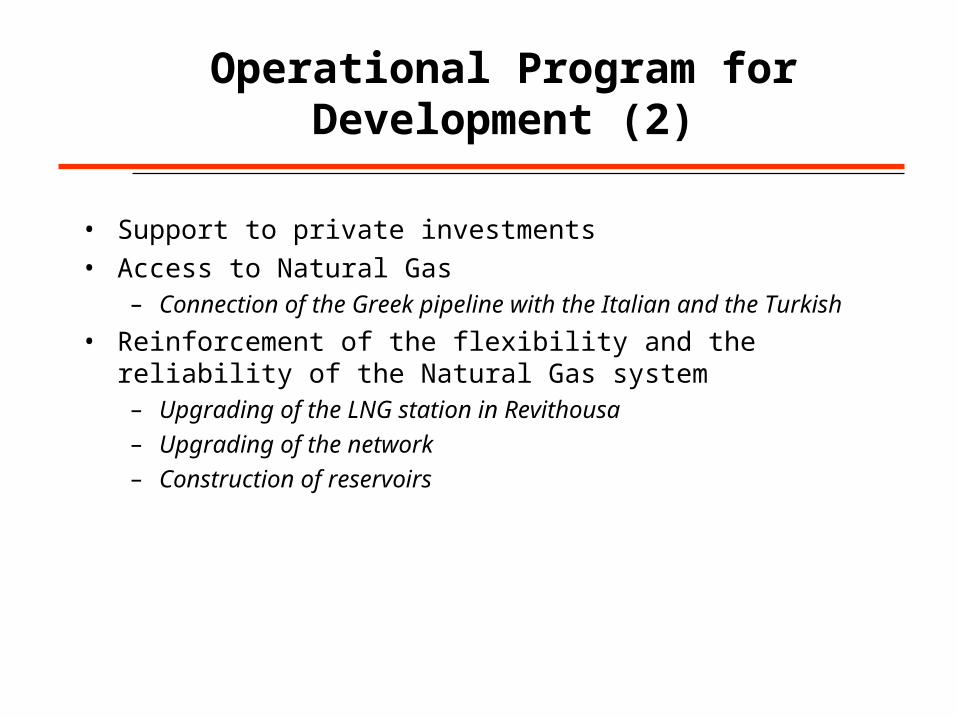
Operational Program for Development (2)
• Support to private investments
• Access to Natural Gas – Connection of the Greek pipeline with the Italian and the Turkish
• Reinforcement of the flexibility and the reliability of the Natural Gas system – Upgrading of the LNG station in Revithousa
– Upgrading of the network
– Construction of reservoirs
Operational Program for Development (3)
• Development of energy infrastructure for RES and small islands
• Operation of the free energy market
• Penetration of NG in the households, the tertiary sector, new industrial consumers and transport
Law for the development (2601/98)
• Subsidies for investments and programs in the field of electricity production by RES by electricity production industries and other types of enterprises
• Support to investments of RES exploitation and energy conservation
First National Plan – Emissions evolution
Target (2000) “Limit the increase of emission to +15% ± 3% compared to 1990”
EstimatedPotential (1994)
Realistic potential(1994)
[ kt CO2] [ % ] [ kt CO2] [ kt CO2]
Natural Gas Penetration 6,012 74% 4,455 3,937Electricity Production 4,200 3,113 3,191Industry 720 533 590Domestic – Tertiary Sector 1,092 809 154Transport 0 0 2IMPROVEMENTS IN POWER PLANTS 370 100% 370 226
RENEWABLE ENERGY SOURCES 3,267 70% 2,287 2,622Wind Energy 1,000 700 775Small Hydro 221 155 273Solar Energy 976 683 928
Conventional Systems 939 657 925New Technologies 37 26 3
Geothermal Energy60 42 14
Biomass910 637 632
District Heating60
42 81Electricity Production
750525 508
Biofuels100
70 0Wastes 0 43
Research and Development 100 70 n.a.INDUSTRY 1,368 67% 912 28 +Cogeneration 80 53 15 +Improvements on auxiliary processes 430 287 13 +Interventions in energy intensive sectors 808 539 n.a.Environmental – Energy Audits 50 33 0DOMESTIC – TERTIARY SECTOR 1,103 67% 735 ? (440 +)Lighting 470 313 +Cogeneration 51 34 +Central Heating 343 229 n.a.Street Lighting 239 159 +TRANSPORT 1,263 67% 841 ?Fuel related measures 56 37 Vehicle related measures 300 200 n.a.Transportation Management 470 313 n.a.Public Transport 437 291 n.a.TOTAL 13,383 9,600 6,813 +440= 7,253