IPOs in Greece – The greek Experience IPOs in Greece – The greek Experience CONTENTS PART I - General Info for listing procedures & markets PART II - Legislation and procedures of an IPO PART III - Index of contents of the Prospectus PART IV - Statistics PART V - Case Study – Piraeus Port Organisation
Transcript
IPOs in Greece – The greek ExperienceIPOs in Greece – The greek Experience
CONTENTS
PART I - General Info for listing procedures & markets
PART II - Legislation and procedures of an IPO
PART III - Index of contents of the Prospectus
PART IV - Statistics
PART V - Case Study – Piraeus Port Organisation
PART IPART I
GENERAL INFO FOR GENERAL INFO FOR LISTING PROCEDURES LISTING PROCEDURES
& MARKETS& MARKETS
Part I - General info for listing procedures and marketPart I - General info for listing procedures and market
ATHENS STOCK EXCHANGE is structured in three markets:
1. Main Market• large and middle cap companies
2. Parallel Market• small cap companies
3. New Market• dynamic and Innovative companies
4. Greek Market for Emerging Capital Markets (EAGAK)• Companies from Emerging Markets
Part I - General info for listing procedures and marketPart I - General info for listing procedures and market
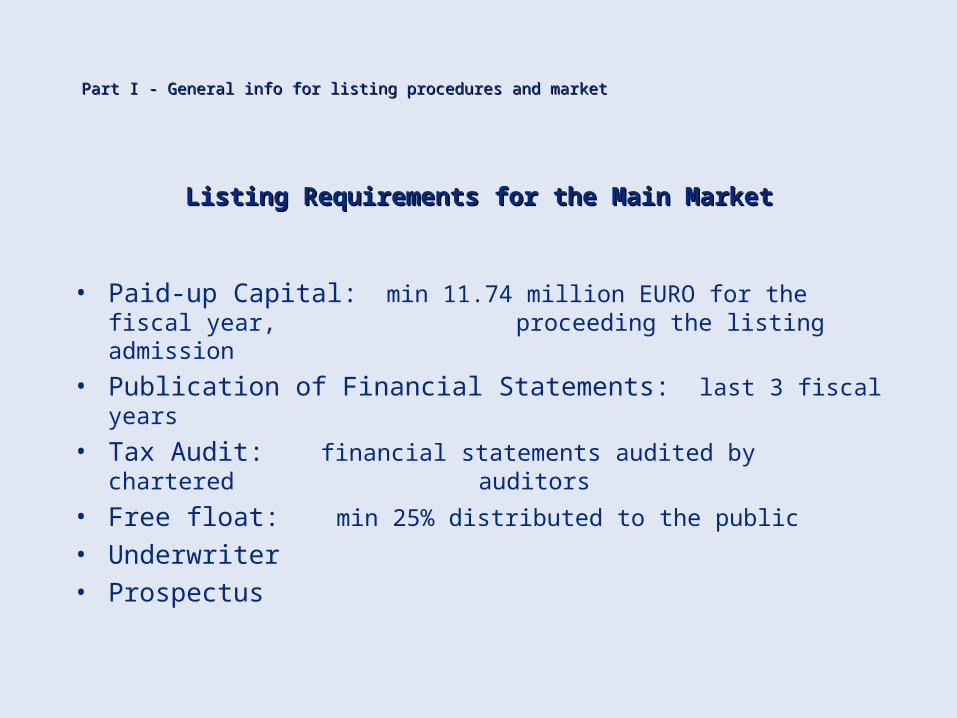
Listing Requirements for the Main MarketListing Requirements for the Main Market
• Paid-up Capital: min 11.74 million EURO for the fiscal year, proceeding the listing admission
• Publication of Financial Statements: last 3 fiscal years
• Tax Audit: financial statements audited by chartered auditors
• Free float: min 25% distributed to the public
• Underwriter• Prospectus
Part I - General info for listing procedures and marketPart I - General info for listing procedures and market
Listing Requirements for the Parallel MarketListing Requirements for the Parallel Market
• Paid-up Capital: min 2.935 million EURO for the fiscal year, proceeding the listing admission
• Publication of Financial Statements: last 2 fiscal years
• Tax Audit: financial statements audited by chartered auditors
• Free float: min 20% distributed to the public
• Underwriter• Prospectus
Part I - General info for listing procedures and marketPart I - General info for listing procedures and market
Listing Requirements for the New Market (NE.X.A)Listing Requirements for the New Market (NE.X.A)
• Paid-up Capital: min 0.59 million EURO for the fiscal year, proceeding the listing admission
• Publication of Financial Statements: last 2 fiscal years
• Tax Audit: financial statements audited by chartered auditors
• Free float: min 20% distributed to the public blocking of shares : 80% in first year of listing 50% in the second and third year of listing min 100,000 shares of value of at least 0.734 mil EURO
• Underwriter• Prospectus
PART IIPART II
LEGISLATION AND LEGISLATION AND PROCEDURES OF AN IPOPROCEDURES OF AN IPO
• Stage 1
• Stage 2
• Stage 3
approval of the Prospectus before the initial trading to the Stock Exchange approval of the admission of the company’s shares to the Stock Exchange approval of the company’s shares trading on Stock Exchange
Part II - Legislation and procedures of an IPOPart II - Legislation and procedures of an IPO
According to the Greek legislation, there are three stages for a company in order to go public:
Stage 1Stage 1 Approval of the Prospectus before the Approval of the Prospectus before the initial trading to the Stock Exchange initial trading to the Stock Exchange
Part II - Legislation and procedures of an IPOPart II - Legislation and procedures of an IPO
•The main Underwriter provides the necessary documentation to the Stock Market Authorities. •The Stock Market Authorities examine the documentation with a view to checking the fulfillment of the requirements and approve the prospectus. •The Stock Market Authorities inform the Capital Market Commission about the approval of the prospectus. •The company that goes public and the main Underwriter inform the Stock Market Authorities about the period of implementation of the IPO.
Part II - Legislation and procedures of an IPOPart II - Legislation and procedures of an IPO
IPO Documentations Informing (Prospectus’s approval) (Prospectus’ approval) Informing (period of implementation of IPO) Brokerage Agreement
UNDERWRITER
STOCK MARKET
AUTHORITIES
CAPITAL MARKET
COMMISSION
COMPANY (ISSUER)
Stage 2Stage 2 Approval of the admission of the Company’s Approval of the admission of the Company’s shares to the Stock Exchangeshares to the Stock Exchange
Part II - Legislation and procedures of an IPOPart II - Legislation and procedures of an IPO
•The main Underwriter provides the necessary documentation to the Stock Market Authorities. •The Stock Market Authorities examine the documentation with a view to checking the fulfillment of the requirements and approve the admission of the Company’s shares to the market.
Part II - Legislation and procedures of an IPOPart II - Legislation and procedures of an IPO
Stage 3Stage 3 Approval of the company’s shares trading Approval of the company’s shares trading on Stock Exchangeon Stock Exchange
Part II - Legislation and procedures of an IPOPart II - Legislation and procedures of an IPO
•The main Underwriter provides the necessary documentation to the Stock Market Authorities. •The Stock Market Authorities examine the documentation with a view to checking the fulfillment of the requirements and approve the trading of the Company’s shares to the market.
Part II - Legislation and procedures of an IPOPart II - Legislation and procedures of an IPO
SSTTAAGGEE 33 –– II NNTTII TTII AALL SSTTOOCCKK TTRRAADDII NNGG
Part II - Legislation and procedures of an IPOPart II - Legislation and procedures of an IPO
TIMETABLE OF THE IPO STAGES
STA
GE 1
5 d
ays
Submission of the necessary IPO documents to the Stock Market Authorities (approval of the Prospectus)
End of the period in which the IPO can be implemented
STA
GE 2
No fi
xed t
ime
Submission of the necessary listing documents to the Stock Market Authorities
Approval of the company’s shares to the Stock Exchange
STA
GE 3
15
days
Submission of the necessary trading documents to the Stock Market Authorities
Approval of the company’s shares trading to the Stock Exchange. Inititiation of trading
PART IIIPART III
INDEX OF CONTENTS OF INDEX OF CONTENTS OF THE PROSPECTUSTHE PROSPECTUS
Summary data of the issueSummary data of the issue
Part III - Index of contents of the ProspectusPart III - Index of contents of the Prospectus
• the number and the type (common, preference, etc.), of shares before the issue
• the total number of shares before the issue • the number and the type of the new shares • the total number of shares after the issue • the book value of the share • the disposal price of the share • the total income of the issue • the total income of the issue
Part III - Index of contents of the ProspectusPart III - Index of contents of the Prospectus
• financial data of the company of the past 3 or 5 years
• information about:
if there has been any change at the amortization method or the method of evaluation of stock and other assets
if there has been any account entries which are mentioned by the Chartered Accountants and are affecting the operating results
1.1. Information about the compilation of the Information about the compilation of the Prospectus and the company’s auditorsProspectus and the company’s auditors
Part III - Index of contents of the ProspectusPart III - Index of contents of the Prospectus
• names and addresses of the responsible persons for the compilation of the Prospectus from the company and the underwriter of the issue
• information about:
the regular and the unscheduled financial chartered auditors the legal auditors the tax assessors
• conjunctions of the company’s auditors
2.2. Share-Capital Increase and the procedure of Share-Capital Increase and the procedure of disposal of the new sharesdisposal of the new shares
Part III - Index of contents of the ProspectusPart III - Index of contents of the Prospectus
• general
• procedure of disposal of the new shares
• underwriters - cost of the issue
• destination of the new capital
3.3. Share-Holders Rights Share-Holders Rights
Part III - Index of contents of the ProspectusPart III - Index of contents of the Prospectus
• general
• taxation of the dividends
4.4. Information about the Company (the issuer)Information about the Company (the issuer)
Part III - Index of contents of the ProspectusPart III - Index of contents of the Prospectus
• general information • historical records • description of the company’s business activity • production of certain goods - production process • sales network and distribution network • property assets - guarantees and real securities • development of the capital stock • equity capital - book value of a share • Management - Administration Department
Part III - Index of contents of the ProspectusPart III - Index of contents of the Prospectus
• participation of management and main shareholders at the Board of Directors of other companies
• organizational chart • personnel • investments in last 5 years • shareholders • equity capital - book value of a share
5.5. Data of the business sector of activity Data of the business sector of activity
Part III - Index of contents of the ProspectusPart III - Index of contents of the Prospectus
• general data of the business sector of activity
• competition - prospects of the market
• the company’s position in the sector
6.6. Financial Statements of the company’s activity Financial Statements of the company’s activity
Part III - Index of contents of the ProspectusPart III - Index of contents of the Prospectus
• the company’s activity • business development - operating results • financial costs • distribution of profits before depreciation • financial status analysis - long term liabilities
to banks to suppliers
• sources and uses of capital • cash flow
7.7. Associated companiesAssociated companies
Part III - Index of contents of the ProspectusPart III - Index of contents of the Prospectus
• associated companies
subsidiaries (more than 50% of ownership) affiliated companies (10-50% of ownership) companies with law participation (under 10% of ownership) companies which have common Management or common
Board of Directors with the issuing company
• companies which participate in the issuing company • companies in which the main shareholders or members of the
Board of Directors of the issuing company participate • subsidiaries of subsidiaries and affiliated companies • interfirm trades and transactions
2. Greece request lock of Exchange Rate Mechanism (EURO) – 3.03.20003. Morgan Stanley Capital International classified MSCI Greece Index as a developed market index – 31.05.2001
Part IV - StatisticsPart IV - Statistics
Evolution of number of Listed Companies Evolution of number of Listed Companies (1992-2002)(1992-2002)
Inflation Stock Market General index (annual variation) Total capital drawn - values adjusted to inflation
`
PART VPART V
CASE STUDY CASE STUDY
PIRAEUS PORT ORGANIZATIONPIRAEUS PORT ORGANIZATION
We present the case of ‘Piraeus Port Organisation’, the last company that entered the Greek Capital Market. The key figures of the IPO are the following:
Existing Shares 25,000,000
New shares 6,375,000
Face Value 2 EURO
Margin 7.70 – 8.80 EURO
Period 23-25/06.2003
Part IV – Case Study – Piraeus Port OrganizationPart IV – Case Study – Piraeus Port Organization
Main Underwriters EFG Eurobank ErgasiasAgricultural Bank of Greece
5/2/2002 Decision of the Board of Directors that the company shall go public
July 2003 Approval and Distribution of the IPO Prospectus
25/7 to 27/7/2003 Registration Period
30/7 to 1/8/2003 Distribution of shares to shareholders
8/8/2003 First Trading Day
Part IV – Case Study – Piraeus Port OrganizationPart IV – Case Study – Piraeus Port Organization
The company we present enters the Capital Market in order to raise funds for implementing the investment plan. The plan involves investment such as the construction of 2 new piers, which shall increase the cargo transportation, the purchase of 46 vehicles and the preparation of the port.
The evolution of the share price the first 5 days are the following:
OLP -FIRST 5 TRADING DAYS
11
11.2
11.4
11.6
11.8
12
12.2
12.4
12.6
12.8
1st day 2nd day 3rd day 4th day 5th day
LISTING DAYS
Part IV – Case Study – Piraeus Port OrganizationPart IV – Case Study – Piraeus Port Organization